
Rapid and Sensitive Point of Care Detection of MRSA Genomic DNA by Nanoelectrokinetic Sensors


1
Department of Electrical Engineering and Computer Science, The University of Tennessee, Knoxville, TN 37996, USA
2
Department of Public Health, The University of Tennessee, Knoxville, TN 37996, USA
*
Author to whom correspondence should be addressed.
Chemosensors 2021, 9(5), 97; https://0-doi-org.brum.beds.ac.uk/10.3390/chemosensors9050097
Submission received: 27 March 2021
/
Revised: 26 April 2021
/
Accepted: 27 April 2021
/
Published: 29 April 2021
(This article belongs to the Section (Bio)chemical Sensing)
Abstract
:Biosensors have shown great potential in realizing rapid, low cost, and portable on-site detection for diseases. This work reports the development of a new bioelectronic sensor called AC electrokinetics-based capacitive (ABC) biosensor, for the detection of genomic DNA (gDNA) of methicillin-resistant Staphylococcus aureus (MRSA). The ABC sensor is based on interdigitated microelectrodes biofunctionalized with oligonucleotide probes. It uses a special AC signal for direct capacitive monitoring of topological change on nanostructured sensor surface, which simultaneously induces dielectrophoretic enrichment of target gDNAs. As a result, rapid and specific detection of gDNA/probe hybridization can be realized with high sensitivity. It requires no signal amplification such as labeling, hybridization chain reaction, or nucleic acid sequence-based amplification. This method involves only simple sample preparation. After optimization of nanostructured sensor surface and signal processing, the ABC sensor demonstrated fast turnaround of results (~10 s detection), excellent sensitivity (a detection limit of 4.7 DNA copies/µL MRSA gDNA), and high specificity, suitable for point of care diagnosis. As a bioelectronic sensor, the developed ABC sensors can be easily adapted for detections of other infectious agents.
1. Introduction
Currently, on-site detection of infectious pathogens has unmet needs of finding a rapid, sensitive, specific, and easy-to-do sensing method. Among infectious pathogens, antimicrobial resistance (AMR) is quickly becoming a global threat, which could make infections difficult to treat. Identification of AMR pathogens is essential to finding proper clinical intervention and reducing the spread of AMR. Staphylococcus aureus (S. aureus) is a major pathogen responsible for a variety of infectious diseases, and methicillin-resistant S. aureus (MRSA) is the most common cause of both hospital and community-acquired bloodstream infections. Currently, there are no economic and rapid strategies available to screen for MRSA infections. To further compound the problem, the number of samples for MRSA screening has increased dramatically over the past several years.
Existing approaches to detect specific pathogens include culturing methods and molecular diagnostic tests. Culture methods involve the growth of microorganisms on plates with predetermined culture medium under controlled conditions that allow the specific bacteria to multiply and form colonies for enumeration. Although it offers high sensitivity, detection of MRSA by microbial culture takes days to get results. Molecular diagnostics, such as DNA microarrays and polymerase-chain-reaction (PCR)-based methods, detect target-specific nucleic acid sequences from microorganisms of interest. These methods require trained personnel and sophisticated laboratory equipment. For point of care (POC) diagnosis, it is difficult to complete the complicated steps on site, such as labeling of the DNA samples, multiple washing, and specific hybridization steps. Without a rapid and field-deployable diagnostic method, it will possibly lead to delayed treatment and/or potentially inappropriate antibiotic treatment.
Recent years have witnessed great technological advances in biosensors and microfluidics, which together have contributed to the rapid growth of POC technologies. DNA biosensors are usually based on nucleic acid hybridization processes occurring on the sensor surface. It consists of a molecular probe immobilized on the sensor surface, which typically is a short DNA sequence that detects the target genetic section, enabling specific biomolecular interaction [1]. In a DNA biosensor, the probe most frequently consists of approximately 15 to 50 oligonucleotides [2]. The sensor is a transducer that converts the interaction of the probe with the specific genetic sequence in the genome of pathogen into a measurable signal [3]. Successful recognition of a specific sequence of DNA requires a highly selective and specific probe layer. Subsequent application of a sample to the DNA sensor will result in hybridization (probe-target binding) if the target gene exists, whereupon a signal transduction can occur. Based on the transduction mechanisms, main types of DNA biosensors include optical biosensors and electrical biosensors. Electrical DNA sensors offer many advantages such as multiplexed detection, cost reduction, and compact instrumentation [4]. The electrical biosensors, based on the parameter measured, can be further classified as potentiometric, amperometric, and impedimetric sensors. Many electrical DNA sensors have been reported recently [5,6,7,8]. To sum up state-of-the-art, Table 1 presents the figures-of-merit for the previously reported electrical DNA sensors.
Here, we report a DNA sensor based on the measurement of sensor capacitance. With the inclusion of phase information in capacitive sensing, it is expected to increase the sensitivity and specificity of a sensor. So far, not many capacitive biosensors have been developed for DNA/RNA classification and pathogen detection. In 1999, a label-free capacitive detection method for DNA detection was reported by Berggren et al. with a limit of detection of 25 copies/µL containing single-stranded fragments of cytomegalovirus [9]. Moreno-Hagelsieb et al. demonstrated the use of an Al/Al2O3 electrode to detect as low as 50 ng/mL of 150 base pairs (bps) long biotinylated HIV DNA sequence [5]. In 2016, Rashid et al. developed a dengue virus serotype 3 biosensors based on direct electrochemical detection. It was able to detect 3.09 nM of target nucleic acid sequence using electrodes functionalized with a DNA probe [10]. Despite much research effort spent on nuclei acid biosensor development [6,7], significant challenges remain. A number of studies reported poor sensor-to-sensor reproducibility. In addition, these approaches require complicated sensor operation such as labeling of the genomic material samples, as well involve multiple washing and hybridization steps [5,8,11,12], not very practical to serve for POC use.
To further compound the problems, most reported sensors were developed to work with short DNA sequences of no more than several hundreds of bps such as those above, rather than working with whole genomic DNAs (gDNAs) of millions of bps from clinical samples. The detection outcomes of those sensors are usually unoptimistic when dealing with larger DNA or unpurified gDNA samples before enzyme digestion or PCR amplification. There exist several challenges for direct analysis of gDNAs with complex secondary structures and great molecular weights and lengths. Firstly, hybridization with the target sequence in gDNA is difficult owing to its complicated, possibly tangled, conformation. Secondly, it is difficult for gDNA to approach the probes, which is partially due to its electrical charges, and further worsened by transport limited reaction inherent to gDNA’s large molecular size. Lastly, the extracted genome samples usually contain non-specific DNA fragments, which diffuse more readily than larger gDNAs and will lead to higher background noise due to non-specific surface adsorption. Therefore, while testing whole gDNAs is a more feasible strategy for POC, it is also more challenging to perform. Direct detection of bacterial gDNA, such as the one reported here with 2.8 Mbps, has not yet been reported.
To overcome these difficulties, we have developed an AC electrokinetics (ACEK)-based capacitive (ABC) sensing method to specifically detect bacterial DNA genome for the first time in a POC setting. ACEK is a type of nanofluidic phenomena taking place under AC electrical fields, which can lead to directed movement of nano-particles such as biomolecules including DNAs towards electrodes, hence increasing detection speed and signal [11,12,13]. ACEK effects are induced when applying an AC electric field over interdigitated electrode (IDE) sensors in biofluids. In 2013, Cui et al. [14] reported an ACEK-enhanced capacitive immunosensor employing aluminum IDEs modified with a suitable mycobacteria antigen for POC serodiagnosis of infectious diseases. Here, this work reports an approach for sensitive and selective detection of gDNAs that will be highly valuable in controlling and preventing disease outbreaks. Previously, our work has shown that dielectrophoresis (DEP) and other ACEK effects help to accelerate the binding process by increasing the diffusion of the target analytes onto the sensing surface [15,16,17]. Moreover, the ABC sensing method has been reported to demonstrate a very promising performance for real-time and sensitive detection of other nuclei acids [18,19]. This technology also boasts of a low-cost implementation. Its microelectrode sensors are built on printed circuit boards (PCBs) (~$1), making sensors low cost and disposable. Unlike our previous works, which relied on sophisticated, expensive desktop-based impedance measurement instruments [20], a low-cost capacitance readout system has been developed, using a microcontroller and integrated circuits, with a total cost of less than $200. Due to the reduced cost, good accessibility, high sensitivity, and short diagnosis time, the proposed sensor is ready for large-scale POC use, especially in third world countries.
2. Materials and Methods
2.1. Capacitive Sensing of Sensor Surface Nano-Topology
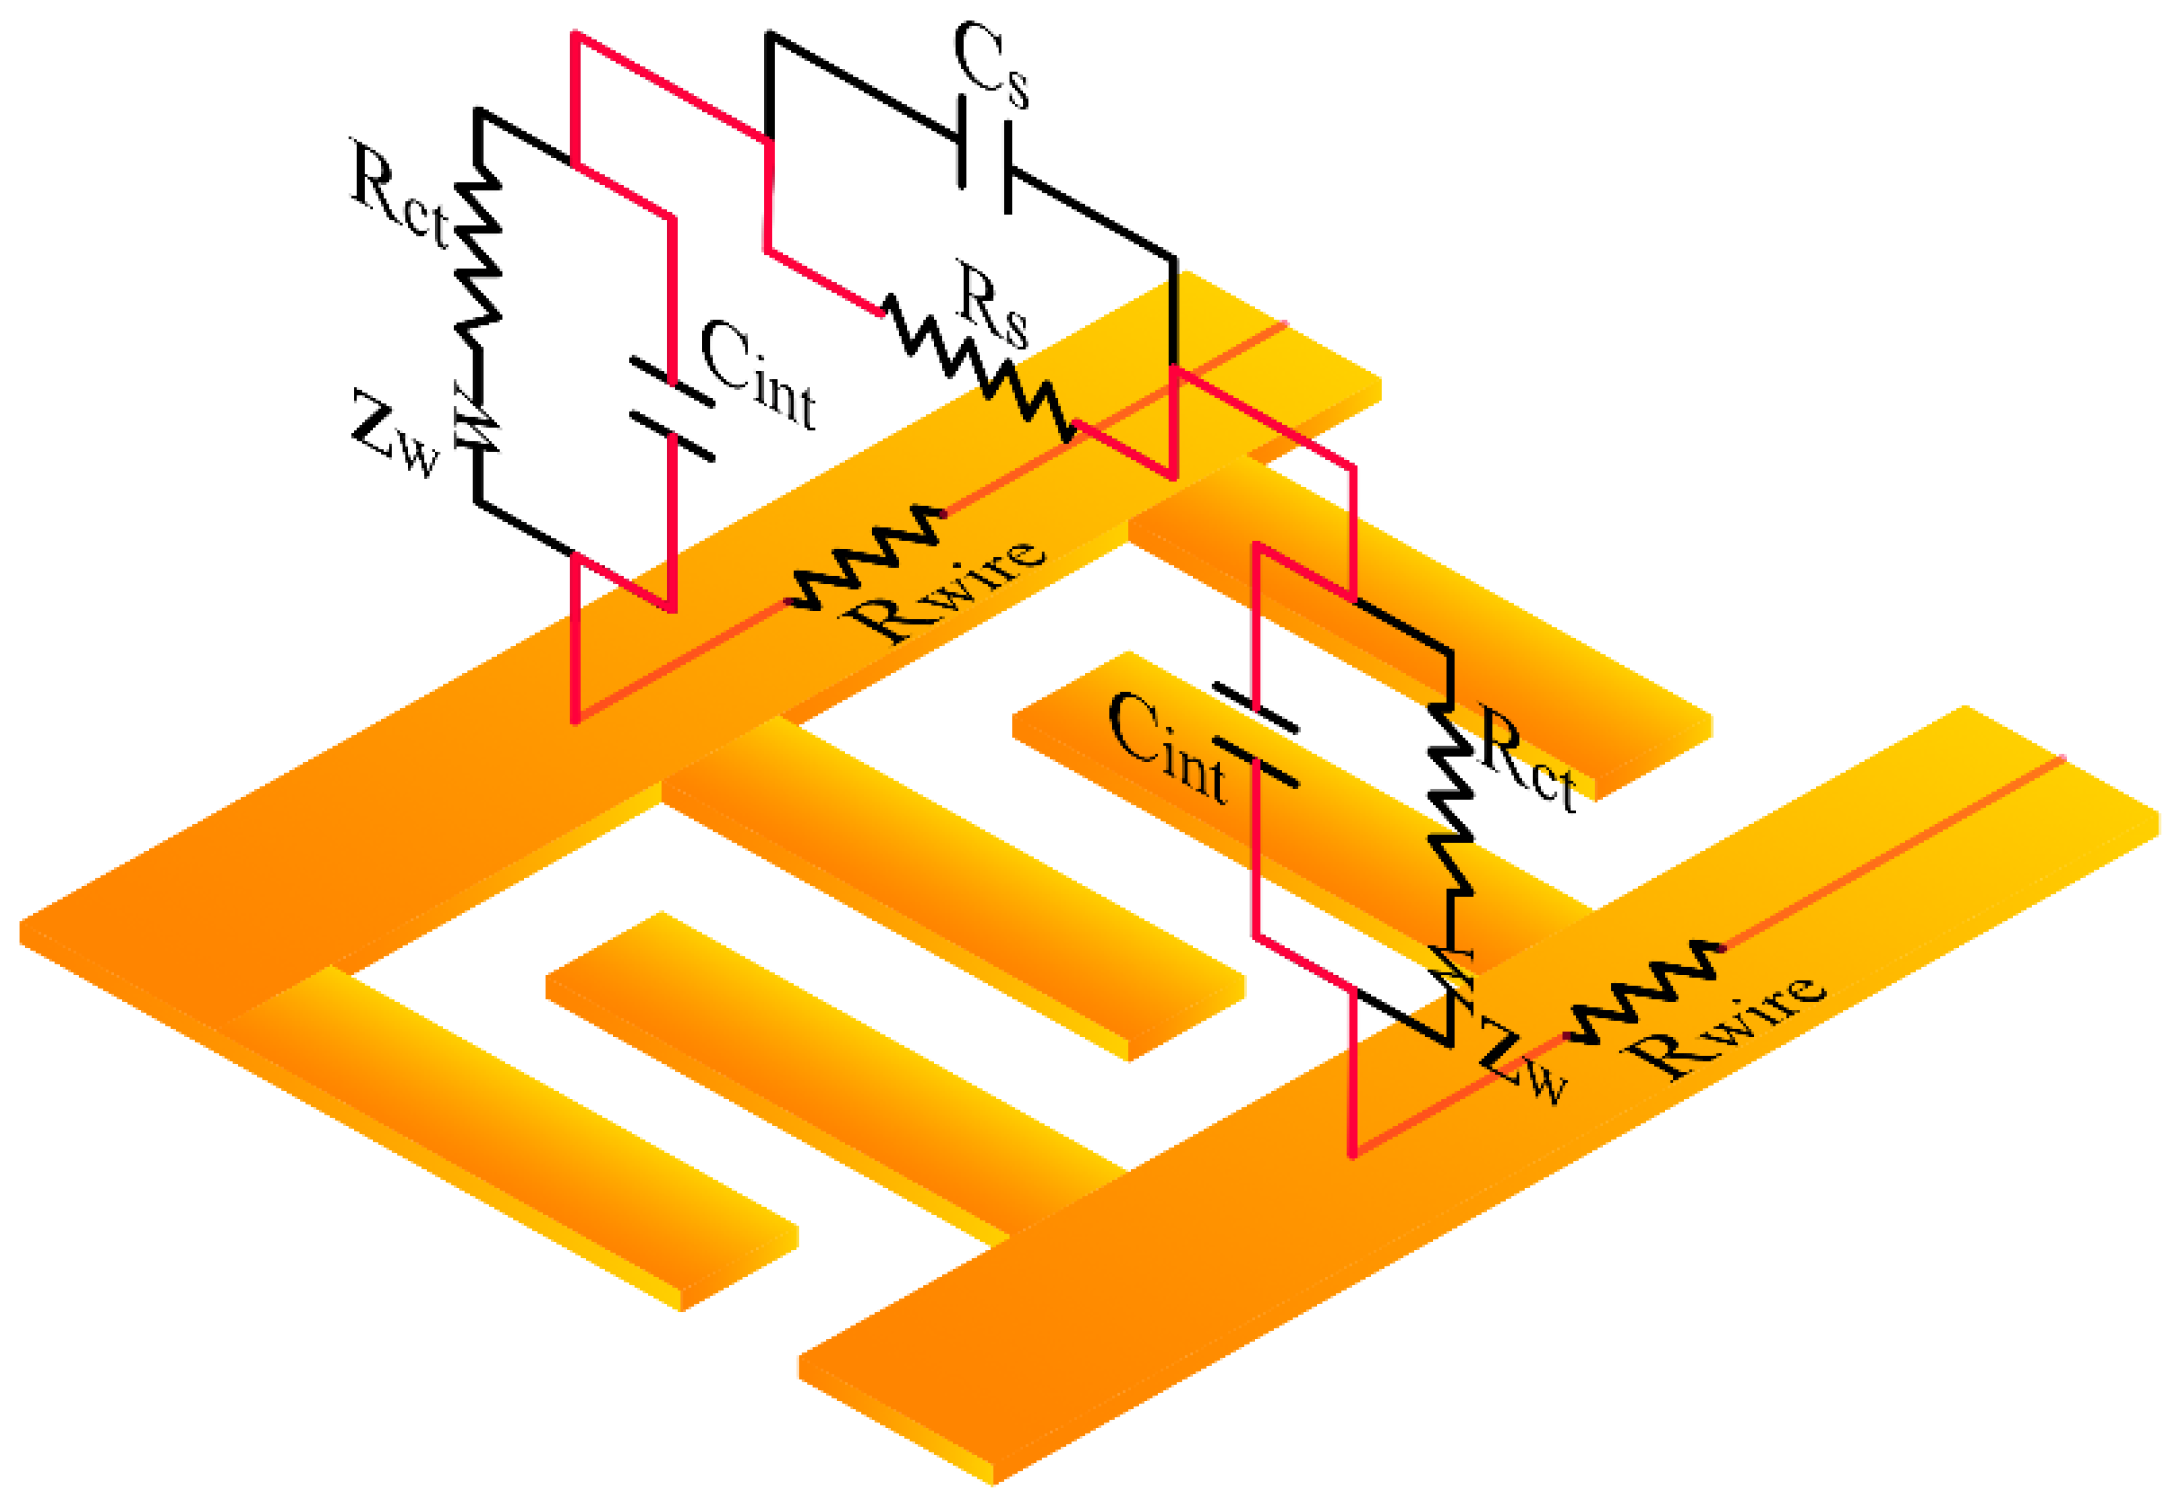
In this work, disposable IDEs have been adopted as the capacitive sensor. When immersed into an electrolyte, the IDE cell can be electrically modeled by an equivalent circuit as shown in Figure 1 [21,22,23,24]. The circuit is made up of three parts, the electrode’s self-resistance (Rwire), interfacial impedances including the interfacial capacitance (Cint) in parallel to the charge transfer resistance (Rct) and Warburg impedance (Zw), and solution impedance including bulk resistance (Rs) and solution capacitance (Cs) [14]. At the electrolyte/electrode interface, the charge carriers change from ions in electrolytes to electrons in metals. This charge transfer process is often accompanied by electrochemical reactions. If electrochemical reactions are to be avoided, electrical charge transfer through the interface needs to be capacitive in nature, which is represented by Cint [25]. Cint is composed of the electric double layer capacitance and the capacitance caused by biomolecules deposition, which carries the information of specific binding occurring at the sensor surfaces. The charge transfer through the fluid bulk can be done in both resistive and capacitive manners. Cs is based on the dielectric properties of the sample fluid. Un-bounded biomolecules such as non-targets within the solution will cause a change in Cs. Based on the above analysis, Cint is useful for extracting the information of specific binding at the electrode surface, while Cs is strongly affected by sample properties and interferences. Cs, known as the parasitic capacitance, does not contribute positively to the detection and should be minimized from the sensor response if possible. To do so, we capitalize on the fact that non-resistive components such as Cint and Cs in the circuit pose frequency-dependent impedance. As electrical current takes the path of the least resistance, there exists a frequency range over which the electrical current will predominately go through Rwire, Cint, and Rs (as shown by red lines in Figure 1), since other electrical components pose much larger impedance and their roles in electrical conduction can be neglected. As a result, in this frequency range, the sensor impedance can be simplified as a serial connection of Rs and Cint. By reading the capacitive signal only, the interfacial changes can be extracted directly.
The capacitive biosensors principle can be explained by electrically modeling the interface as a parallel plate capacitor, which consists of two conductive plates separated by a dielectric layer. In this situation, the dielectric layer is made up of the electrical double layer (EDL) and immobilized molecules on the electrode surface. The metal electrode is one plate, while the outer boundary of the EDL forms the other plate of the capacitor. According to Equation (1):
where is the permittivity of the medium between the plates, A is the plate’s surface area, and is the thickness of the dielectric layer. Thus, the capacitance is proportional to the surface area.
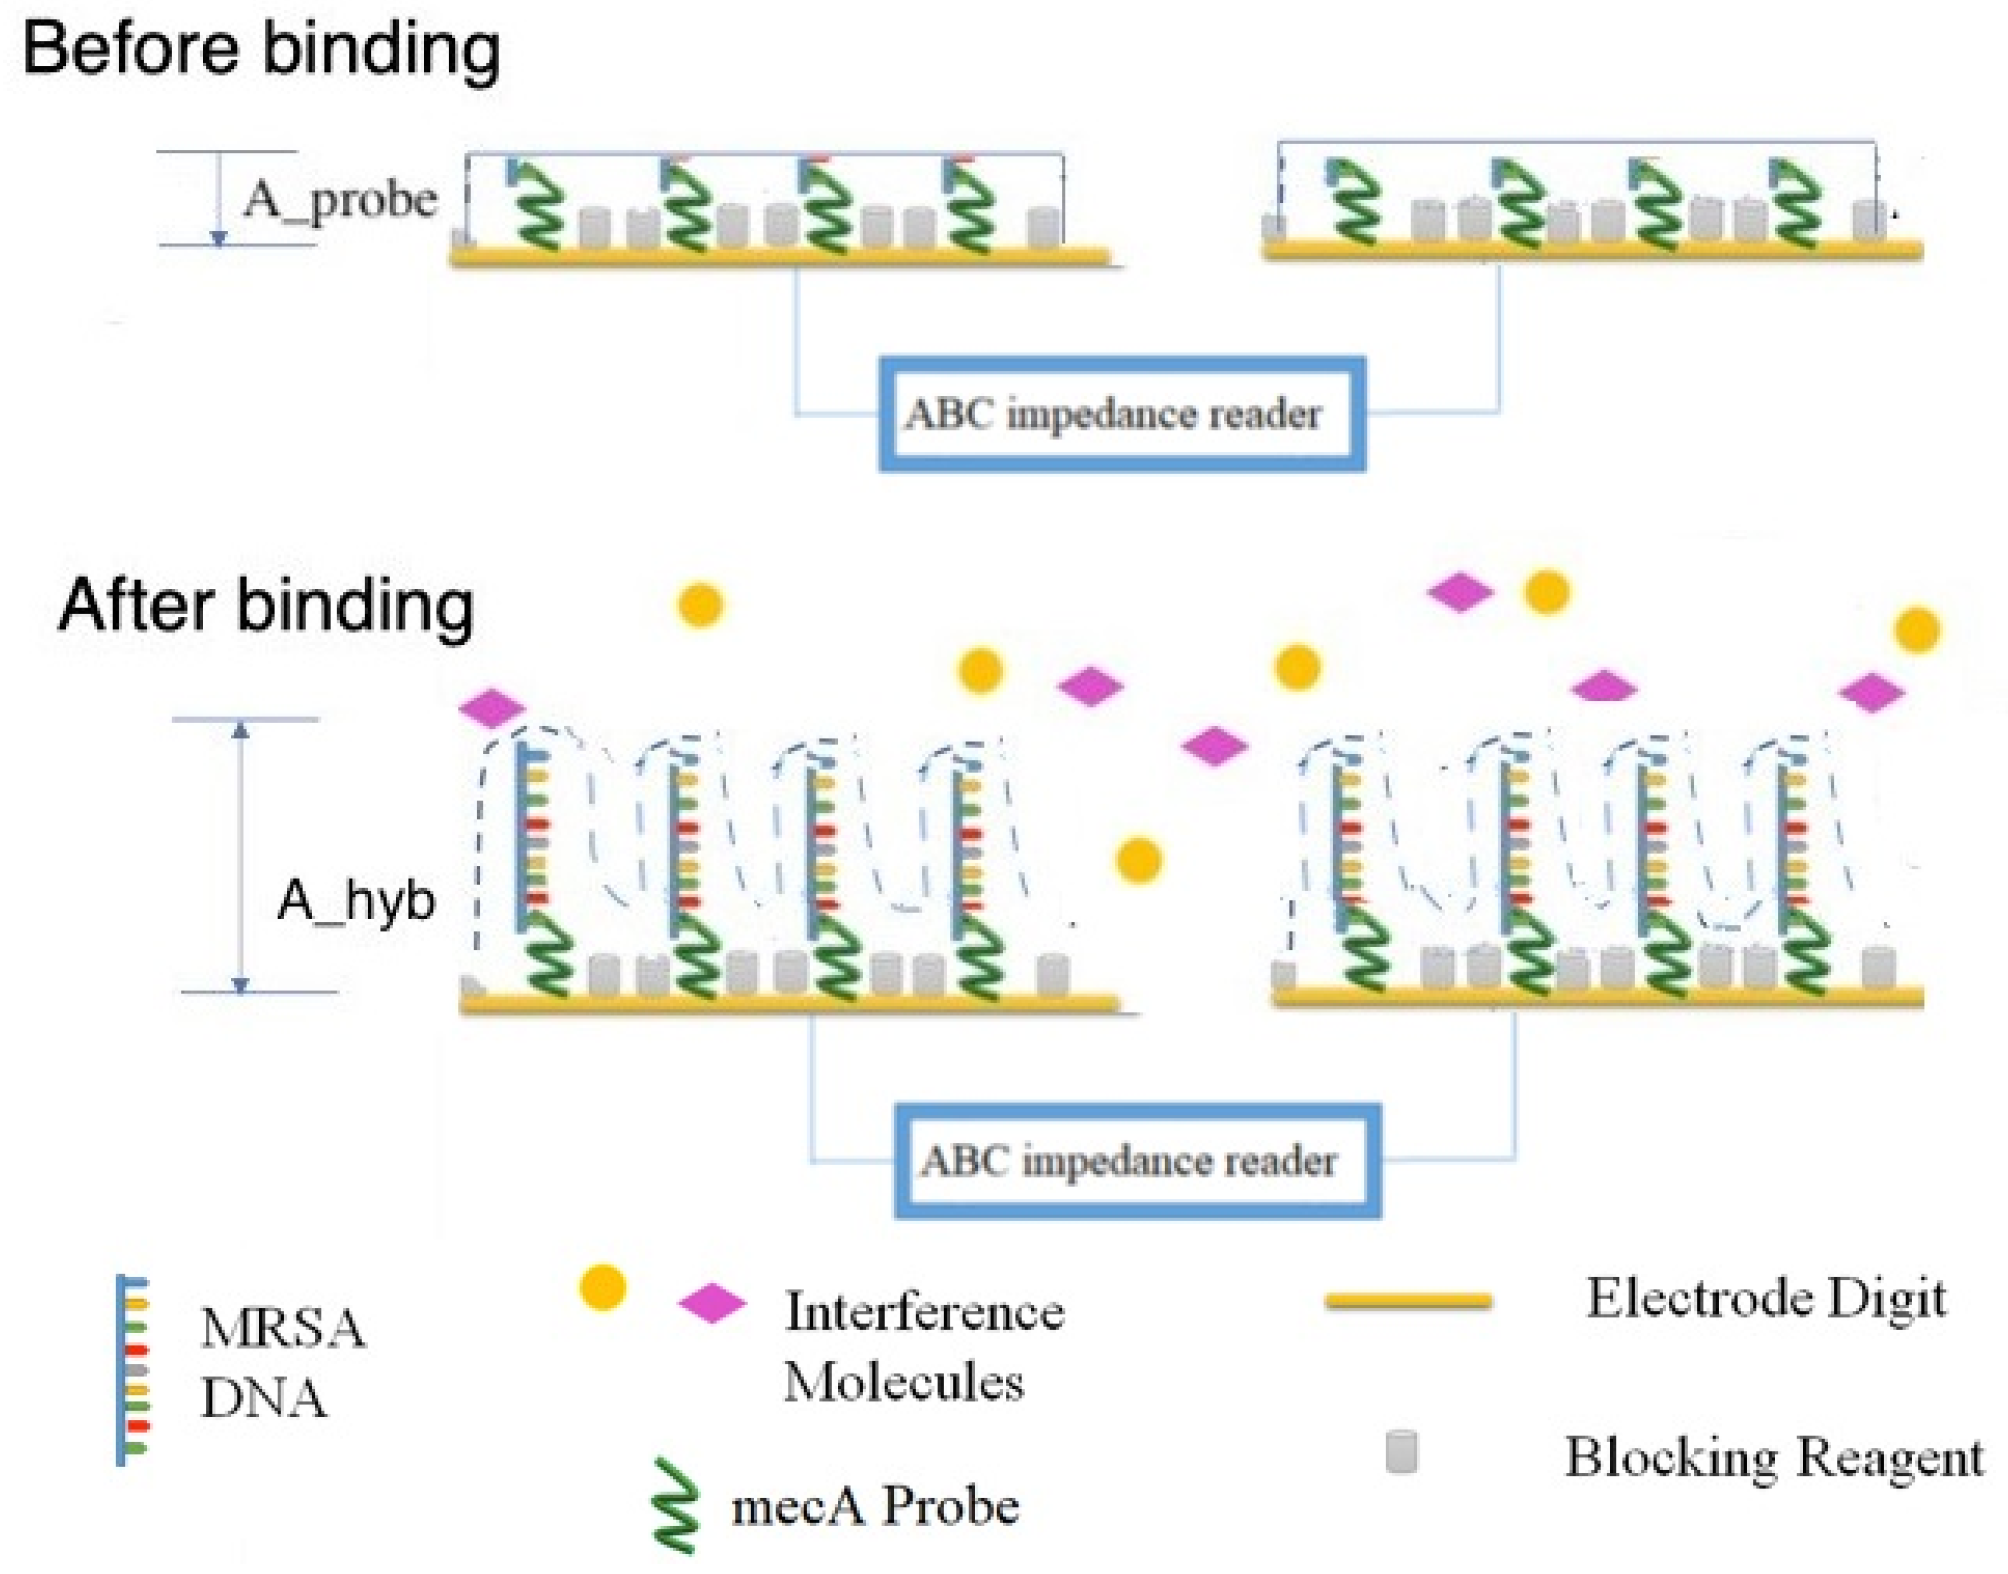
As biosensors, the IDE surface needs to be functionalized, i.e., immobilized with the bio-recognition molecule, known as probes. Detection of the target DNA is achieved via specific binding between the target and the probe. When the binding occurs, the topology of the sensing electrodes changes. As linear gDNA hybridizes with the probe, the conductive gDNA becomes an extension of electrodes, and the Cint’s area increases, hence an increase in Cint as conceptually shown in Figure 2 [18].
Before the binding process, a layer of the probe molecules is immobilized onto the surface of the electrode (see Figure 2). The interfacial capacitance can be expressed as:
where Aprobe is the surface area of the EDL formed on the functionalized IDE surface, is the medium permittivity, and d is the EDL thickness. When the binding reaction occurs, the interfacial capacitance will change. As shown in Figure 2, as the binding between the probe and the analytes occurs, the surface of the dielectric layer increases. This change causes an increase in the interfacial capacitance of the electrode. The interfacial capacitance is then expected to change to:
where Ahyb is the area of hybridized DNAs on the electrode surface. The change in the interfacial capacitance is consequently expressed as in (4):
2.2. DNA Enrichment by Dielectrophoresis (DEP)
Detection of biosensors typically relies on the diffusion of target macromolecules to sensors, which could lead to a long detection time (hours or even days) and low sensitivity [23]. To improve biosensor’s sensitivity and response time, great research effort in micro-/nano-fluidics has been devoted to the enrichment of target biomolecules [24]. The enrichment mechanism adopted for our bacterial gDNA detection is based on ACEK enhanced capacitive sensing. A special AC measuring signal is applied between a pair of functionalized IDEs, which induces micro to nano-scale particle and fluid movement [25], so that biomolecules are convected towards the IDEs, and enriched in situ there [26].
ACEK nano-fluidics refers to the induced movement of nano-bio-molecules and fluid by a small inhomogeneous AC electric field, which as a result is localized around electrodes [27]. For the test solution and target gDNA in this work, the dominant ACEK effect is the dielectrophoretic (DEP) force [28]. A great amount of research has been done on DEP for controlled manipulation of particles, binary separation, and characterization of particles, [29,30], however, using high voltages of several volts. Here, a milli-volt level AC signal was used in order to achieve molecular selectivity in gDNA detection.
The target gDNAs are linearized by the testing solution, with 2.2–2.6 nm in diameter and 0.9–1.0 mm in length (~3 Mbps). The DEP velocity for a linear particle can be described as [31,32]:
where is the medium permittivity, η is the medium viscosity, r is the radius of DNA cross section, l is the length of DNA, and are particle and medium complex permittivity, respectively. Complex permittivity is defined as (where σ is conductivity and ω is angular frequency). gives the real part of the function. If (usually when the fluid conductivity is higher than the particle conductivity at the operation frequency), particles will be attracted to electrodes, which is known as positive DEP (pDEP) [31]. To ensure pDEP for gDNA, buffer with a conductivity of ~9 mS/cm was used in this work. In addition, based on Equation (3), DEP velocity is strongly dependent on the DNA radius as well as the electric field gradient. Given the nm radius of nuclei acids and mV AC signal, only gDNAs will be enriched to the IDE surface for accelerating detections.
2.3. Reagents, Sensor and Sample Preparation
The sensors are prepared by immobilizing oligonucleotide probes on PCB-based gold IDEs. The electrode digit is 400 μm wide and 1 cm long with a 200 μm spacing between each. A detailed description of the PCB-based gold IDE fabrication steps is provided in a previous paper [33].
Cleaned electrodes are functionalized with a thiol modified probe for 22 h in a humidor under room temperature. The probe used in this work was a 5′ thiol modified oligonucleotide probe (5′-GTAGAAATGACT-GAACGTCCGATAA-3′). It was designed to specifically target mecA gene segment found only in specific MRSA [34]. Phosphate buffered saline (PBS) (0.05×) was used for probe incubation, which was prepared by 1:20 volume dilution of commercial physiological strength 1 × PBS (containing 75 mM of sodium chloride, pH 7.4, Thermo Fisher Scientific, Waltham, MA, USA) in ultrapure water (Mili-Q). To prevent nonspecific binding due to uncovered sites on functionalized electrodes, the electrodes were then blocked with 1.0 mM 6-mercaptohexanol (Sigma-Aldrich, St. Louis, MO, USA) prepared in ultrapure water.
In this work, MRSA gDNA was used as a model, which is one of the most common causes of hospital and community-acquired bloodstream infections. Quantitative S. aureus strain Mu50 DNA was purchased from ATCC (ATCC 700699DQ), which was prepared in ultrapure water at a concentration of 2.7 ng/mL as the stock sample solution. The testing buffer was based on saline-sodium citrate (20 × SSC) buffer, purchased from AccuGENETM (Lonza, Rockland, ME, USA). It was diluted in ultrapure water to make 0.5 × SSC. The gDNA from E. coli was extracted and prepared in-house and served as the control sample.
Three types of control tests were carried out to verify that the change was caused by the target and not the interference molecules. One was testing the blank background solution (0.5 × SSC) without target molecules using a functionalized sensor, and one was testing samples with target molecules on dummy electrodes (electrodes that were blocked without probe immobilization), so as to gauge the magnitude of response artifacts caused by the applied electrical field, and the third is to test samples with non-target molecules.
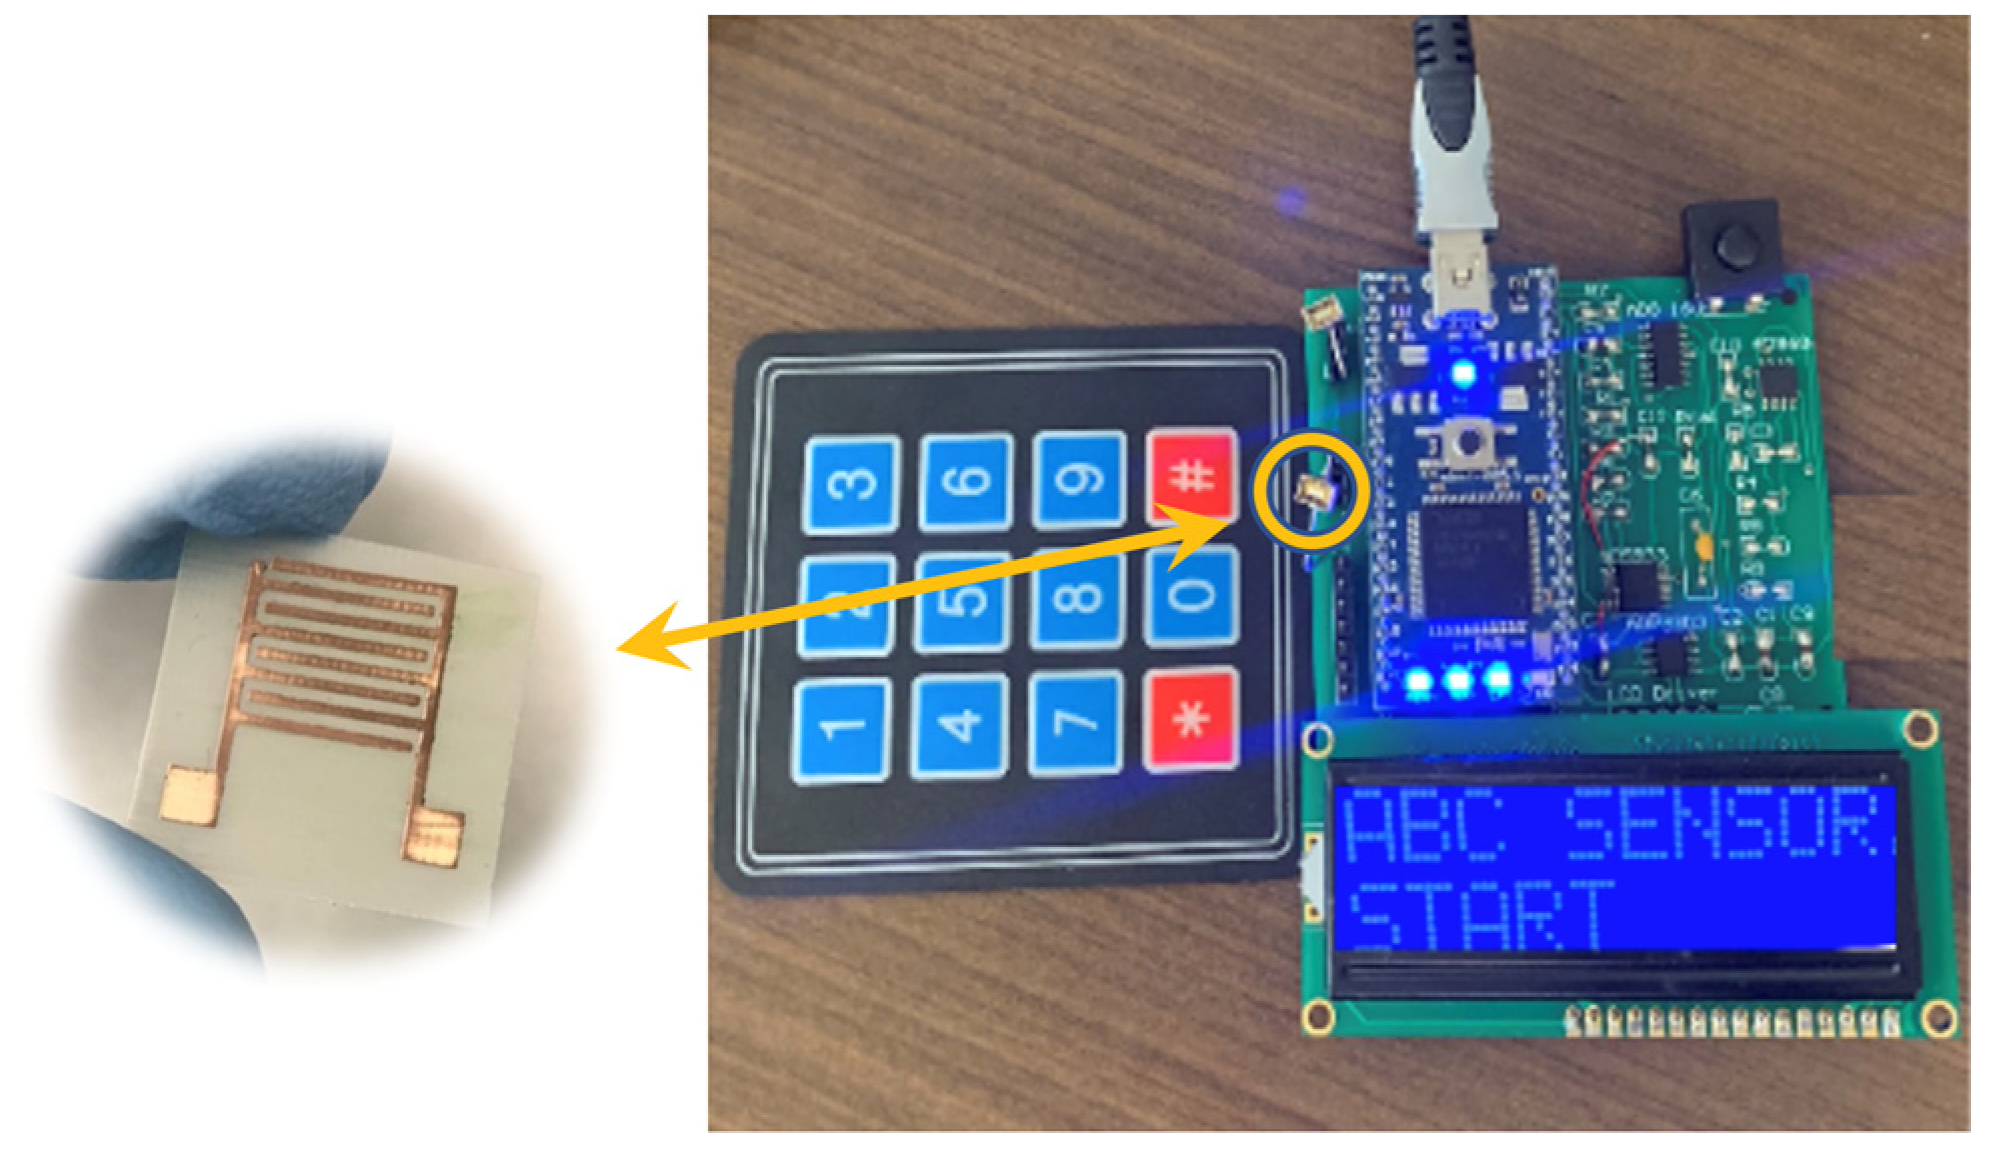
The interfacial capacitance was continuously measured at 100 kHz by an impedance analyzer for 30 s. The ABC sensing method adopts the percentage change in the measured capacitance to indicate biomolecular deposition at the sensor surface, which is the slope of normalized capacitance change versus time (%/minute) over the assay time. Normalized capacitance is calculated as Cint,t = Cint,t/Cint,0, where Cint,t and Cint,0 are the measured capacitances at time t and time zero, respectively. The IDEs were electrically connected to two contact pads, which were then used to connect to an impedance analyzer. The detection procedure was as follows. First, the double strands of MRSA DNA should be separated (denatured) and linearized to allow hybridization with the probes [13] on the IDEs. Thermal denaturation was used to obtain single-strand DNAs (ssDNAs) [35]. DNA stock samples were diluted and heated on a dry bath at 95 °C. After 10 min, the tubes of the diluted samples were inserted in ice for 1 min. After the samples returned to room temperature, they were added onto the sensors connected to the ABC system for tests, which imposed an inhomogeneous AC electric field on the sensor. A bare electrode sensor before functionalization and a portable capacitance reader are shown in Figure 3. The development and details of a similar portable capacitance reader are reported previously [34].
3. Results and Discussion
3.1. Nanostructured Probe Layer on Electrode Surface
Forming a good quality layer of probes on the sensor surface is critical to obtaining sensitive and reliable biosensors. To achieve this objective, it is paramountly important to ensure the cleanliness of the electrode surface and effective immobilization of biomolecules on sensor surfaces.
Electrodes were washed sequentially with acetone, isopropyl alcohol, de-ionized water, and ozone. As it affects different surface processes (e.g., levels of cleanness and surface deposition), the cleaning step correlates strongly with the interfacial area or the binding sites at the microelectrode surface. Hence, the sensor surface was closely monitored through the interfacial capacitances (Cint). This surface analytical method is simple and rapid and has been validated experimentally [21]. In our protocol, Cint was measured after each step of cleaning and incubation, using 0.1 × (15 mM Na + PBS) solution at 100 kHz 5 mVrms. We have developed a reference table of Cint at each step to ensure electrode quality [36].
For surface-based biosensors, surface functionalization is a crucial step to realize bio-specificity. This step consisted of immobilizing a layer of probe molecules onto the electrode surface. When functionalized properly, the detection of the binding signal became more effective, as the surface functionalization determines the number of available binding sites and so the change of the interfacial capacitance. It was typically desired to have the optimal surface coverage to obtain large sensor responses. In this work, to improve MRSA sample detection and optimize the incubation step, three different probe concentrations were tested, and their results are summarized in Figure 4.
The sensor surface was incubated with 10 µL of 200 nM, 1 and 2 µM mecA probe, respectively. The surface coverage by the probe was monitored by checking the normalized capacitance change before and after probe immobilization. As shown in Figure 4a, by increasing the probe concentration from 200 nM to 2 µM, the capacitance change increased from 44% to 95% during the probe incubation, which was expected as corresponding to a higher density of probe immobilization. Different coverage levels of oligo probes would lead to different sensor responses. Higher surface coverage of probes would typically yield a larger response. Figure 4b shows some typical responses for sensors functionalized at 3 different probe concentrations when tested using MRSA gDNA samples at 2501.4 copies/µL. As shown in Figure 4b, the normalized capacitance changed quasi-linearly with time, indicating continuous hybridization between the probes and the MRSA gDNAs. The capacitance change rate was higher for sensors with higher probe concentrations. This could be explained by the higher coverage of the surface that leads to a higher chance of probe-target hybridization at the electrode surface and then higher sensor response. It should be noted that for sensors functionalized at 200 nM probe concentration, the capacitance change became negative when testing MRSA gDNA, which was supposed to be the result of target gDNAs depositing onto the electrode surface after hybridization. As a matter of fact, the lower surface coverage of nuclei acid probes would lead to lower charge density at the electrode surface, thus less repulsive force between the probe-covered electrode surface and the gDNAs. Because the AC electrical fields exerted attraction DEP force on gDNAs, given less charge repulsion from the electrodes, the captured gDNA would approach the electrodes closely and lead to an increase in the thickness of biopolymer layer at the electrode surface, causing a decrease in Cint for specific detection. The control experiments yielded almost no change in Cint as expected (<+/−1.00%/min).
The probe density also affected the linearity of the transient curves in Figure 4b. The sensor with the highest probe density exhibited the best linearity, while the sensor functionalized at 200 nM showed slowing down of hybridization after 15 s, which could be attributed to a shortage of probes.
3.2. Optimization of Assay Time
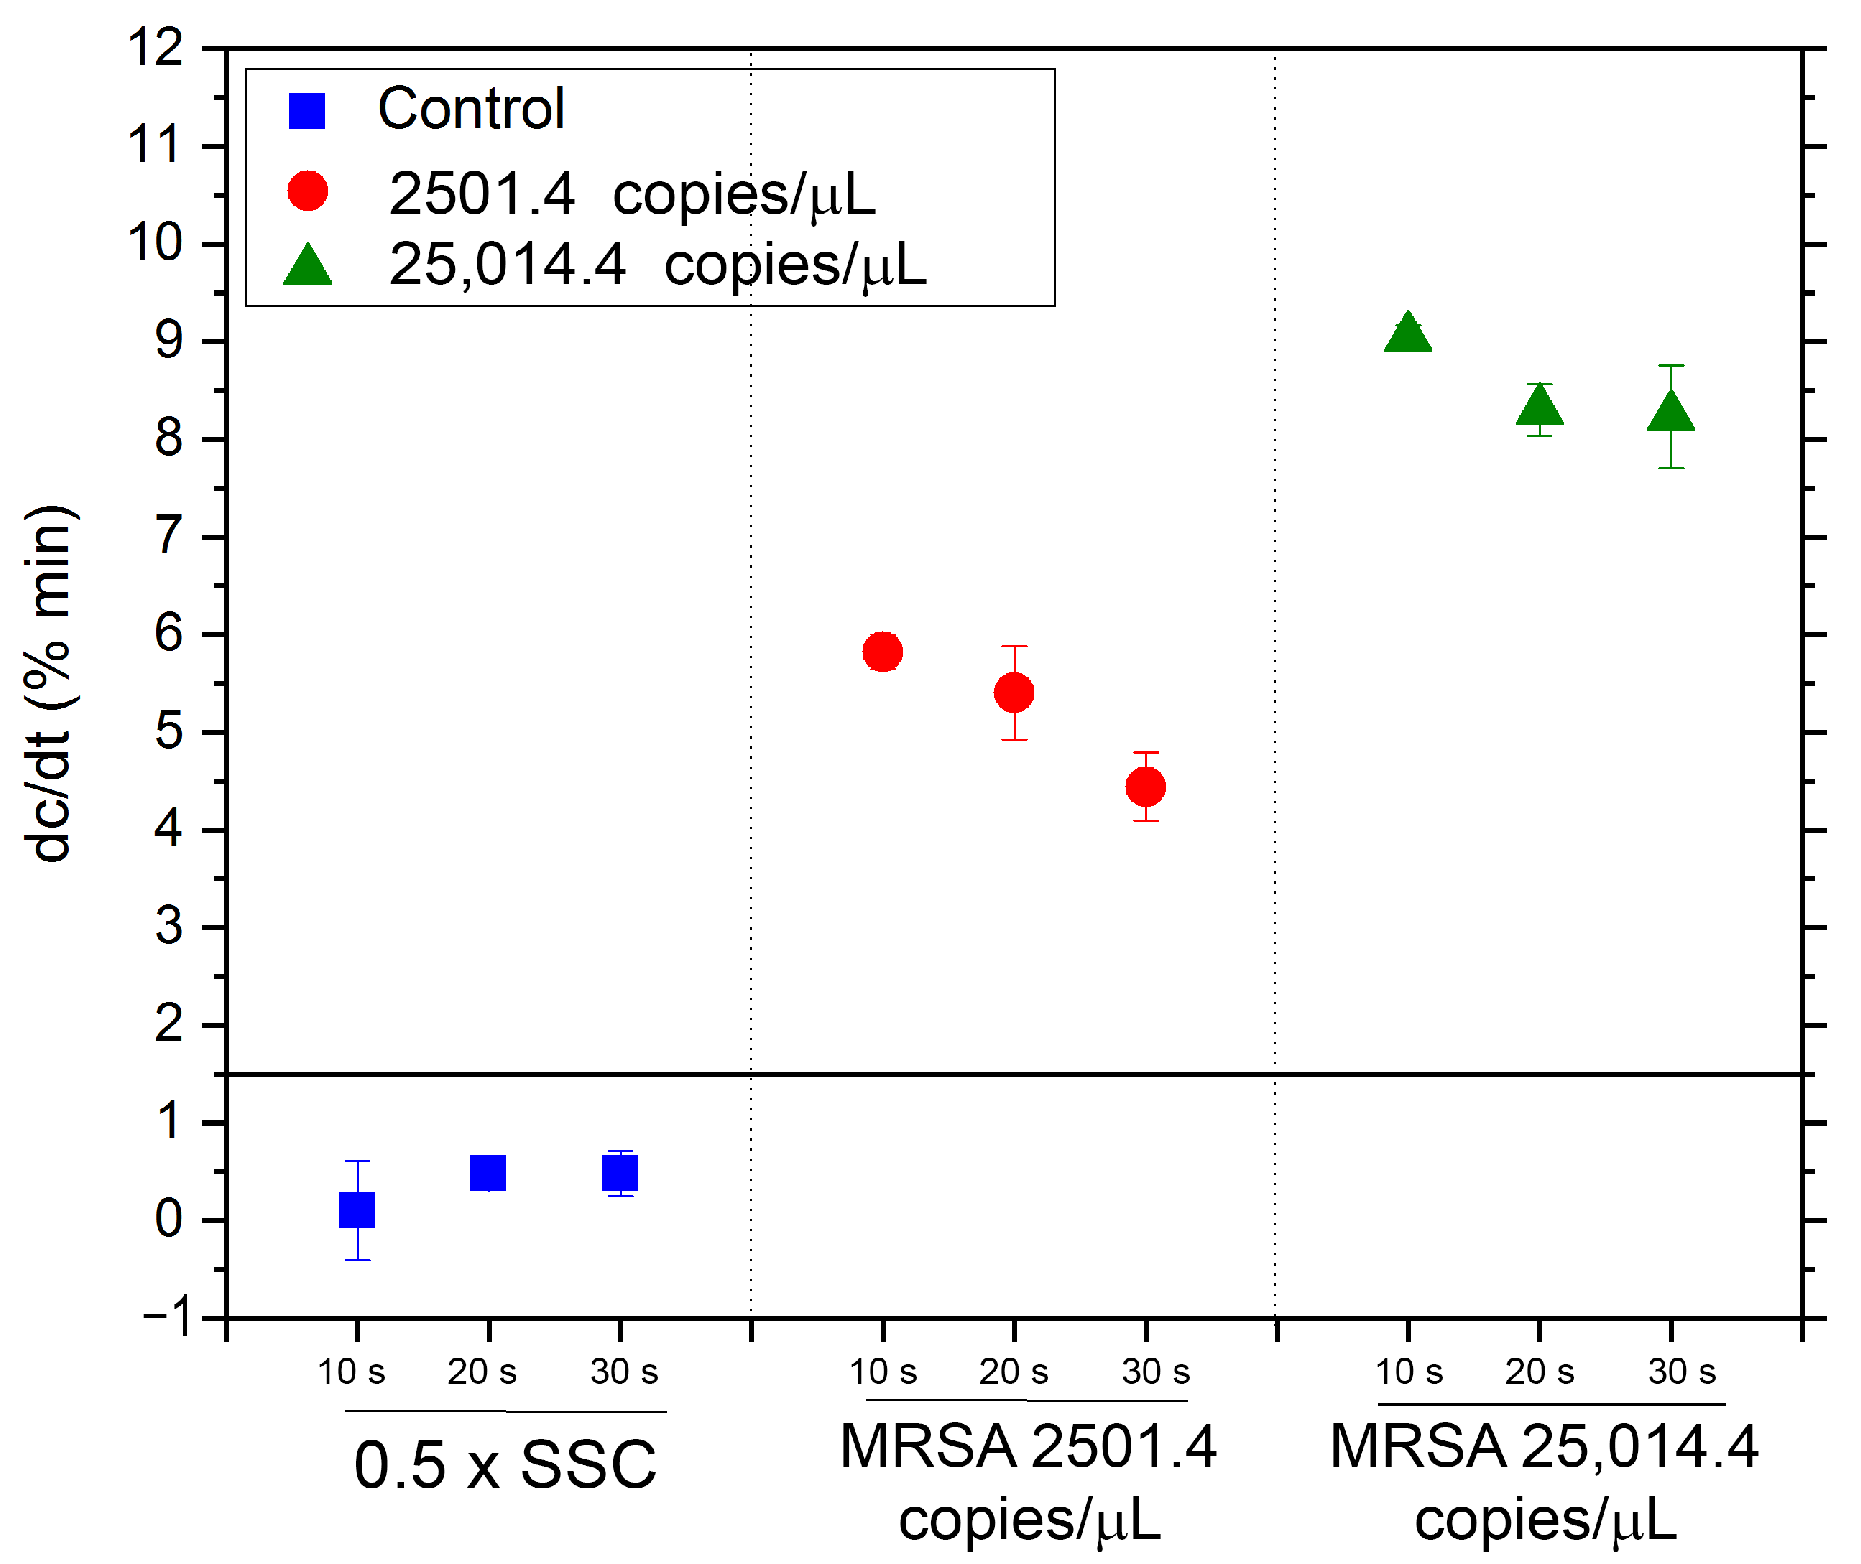
Next, the assay time was optimized for this MRSA gDNA sensor. Results are shown in Figure 5. Our previous work on protein and small molecule detection found that capacitance change rate taken over different periods correlates with analyte reaction/transport-controlled processes [37,38]. Because DEP attraction decays with distance, gDNAs’ travel towards the sensor is slower for those farther away from the electrodes. So, at the dilute concentration of gDNA, the hybridization events become less frequent with time. However, a longer assay time may lead to saturation of signals, which is undesirable [39].
In this test, the same AC signal was applied to the sensor with three different sweep times (10, 20, and 30 s). Two MRSA concentrations (2501.4 and 25,014.4 copies/µL) in 0.5 × SSC were measured for this optimization process. Using 30 s, 2501.4 and 25,014.4 copies /µL of MRSA gDNA have the responses of 4.44 ± 0.35% and 8.23 ± 0.53% per minute. When the sweep time decreased from 20 to 10 s, the response of the sensor to 2501.4 copies/µL MRSA gDNA increased from 5.40 ± 0.47%/min for 20 s to 5.82 ± 0.18%/min for 10 s. Similarly, the sensor response of 25,014.1 copies/µL MRSA gDNA increased from 8.30 ± 0.26%/min for 20 s to 9.04 ± 0.13%/min for 10 s. A shorter assay time ensures that the reaction is transport limited, and the response has a better correlation with the target gDNAs in the solution, by using this real-time detection mode. The assay time was set to be 10 s from this point on. In addition, there was a very little response change for the control sample, attesting to the specificity of this gDNA sensor.
3.3. Sensor Sensitivity and Specificity
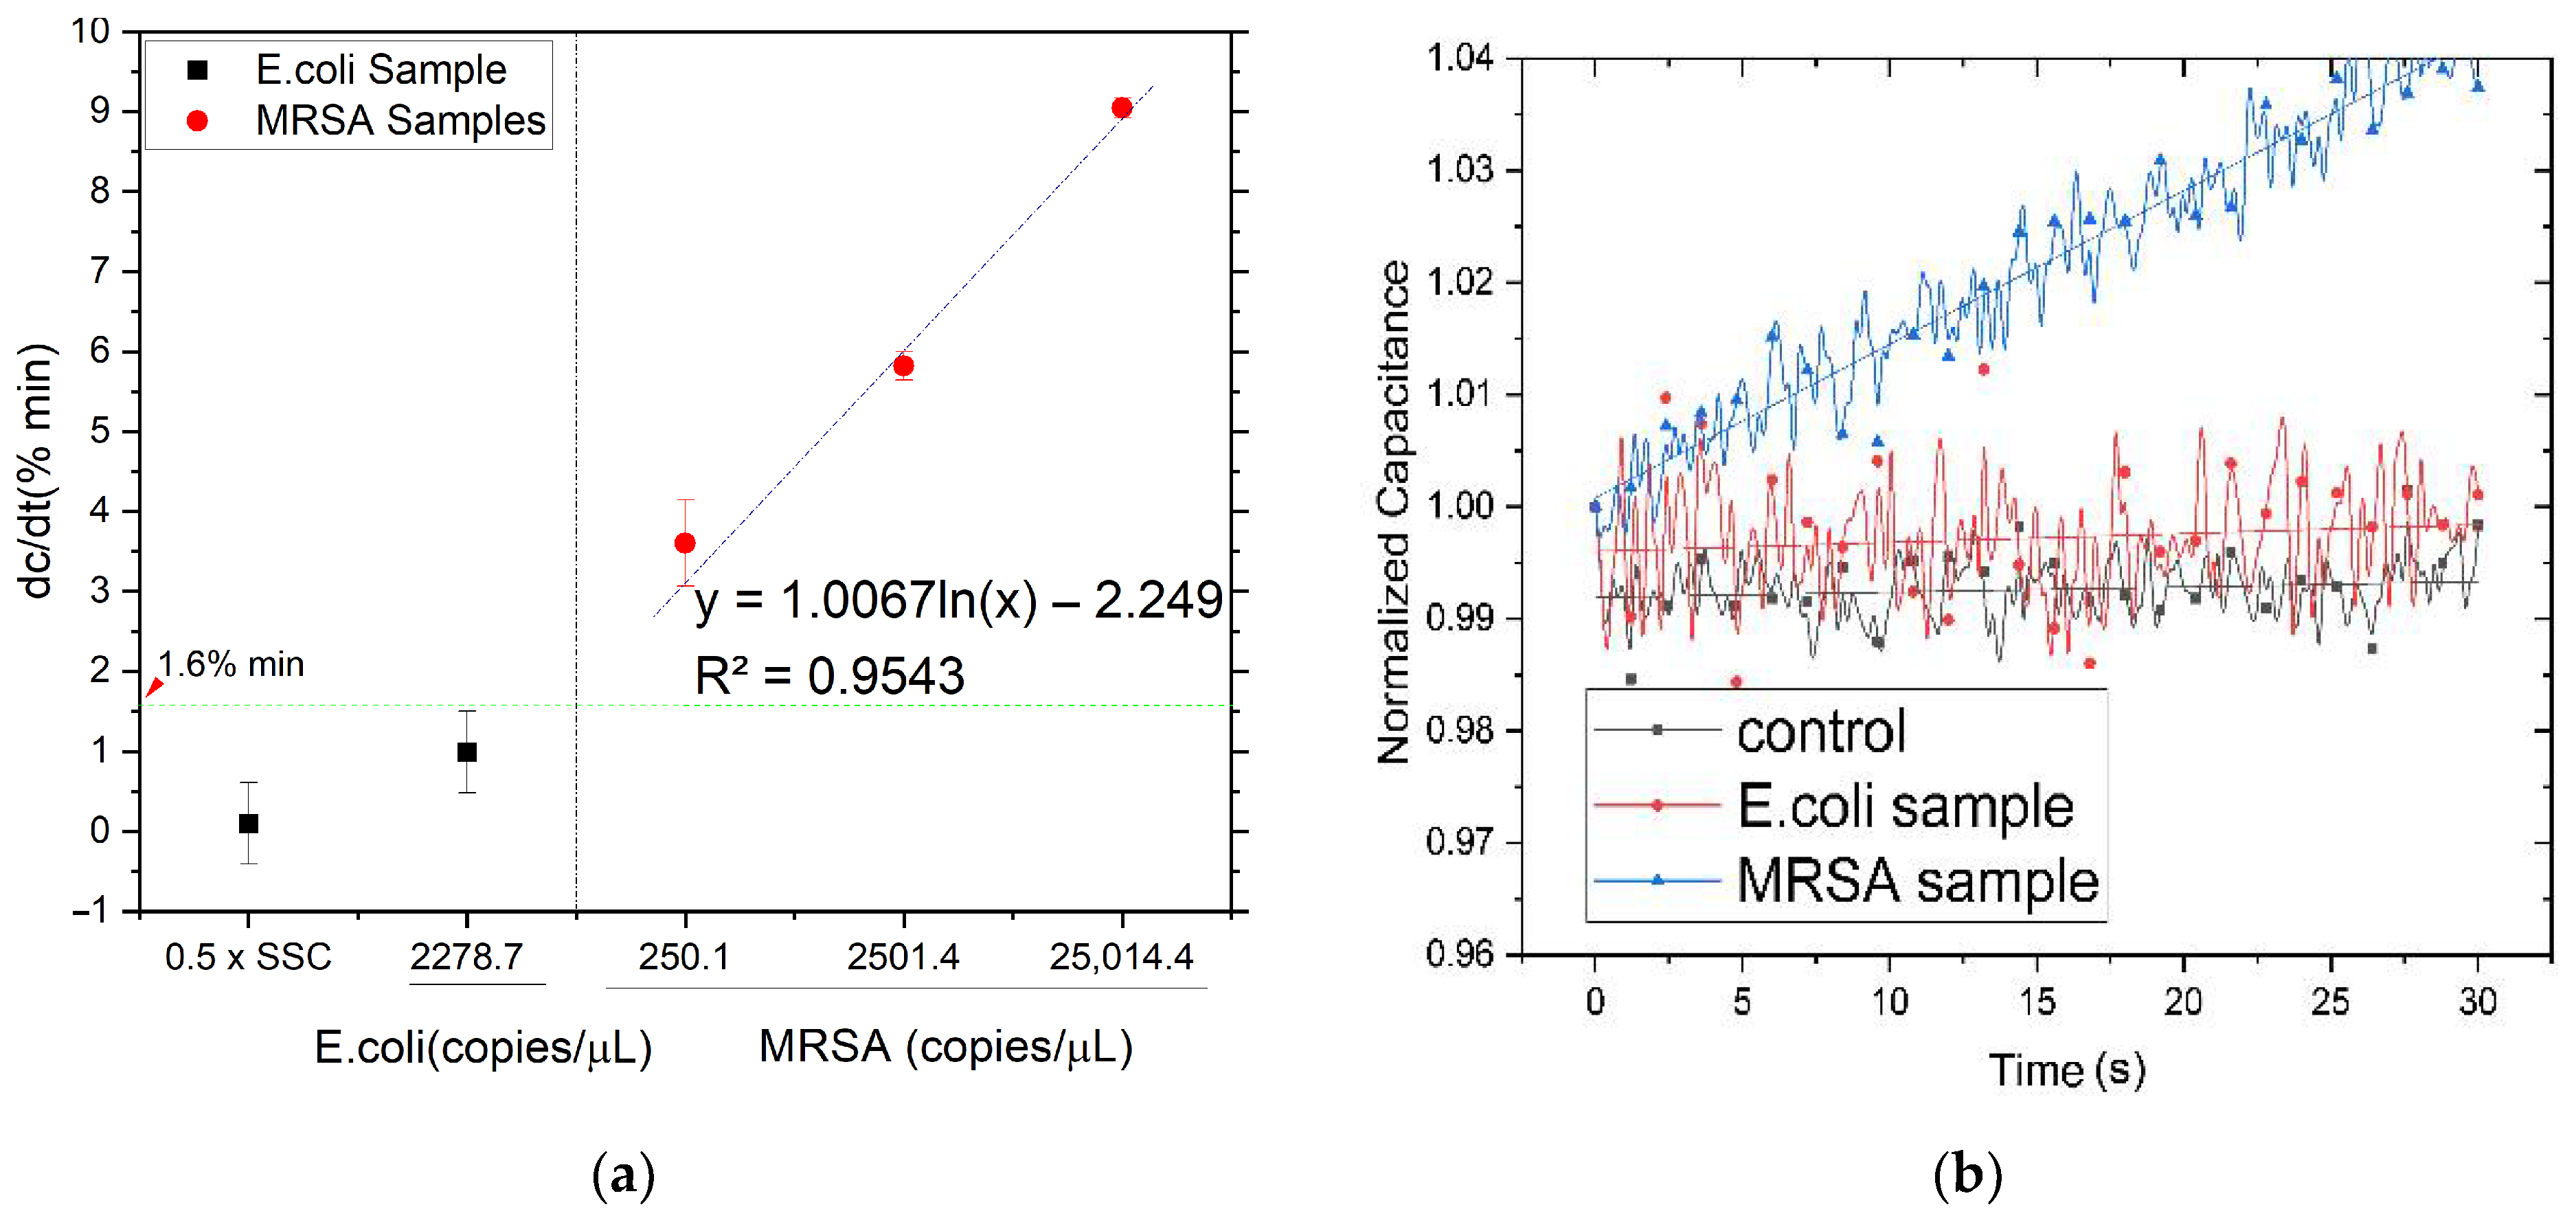
Three concentrations of MRSA gDNA, 250.1 copies/µL, 2501.4 copies/µL, and 25,014.1 copies/µL, spiked in 0.5 × SSC were tested and the results are shown in Figure 6. Each sample was tested three times. A separate chip was used for each test. The results are 3.60 ± 0.53%/min, 5.82 ± 0.17%/min, and 9.04 ± 0.13%/min respectively, with the responses of buffer solution 0.5 × SSC (background) to be 0.10 ± 0.15%/min. The sensor showed a logarithmic dependence on MRSA concentration ranging from 250.1 to 25,014.1 DNA copies/µL, and the calibration curve of the sensor was calculated to be (d|C|/dt) = 1.0067ln(x)–2.249 where x is the concentration of MRSA in 0.5 × SSC. The limit of detection (LOD) was determined as 3 standard deviations from the average response of the background control. Hence, the cut-off value for sensor response (d|C|/dt) was calculated to be 1.60%/min. Using the calibration equation, the LOD was calculated to be 4.72 DNA copies/µL in 0.5 × SSC.
As sensor specificity is crucial to biosensor operation, E.coli DNA, at a concentration of 2278.7 copies/µL, was tested to determine the sensor specificity. As demonstrated in Figure 6, the capacitance change rates for E.coli (2278.7 copies/µL) was 0.51 ± 0.58%/min, which is below the cut-off response, hence considered as being negative. In contrast, for MRSA gDNA at a similar concentration of 2501.4 DNA copies/µL, the sensor response was close to 6.00%/min. Therefore, the sensor is specific to MRSA gDNA.
4. Conclusions
By optimizing the probe concentration and assay time for the detection of hybridization, rapid, sensitive, and specific detection of MRSA gDNA has been achieved using a newly developed ABC biosensor. The sensor operation involves only heat treatment of double stranded DNA (dsDNA), adding the sample to the electrode sensor, and then measuring the sensor capacitance with the specified AC signal for 10–30 s. The LOD was calculated to be 4.72 DNA copies /µL. The work is expected to lead to a rapid and PCR-free biosensor platform for on-site sensitive and specific detection of genetic sequences for a wide range of pathogens and biomaterials. The sensitivity and required diagnosis time of the proposed sensor have outperformed many reported similar works. Because the electrical detection method is used here, the resultant sensors can be easily combined to form a multiplexed panel test, which is necessary for accurate detection and prognosis of many pathogens. For future development, the capacitance measurement can be automated and multiplexed using a microcontroller-based capacitance reader.
Author Contributions
Conceptualization, J.W. and J.C.; methodology, J.W. and R.O.; validation, R.O. and Y.J.; formal analysis, R.O.; investigation, J.W. and R.O.; resources, J.W. and J.C.; data curation, R.O. and Y.J.; writing—original draft preparation, J.W. and R.O.; writing—review and editing, J.W. and Y.J.; visualization, R.O. and Y.J.; supervision, J.W.; project administration, J.W.; funding acquisition, J.W. and J.C. All authors have read and agreed to the published version of the manuscript.
Funding
This work acknowledges the support from the University of Tennessee Organized Research Unit-Initiative for PON/POC Nanobiosensing. The authors also acknowledge the support of USDA National Institute of Food and Agriculture (2017–67007-26150).
Institutional Review Board Statement
Not applicable.
Informed Consent Statement
Not applicable.
Data Availability Statement
Data is contained within the article.
Conflicts of Interest
The authors declare no conflict of interest.
References
- Fojta, M.; Daňhel, A.; Havran, L.; Vyskočil, V. Recent Progress in Electrochemical Sensors and Assays for DNA Damage and Repair. TrAC Trends Anal. Chem. 2016, 79, 160–167. [Google Scholar] [CrossRef]
- Millan, K.M.; Mikkelsen, S.R. Sequence-Selective Biosensor for DNA Based on Electroactive Hybridization Indicators. Anal. Chem. 1993, 65, 2317–2323. [Google Scholar] [CrossRef]
- Mohanty, S.P.; Kougianos, E. Biosensors: A Tutorial Review. IEEE Potentials 2006, 25, 35–40. [Google Scholar] [CrossRef]
- Rafique, B.; Iqbal, M.; Mehmood, T.; Shaheen, M.A. Electrochemical DNA Biosensors: A Review. Sens. Rev. 2019, 39, 34–50. [Google Scholar] [CrossRef]
- Moreno-Hagelsieb, L.; Lobert, P.E.; Pampin, R.; Bourgeois, D.; Remacle, J.; Flandre, D. Sensitive DNA Electrical Detection Based on Interdigitated Al/Al2O3 Microelectrodes. Sens. Actuators B Chem. 2004, 98, 269–274. [Google Scholar] [CrossRef]
- Xu, L.; Liang, W.; Wen, Y.; Wang, L.; Yang, X.; Ren, S.; Jia, N.; Zuo, X.; Liu, G. An Ultrasensitive Electrochemical Biosensor for the Detection of MecA Gene in Methicillin-Resistant Staphylococcus Aureus. Biosens. Bioelectron. 2018, 99, 424–430. [Google Scholar] [CrossRef]
- Liu, M.; Xiang, H.; Hua, E.; Wang, L.; Jing, X.; Cao, X.; Sheng, S.; Xie, G. Ultrasensitive Electrochemical Biosensor for the Detection of the MecA Gene Sequence in Methicillin Resistant Strains of Staphylococcus Aureus Employing Gold Nanoparticles. Anal. Lett. 2014, 47, 579–591. [Google Scholar] [CrossRef]
- Yue, H.; Zhou, Y.; Wang, P.; Wang, X.; Wang, Z.; Wang, L.; Fu, Z. A Facile Label-Free Electrochemiluminescent Biosensor for Specific Detection of Staphylococcus Aureus Utilizing the Binding between Immunoglobulin G and Protein A. Talanta 2016, 153, 401–406. [Google Scholar] [CrossRef] [PubMed]
- Berggren, C.; Stålhandske, P.; Brundell, J.; Johansson, G. A Feasibility Study of a Capacitive Biosensor for Direct Detection of DNA Hybridization. Electroanalysis 1999, 11, 156–160. [Google Scholar] [CrossRef]
- Khaliliazar, S.; Ouyang, L.; Piper, A.; Chondrogiannis, G.; Hanze, M.; Herland, A.; Hamedi, M.M. Electrochemical Detection of Genomic DNA Utilizing Recombinase Polymerase Amplification and Stem-Loop Probe. ACS Omega 2020, 5, 12103–12109. [Google Scholar] [CrossRef] [PubMed]
- Abdul Rashid, J.I.; Yusof, N.A.; Abdullah, J.; Hashim, U.; Hajian, R. Surface Modifications to Boost Sensitivities of Electrochemical Biosensors Using Gold Nanoparticles/Silicon Nanowires and Response Surface Methodology Approach. J. Mater. Sci. 2016, 51, 1083–1097. [Google Scholar] [CrossRef]
- Lee, K.-H.; Lee, J.-O.; Sohn, M.-J.; Lee, B.; Choi, S.-H.; Kim, S.K.; Yoon, J.-B.; Cho, G.-H. One-Chip Electronic Detection of DNA Hybridization Using Precision Impedance-Based CMOS Array Sensor. Biosens. Bioelectron. 2010, 26, 1373–1379. [Google Scholar] [CrossRef]
- Wu, J.; Islam, N. A Simple Method to Integrate In Situ Nano-Particle Focusing With Cantilever Detection. IEEE Sens. J. 2007, 7, 957–958. [Google Scholar] [CrossRef]
- Cui, H.; Li, S.; Yuan, Q.; Wadhwa, A.; Eda, S.; Chambers, M.; Ashford, R.; Jiang, H.; Wu, J. An AC Electrokinetic Impedance Immunosensor for Rapid Detection of Tuberculosis. Analyst 2013, 138, 7188–7196. [Google Scholar] [CrossRef]
- Li, S.; Cui, H.; Yuan, Q.; Wu, J.; Wadhwa, A.; Eda, S.; Jiang, H. AC Electrokinetics-Enhanced Capacitive Immunosensor for Point-of-Care Serodiagnosis of Infectious Diseases. Biosens. Bioelectron. 2014, 51, 437–443. [Google Scholar] [CrossRef]
- Hughes, M.P.; Morgan, H. Dielectrophoretic Characterization and Separation of Antibody-Coated Submicrometer Latex Spheres. Anal. Chem. 1999, 71, 3441–3445. [Google Scholar] [CrossRef]
- Arumugam, P.U.; Chen, H.; Cassell, A.M.; Li, J. Dielectrophoretic Trapping of Single Bacteria at Carbon Nanofiber Nanoelectrode Arrays. J. Phys. Chem. A 2007, 111, 12772–12777. [Google Scholar] [CrossRef] [PubMed]
- Cheng, C.; Wu, J.; Fikrig, E.; Wang, P.; Chen, J.; Eda, S.; Terry, P. Unamplified RNA Sensor for On-Site Screening of Zika Virus Disease in a Limited Resource Setting. ChemElectroChem 2017, 4, 485–489. [Google Scholar] [CrossRef]
- Cheng, C.; Oueslati, R.; Wu, J.; Chen, J.; Eda, S. Capacitive DNA Sensor for Rapid and Sensitive Detection of Whole Genome Human Herpesvirus-1 DsDNA in Serum. Electrophoresis 2017, 38, 1617–1623. [Google Scholar] [CrossRef] [PubMed]
- Kokkinos, C.; Economou, A.; Prodromidis, M.I. Electrochemical Immunosensors: Critical Survey of Different Architectures and Transduction Strategies. TrAC Trends Anal. Chem. 2016, 79, 88–105. [Google Scholar] [CrossRef]
- Oueslati, R.; Cheng, C.; Wu, J.; Chen, J. Highly Sensitive and Specific On-Site Detection of Serum Cocaine by a Low Cost Aptasensor. Biosens. Bioelectron. 2018, 108, 103–108. [Google Scholar] [CrossRef] [PubMed]
- Cheng, C.; Wang, S.; Wu, J.; Yu, Y.; Li, R.; Eda, S.; Chen, J.; Feng, G.; Lawrie, B.; Hu, A. Bisphenol A Sensors on Polyimide Fabricated by Laser Direct Writing for Onsite River Water Monitoring at Attomolar Concentration. ACS Appl. Mater. Interfaces 2016, 8, 17784–17792. [Google Scholar] [CrossRef] [PubMed]
- Sheehan, P.E.; Whitman, L.J. Detection Limits for Nanoscale Biosensors. Nano Lett. 2005, 5, 5. [Google Scholar] [CrossRef] [PubMed]
- Wu, J.; Cheng, C.; Yuan, Q.; Oueslati, R.; Zhang, J.; Chen, J.; Almeida, R. Simple, Fast and Highly Sensitive Detection of Gram-Negative Bacteria by A Novel Electrical Biosensor. In Proceedings of the Annual International Conference of the IEEE Engineering in Medicine and Biology Society, Honolulu, HI, USA, 17–21 July 2018; pp. 1279–1282. [Google Scholar] [CrossRef]
- Wu, J. Interactions of Electrical Fields with Fluids:Laboratory-on-a-Chip Applications. IET Nanobiotechnol. 2008, 2, 14–27. [Google Scholar] [CrossRef] [PubMed] [Green Version]
- Yang, K.; Wu, J. Numerical Study of in Situ Preconcentration for Rapid and Sensitive Nanoparticle Detection. Biomicrofluidics 2010, 4, 1–15. [Google Scholar] [CrossRef] [PubMed] [Green Version]
- Li, S.; Yuan, Q.; Morshed, B.I.; Ke, C.; Wu, J.; Jiang, H. Dielectrophoretic Responses of DNA and Fluorophore in Physiological Solution by Impedimetric Characterization. Biosens. Bioelectron. 2013, 41, 649–655. [Google Scholar] [CrossRef] [PubMed]
- Yang, K.; Islam, N.; Eda, S.; Wu, J. Optimization of an AC Electrokinetics Immunoassay Lab-Chip for Biomedical Diagnostics. Microfluid. Nanofluid. 2017, 21, 35. [Google Scholar] [CrossRef]
- Lenshof, A.; Laurell, T. Continuous Separation of Cells and Particles in Microfluidic Systems. Chem. Soc. Rev. 2010, 39, 1203. [Google Scholar] [CrossRef]
- Zhang, J.; Oueslati, R.; Cheng, C.; Zhao, L.; Chen, J.; Almeida, R.; Wu, J. Rapid, Highly Sensitive Detection of Gram-Negative Bacteria with Lipopolysaccharide Based Disposable Aptasensor. Biosens. Bioelectron. 2018, 112, 48–53. [Google Scholar] [CrossRef] [Green Version]
- Morgan, H.; Green, N.G. Dielectrophoretic Manipulation of Rod-Shaped Viral Particles. J. Electrost. 1997, 42, 279–293. [Google Scholar] [CrossRef] [Green Version]
- Meng, J.; Huang, J.; Oueslati, R.; Jiang, Y.; Chen, J.; Li, S.; Dai, S.; He, Q.; Wu, J. A Single-Step DNAzyme Sensor for Ultra-Sensitive and Rapid Detection of Pb2+ Ions. Electrochim. Acta 2021, 368, 137551. [Google Scholar] [CrossRef]
- Mirzajani, H.; Cheng, C.; Wu, J.; Chen, J.; Eda, S.; Najafi Aghdam, E.; Badri Ghavifekr, H. A Highly Sensitive and Specific Capacitive Aptasensor for Rapid and Label-Free Trace Analysis of Bisphenol A (BPA) in Canned Foods. Biosens. Bioelectron. 2017, 89, 1059–1067. [Google Scholar] [CrossRef] [PubMed]
- Liu, X.; Cheng, C.; Wu, J.; Eda, S.; Guo, Y. A Low Cost and Palm-Size Analyzer for Rapid and Sensitive Protein Detection by AC Electrokinetics Capacitive Sensing. Biosens. Bioelectron. 2017, 90, 83–90. [Google Scholar] [CrossRef] [PubMed]
- Minunni, M.; Tombelli, S.; Scielzi, R.; Mannelli, I.; Mascini, M.; Gaudiano, C. Detection of β-Thalassemia by a DNA Piezoelectric Biosensor Coupled with Polymerase Chain Reaction. Anal. Chim. Acta 2003, 481, 55–64. [Google Scholar] [CrossRef]
- Cui, H.; Cheng, C.; Wu, J.; Eda, S. Rapid Detection of Progesterone by Commercially Available Microelectrode Chips. In Proceedings of the IEEE SENSORS 2013, Baltimore, MD, USA, 3–6 November 2013; pp. 1–4. [Google Scholar] [CrossRef]
- Cui, H.; Cheng, C.; Lin, X.; Wu, J.; Chen, J.; Eda, S.; Yuan, Q. Rapid and Sensitive Detection of Small Biomolecule by Capacitive Sensing and Low Field AC Electrothermal Effect. Sens. Actuators B Chem. 2016, 226, 245–253. [Google Scholar] [CrossRef] [Green Version]
- Zhang, J.; Wang, J.; Wu, J.; Qi, H.; Wang, C.; Fang, X.; Cheng, C.; Yang, W. Rapid Detection of Ultra-Trace Nanoparticles Based on ACEK Enrichment for Semiconductor Manufacturing Quality Control. Microfluid. Nanofluid. 2019, 23, 2. [Google Scholar] [CrossRef]
- Zhang, J.; Jiang, Y.; Xia, X.; Wu, J.; Almeida, R.; Eda, S.; Qi, H. An On-Site, Highly Specific Immunosensor for Escherichia Coli Detection in Field Milk Samples from Mastitis-Affected Dairy Cattle. Biosens. Bioelectron. 2020, 165, 112366. [Google Scholar] [CrossRef]
Figure 1.
Equivalent circuit for an interdigitated electrode (IDE) when immersed into the fluid.

Figure 2.
Change at electrode/electrolyte interface due to probe/target analyte binding. Cint increases as the surface area of the interfacial layer decreases.
Figure 2.
Change at electrode/electrolyte interface due to probe/target analyte binding. Cint increases as the surface area of the interfacial layer decreases.

Figure 3.
On the Au-PCB electrode (left), hybridization between the immobilized probes and DNA targets increases the interfacial area of the electrode, so a change at the interface (Cint) occurs. This change is detected and measured by the portable read-out system (right). The width and gap of the PCB sensors are both 200 µm. The sensors are wire-connected to the readout board through the two pads at the bottom.

Figure 4.
(a) Three different probe concentrations C1 = 200 nM, C2 = 1 µM, and C3 = 2 µM were tested; (b) Normalized Cint changes with time for control solution and MRSA sample under three different incubation conditions.
Figure 4.
(a) Three different probe concentrations C1 = 200 nM, C2 = 1 µM, and C3 = 2 µM were tested; (b) Normalized Cint changes with time for control solution and MRSA sample under three different incubation conditions.

Figure 5.
Evaluation of sensor’s response to two MRSA samples concentrations (2501.4 and 25,014.1 copies/µL) under three different assay times (10, 20, and 30 s). Further, 10 s is the optimized assay time as it gives the highest response.
Figure 5.
Evaluation of sensor’s response to two MRSA samples concentrations (2501.4 and 25,014.1 copies/µL) under three different assay times (10, 20, and 30 s). Further, 10 s is the optimized assay time as it gives the highest response.

Figure 6.
(a) Response of MRSA and E.coli samples in 0.5 × SSC tested on Au-PCB electrodes incubated with 2 µM of mecA probe. The LOD was determined by adding 3 standard deviations to the average response of the buffer control (0.5 × SSC). (b) Normalized interfacial capacitance changes versus time for E.coli gDNA and MRSA.


Table 1.
Comparison of electrical sensors for S. aureus DNA detection.
| Reference | Technique | Testing Solution | LOD 1 and DNA Size | Dynamic Range | Assay Time | Sensor Portability |
|---|---|---|---|---|---|---|
| [5] | Capacitance measurement | Labeled: Au-nanoparticles | 0.2 nM dsDNA (150 bps) | 0.2–20 nM | 7 m | Not portable (Lab-based) |
| [6] | Cyclic Voltammetry | 10 mM PBS (pH 7.4) with 0.1 M KCl and 5 mM [Fe(CN)6]3−/4− | 57 fM (after PCR) | ------- | 4 h | Not portable (PCR lab based) |
| [7] | DPV 2 | 2 × SSC | 23 pM (after PCR) | 50 to 250 pM | 2 h | Not portable |
| [8] | EIS 3 | 0.1 M PBS containing 5 mM [Fe(CN)6]3−/4− | 100 fM DNA (short) | ---- | 30 m | Not portable (Autolab measurement) |
| This work | Capacitance measurement | 0.5 × SSC | 16 aM (2.8 Mbps) | 0.4 fM–0.4 pM | 10 s | Portable: ABC readout system |
1 LOD: Limit of detection; 2 DPV: Differential pulse voltammetry; 3 EIS: Electrochemical impedance spectroscopy.
Publisher’s Note: MDPI stays neutral with regard to jurisdictional claims in published maps and institutional affiliations. |
© 2021 by the authors. Licensee MDPI, Basel, Switzerland. This article is an open access article distributed under the terms and conditions of the Creative Commons Attribution (CC BY) license (https://creativecommons.org/licenses/by/4.0/).
Share and Cite
MDPI and ACS Style
Oueslati, R.; Jiang, Y.; Chen, J.; Wu, J. Rapid and Sensitive Point of Care Detection of MRSA Genomic DNA by Nanoelectrokinetic Sensors. Chemosensors 2021, 9, 97. https://0-doi-org.brum.beds.ac.uk/10.3390/chemosensors9050097
AMA Style
Oueslati R, Jiang Y, Chen J, Wu J. Rapid and Sensitive Point of Care Detection of MRSA Genomic DNA by Nanoelectrokinetic Sensors. Chemosensors. 2021; 9(5):97. https://0-doi-org.brum.beds.ac.uk/10.3390/chemosensors9050097
Chicago/Turabian StyleOueslati, Rania, Yu Jiang, Jiangang Chen, and Jayne Wu. 2021. "Rapid and Sensitive Point of Care Detection of MRSA Genomic DNA by Nanoelectrokinetic Sensors" Chemosensors 9, no. 5: 97. https://0-doi-org.brum.beds.ac.uk/10.3390/chemosensors9050097
Note that from the first issue of 2016, this journal uses article numbers instead of page numbers. See further details here.