On Identifying the Systemically Important Tunisian Banks: An Empirical Approach Based on the △CoVaR Measures

1
Institut Supérieur de Gestion, University of Tunis, Le Bardo 2000, Tunisia
2
GEF-2A Laboratory, University of Tunis, Le Bardo 2000, Tunisia
3
LAREQUAD, FSEG of Tunis, University of Tunis El Manar, Tunis 1068, Tunisia
*
Author to whom correspondence should be addressed.
Risks 2019, 7(4), 122; https://0-doi-org.brum.beds.ac.uk/10.3390/risks7040122
Submission received: 24 October 2019
/
Revised: 14 November 2019
/
Accepted: 2 December 2019
/
Published: 12 December 2019
(This article belongs to the Special Issue Computational Methods for Risk Management in Economics and Finance)
Abstract
:The aim of this work is to assess systemic risk of Tunisian listed banks. The goal is to identify the institutions that contribute the most to systemic risk and that are most exposed to it. We use the CoVaR that considered the systemic risk as the value at risk (VaR) of a financial institution conditioned on the VaR of another institution. Thus, if the CoVaR increases with respect to the VaR, the spillover risk also increases among the institutions. The difference between these measurements is termed △CoVaR, and it allows for estimating the exposure and contribution of each bank to systemic risk. Results allow classifying Tunisian banks in terms of systemic risk involvement. They show that public banks occupy the top places, followed by the two largest private banks in Tunisia. These five banks are the main systemic players in the Tunisian banking sector. It seems that they are the least sensitive to the financial difficulties of existing banks and the most important contributors to the distress of the other banks. This work aims to add a broader perspective to the micro prudential application of regulation, including contagion, proposing a macro prudential vision and strengthening of regulatory policy. Supervisors could impose close supervision for institutions considered as potentially systemic banks. Furthermore, regulations should consider the systemic contribution when defining risk requirements to minimize the consequences of possible herd behavior.
1. Introduction
Ever since the genesis of the discipline, the quest for comprehending and measuring risk has been of paramount importance among academics. But in light of the large number of crises that have occurred in recent years, greater emphasis has been placed on understanding and managing the systemic risk measure. While this multidimensional concept is widely discussed in an increasing number of papers, there is still no consensus on a unique definition of systemic risk.
Tunisia had always been considered one of the best performers in the Middle East and North Africa (MENA) region, economically and humanely, in the run-up to the 2011 revolution. It was one of the first countries in the region to implement a set of early structural reforms, contributing to the success of the economy in the mid-1990s.
The Tunisian banking sector is composed of 11 deposit banks listed in the Tunisian Stock Exchange. Three of them are public and the participation of the government in their capital is more than 36%. No changes in the number of market players have occurred during the last five years, except for the implementation of a second Islamic bank.
No financial institution, in the Middle East and North Africa region (MENA), has a market share greater than 14% of total assets or loans and 16% of deposits, which is the case of Tunisian financial institutions. These percentages are generally much higher. BIAT, BNA and STB, the three largest banks, hold nearly 50% of total assets, with approximately equal weight. In contrast, for example, in Morocco, the top three banks granted 62% of loans to the economy, and the top five accounted for 81% in 2012 (Khiari and Nachnouchi 2018).
Now Tunisian’s economy is suffering from exceptionally difficult conditions. The debts crises of the European Union have created a slowing down in goods exports, and the 14 January revolution gave rise to a long period of instability, not to mention institutional and political uncertainty. This worsening security situation caused a considerable drop in income in foreign currency from tourism. The Tunisian economy has also been affected by the adverse consequences associated with the Libyan revolution. All Tunisian’s sectors had, and are still undergoing, a challenging transition phase. This post-revolutionary context has especially affected the banking sector, as the ability of Tunisian banks to overcome the financial instability has become a great concern. Indeed, they have become extremely fragile to any adverse shocks.
Improving the efficiency of the banking system and competition in the sector is based on a set of reforms focused on the restructuring of state-owned banks, accounting for 39% of total bank assets, strictly applying banking regulations and revising procedures to deal with the financial problems of banks in financial difficulties.
The determination of systemically implicated financial institutions is a major concern for academics and regulators. Although in the past systemic importance has been associated with the size of the institution as part of the problem of being “too big to fail”, recent financial crises suggest that the situation is more complex. The interconnection of a systemically implicated financial institution is also identified by its interbank market links, and its effects are magnified by a strong leverage effect.
As a result, various empirical measures have been proposed to provide a more realistic view of the systemic importance of a financial institution (Bisias et al. 2012). For example, the Conditional Value at Risk (CoVaR) is the value at risk (VaR) of the financial system contingent on a specific event affecting a given financial institution. The contribution of a company to systemic risk (ΔCoVaR) can be explained intuitively by the difference between CoVaR when the company is in financial difficulty and when the company is not.
In recent years, there has been much research on these measures of systemic risk. The studies first show that definitions of systemic risk measures are not neutral so as to measure the impact of an institution on the overall system. Second, some of these measures are similar to traditional quantile and co-volatility measures. In addition, the primary measures of systemic risk are based primarily on the accuracy of special extreme quantiles of the future yield distribution. In addition, the magnitude of the model is largely underestimated when calculating VaR and other quantities related to the quantile (Boucher et al. 2013), so it is difficult to put in place a correct and reliable risk ranking system (Hurlin et al. 2012).
In this context, as an indicator of the risk level in financial institutions, VaR is widely used because of its simplicity and transparency. However, it only measures the individual risk of financial institutions rather than the contagion and degree of risk spread between financial institutions or financial markets. In 2011, Adrian and Brunnermeier proposed the CoVaR method to measure the condition risk value.
This method can, not only identify the risks of financial institutions, but also solve the problem of quantitative association between two financial institutions, so as to measure the risk spillover of financial institutions to other financial institutions. VaR is generally known as “risk value” or “in risk value”, which refers to the maximum possible loss of a certain financial asset (or portfolio) in a certain period of time under a certain confidence level. If a stochastic variable R represents the return rates of assets, VaRq is defined as the quantile q of the yield R. At present, the simplified method of financial market data (such as stock price, CDS price difference, credit default swap, etc.) is the most commonly used method to measure systemic risk in financial institutions, in which the Marginal Expected Shortfall (MES) and the CoVaR are the most popular and representative methods in the present simplified method.
However, studies on systemic risk measures are still rare in developing economies. Our research seeks to fill this gap by empirically analyzing systemic risk in the Tunisian banking sector in order to determine the most systemically important banks. The principle objective is to propose a classification that expresses, for each bank, its contribution and sensitivity to the risk of the banking system, based on the work of Adrian and Brunnermeier (2011), in which they used CoVaR as a measure for systemic risk. This can provide information about how banks can be subject to stricter supervision and also which banks to prioritize for rescuing, in the event of a financial crisis.
Adrian and Brunnermeier (2011) define the CoVaR as the value at risk (VaR) of a financial institution subordinated to the VaR of another institution. Thereby, if the CoVaR increases with respect to the VaR, the risk of overflow also increases between the institutions. By computing the difference between the two measures as △CoVaR, we will be able to assess the contribution and exposure of every financial institution to systemic risk.
The innovation of this work lies in applying conditional value risk (CoVaR) to the banking field and combining the model CoVaR with the quantile regression model. Taking the 11 listed banking companies in Tunisia as the sample, we combine the CoVaR model and quantile regression model to measure the spillover effect and the level of systemic risk contribution of Tunisian listed banks, so as to provide relevant countermeasures and suggestions for preventing systemic risk.
The rest of the paper is organized as follows. Section 2 serves as a brief literature review. In Section 3, we describe the methodology’s framework and lay out our systemic risk measures: VaR, COVaR and ΔCoVaR estimates. In Section 4, we analyze the principal results and discussions. Lastly, Section 5 has the conclusions, as well as the limitations of our work and future research perspectives.
2. Literature Review
Systemic risk research is mainly from the perspective of crisis, and the systemic risk which is caused by bank run to bank operation is analyzed. Before and after the 1980s, a series of bank crises and high contagion during the crises made the spillover effect of systemic risk widely recognized.
Several researchers have tried to develop more appropriate empirical tools to better measure systemic risk. They believe that the classical measures used, such as beta and value-at-risk, are not effective in assessing global contagion, as has been demonstrated in the recent financial crisis. Indeed, many researchers believe that the most well-known classical risk measure, value at risk, is unable to capture the systemic nature of risk, as it focuses on a single institution. It does not take into account that an institution is part of a complex system that can generate new risks (Danielsson et al. 2011). As a result, it does not take into account the negative impacts associated with decisions made by other institutions.
Thus, the literature shows the emergence of new quantification measures. However, there is still no consensus between academics and regulators on an effective tool that can be used to estimate systemic risk more accurately.
After the financial crisis, there have been many works that have demonstrated deep research on systemic risk and have measured systemic risk by using the CoVaR, MES, CCA and other models. Acharya et al. (2010) used systemic expected shortfall (SES) to measure systemic risk. Their measurement focuses on the propensity of the company to be undercapitalized when the entire financial sector is on the left tail. The marginal expected shortfall (MES), is developed to measure financial institutions’ contributions to systemic risk. Girardi and Ergün (2013) defined the systemic risk of an organization as its change of CoVaR in financial distress, and estimated the links between the system risk contributions and their characteristics of the four financial industry groups. Banulescu and Dumitrescu (2015) used the component expected shortfall (CES) to determine systemically important financial institutions in the United States. They break down the expected deficit and take into account the characteristics of the company. The study covers the period from June 2007 to June 2010 and covers the global financial crisis. The result shows that companies such as AIG, Lehman Brothers and Merrill Lynch, which suffered important losses during the financial crisis, are systemically important institutions. Derbali and Hallara (2015) used the MES model to measure the systemic risk of European financial institutions. Grieb (2015) applied the model of nonlinear factors, and logistic regression model to measure the potential impact of hedge funds on systemic risk. Her results show that the systemic risk of hedge fund is increasing. Reboredo and Ugolini (2015) used CoVaR method to measure the systemic risk of the European sovereign debt markets after the Greek debt crisis, and found that systemic risks are similar in all countries before the crisis, and the decoupling of the debt market and the systemic risk were reduced on the whole in the European debt market after the outbreak of the crisis. Brownlees and Engle (2017) used SRISK to measure the system risk contribution of financial firms. They offered a ranking of institutions in the different crisis stages.
To study the exposure and contribution of systemic risk in financial institutions to financial market, Lin et al. (2016) utilized different risk measures such as SRISK, MES, CoVaR and other methods. Karimalis and Nomikos (2017) researched the contribution of systemic risk in European large banks by adopting the model of Copula and CoVaR. More recently, Di Clemente (2018) adopted a model based on extreme value theory (EVT) to analyze the contribution of individual financial institution to the risk of the system, and showed the connection between a single financial institution and the financial system
Some Chinese scholars use CoVaR of the introduction of state variables to make an empirical analysis for the systemic risk in 14 Chinese listed banks, and the results show that there is significant systemic risk spillover in the listed commercial banks of China; some use the method CoVaR to measure the systemic risk of the banking industry, and put forward the corresponding suggestions for risk supervision; some have adopted the method CES to measure the systematic risk of the 14 listed Chinese banks and have investigated the relationship between income of non interest and systemic risk; and others use the quantile regression model of risk spillover effect to calculate and compare the CoVaR value of 15 commercial banks, and find that the banking industry will have a systemic risk spillover effect in the event of a crisis.
In addition, △CoVaR is not perforce symmetrical (i.e., the institution’s VaR contribution to the institution’s market risk j does not necessarily correspond to the VaR contribution of j’s VaR to i’s VaR), as shown by Adrian and Brunnermeier (2011). CoVaR’s advantage is that it can be used with any other tail measure to assess other risks. For example, Chan-Lau (2009) follows a similar approach and evaluates systemic credit risk by measuring the dependency of financial institutions on default risk through a CDS spread analysis of 25 financial institutions in Europe, in Japan and the United States. Likewise, Gauthier et al. (2010) compare some other approaches to △CoVaR to determine banks systemic capital requirements with reference to every bank’s contribution to systemic risk. They conclude that financial stability can be significantly improved by implementing a banking regulatory system.
Table 1 below presents a summary of the various works cited above. Thus, it indicates for each author the context treated as well as the systemic risk measures adopted and the results obtained.
3. Material and Methods
This section presents the methodology used in this paper. Our main objective is to classify the Tunisian banks according to their involvement in the systemic risk. The first part presents an overview on the Tunisian banking sector. In the second part, we present the filtered historical simulation that we use to compute the VaR. The second part explains conditional value at risk (CoVaR) that we use to measure systemic risk and briefly discuss the quantile regression employed to estimate our systemic risk measure. In the last part, thanks to CoVaR, we assess the contribution of the bank to the overall risk (ΔCoVaRqsys/i) as well as its exposure to aggregate shocks (ΔCoVaRqi/system). Second, based on CoVaR’s estimates we construct systemic risk cartography that allowed for putting forward the Tunisian banks systemic risk involvement.
3.1. Overview of Tunisian Banking Sector
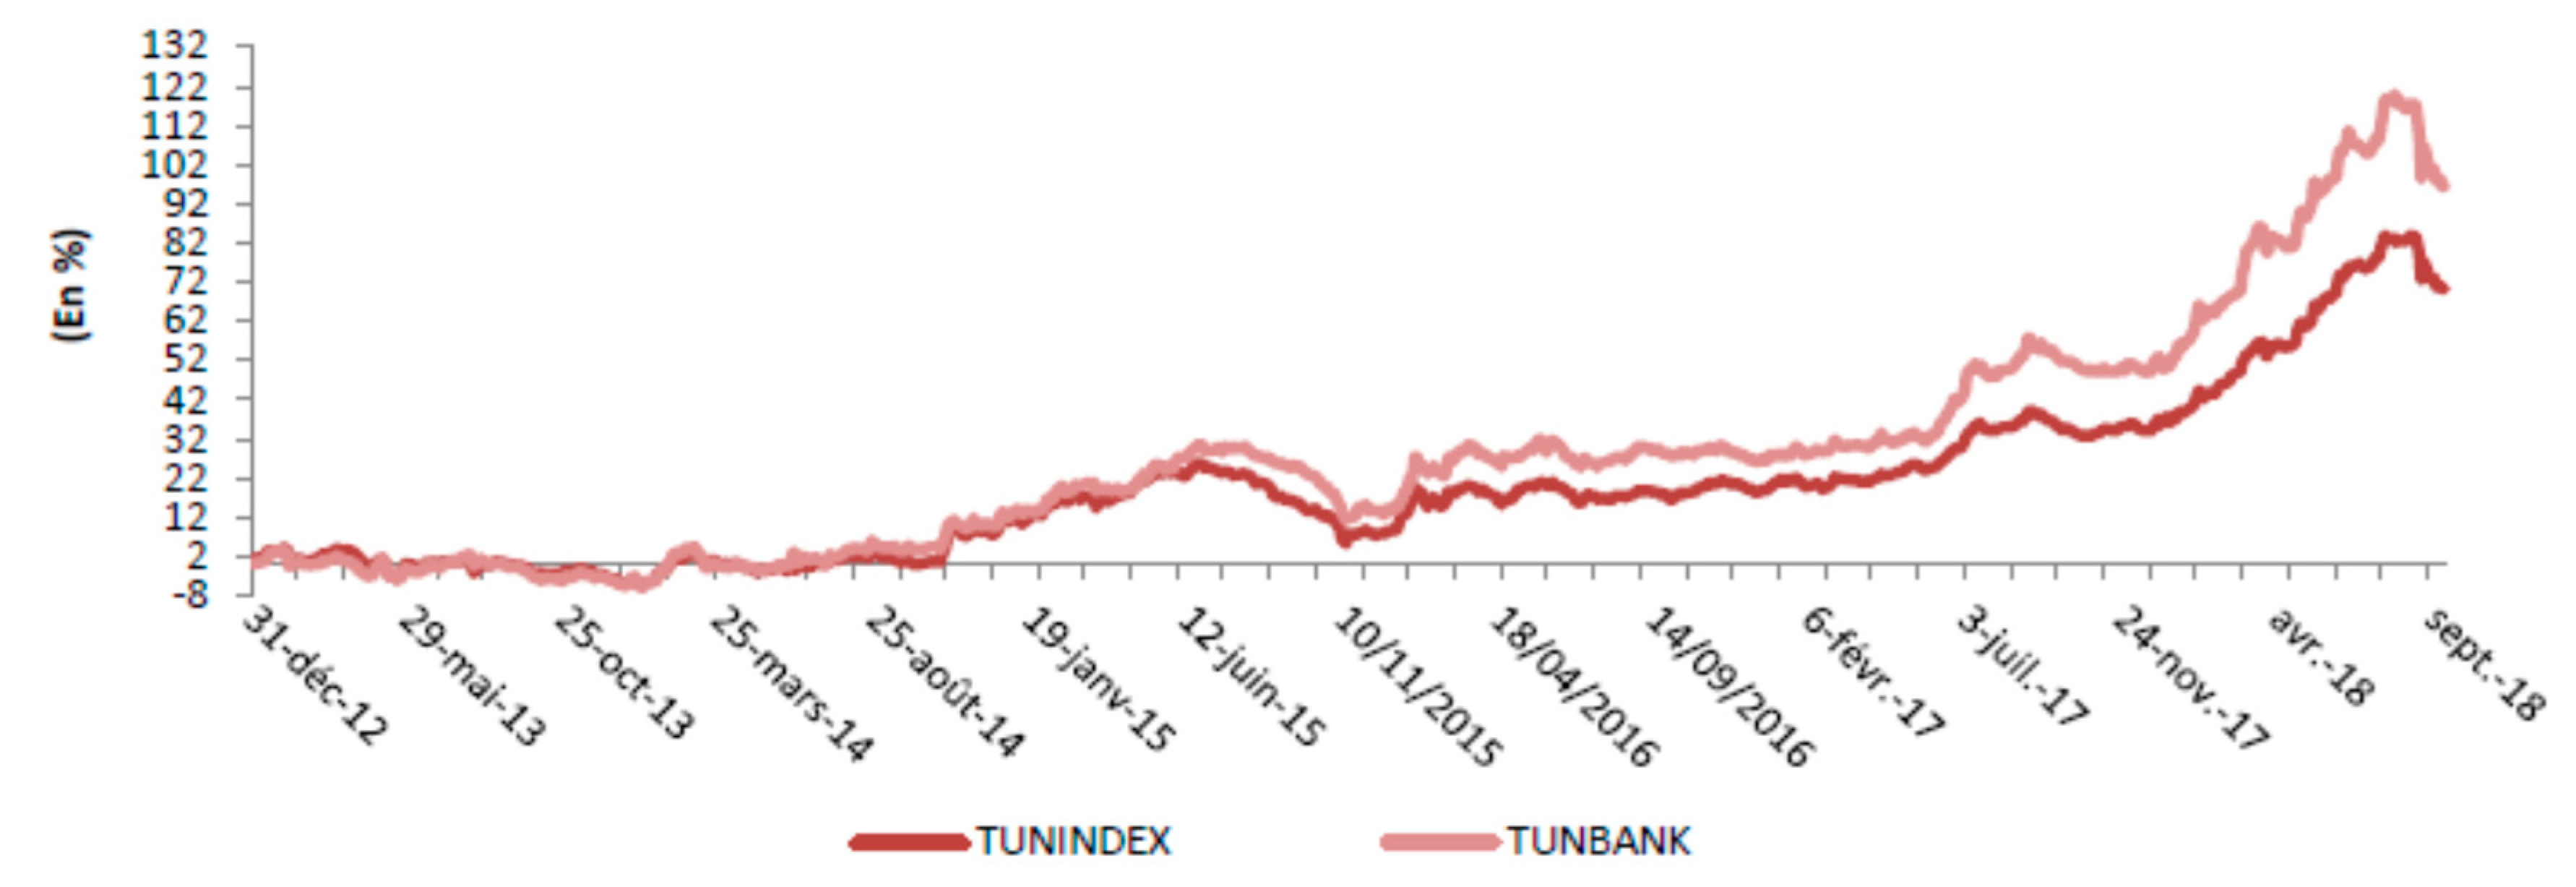
According to Hammami and Boubaker (2015), the banking sector is the lung of economic activity. This is the case of Tunisia, where the economy is a debt-based economy. Indeed, the equilibrium of the banking system is a health status barometer of the whole economy. Tunisian banks occupy a considerable place in the financial sphere, as seen by the strong synchronization of the evolution of the TUNINDEX index with that of the TUNBANK1, as shown in the following Figure 1.
In recent years, the banking sector has shown a disengagement from the state because of the introduction of foreign banks to the local banking market and the entry of foreign investors into the shareholding of local banks. The report of the Tunisian Central Bank (Banque Centrale de Tunisie 2012) classifies the bulk of banks into three categories: Banks with a strong participation of the State (Banque Nationale Agricole (BNA) for financing of agricultural sector, Socièté Tunisienne des Banques (STB) which finances the touristic sector and the Small and Medium Enterprises and Banque de l’Habitat (BH) for housing finance) (Blanco et al. 2014); Tunisian private-owned banks (Banque Internationale Arabe de Tunisie (BIAT) Banque de Tunisie (BT), Amen Bank and Banque de Tunisie et des Emirats (BTE)) and foreign-owned banks (Union Internationale de Banques (UIB), Union Bancaire pour le Commerce et l’Industrie-(UBCI) BNP Paribas, Attijari Bank and Arab Tunisian Bank (ATB)). Private and mixed-capital banks account for 70% of the Tunisian banking sector, although the role of public banks in financing the economy remains pre-emptive. In this banking network, there are 11 banks enjoying a certain popularity among Tunisians and are thus listed on the Tunisian stock market.
The central bank of Tunisia remains the only one responsible for the regulation of the banking activity. It has a role in overseeing monetary policy, supervising credit institutions as well as preserving the stability and security of the financial system. The Tunisian banking system is continuous, well-planned, well-developed and dynamic. At the beginning of the 1990s, the Tunisian banking sector had opened up on an international scale. This idea of liberalization, disintermediation, and disclosure among development banks; and between the deposit banks and the development banks to set up the universal bank, known as the “do-it-all” bank, was held on 10 July 2001.
With the political and economic uncertainty since January 2011, the Tunisian banking sector has undergone certain development, which has affected the situation of the Tunisian market. In this sense, Blanco et al. (2014) argue that this disturbance situation has threatened the viability of the banking sector, which has penalized Tunisian banks.
The rating assigned to Tunisia by the global rating agencies has a downward trend. In fact, just four days after the outbreak of the revolution, the rating agency “Fitch” located 6 Tunisian banks (ATB, BH, STB, BNA, BH, BIAT, and AB) under supervision with a negative implication. Then, in February 2013, “Standard and Pοοr’s” lowered the rating of two banks: ATB from BB to BB– (no longer speculative) and BH went from BB– to B+ (BH went from speculative to very speculative). Then, in March 2013, “Moody’s” dropped the ratings of five Tunisian banks: AB went from Ba2 to Ba3, ATB lost two notches to move from Baa3 to Ba2, BT and BIAT became more speculative by being awarded Ba2 instead of Ba1, and the STB went from Ba2 to B1. Finally, in 2018, the “Mοοdy’s” rating agency degraded the five Tunisian banks: AB, ATB, BT, BIAT and STB, with prospects going from stable to negative.
This decline was explained by deterioration in the macroeconomic environment of the banks, which supports not only the quality of their assets, their benefits, but also their capitalization. This situation emerged as a major dilemma in the banking sector called “Banking Run”. Jouini and Saidane (2014) described the phenomena experienced by Tunisian banks as a panic crisis that represents massive liquidity withdrawals. In fact, the banking sector has remained frozen in a period of risk acceleration. For this reason, Blanco et al. (2014) believe that Tunisian authorities have been forced to intervene in the system to improve banking supervision, where 38% of bank assets are held by state-owned banks and bankruptcies leading to the appearance of systemic risk.
3.2. Data Description
The sample used includes publicly listed Tunisian banks which represent 92.51 % of total assets of the banking sector in Tunisia. Our panel contains a total of 11 banks. Unlike previous studies, which used weekly data (Khiari and Nachnouchi 2018), the daily closing price data of eleven listed banks and the banking industry index were selected to measure the systemic risk of Tunisian’s bank industry from 2 January 2010 to 31 December 2018.
Tunisian’s economy is suffering from exceptionally difficult conditions. The debts crises of the European Union have created a slowing down in goods exports, and the January 14th revolution gave rise to a long period of instability, not to mention institutional and political uncertainty. This worsening security situation caused a considerable drop in income in foreign currency from tourism. The Tunisian economy has also been affected by the adverse consequences associated with the Libyan revolution. All Tunisian’s sectors had, and are still undergoing, a challenging transition phase. This post-revolutionary context has especially affected the banking sector, as the ability of Tunisian banks to overcome the financial instability has become a great concern. Indeed, they have become extremely fragile to any adverse shocks.
The sample period covers the whole period of subprime crisis, the January 14th revolution and the macroeconomic regulation and control of Tunisian government.
The closing price of each bank is converted to the form of logarithmic yield. The formula is:
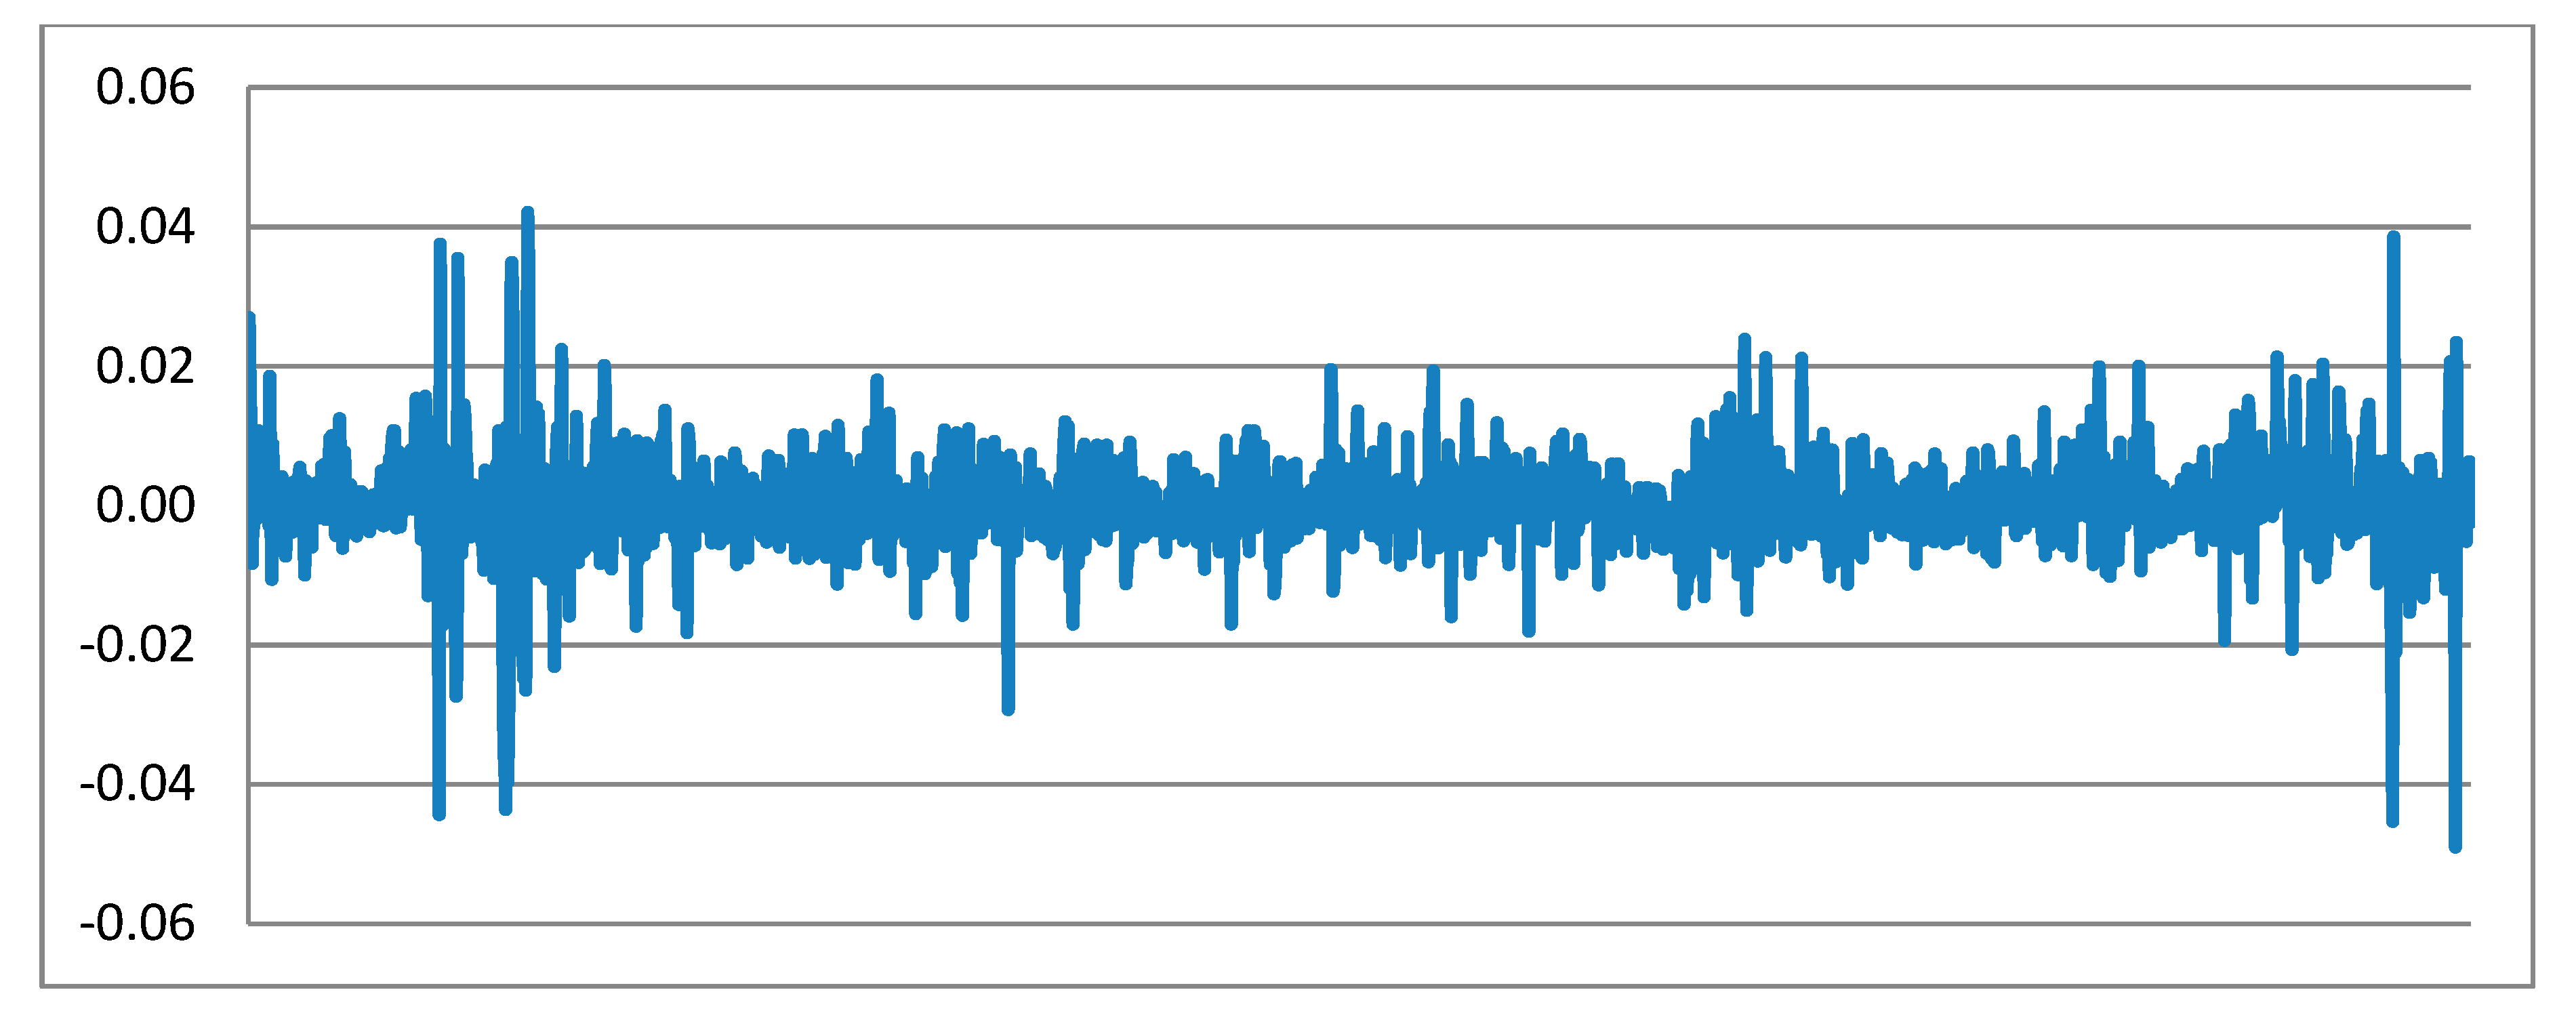
Figure 2 and Table 2 show, respectively, the time series of stock return of the TUNBANK index and descriptive statistics of the 11 Tunisian banks of our panel.
The majority of banks have negative means, with the exception of four banks: BNA, ATTIJARI, BIAT and UIB. This perfectly reflects the financial difficulties encountered by Tunisian banks. Since this centrally trending statistical measure is very sensitive to extreme values and can be highly contaminated by outliers, we have computed the adjusted mean. The latter compensates this measurement by omitting a predetermined percentage of values on the tails and computes the mean using the other observations.
The asymmetric coefficients show the asymmetry of the yield distributions. Indeed, four banks (BIAT, BNA, STB and BTE) are skewed to the right because they have a positive asymmetry. However, BT, UBCI, TIJARI, BH, AB, AB, UIB and ATB have a negative bias. They are therefore skewed to the left. These banks tend to have extreme negative values. All banks have high kurtosis values, which show the non-normality of their yield series. For UBCI, AB, BH and BT, an examination of their standard deviation, asymmetry and kurtosis shows that these banks have the highest values for these three indicators. They are therefore the most asymmetrical and have the widest gap between the lowest and highest yields. We can therefore conclude that their returns are very far from the average.
This conclusion shows the importance of the third and fourth moments of the distributions. For this reason, we have been tempted to go beyond the limited use of VaR and go further in the calculation of CoVaR, since it provides more information on the distribution of yields in the tail.
3.3. VaR Estimation
We use the filtered historical simulation for the calculation of the value at risk (VaR) as it ensures a good estimates quality. According to Paolella and Taschini (2008) this method is highly effective. Indeed, it adapts perfectly to non-normal distributions, and hence, deals with asymmetric distributions and volatility clustering. It is relatively simple to apply and requires no hypothesis regarding the distribution of returns. This semi-parametric method was presented for the first time by Adesi et al. in 1999. It is a combination of parametric models of conditional volatilities and nonparametric methods of simulations.
The residuals are processed using the GARCH filter in order to deal with heteroscedasticity. Then, the standardized residual returns from the dataset are scaled in an ascending order. Here, we are interested mainly in the 5% and 50% quantiles. VaR95% and VaR50% correspond respectively to the worst 112 days and the worst 1117 days over the course of the sample. The VaR of bank i at quantile q is
where in µt is the expected returns and ht refers to the standardized variances.
Applying (1) we get a series of weekly VaRiq. The average VaRiq,t estimates are presented in Table 3.
It appears that the bank with the largest VaR is the UBCI. Conversely, UIB exhibits the lowest expected losses.
3.4. CoVaR Estimation
To measure market risk codependence, we use quantile regression since it offers a deeper analysis than ordinary least squares. It is also known for its simplicity and robustness in exploring relationships between variables evaluated in extreme quantiles. In fact, it takes into consideration the non-linearity of the dependencies between the yields. Furthermore, quantile regression does not require assumptions about the distribution of variables because it is a non-parametric method. Therefore, it avoids the inherent bias in the assumptions of the distributions on parametric methods.
We compute the regression coefficient αqi and βqi using the following equation:
Xqi,sys = αqsys + βqsysXsys
With Xqi,sys: the return of the bank I at quantile q conditional to the return of the banking system
Xi: the return of the banking sector.
Applied to the CoVaR, this method leads to the estimation of the loss of bank i when the system is facing an extreme event using the following expression:
where VaRq,ti: VaR of institution i at q%.
The average CoVaRq,t sys/Xi=VaRq is shown in Table 4.
As seen in Table 4 the bank that faces the largest losses if the banking sector is in financial distress is the UBCI.
The contribution of bank i to systemic risk is:
ΔCoVaRqsys/i = CoVaR qsys/Xi=VaR q − CoVaR qsys/Xi= Mdian
Finally, the exposure of a financial institution to system wide distress is:
ΔCoVaRqi/system = CoVaRqi/Xsystem=VaRq − CoVaR q i/Xsystem=Med
We estimated the average ΔCoVaR to identify the most exposed and systemic entities in terms of market risk, across the sample. Table 5 presents the results obtained for the ΔCOVaR’s measures. Values included in the first column are the average contribution of each bank to systemic market risk whereas the second represents the opposite relation as it corresponds to the average exposure of the system’s stress to individual bank. In this sense, the former identifies the most contributor banks to the systemic market risk, while the latter allows us to recognize the most exposed banks to the system’s risk.
According to these results, it appears that UBCI is the most important contributor to system’s risk, since it has the most negative ΔCoVaRsys/i. Hence, it can be claimed that this bank has a significant influence on the banking system. Moreover, BTE is the most vulnerable bank to sector’s risk. It is closely followed by the BH, ATB, BNA and the STB. Thus, it can be asserted that public banks are the most vulnerable to the banking sector’s financial distress. Also, it is important to note that the least exposed entity is the one among those presenting the lowest contribution (the second lowest contribution) to the sector’s systemic risk, namely the BIAT.
3.5. Back Testing
The calculation of the CoVaR depends on the VaR of the different institutions. Thus, to ensure the accuracy of the CoVaR, it is essential to test the VaR of all banks before calculating the CoVaR. The next step in our work is to evaluate the accuracy of the model specification in the estimation of the VaR. According to the Basel Committee on Banking Supervision (2010), the back-test is a statistical means allowing for validating a model by simply comparing actual results to expected results. According to Philippe (2007) a model of VaR must allow us to anticipate the future with precision. The most common tests used to test the VAR model are the ones of Kupiec (1995) and Christoffersen (1998). Kupiec (1995) uses the unconditional coverage test to check whether the numbers of exceptions in the VaR model conform to the confidence interval on which the VaR is defined. An exception is a case where the actual loss is greater than the estimated VaR. According to the Kupiec test, a perfect model of VaR is the one where the expected number of exceptions is equal to the real exceptions. In addition to the number of exceptions, Christoffersen (1998) has also tested the dispersion of exceptions. He shows that a VaR model with clustered exceptions is not considered as an exact model because it will not consider correlations and market volatility. In this work, we compute Kupiec (1995)’s Likelihood Ratio (LR) tests on the empirical failure rates in order to assess the performance of our model.
Results are presented in Table 6 below:
As shown in this table, the computed values are the Kupiec LR test, the failure/success rate, p-values and the expected shortfall (ESF) with significance level, α = 0.0025, 0.005, 0.01, 0.025, 0.05 and α = 0.95, 97.5, 0.99, 99.5, 99.75 for long and short positions respectively. The objective is to check whether the failure/success rate of the model is statistically equal to the expected one. The success rate for short position refers to the percentage of positive returns larger than the VaR prediction, while the failure rate for the long position is the percentage of negative returns smaller than the VAR prediction.
The results show that the model performs very well. Indeed, the Kupiec LR test’s p-values show that the model accurately predicts VaR for all cases (long and short positions and at all confidence levels). This result clearly shows that the model is able to capture the reality of the Tunisian banking sector.
4. Discussion: The Positioning of Tunisian Banks Based on Their Systemic Risks’ Implication
The CoVaRs, as calculated in the previous section, are used to provide a comprehensive and unified statistical profile of all Tunisian Banks according to their implication level (contribution and exposure) in systemic risk. Thus, we set a detailed map to show the relative positioning of all banks according to their implication into systemic risk.
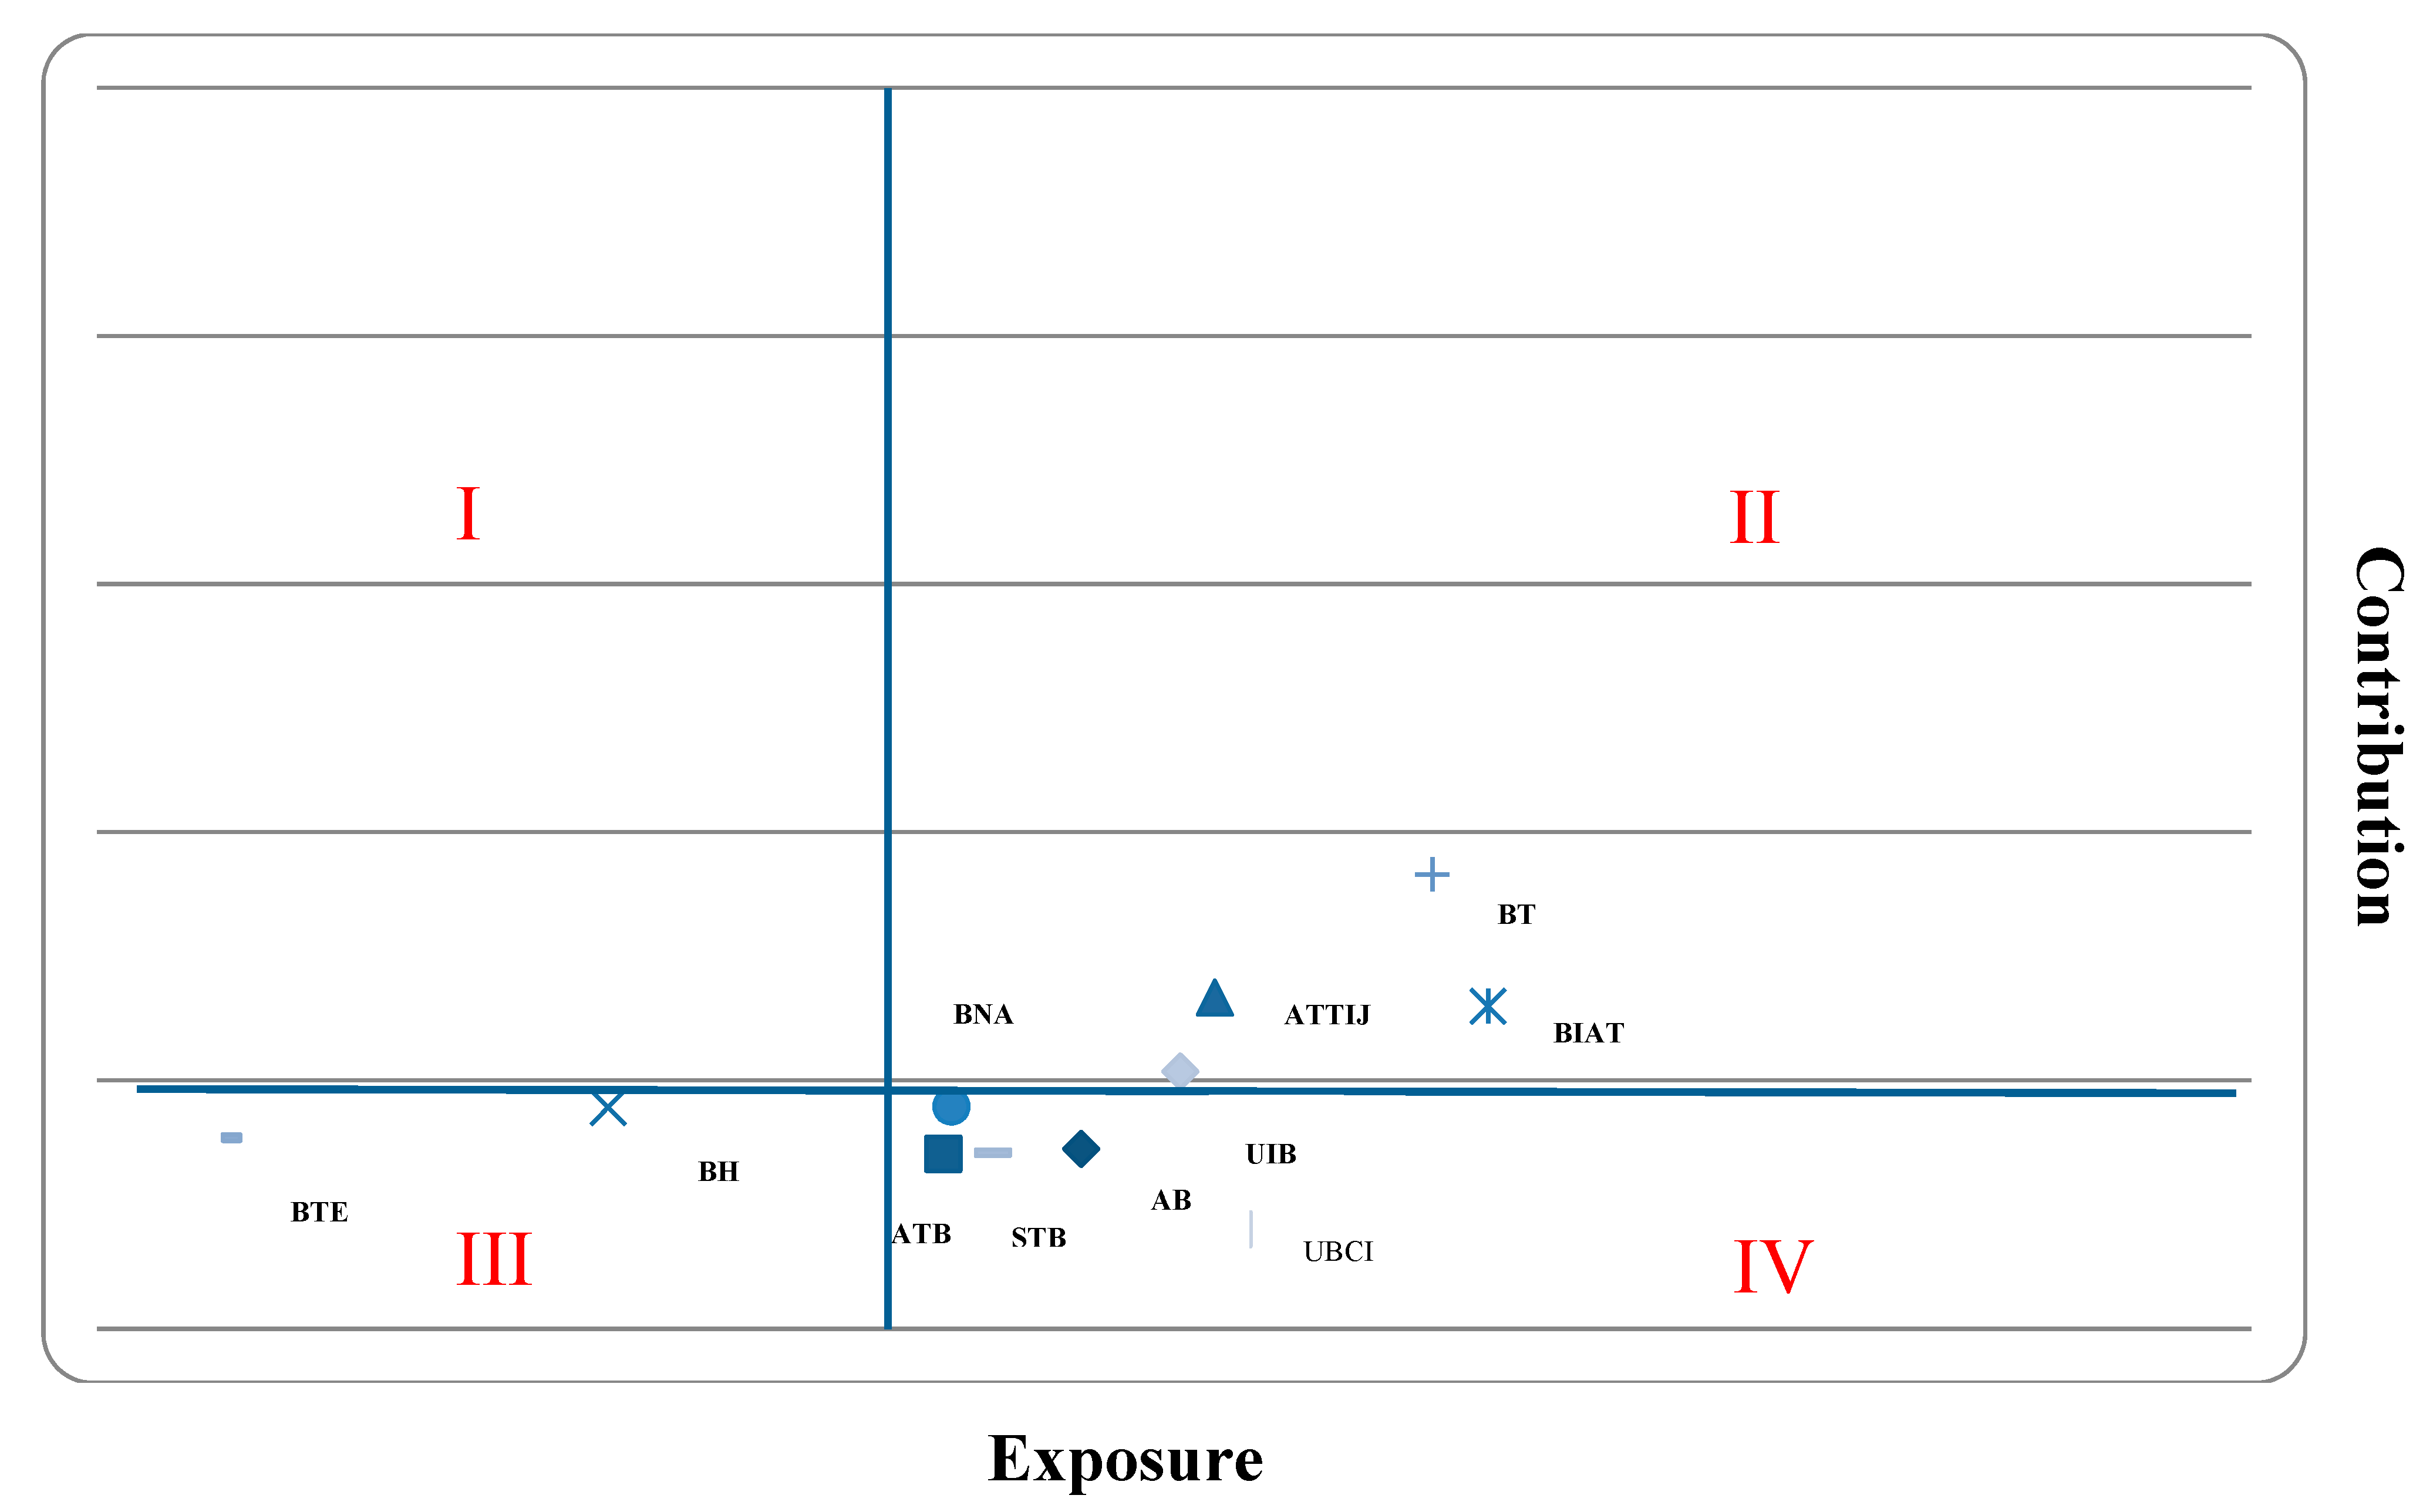
In our case, we choose two dimensions that express the implication of each bank in systemic risk. As shown in the Table 7, The first dimension (horizontal axis) indicates the bank’s exposure (ΔCoVaRi/sys) and the second (vertical axis) points to the contribution of banks to the system risk.
From the point of view of the graphical representation, this leads to a space where each bank is marked by a dot and scaled according to its involvement in systemic risk. Figure 3 is the map that has been recovered from the confrontation of the two axis (dimensions).
In order to interpret this map, we choose to divide it into four zones according to the implication degree of each bank in the systemic risk. This repartition is established using the mean of each series of ΔCoVaR calculated for all the banks of the sample. The Formula used is: (min ΔCOVaR + max ΔCoVaR)/2 Or: ∑ ΔCoVaR/11.
The results for the two formulas are given by the following Table 8. As shown in this table, the two methods give approximately the same results:
- Zone I:
- The lowest contributor and the highest exposed;
- Zone II:
- The lowest contributor, the lowest exposed;
- Zone III:
- The highest contributor and the highest exposed;
- Zone IV:
- The highest contributor and the lowest exposed;
A first look on this cartography shows the existence of two dimensions. The first dimension represents the banks’ contribution to systemic risk. It indicates the systemic potential of the bank. The second dimension is related to banks’ sensitivity to systemic risk.
It seems that the banks located in Zones III and IV are the most productive banks of systemic risk. This implies that they contribute more to systemic risk than those in other areas. We can also conclude that banks in Zones II and IV face less loss in the event of default by banks other than those in Zones I and III. This particular reading makes it possible to conclude from the existence of the notion of domination. Indeed, the graph shows two groups of banks. Banks belonging to the zones I and III can be considered as dominated banks as they have the highest exposure levels. These banks seem to be very sensitive to the systemic risk of other banks. Banks belonging to Zones III and IV are the dominating banks as they have the highest contributor levels. These banks seem to impose important systemic risk to others banks.
The results of this mapping (Figure 3) allows us to divide banks according to their involvement in systemic risk.
The results from this cartography (Figure 3) allowed us to establish a distribution of banks based on their involvement in systemic risk. According to this figure, the public banks (STB, ATB and BNA), located in Zone IV, occupy the first three places because they are closest to the vertical axis. They are followed closely by the two main Tunisian private banks, UBCI and AM. These five banks are the main systemic players in the Tunisian banking sector. It seems that they are the least sensitive to the financial difficulties of other banks and the biggest contributors to the distress of existing banks. Then there is the public bank BH (located in Zone III). It should also be noted that BH and BTE are the most involved banks, as they are located furthest to the left. According to this map the BTE and BH are substantially involved in systemic risk as they represent the important ΔCoVaR sys/i and ΔCoVaRqi/system measures.
On the other hand, BIAT and BT exhibit, relatively, the smallest contribution and exposure measures as they are situated the most to the right and top; hence they are less concerned by systemic risk.
What emerges from these results, is that those banks are the largest systemic players among the Tunisian banks. These results involve, among other things, a rethinking of risk management practices of these banks.
Indeed, regulators not only lack effective risk control measures for individual banks, but also lack an effective regulatory framework to detect and measure the spread of the overall risk spillover of the banking sector. Consequently, this shows the limits of regulation and supervisory practices to effectively manage risks to financial system soundness. Indeed, systemic risk and spillover of the banking sector have had an impact on the stability of the banking sector in the country and all over the financial system. To avoid any systemic risk, it is essential that regulators strictly supervise the banking sector in terms of micro and macro design.
First, there is a systemic risk contagion effect in the Tunisian banking sector, which has a significant impact on the financial market and the economy as a whole. There is a need to monitor risks and prevent them from micro and macro perspectives. Macro prudential surveillance should be strengthened and the systemic financial crisis caused by the increase of the risk contagion effect should be avoided. Differentiated management should be carried out according to the impact of Tunisian banks, and stricter supervision should be imposed to ensure the stability of the entire banking sector and thus prevent the spread of financial risks in the event of a crisis.
Then accelerate the daily risk management. Regulators should pay particular attention to the systemic risk contagion effect of Tunisian banks, focus on monitoring the operational risk of systemically important banks and strictly protect themselves from extreme risks, then pass them on to other secondary financial markets. For individual banks, they should not only focus on their own internal risks, but also be concerned about their risk being passed on to other financial institutions and constantly improve their risk control capabilities. Listed banks should optimize their portfolios and minimize the spillovers of systemic risk with reference to scientific judgment of the macroeconomic situation.
The distribution of Tunisian banks in terms of systemic risk involvement provided by this map adds a broader perspective to the micro prudential application of regulation that includes contagion and then formulates a macro prudential vision and strengthens regulatory policy. Supervisors could impose close supervision for institutions considered to be potentially systemic banks. In addition, regulations should take into account the systemic contribution when designing risk requirements in order to minimize the adverse consequences of possible herd behavior.
5. Conclusions
This work aims to analyze systemic risk among Tunisian listed banks to determine the most contributors and exposed institutions to the systemic risk.
In this paper, we use filtered historical simulation to estimate the VaR to compute the CoVaR using quantile regressions. These CoVaR estimates are selected to measure the contribution of the bank to the overall risk (ΔCoVaRqsys/i) as well as its exposure to aggregate shocks (ΔCoVaRqi/system). Based on CoVaR estimates, we set a perceptual map that allows us to explain and revise banks systemic risk in the Tunisian context.
Results suggest that the BTE and BH are substantially involved in systemic risk as they represent the important ΔCoVaRsys/i and ΔCoVaRqi/system measures. On the other hand, BT and BIAT exhibit the smallest contribution and exposure measures, and hence they are the less concerned by systemic risk.
According to CoVaR estimates, public banks occupy the top positions, followed by the two largest private banks in Tunisia. These five banks are the main systemic players in the Tunisian banking sector. It seems that they are the least sensitive to the financial difficulties of other banks and the most important contributors to the distress of existing banks.
This study proposes a distribution of Tunisian banks in terms of systemic risk involvement. It aims to add a broader perspective to the micro prudential application of regulation including contagion, proposing a macro prudential vision that strengthens regulatory policy. Supervisors could impose close supervision for institutions considered to be potentially systemic banks. Furthermore, regulations should consider the systemic contribution when defining risk requirements to minimize the consequences of possible herd behavior.
However, it is important to mention that some shortcomings must be considered. First, the estimation error of the quantile regression increases substantially in the extreme quantile of the distribution. In addition, it is impossible to measure VaR accurately, which makes CoVaR estimates less accurate. Furthermore, CoVaR as regulatory policy tool is not able to differentiate between contagious and infected banks. Second, this measure is very sensitive to current changes in VaR estimates. As a result, companies that have portfolio returns that change more, seem to be more systemic than those with more stable yield and higher positions in these investments. Improvements in estimation are needed to address these gaps and can be considered as an interesting future avenue of research.
Author Contributions
Conceptualization, W.K.; methodology, W.K.; software, S.B.S.; validation, S.B.S.; formal analysis, W.K.; investigation, S.B.S.; resources, W.K. and S.B.S.; data curation, W.K. and S.B.S.; writing—original draft preparation, W.K.; writing—review and editing, W.K.
Funding
This research received no external funding.
Conflicts of Interest
The authors declare no conflict of interest.
References
- Acharya, Viral V., Lasse H. Pedersen, and Thomas Philippon. 2010. Measuring Systemic Risk. Working paper. New York, NY, USA: New York University. [Google Scholar]
- Adrian, Tobis, and Markus Brunnermeier. 2011. CoVaR. Federal Reserve Bank of New York Staff Report, No. 348. New York: FRBNY. [Google Scholar]
- Banque Centrale de Tunisie. 2012. Rapport Annuel. Rapport de la Banque Centrale de Tunisie, Tunisie. Available online: https://www.bct.gov.tn/bct/siteprod/documents/rapport2012.pdf (accessed on 11 December 2019).
- Banque Centrale de Tunisie. 2018. Périodique de Conjoncture. Rapport de la Banque Centrale de Tunisie, No. 121. Tunisie. Available online: https://www.bct.gov.tn/bct/siteprod/documents/Conjoncture_fr.pdf (accessed on 11 December 2019).
- Banulescu, Georgiana-Denisa, and Elena-Ivona Dumitrescu. 2015. Which are the SIFIs? A Component Expected Shortfall approach to systemic risk. Journal of Banking & Finance 50: 575–88. [Google Scholar]
- Basel Committee on Banking Supervision. 2010. Basel III: A Global Regulatory Framework for more Resilient Banks and Banking Systems. Basel: Bank for International Settlements, Available online: https://www.bis.org/publ/bcbs189_dec2010.pdf (accessed on 11 December 2019).
- Bisias, Dimitrios, Mark Flood, and Stavros Valavanis. 2012. A Survey of Systemic Risk Analytics. Annual Review of Financial Economics 4: 255–96. [Google Scholar] [CrossRef] [Green Version]
- Blanco, Karim, Belgheith Haifa, Neira Kaouach, and Ines Khouaja. 2014. Le Secteur Bancaire Tunisien: Evolution, Perspectives et Défis. Tunis: La revue bancaire Amen Invest, intermédiaire en bourse. [Google Scholar]
- Boucher, Christophe, Jon Danielsson, Patrick Kouontchou, and Bertrand Maillet. 2013. Risk Model-at-Risk. Journal of Banking and Finance 44: 72–92. [Google Scholar] [CrossRef]
- Brownlees, Christian, and Robert F. Engle. 2017. SRISK: A Conditional Capital Shortfall Measure of Systemic Risk. The Review of Financial Studies 30: 48–79. [Google Scholar] [CrossRef]
- Chan-Lau, Jorge. 2009. Default Risk Codependence in the Global Financial System: Was the Bear Stearns Bailout Justified? In The Banking Crisis Handbook. Edited by Greg N. Gregoriou. New York: McGraw Hill. [Google Scholar]
- Christoffersen, Peter F. 1998. Evaluating interval forecasts. International Economic Review 39: 841–62. [Google Scholar] [CrossRef]
- Di Clemente, Annalisa. 2018. Estimating the Marginal Contribution to Systemic Risk by a CoVaR-model Based on Copula Functions and Extreme Value Theory. Economic Notes 47: 1–44. [Google Scholar] [CrossRef] [Green Version]
- Danielsson, Jon, Kevin R. James, Marcela Valenzuela, and Ilknur Zer. 2011. Model Risk of Systemic Risk Models. Working paper. London, UK: London School of Economics. [Google Scholar]
- Derbali, Abdelkader, and Slaheddine Hallara. 2015. Systemic risk of European financial institutions: Estimation and ranking by the Marginal Expected Shortfall. Research in International Business & Finance 37: 32–40. [Google Scholar]
- Duan, Xiaohua. 2019. Systematic Risk Measurement Based on CoVaR Model. International Journal Of Circuits, Systems And Signal Processing 13: 243–50. [Google Scholar]
- Gauthier, Céline, Alfred Lehar, and Moez Souissi. 2010. Macroprudential Regulation and Systemic Capital Requirements. Working Paper 2010-4. Ottawa, ON, Canada: Bank of Canada. [Google Scholar]
- Girardi, Giulio, and A. Tolga Ergün. 2013. Systemic risk measurement: Multivariate GARCH estimation of CoVaR. Journal of Banking & Finance 37: 3169–80. [Google Scholar]
- Grieb, Frederik. 2015. Systemic Risk and Hedge Funds. Social Science Electronic Publishing 49: 235–340. [Google Scholar] [CrossRef]
- Hammami, Yosra, and Adel Boubaker. 2015. Ownership structure and Bank Risk-Taking: Empirical Evidence fron the Middle East and North Africa. International Business Research 18: 271. [Google Scholar] [CrossRef] [Green Version]
- Hmissi, Bochra, Azza Bejaoui, and Wafa Snoussi. 2017. On identifying the domestic systemically important banks: The case of Tunisia. Research in International Business and Finance 42: 1343–54. [Google Scholar] [CrossRef]
- Hurlin, Christophe, Sébastien Laurent, Rogier Quaedvlieg, and Stephan Smeekes. 2012. Ranking the Systemic Risk Measures. New York: Mimeo. [Google Scholar]
- Jouini, Elyes, and Dhafer Saidane. 2014. Système bancaire en Tunisie: État des lieux et perspective. contribution à l’ouvrage dirigé par Elyès Jouini: Tunisie L’espoir: mode d’emploi pour une reprise. Tunis: Cérès éditions. [Google Scholar]
- Karimalis, Emmanouil N., and Nikos K. Nomikos. 2017. Measuring Systemic Risk in the European Banking Sector: A Copula CoVaR Approach. European Journal of Finance 24: 944–75. [Google Scholar] [CrossRef] [Green Version]
- Khiari, Wided, and Jamila Nachnouchi. 2018. Banks’ systemic risk in the Tunisian context: Measures and Determinants. Research in International Business & Finance 45: 620–31. [Google Scholar]
- Kupiec, Paul, and Levent Güntay. 2016. Testing for Systemic Risk Using Stock Returns. Journal of Financial Services Research 49: 203–27. [Google Scholar] [CrossRef]
- Kupiec, Paul. 1995. Techniques for verifying the accuracy of risk measurement models. The Journal of Derivatives 3: 73–84. [Google Scholar] [CrossRef]
- Lin, Edward M. H., Sun Edward, and Yu Min Teh. 2016. Systemic Risk, Interconnectedness, and Non-core Activities in Taiwan Insurance Industry. Annals of Operations Research 12: 1–25. [Google Scholar]
- Paolella, Marc S., and Luca Taschini. 2008. An Econometric Analysis of emission Allowances Prices. Journal of Banking and Finance 32: 2022–32. [Google Scholar] [CrossRef] [Green Version]
- Philippe, Jorion. 2007. Value at Risk: The New Benchmark for Managing Financial Risk. New York: McGraw-Hill, p. 3. [Google Scholar]
- Reboredo, Juan C., and Andrea Ugolini. 2015. Systemic risk in European sovereign debt markets: A CoVaR-copula approach. Journal of International Money & Finance 51: 214–44. [Google Scholar]
| 1 | TUNBANK (Tunis Bank) is the stock market index exclusively for the Tunisian banking sector which contains the 11 banks listed on the stock market. |
Figure 1.
Evolution of the TUNINDEX and TUNBANK during the period 31 December 2012–September 2018. Source: Periodic Conjuncture Report N°121–October 2018, Tunisian Central Bank (Banque Centrale de Tunisie 2018).
Figure 1.
Evolution of the TUNINDEX and TUNBANK during the period 31 December 2012–September 2018. Source: Periodic Conjuncture Report N°121–October 2018, Tunisian Central Bank (Banque Centrale de Tunisie 2018).

Figure 2.
Time series of stock return of the TUNBANK index.

Figure 3.
The positioning of Tunisian banks based on their systemic risks’ implication.


Table 1.
A comparative table: Literature review on systemic risk measures.
| Authors | Context | Systemic Risk Measures | Results |
|---|---|---|---|
| Chan-Lau (2009) | Financial institutions in Europe, Japan, and the United States. | △CoVaR | The results indicate that risk codependence is stronger during distress periods. |
| Gauthier et al. (2010) | Canadian banks | A network-based framework and a Merton model | The authors conclude that financial stability can be substantially enhanced by implementing a system perspective on bank regulation. |
| Acharya et al. (2010) | European and American contexts | SRISK and stress tests | They show that regulatory capital shortfalls measured relative to total assets provide similar rankings to SRISK for U.S. stress tests. On the contrary, rankings are substantially different when the regulatory capital shortfalls are measured relative to risk–weighted assets. Greater differences are observed in the European stress tests. |
| Reboredo and Ugolini (2015) | European sovereign debt markets | CoVaR | The systemic risks are similar in all countries before the crisis and the decoupling of debt market and systematic risk were globally reduced in the European market after the onset of the Greek debt crisis. |
| Grieb (2015) | Asian and Russian context | The model of nonlinear factors, and Logistic regression model | The authors show that the systemic risk of hedge fund is increasing. |
| Kupiec and Güntay (2016) | Different countries | MES and CoVar | They conclude that CoVaR and MES are not reliable measures of systemic risk. |
| Lin et al. (2016) | Taiwan financial institutions | Different risk measures like SRISK, MES, CoVaR | The main results indicate that although these three measures differ in their definition of the contributions to systemic risk, all are quite similar in identifying systemically important financial institutions (SIFIs). |
| Karimalis and Nomikos (2017) | European large banks | Copula and CoVaR | They highlight the importance of liquidity risk at the outset of the financial crisis in summer 2007 and find that changes in major macroeconomic variables can contribute significantly to systemic risk. |
| Brownlees and Engle (2017) | Top international financial firms | SRISK | They offered a ranking of institutions in the different crisis stages. |
| Hmissi et al. (2017) | Tunisian context | CES measure | They find that Tunisian public banks (STB, BNA and BH) are the riskiest systemically banking sector. |
| Di Clemente (2018) | European banking system | Extreme value theory (EVT) | They showed the connection between a single financial institution and the financial system. |
| Khiari and Nachnouchi (2018) | Tunisian context | CoES and MDS methodologies | They show that public banks respectively along with the two most important private banks hold the leading positions in the systemic risk rankings |
| Duan (2019) | Chinese context | CoVar | Authors find that the risk spillover value of China Pacific Insurance Company is the largest, followed by China Life Insurance Company, Ping’an Insurance Company of China is the last. |
Table 2.
Descriptive statistics of stock returns.
| N | Mean | Standard Deviation | Skewness | Kurtosis | |
|---|---|---|---|---|---|
| AB | 2235 | −0.029 | 1.895 | −21.775 | 797.500 |
| ATB | 2235 | −0.035 | 1.254 | −0.238 | 4.565 |
| Attijari | 2235 | 0.028 | 1.188 | −0.098 | 7.265 |
| BH | 2235 | −0.034 | 1.789 | −5.047 | 105.419 |
| BT | 2235 | −0.112 | 5.024 | −41.939 | 1895.974 |
| BTE | 2235 | −0.045 | 1.402 | 0.176 | 13.287 |
| BNA | 2235 | 0.009 | 1.551 | 0.452 | 4.082 |
| UBCI | 2235 | −0.036 | 1.810 | −6.527 | 158.577 |
| BIAT | 2235 | 0.028 | 1.249 | 0.199 | 4.339 |
| STB | 2235 | −0.062 | 1.781 | 0.300 | 2132 |
| UIB | 2235 | 0.011 | 1.170 | −0.948 | 22.974 |
| TUNBANK | 2235 | 0.022 | 0.645 | −0.368 | 10.108 |
Table 3.
Banks average VaRiq,t.
| Banks | BT | BIAT | UBCI | TIJARI | BH | UIB | AB | STB | ATB | BNA | BTE |
|---|---|---|---|---|---|---|---|---|---|---|---|
| Average VaRiq,t | −0.017454 | −0.020229 | −0.039537 | −0.015918 | −0.026186 | −0.015632 | −0.022018 | −0.029432 | −0.020185 | −0.023813 | −0.022569 |
Table 4.
Banks average CoVaRq,t sys/Xi=VaRq.
| Banks | BT | BIAT | UBCI | TIJARI | BH | UIB | AB | STB | ATB | BNA | BTE |
|---|---|---|---|---|---|---|---|---|---|---|---|
| COVaR i/sys | −0.039081 | −0.042360 | −0.067702 | −0.040310 | −0.050530 | −0.037090 | −0.037834 | −0.052711 | −0.042089 | −0.053175 | −0.056501 |
Table 5.
Banks average ΔCoVaR.
| Expoure ΔCoVaRqi/sys | Contribution ΔCoVaRsys/i | |
|---|---|---|
| AB | −0.032594 | −0.021378 |
| ATB | −0.036435 | −0.02148 |
| ATTIJARI | −0.028878 | −0.018332 |
| BH | −0.045772 | −0.020545 |
| BIAT | −0.021259 | −0.018508 |
| BNA | −0.036213 | −0.020529 |
| BT | −0.022813 | −0.015852 |
| BTE | −0.056501 | −0.021164 |
| STB | −0.035057 | −0.021463 |
| UIB | −0.029841 | −0.019827 |
| UBCI | −0.028356 | −0.022987 |
Table 6.
Value-at-risk back testing.
| Short Positions | ||||
| Quantile | Success Rate | Kupiec LRS 1 | p-Value | ESF 2 |
| 0.9500 | 0.95302 | 0.43762 | 0.50827 | 0.035825 |
| 0.9750 | 0.97002 | 2.1380 | 0.14369 | 0.039317 |
| 0.9900 | 0.98613 | 3.0178 | 0.082353 | 0.045175 |
| 0.9950 | 0.99060 | 6.8889 | 0.0086733 | 0.046838 |
| 0.9975 | 0.99284 | 12.890 | 0.00033043 | 0.048614 |
| Long Positions | ||||
| Quantile | Failure Rate | Kupiec LRS | p-Value | ESF |
| 0.0500 | 0.033110 | 15.162 | 9.8682 × 10⁻⁵ | −0.040975 |
| 0.0250 | 0.019239 | 3.3011 | 0.069235 | −0.049888 |
| 0.0100 | 0.009396 | 0.084060 | 0.77187 | −0.068311 |
| 0.0050 | 0.0062640 | 0.66418 | 0.41509 | −0.085305 |
| 0.0025 | 0.0044743 | 2.8248 | 0.092818 | −0.10279 |
1 LR refers to the likelihood ratio statistic. 2 ESF refers to the expected shortfall.
Table 7.
Dimensions reflecting level of involvement of Tunisian Banks in the systemic risk.
| First Dimension Horizontal Axis (Bank’s Exposure) | Second Dimension Vertical Axis (Bank’s Contribution) | |
|---|---|---|
| Axis | ΔCoVaRsys/i | ΔCoVaRqi/system |
Table 8.
Total means of ΔCoVaR.
| Exposure ΔCoVaRqi/system | Contribution ΔCoVaRsys/i | |
|---|---|---|
| (min ΔCOVaR + max ΔCOVaR)/2 | −0.0194195 | −0.03888 |
| ∑ ΔCOVaR/11 | −0.02018773 | −0.03397445 |
© 2019 by the authors. Licensee MDPI, Basel, Switzerland. This article is an open access article distributed under the terms and conditions of the Creative Commons Attribution (CC BY) license (http://creativecommons.org/licenses/by/4.0/).
Share and Cite
MDPI and ACS Style
Khiari, W.; Ben Sassi, S. On Identifying the Systemically Important Tunisian Banks: An Empirical Approach Based on the △CoVaR Measures. Risks 2019, 7, 122. https://0-doi-org.brum.beds.ac.uk/10.3390/risks7040122
AMA Style
Khiari W, Ben Sassi S. On Identifying the Systemically Important Tunisian Banks: An Empirical Approach Based on the △CoVaR Measures. Risks. 2019; 7(4):122. https://0-doi-org.brum.beds.ac.uk/10.3390/risks7040122
Chicago/Turabian StyleKhiari, Wided, and Salim Ben Sassi. 2019. "On Identifying the Systemically Important Tunisian Banks: An Empirical Approach Based on the △CoVaR Measures" Risks 7, no. 4: 122. https://0-doi-org.brum.beds.ac.uk/10.3390/risks7040122
Note that from the first issue of 2016, this journal uses article numbers instead of page numbers. See further details here.