
ESG-Washing in the Mutual Funds Industry? From Information Asymmetry to Regulation


1
Louvain Finance (LFIN), University Catholic of Louvain, B-1348 Louvain-la-Neuve, Belgium
2
Aix-Marseille School of Economics (AMSE), Aix-Marseille University, 13001 Marseille, France
3
Laboratoire d’Économie d’Orléans (LEO), University of Orléans, 45100 Orléans, France
*
Author to whom correspondence should be addressed.
Risks 2021, 9(11), 199; https://0-doi-org.brum.beds.ac.uk/10.3390/risks9110199
Submission received: 24 September 2021
/
Revised: 1 November 2021
/
Accepted: 2 November 2021
/
Published: 5 November 2021
(This article belongs to the Special Issue Risks: Feature Papers 2021)
Abstract
:In this paper, we study the asymmetric information between asset managers and investors in the socially responsible investment (SRI) market. Specifically, we investigate the lack of transparency of the extra-financial information communicated by asset managers. Using a unique international panel dataset of approximately 1500 equity mutual funds, we provide empirical evidence that some asset managers portray themselves as socially responsible yet do not make tangible investment decisions. Furthermore, our results indicate that the financial performance of mutual funds is not related to asset managers’ signals but should be evaluated relatively using extra-financial ratings. In summary, our findings advocate for a unified regulation framework that constrains asset managers’ communication.
1. Introduction
In this paper, we study the information asymmetry between asset managers and investors in the socially responsible investment (SRI) market. This information asymmetry is related to the difficulty investors experience when they evaluate the financial and extra-financial performance of mutual funds. Furthermore, asset managers may opportunistically maintain this information asymmetry using the practice of making unsubstantiated or misleading claims about their mutual fund environmental, social of governance (ESG) commitment. By using misleading narratives and third-party dubious ESG labels, fund managers can influence investor behavior to their advantage.
The objective of this paper is first to investigate this information asymmetry by studying the identity of a panel of equity funds according to (i) the ESG signals sent by the managers (e.g., the choice of fund name or the choice of certification via a label—the de jure ESG) and (ii) the ESG ratings attributed to the funds by rating agencies on the basis of transparent investment reporting (e.g., Morningstar, MSCI—the de facto ESG). A mismatch between a manager’s ESG signal (de jure ESG) and a fund’s ESG rating (de facto ESG) is interpreted here as a lack of information transparency. The second objective of this paper is to examine the consequences of the presence of such information asymmetry in terms of financial performance. Specifically, we analyze the financial performance of the same panel of funds, conditional on their ESG ratings and the award of an ESG label by a private certification agency (e.g., Novethic). Comparing the non-financial performance of mutual funds conditional on their conventional/socially responsible (SR) classification, we empirically show that there is no significant relationship between mutual funds’ ESG ratings and non-financial information communicated by fund managers. Moreover, estimating the impact of non-financial rating agencies’ scores and fund managers’ statements on mutual funds’ financial performances, we find different results for American and European mutual funds due to different regulation frameworks. Thus, our contribution to the sustainable finance literature is related to the study of the information asymmetry linked to the financial and extra-financial performance in the US and European equity markets.
This empirical study is related to recent contributions by Berrone et al. (2017); Lyon and Montgomery (2015); Marquis et al. (2016); El Ghoul and Karoui (2021) who study practices related to “greenwashing”. This term refers to “the practice of making unsubstantiated or misleading claims about the company’s environmental commitment” (Flammer 2021). By extending this concept to ESG, we show that this behavior of managers concerns not only the environment but also all dimensions of ESG; we label this practice “ESG-washing”. This paper also contributes to the empirical literature on the analysis of the financial performance of socially responsible (SR) funds (i.e., Borgers et al. (2015); Statman and Glushkov (2016); El Ghoul and Karoui (2017)). Based on our initial results, we revisit the topic of the potential financial costs of ethics. The novelty of this work is to compare “what is said” and “what is done” about non-financial objectives. Specifically, this paper contributes to the literature showing the divergence between fund managers’ statements and rating agencies’ scores. The results indicate that this information asymmetry could be reduced via an adequate disclosure regulation.
Finally, our findings highlight the need for regulation of the SRI market. Indeed, the asymmetric information on the financial and extra-financial performance of mutual funds is amplified by the opportunistic behavior of the managers who practice ESG-washing. Consequently, in Europe, where unlike in the USA, the choice of a fund name has not been necessarily linked to the nature of the fund, private ESG labels have emerged. Without replacing the lists produced by nonprofit organizations (e.g., the Social Investment Forum’s (SIF) list), this type of label was intended to help investors assess the extra-financial performance of investment funds. However, given the failure of private certification agencies to provide transparent information (see Statman and Glushkov (2016)), states have taken over. For example, Belgium and France have instituted public labels aimed at reducing the information asymmetry linked to the lack of transparency of the extra-financial information communicated by managers. Recent changes in European regulations demonstrate the desire of public authorities to regulate the SRI market by providing a framework for the communication of fund managers. In this line, the Disclosure and Taxonomy regulations (resp. Regulations (EU) 2019/2088 and (EU) 2020/852) aim to make the sustainability profile of funds easier to assess for investors using predefined indicators to evaluate the environmental, social and governance (ESG) characteristics used in the investment process. In particular, the vocabulary used by fund managers to qualify the extra-financial performance of their mutual funds is now strictly regulated.
The remainder of this paper is organized as follows. Section 2 presents the conceptual framework and the related literature. Section 3 describes the data on socially responsible mutual funds. Section 4 presents the results of the first part of the empirical study on the hypothesis of signaling/ESG-washing. Section 5 presents the results of the second part of the empirical study and focuses on the relationship between financial and extra-financial performance. Section 6 discusses the policy implications of such asymmetric information in the SRI market and concludes.
2. Literature Review
2.1. Information Asymmetry between Asset Managers and Investors
In general, there is information asymmetry between producers-sellers and consumers-buyers (Akerlof 1970). This is also the case in financial markets: asset managers know more about their mutual funds than investors. This information asymmetry induces transaction costs from identifying mutual funds with desirable performance. Asset managers therefore are interested in reducing this information asymmetry or turning it to their advantage. On the one hand, asset managers can reduce information asymmetry by sending a “signal” to investors (see Spence (1973); Riley (1979) on signal theory). For example, the choice of the name of a mutual fund is a signal if it makes it easier for an investor to identify the characteristics of the fund. On the other hand, opportunistic asset managers may try to turn this information asymmetry to their advantage.
This opportunistic behavior of asset managers is performed through information obfuscation (Ellison and Ellison 2009). One of the main information obfuscation strategies documented in the literature is the provision of unsubstantiated or misleading information (Flammer 2021). An example of this opportunistic behavior is choosing a name for a financial product that is not representative of its characteristics. The literature documents that company names impact investors’ decisions (El Ghoul and Karoui 2020; Green and Jame 2013; Jacobs and Hillert 2016). Fund managers can opportunistically use this behavioral bias to influence investors. For example, they can misleadingly name a fund to impact investor perception (Cooper et al. 2005; Espenlaub et al. 2017).
2.2. From a Lack of Transparency to Greenwashing
This opportunistic behavior is also observed in the SRI market: El Ghoul and Karoui (2021) show that in the US market, asset managers have changed the names of their mutual funds to a sustainability-related appellation in order to appear to comply with some environmental commitment. Moreover, the authors show that this superficial change has indeed led to a change in investor behavior. This practice, called greenwashing, consists of communicating unsubstantiated or misleading information about a financial product to give it the appearance of a socially responsible mutual fund (Lyon and Maxwell 2011; Lyon and Montgomery 2015). This practice has been described in the recent literature (Berrone et al. 2017; Marquis et al. 2016), but it is not new (Schwartz 2003).
This opportunistic behavior of asset managers, which has its roots in the difficulty investors experience when they evaluate the extra-financial performance of mutual funds, has been somewhat limited by the emergence of third parties. Indeed, the publication of lists by nonprofit organizations (e.g., the Forum for Sustainable and Responsible Investment–USSIF) or certification by non-financial rating agencies (e.g., Novethic) aims to help investors differentiate conventional and socially responsible funds. However, Statman and Glushkov (2016) show that these dichotomous rankings are limited because they are based on asset manager declarations only. Therefore, investors use non-financial rating agencies to obtain additional and simplified information (Armstrong et al. 2019). The ESG scores issued by rating agencies are intended to help investors better evaluate the extra-financial performance of investment funds (Hartzmark and Sussman 2019). However, as argued by Berget al. (2019), the divergence of the ESG scores issued by non-financial rating agencies has limited benefits for investors in terms of transparency. As private companies and nonprofit organizations have failed to combat greenwashing, some European states have stepped in to regulate the SRI market. The creation of public labels as of 2016 (e.g., SRI labels in France and FinBel in Belgium), with no possible conflict of interest, aims to force asset managers to be more transparent via a standardized approach. Finally, the European regulation (i.e., Regulation (EU) 2020/852 of the European Parliament and of the Council of 18 June 2020 on the establishment of a framework to facilitate sustainable investment), which will come into force in 2021, will enable a new step to be taken in the fight against greenwashing via the introduction of a sustainable finance taxonomy.
3. Data
Our empirical study is based on the comparison between what is said (i.e., asset managers’ commitments) and what is done (i.e., asset managers’ tangible actions) about sustainable investment. To do so, we first combine two different non-financial variables to proxy de jure and de facto SRI. Then, we provide empirical evidence of asymmetric information, that is, a difference between what is said and what is done about sustainable investment. The fact that asset managers signal their commitment toward ESG criteria without making tangible actions will be interpreted as ESG-washing practices. Lastly, we show that asymmetric information impacts the evaluation of funds’ financial performance.
3.1. De Facto SRI: Using the Morningstar and MSCI Databases
First, we choose to use two newly available databases from Morningstar and MSCI that rate mutual funds with respect to the extra-financial performance of their investment holdings. These new databases1 present two advantages. First, more than 90% of existing mutual funds are rated, whether they are identified as socially responsible or not. In addition, SRI and ESG scores cover more than of mutual funds’ holdings. Second, both scores of each mutual fund are composites built from the aggregation of firm-level ratings and normalized. Although they share many common features, Morningstar and MSCI databases exhibit a few, but interesting, differences. First, Morningstar and MSCI provide comparable ESG scores, but in addition, Morningstar provides a SRI score based on an ESG score and a Controversy score. Second, Morningstar Sustainability Rating’s scores are free of industry bias, which is not the case for the ESG score from MSCI ESG Fund Metrics.
We restrict our initial analysis to European and US domestic equity mutual funds and, more precisely, the large-cap funds. The database covers the period 2013–2018 at a monthly frequency. Several steps are implemented to build a balanced and consistent database (see Appendix D about survivor bias and mutual fund performance). We require each mutual fund to have the same geographical investment area and the same currency to avoid associated risks. To be more precise, for the European mutual funds, we study the funds whose investment universe includes the whole Europe. Our final database thus contains 606 funds in Europe and 887 funds in the United States. Each fund has a monthly SRI score that incorporates the ESG score and the Controversy score.2 This database is thus balanced and homogeneous and lists all European and US mutual funds with an SRI rating provided by Morningstar. To complete our analysis and to anticipate the robustness checks, we extract from MSCI3 the ESG score for the whole mutual funds sample.
3.2. De Jure SRI: A New Classification from Mutual Funds’ Names and ESG Labels
As ethical standards differ across investors, asset managers, non-profit organizations and non-financial rating agencies, the categorization of conventional and socially responsible mutual funds is highly debatable. In a recent paper, Statman and Glushkov (2016) highlight this difficulty in describing the differences between the databases used in the literature (e.g., Lipper’s list, the Social Investment Forum (SIF) list and the Standard & Poor’s () list) and their consequences for empirical studies.
In this line, we follow Nofsinger and Varma (2014)’s methodology to classify conventional and socially responsible mutual funds. From a discrete selection process, they build a list of words related to SRI terminology: “social”, “socially”, “environment”, “green”, “sustainability”, “sustainable”, “ethics”, “ethical”, “faith”, “religion”, “Christian”, “Islam”, “Baptist” and “Lutheran”. Then, using the dictionary defined above, the authors keyword-search mutual funds’ names to identify socially responsible mutual funds. We go further than Nofsinger and Varma (2014), using several lexical databases to broaden the SRI terminology. Our purpose is to build a more complete dictionary that enables us to search for words (nouns, adjectives or verbs) associated with SRI. First, we store a preliminary list of words from the terminology identified by the USSIF (2018):4 “community”, “ethical”, “green”, “impact”, “mission”, “responsible”, “socially”, “sustainable”, and “values”. Then, we extend this initial list using the lexical database developed by Miller (1995) and Fellbaum (1998) and hosted/updated by Princeton University.5 To the 9 initial words from USSIF (2018)’s terminology, we add 18 additional words, which we present in Table 1.
Our extended dictionary is then used to classify mutual funds via pattern search on mutual funds names. The rationale for using pattern search instead of keyword search, as in Nofsinger and Varma (2014), is to track words (nouns, adjectives and verbs) based on the same stem as keywords from our dictionary. The indicator variable is then built from a matching procedure, and results are checked using Bloomberg’s description of mutual funds. In case of doubt about a given European mutual fund, the classification is triple-checked using the mutual fund’s key investor information document (KIID). Our extended dictionary provides relevant results because it enables a better identification of de jure socially responsible mutual funds. Our dictionary is able to accurately discriminate between conventional and socially responsible mutual funds. The resulting classification is double-checked using Bloomberg’s description of mutual funds (description texts are provided by asset managers) and mutual funds’ prospectuses. Moreover, our dictionary outperforms Nofsinger and Varma (2014)’s dictionary, which fails to classify every fund holding a sustainable fund label as socially responsible funds.
4. “ESG-Washing”: Asset Managers Signals vs. Third-Party Ratings
Table 2 reports the number of conventional and socially responsible mutual funds as well as the descriptive statistics (their SRI score mean and standard deviation).
From the 606 European funds (resp. 887 US funds), we detect 52 funds (resp. 25 US funds) portrayed as socially responsible funds, resulting in 554 conventional funds for Europe (resp. 862 conventional funds for the US). We also investigate when this classification is robust to ESG labels. In comparing our classification for European funds with that proposed by Novethic,6 the largest European private certification agency, we find that all 19 mutual funds awarded by a ESG certification are classified as non-conventional, whereas none of the conventional funds present such a feature. This classification can thus be interpreted as a signal of the asset managers’ commitment toward ESG (either via the mutual fund name or certification). In the case of the US, such a comparison is not possible because, to the best of our knowledge, there is no similar private certification agency during the study time period. It also appears that socially responsible funds represent a minority (approximately in Europe and in the United States), whereas conventional funds are numerous. However, it is striking to observe that, on average, the corresponding SRI scores are almost the same across socially responsible and conventional funds. This suggests that funds with low ESG ratings might hold a sustainable fund label and high ESG fund ratings can be achieved without applying a label. This preliminary finding indicates an information asymmetry between asset managers and investors.
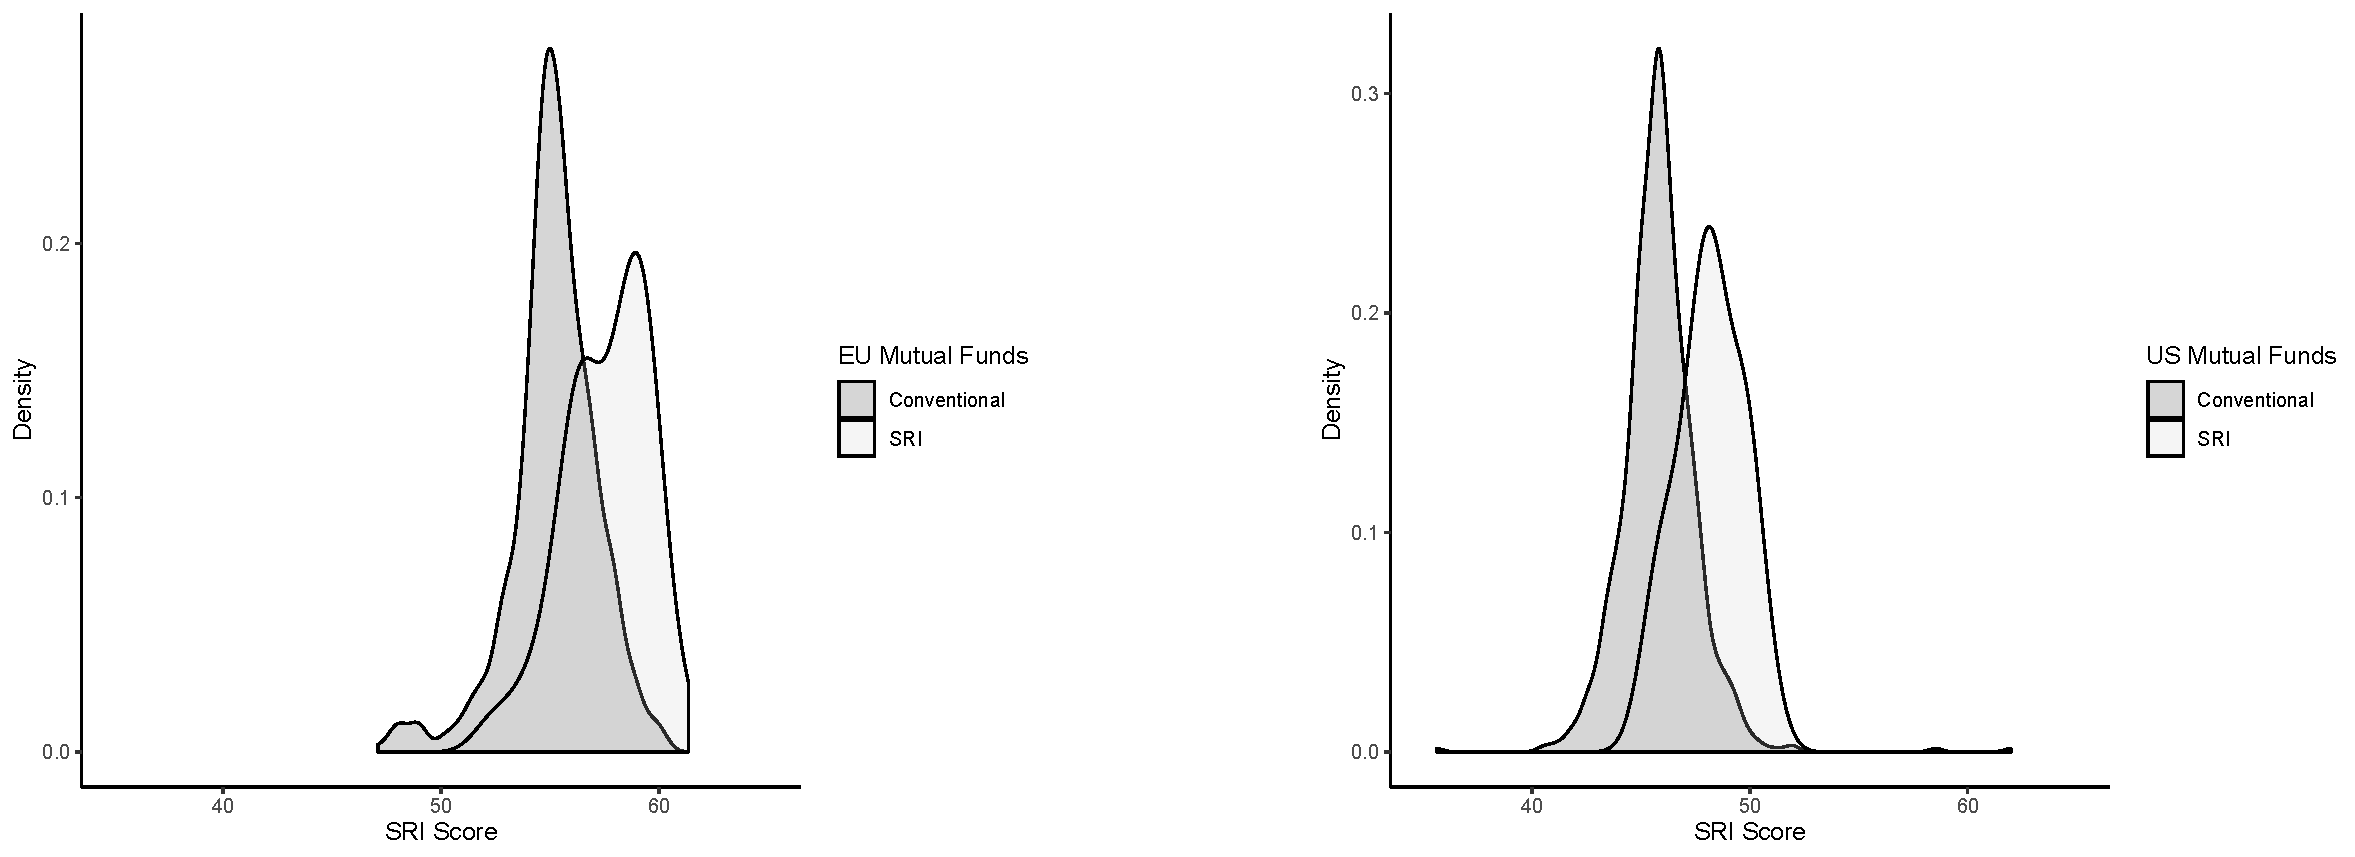
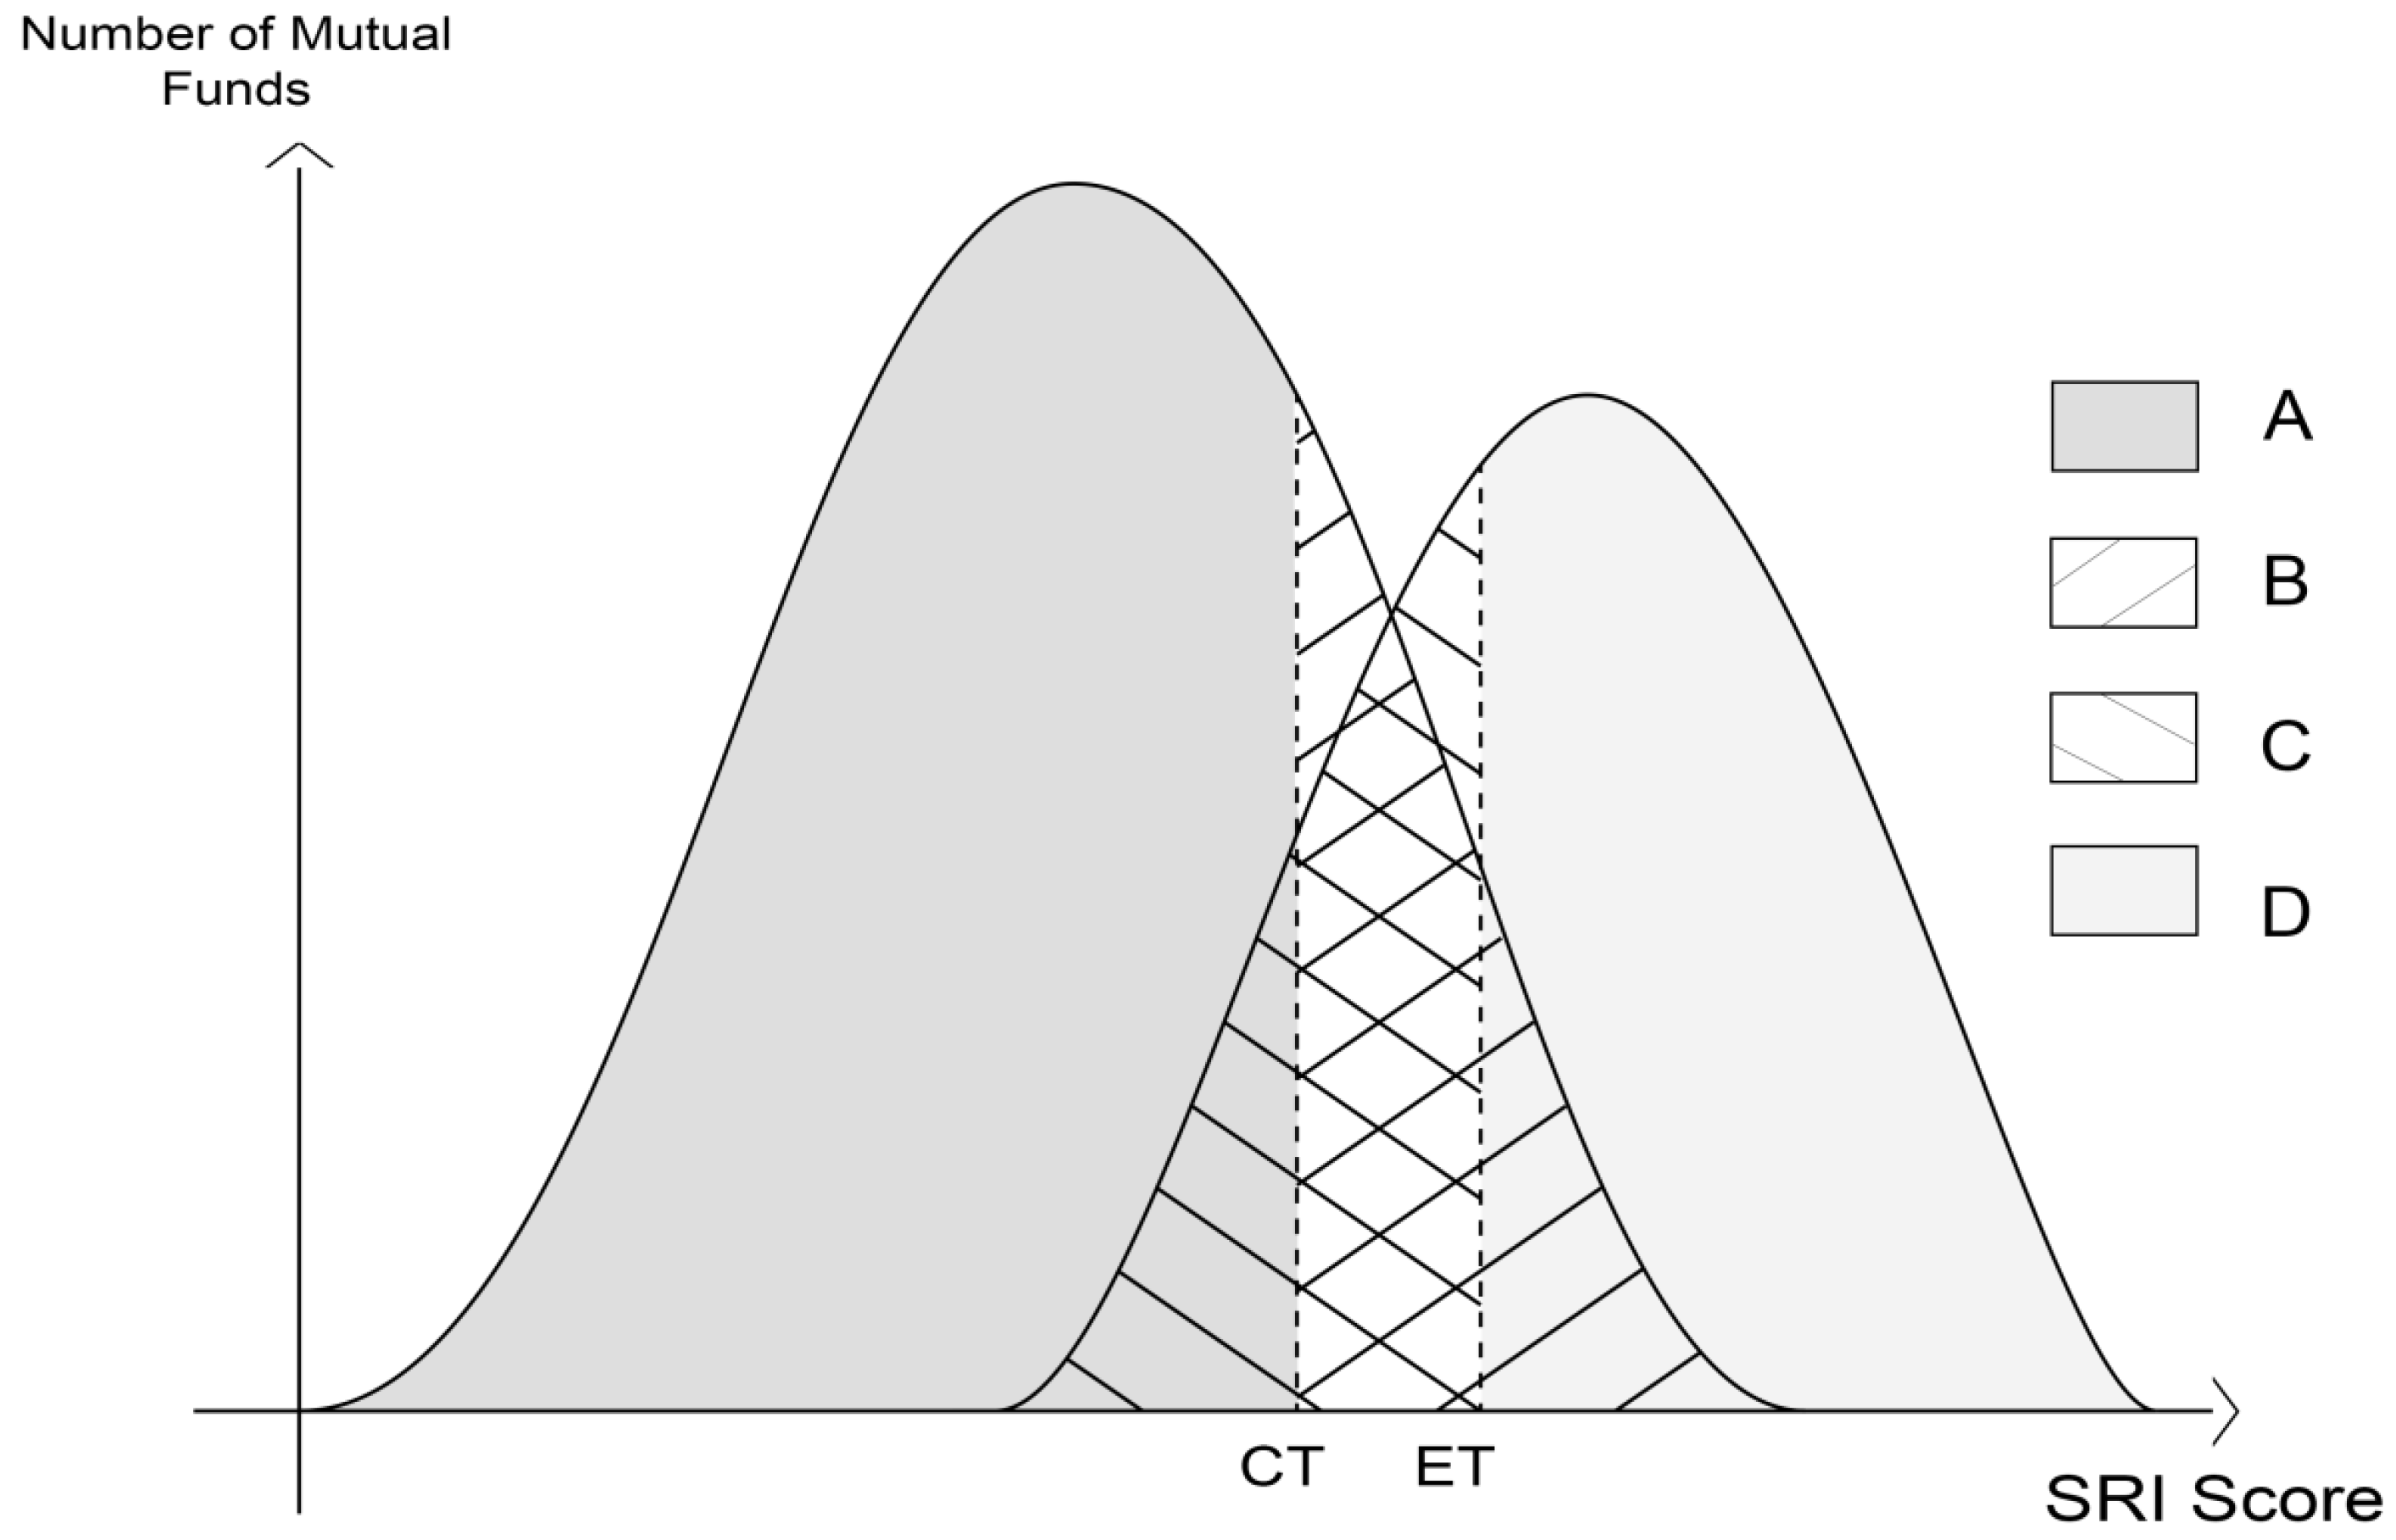
Figure 1 plots the distribution of SRI scores for these two groups of funds in Europe and in the US. It is obvious that the peak of the distribution for socially responsible mutual funds is higher than that calculated for conventional funds. However, it also reveals the presence of a very large overlap between the distributions, thus confirming that funds with low ESG ratings might be portrayed as socially responsible mutual funds and high ESG fund ratings can be achieved without being portrayed as socially responsible mutual funds. Such a stylized fact paves the way for a second dimension of SRI that addresses the ESG performance of the current investments in the fund that could be different with the signal of the fund manager’s commitment. To implement such a distinction in a preliminary analysis, it is necessary to find a threshold () above which a conventional fund exhibits high ESG performance and a threshold () below which a socially responsible mutual fund invests conventionally. To this end, we consider a simple rule based on conditional quantiles. Specifically, in line with Adrian and Brunnermeier (2016)’s econometric approach, we define (resp. ) as the -quantile of the conditional distribution of SR (resp. conventional) mutual funds. More formally, and . Thresholds are then used to classify mutual funds into four categories: groups A and B, with group A including conventional funds with a rating below and group B including conventional funds with a rating above , and groups C and D, with group C including SR funds rated below and group D including SR funds rated above . The threshold is defined as the SRI score given to the lowest of socially responsible funds, and is defined as the SRI score given to the highest of conventional funds. Figure 2 illustrates this definition.
For Europe, we find that and , and for the US, we find that and . Conditional on these threshold values, Table 3 and Table 4 summarize our categorization of the funds according to their asset managers’ commitments and tangible actions. For simplicity, we label them from A to D, as reported in Table 3.
We find that (resp. ) of the European (resp. US) conventional funds still present very high SRI scores, indicating that they respect commitment toward ESG. On the contrary, and perhaps more interestingly, (resp. ) of the European (resp. US) socially responsible funds have a low SRI score. This result indicates that 23 (resp. 9) socially responsible funds do not respect their commitments in terms of SRI. Broadly speaking, what is said does not seem to match what is done in terms of SRI. When specifically considering the European mutual funds holding a sustainable fund label, they are all classified in the C and D categories. We note that 4 of them belong to group C, highlighting that sustainable fund labels are only weak leading indicators of the asset managers’ investment strategies.
Our findings indicate that the name and certification of a given fund are not necessarily linked to the investment strategy of the manager. The difference between signals of the asset managers’ commitment toward ESG and non-financial performance contributes to the information asymmetry of this market. In addition, our results highlight that private third-party certification agencies such as Novethic have not been able to correct this market dysfunction7. These findings provide empirical evidence of asset managers ESG-washing practices.
5. Impact of Information Asymmetry on the Evaluation of Financial Performances
5.1. A Preliminary Analysis of Mutual Funds Performance
Given the funds’ classification along the two dimensions of SRI, it is possible to run a first analysis of their performance, as in Hamilton et al. (1993); Goldreyer and Diltz (1999); Statman (2000). Following this literature, we first study two clusters related to de jure SRI: conventional mutual funds () and socially responsible mutual funds (). We then analyze the two other clusters related to de facto SRI considering realized SRI Score: low-ranked mutual funds () and top-ranked mutual funds (). Table 4 reports the descriptive statistics (mean return, standard error and Sharpe ratio) for each of these fund categories. It appears that, in line with the existing empirical studies in the literature, conventional funds () outperform socially responsible funds () in both the US and Europe. Thus, de jure SRI seems to behave as added value for investors because socially responsible mutual funds exhibit higher returns and lower risks than conventional funds. However, the financial performance analysis conditional on realized investments (de facto SRI) leads to a different interpretation: low-ranked mutual funds () exhibit better financial performance than high-ranked mutual funds (). Thus, de facto SRI has a financial cost: in line with theory, extra-financial constraints lead to less efficient portfolios.
This preliminary analysis (Table 4) illustrates the divergence in the literature between SRI and financial performance. In the next section, we deepen the analysis using a more sophisticated econometric framework.
5.2. Revisiting the Performance of Socially Responsible Mutual Funds
5.2.1. Method
Recent papers have typically estimated factor models, such as the traditional Fama and French (1993) model, which integrates three or more factors. A recently developed 4-factor risk-adjusted performance model has also been proposed by Carhart (1997). This model considers a market return index (), the monthly premium of the book-to-market factor (), the monthly premium of the size factor () and momentum in stock markets (). The model can thus be rewritten as
where is fund’s i return, is the monthly risk-free rate, and is the net-of-fees annual risk-adjusted performance of fund i. To avoid a two-step approach, which can introduce statistical bias, we rely on recent studies (Ando and Bai 2015; Petersen 2009) that propose evaluating the performance of funds using a high-dimensional panel, that is, considering in a single step both the time and the cross-sectional dimension. To this end, a fixed effect factor is added to take into account the potential unobserved heterogeneity. The model is estimated independently for each fund i such that has i.i.d. white noise. The model can be estimated for a period of time and for a set of funds i (cross-sectional dimension) or for a particular fund i for a period of time (time series dimension). El Ghoul and Karoui (2017) apply the latter strategy. In the first step, they estimate for each fund individually (1) to obtain an individual estimate of , the conditional return of the funds. The s that represent the sensitivity to market factors remain a common factor for all funds. They introduce the extra-financial characteristics of the fund in the second step, in which they regress the estimated conditional return on the particular features of the fund.
Then, to distinguish between conventional and socially responsible funds, a nonlinear panel is considered. More precisely, we split the panel for these two types of funds and obtain the following model:
where is an index variable that takes a value of 1 if the fund is conventional and 0 otherwise and is an index that takes a value of 1 if the fund is socially responsible and 0 otherwise. The subscript c refers to estimates associated with conventional funds, and the subscript s corresponds to socially responsible fund coefficients. Model (2) is estimated via GLM, and a Driscoll and Kraay (1998) correction is implemented to avoid bias due to cross-sectional dependence. It is thus possible to test whether a category of funds offers extra returns and whether it is more sensitive to a peculiar factor. In a sense, this approach is in line with papers that test for homogeneous breaks in slopes, such as those by Pesaran and Yamagata (2008); Blomquist and Westerlund (2013) or more recently Argyropoulos et al. (2020). Here, the breaks are exogenous and are driven by economic motivations: socially responsible and conventional funds.
Furthermore, we follow Hansen (2000), and instead of considering model (2), we estimate a model integrating both the whole sample and the socially responsible funds subsample. The nonlinear panel Carhart model takes the following form:
This representation offers more precise estimates and straightforward interpretations. If a coefficient associated with a socially responsible mutual fund (denoted with an underscore s) is significant, then it would indicate a particular behavior of socially responsible funds. In the opposite case, it would suggest that they behave similarly to conventional funds. The model thus separates socially responsible from conventional funds. However, as we stress in the previous section, some asset managers do not respect their commitments toward ESG. Furthermore, some socially responsible funds present a low SRI score, and some conventional funds present a high SRI score. We thus consider in model (4) the SRI score obtained from the final nonlinear panel-augmented Carhart model:
Let us note that in such a specification, the fixed term effect is omitted, as it would be highly correlated with the SRI score if it is fixed over the period or presents low variability. In this section, SRI score is fixed over the given time period 2018. In the robustness Section 5.2.3, a time-varying SRI score is considered. In model (4), the estimated return of the mutual fund is now calculated as .
5.2.2. Empirical Results
Through a preliminary analysis and to identify a benchmark, we estimate the basic linear Carhart model (1) for 2013–2018 without considering any SRI dimensions. The market benchmark () is the MSCI USA Index and MSCI Europe Index for the US and European mutual funds, respectively, the risk-free rate () is the US and EU short-term interest rates, respectively, and returns (r) are net of fees. Table 5 reports the model (1) estimates. It appears that almost all explanatory variables except momentum (and HML for Europe) have a significant effect on the risk-adjusted performance of the funds. The value is also quite high ( for Europe and for the US). The alpha coefficient is not significant. Such a result is consistent with the efficient market hypothesis. Specifically, the results show that the market factor has almost a proportional impact on the funds’ returns. SMB also affects returns positively but with less elasticity. By contrast, the value premium is negative but with a relatively small coefficient.8
The significance of annual risk-adjusted performance () is not significantly different from zero, corroborating the results of Fama and French (1993); Carhart (1997), indicating that on average, mutual funds do not provide investors with performance that surpasses that of the benchmark index over this sample periods. Table 6 gathers the results of the estimation of the 4-factor model augmented by a de jure dummy indicating whether the asset manager provides a signal of the mutual funds commitment toward ESG. It appears that this dummy is not significantly different from 0, supporting the literature’s findings (Baueret al. 2005; Rennebooget al. 2008). Indeed, ESG signaling does not affect the performance of the fund. The same estimation is performed using a ESG label certification by an independent third party dummy instead of the name-based variable. It leads to the same conclusion (see Appendix C).
In the next step, the nonlinear augmented Carhart model represented by Equation (4) can now be estimated. Remember that is an indicator function that takes a value of 1 (resp. 0) if the fund is socially responsible (resp. conventional); that is, there ESG signaling (resp. there is no signal toward ESG commitment). This corresponds to the de jure dummy variable. The second variable, , corresponds to the rating given by Morningstar. This variable is a proxy for the de facto dimension of the SRI because it is independent of any signal. The model is estimated by the generalized linear method (GLM), and the results are reported in Table 7.
The estimates obtained in the first part of the model (i.e., for the full model) are similar in both sign and magnitude to those obtained using the previous linear model (Table 5) for Europe and the United States. The only slight difference is the increase in the value of when SRI Score is introduced. Such a result can be explained by the negative value of the de facto SRI score, suggesting that extra-financial constraints constitute a penalty for funds’ performance (Bollen 2007; Fama andFrench 2007). In addition, when calculating the overall 9 in model (4), it turns out to be very close to 0.
The second part of Table 7 addresses the impact of SRI signaling (proxied here by a regime characterized by the de jure dummy). The results between the US and Europe highlight several common features. First, the is not significant, meaning that SRI signaling have no significant impact on the market risk exposure of these funds. Second, neither the factor nor the for de jure socially responsible funds is significant, indicating the absence of persistence in the funds’ returns. SRI thus does not impact the persistence of funds’ returns. Finally, it appears that the SRI score has a negative and significant effect on the funds’ returns, supporting the idea that de facto socially responsible mutual funds have a return penalty (Bollen 2007; Fama and French 2007).
However, we observe differences in performance of mutual funds. For the US, none of the de jure factors explain the funds’ returns at a 95% confidence level, confirming that SRI signaling have no impact on mutual funds’ performance. In contrast, in Europe, and are significant and positive. Thus, de jure SRI could have an indirect impact on financial performance if investing in small businesses or value firms is considered ethical. This is consistent with the fact that in Europe, asset managers tend to combine ethics with investing in small firms. This difference between de jure SMB and HML between the EU and the US comes from the fact that in the US, the names of mutual funds must reflect the “real” strategy of funds, which is not the case in Europe. Such an observation can also explain why the number of de jure socially responsible mutual funds is relatively low in Europe. Finally, a difference can be observed when comparing the (de jure) and the (de facto). We observe that de jure socially responsible funds present significantly lower average returns in Europe, whereas their performance in the US is identical to that of conventional funds. Regardless of the region, it appears that the magnitude of the de facto SRI score is much higher than that of the de jure dummy variable. The de facto socially responsible mutual funds exhibit a return penalty in the EU and the US, as supported by theory (Bollen 2007; Fama and French 2007), and are thus much more important than SRI signaling.
Our results indicate that investors who are genuinely interested in ethical investing should not base their choice on asset managers’ commitment toward ESG neither on ESG labels. Instead, they should focus exclusively on the “ex post” extra-financial performance, that is, SRI scores. Finally, substantial concerns are raised about the labels certification by independent third parties, as they do not appear to be good leading indicators of asset managers’ tangible actions. Such a conclusion corroborates the findings regarding labels presented in the last section.
5.2.3. Robustness Checks
The following section presents a series of robustness checks. Our purpose is to analyze whether our findings are sensitive to changes in model specifications and data sampling.
In a first exercise, we replicate our empirical analysis on a subsample covering the period 2017–2018, that is, with 24 observations. Given the number of explanatory variables considered and the nonlinear nature of our model (including 11 explanatory variables), this is the smallest sample to be considered without being subjected to severe finite-sample bias. Table 8 reports the estimation results.
These results are qualitatively equivalent to those obtained for the full sample covering the period 2013–2018, and the main previous findings still hold. It can be noted that SRI mutual funds do not perform significantly worse than conventional funds do in Europe and the United States. It also appears that SRI scores negatively affect the risk-adjusted returns of all mutual funds.
In a second experiment, we consider time-varying SRI ratings. Although a quick analysis of the Morningstar database would reveal that the SRI ratings do not vary much over time, we estimate the nonlinear panel-augmented Carhart model with a time-varying SRI score, which can thus be expressed as:
Because of data availability, only seven monthly historical SRI ratings are available for the US. Table 9 reports the results obtained.
The results obtained using time-varying SRI scores are qualitatively similar to those obtained with static SRI scores and are reported in Table 7. First, these results indicate that considering static or time-varying scores does not matter for the result, as SRI scores are not very volatile. Such a result supports the long-term commitment to ethical objectives. Second, it turns out again that asset managers’ ESG signals thus do not harm funds’ performance. In contrast, we observe that the estimated coefficient of the (which holds for all mutual funds) is negative and significantly different from zero.
In a third experiment, we split the into two distinct components: the ESG score, which considers environmental, social and governance commitments, and the Controversy score, which evaluates risks associated with a controversy. Both measures correspond to effective measures and not to ESG signals. The results of the estimation are reported in Table 10.
It appears that both the ESG and Controversy scores have negative and significant impacts on mutual funds’ risk-adjusted performance. This confirms that both aspects of ethics have a cost in terms of performance. Interestingly, the magnitude of the Controversy score is twice as large as that of the ESG score, suggesting that it is of greater importance. Such a finding can be explained by the construction of the Controversy index, which relies on a 5-class categorization10 before normalization on a 0–100 scale.
In a fourth and final robustness check, we include the MSCI ratings in our CAPM regression. In focusing on the ESG scores provided by these two data providers, the aim is to check whether our results are robust to different extra-financial data sources (see Berget al. (2019)). The two ESG scores are comparable because they measure the portfolio exposures to companies involved in environmental, social and governance challenges. Both ESG scores are fund-level measures built aggregating firm-level ratings. Morningstar and MSCI thus provide continuous and normalized ratings.11 Although their ESG scores are very similar, they nevertheless present a difference: Morningstar ratings are free of industrial bias, whereas MSCI ratings are not. Thus, our experiment constitutes a robustness check to different extra-financial ratings and to different scoring methodologies. To avoid any selection bias due to the adjustment of the MSCI and Morningstar databases, we restrict our initial sample to institutional mutual funds (assets under management larger than USD/EUR 100 million) because both data providers have excellent coverage on this market segment (sharing approximately of common mutual funds). The results of this experiment are reported in Table 11. First, the results confirm that our conclusions are robust to different extra-financial rating sources. Indeed, the impact of both Morningstar and MSCI ESG scores is negative and significant for the US and Europe. Interestingly, estimated coefficients obtained using the MSCI ESG score are smaller than those obtained with the Morningstar ESG score. It is highly probable that such a difference arises from the industry bias absent in Morningstar but present in MSCI.
6. Conclusions
The information asymmetry in the SRI market has been amplified in recent years via the practice of “ESG-washing”. For opportunistic reasons, some asset managers make unsubstantiated or misleading claims about their own environmental, social and governance commitments. By portraying their mutual funds as socially responsible mutual funds but without any intent to invest, these asset managers send misleading signals to investors in a commercial logic. This practice of information obfuscation contributes to the information asymmetry of this market and to the advantage of asset managers. Initiatives by nongovernmental organizations such as EUROSIF or private third-party certification agencies such as Novethic have not been able to correct this market dysfunction. Indeed, our empirical results provide evidence on ESG-washing: the name and certification of a given fund are not necessarily linked to the investment strategy of the manager. These misleading appearances impact the evaluation of funds’ financial performance, which is often conditioned by their conventional or socially responsible nature.
This ESG-washing concern is rooted in the lack of public governance of the mutual fund industry. Nonprofit and private governance regimes do not have the same enforcement mechanisms as public regulation. Consequently, some European countries have adopted a normative framework based on the creation of public labels. Among them, Belgium and France have instituted labels (e.g., “FinBel” in Belgium and “ISR” and “GreenFin” in France). However, as certification is based on the declarations of managers only, the need for new supervision has emerged. Thus, the European Union has taken over this responsibility from the states with the implementation of the disclosure and taxonomy regulations (resp. Regulations (EU) 2019/2088 and (EU) 2020/852). This regulatory framework aims to make the sustainability profiles of funds easier to assess for investors by using predefined indicators to evaluate the environmental, social and governance (ESG) characteristics used in the investment process. In particular, the vocabulary used by fund managers to qualify the extra-financial performance of their mutual funds is now strictly regulated.
Our findings are in line with the recent literature on the financial and non-financial performances of SR funds. On the one hand, our results highlight the information asymmetry between asset managers and investors. As argued by Statman and Glushkov (2016); Berg et al. (2019), classifying and measuring the non-financial performance of SR mutual funds is anything but easy for investors. Our main analysis provides empirical evidence that SR mutual fund names are not related to their non-financial performance. This result is in line with Espenlaub et al. (2017); El Ghoul and Karoui (2021) who show that some changes in fund names can be limited to “cosmetic changes” (i.e., “ESG–washing”). On the other hand, our empirical results about mutual funds performance indicate that, in Europe only, non-financial disclosures are related to a different exposure to common risk premia. Specifically, using a nonlinear version of the Carhart (1997) model, we find that European mutual funds “ESG” name has an impact on several factor loadings, SMB and HML, but no impact on the market risk premia. This difference between US and European mutual funds is related to the fact that American asset managers cannot give materially deceptive or misleading names to their funds (Investment Company Act of 1940, SEC Rule 35d-1). So, regulation appears to be a relevant manner to limit ESG-washing.
Finally, in a more general framework, our empirical findings indicate that this regulation of socially responsible mutual funds should be extended to conventional funds in the model of US regulation. Indeed, in the US, fund managers cannot give materially deceptive or misleading names to their funds (Investment Company Act of 1940) or change the name in a misleading manner (SEC Rule 35d-1). Our study is therefore part of the current debate on the need to regulate the mutual fund industry as a whole in order to improve the efficiency of this financial market. This debate would benefit from further research about ESG-washing in other markets. For instance, our empirical study focuses on the US and European stock markets. Extending the data sample to other geographical markets among OECD countries and to the corporate bond market would be relevant to generalize the findings. Similarly, studying the impact of the EU taxonomy for sustainable activities via an event study or a difference-in-differences analysis could contribute to highlighting the role of regulation in financial market efficiency.
Author Contributions
Conceptualization, J.-B.H. and B.C.; methodology, J.-B.H.; software, J.-B.H. and Q.L.; validation, J.-B.H. and Q.L.; formal analysis, J.-B.H. and Q.L.; investigation, J.-B.H. and Q.L.; resources, Q.L.; data curation, Q.L.; writing—original draft preparation, B.C., J.-B.H. and Q.L.; writing—review and editing, J.-B.H.; visualization, Q.L.; supervision, B.C. and J.-B.H.; project administration, J.-B.H.; funding acquisition, J.-B.H. and Q.L. All authors have read and agreed to the published version of the manuscript.
Funding
This research was performed as part of a research program titled “Risk Management, Investment Strategies and Financial Stability” under the aegis of the Europlace Institute of Finance, a joint initiative with insti7. The usual disclaimer applies.
Institutional Review Board Statement
Not applicable.
Informed Consent Statement
Not applicable.
Data Availability Statement
Data and replication code are available upon request.
Acknowledgments
The authors thank Rob Bauer, Florian Berg, Franz Fuerst, Yannick Le Pen, Arno Riedl and Paul Smeets for helpful comments as well as the seminar participants at the 37th International Conference of the French Finance Association–AFFI (Audencia Business School, 2021), 2nd Annual Conference of the Global Research Alliance for Sustainable Finance and Investment—GRASFI (University of Oxford, 2019), 9th International Conference of the Financial Engineering and Banking Society—FEBS (University of Economics, Prague, 2019), 68th Annual Meeting of the French Economic Association—AFSE (University of Orléans, 2019), the Université Catholique de Louvain (2018) and the Institut Louis Bachelier (2018). This research was conducted as part of the research program entitled “Risk Management, Investment Strategies and Financial Stability” under the aegis of the Europlace Institute of Finance, a joint initiative with Insti7. The usual disclaimer applies.
Conflicts of Interest
The authors declare no conflict of interest. The funders had no role in the design of the study; in the collection, analyses, or interpretation of data; in the writing of the manuscript, or in the decision to publish the results.
Abbreviations
The following abbreviations are used in this manuscript:
| SRI | Socially Responsible Investment |
| ESG | Environmental, Social and corporate Governance |
Appendix A. Description of Morningstar Sustainability Rating
Portfolio sustainability scores are obtained from Morningstar. This score reflects the quality of mutual funds relative to environmental, social and governance (ESG) firm-level scores and is calculated as follows: -4.6cm0cm
The calculation of the Portfolio ESG score is based on data provided by “Sustainalytics”12, a leader in ESG asset rating. To attribute an ESG score to a company (or an asset), Sustainalytics compares a company to other companies in the same industry and uses different indicators on a 0–100 scale. Morningstar then normalizes scores as follows:
Morningstar determines the Portfolio ESG score from the weighted average of asset ESG scores. For a fund to be graded, Morningstar requires the fund to have at least of assets with an ESG score obtained from Sustainalytics (the percentage of assets scored is rescaled to ).
where: and for each i, if .
The portfolio controversy score is also obtained by Sustainalytics. Sustainalytics assesses companies involved in ESG-related incidents on a 0–100 scale. This negatively contributes to the portfolio sustainability score. For a fund to be graded, Morningstar requires that of the fund’s assets have a controversy score assigned by Sustainalytics (the percentage of assets scored is rescaled to ). The portfolio controversy deduction is calculated as follows:
Appendix B. Description of MSCI ESG Fund Metrics
In March 2016, MSCI launched the MSCI ESG Fund Metrics tool to provide fund-level data to investors. Among ESG for the total portfolios, the ESG Quality Score measures the mutual fund exposure of companies that address environmental, social and governance (ESG) challenges. The ESG Quality Score has a high coverage rate (approximately in our dataset and at least in the entire MSCI database), and the score is a composite index built aggregating the firm-level ratings extracted from MSCI ESG Research. The ESG Quality Score has similar features as MSCI’s ESG score: the score is continuously defined and normalized. To allow a fair comparison between Morningstar and MSCI ESG scores, we slightly modify the normalization step to equalize the rating support (Morningstar and MSCI ESG scores are defined between 0–100 and 0–10, respectively). More formally, the MSCI ESG score is denoted and is defined as follows:
Appendix C. Panel Version of Carhart’s Model with Dummy De Jure (Labels)
This model with a dummy for funds that have been certified on ESG criteria is only performed for European mutual funds, as there is no existing unified ESG label in the US.

Table A1.
Estimation of the panel version of Carhart’s model (2013–2018) with labels.
| Europe | ||
|---|---|---|
| Estimates | ||
| −0.0027 | 0.0067 | |
| 0.9765 *** | 0.0192 | |
| 0.1754 *** | 0.0492 | |
| −0.0170 | 0.0234 | |
| 0.0045 | 0.0250 | |
| 0.0012 | 0.0068 | |
| 0.7668 | ||
| Fixed Effects: | ||
| Fund | Yes | |
| Time | Yes | |
| Obs | 40,602 | |
Notes: This table reports estimates of the augmented nonlinear panel version of Carhart’s model (Equation (1)) based on the GLM method with an extra de jure dummy for labeled funds. The Driscoll and Kraay (1998) correction is applied such that standard errors are robust to heteroskedasticity and autocorrelation. , and indicate that the null hypothesis of a zero coefficient is rejected at the , and significance levels.
Appendix D. Survivor Bias
Since the early 1990s, a large body of literature has measured the importance of survivor bias for mutual fund performance (Brown and Goetzmann 1994; Brown et al. 1992; Grinblatt and Titman 1989). This bias occurs with the disappearance of many mutual funds from the market, simply closing or merging with other funds because of weak or poor performance. Neglecting such bias would lead to an overestimation of the funds’ performance. To the best of our knowledge, the CRSP database is the only existing survivorship-corrected and updated mutual fund returns database, but it exclusively focuses on the US mutual funds market.13
As the objective of the paper consists of studying and comparing both the American and European markets, it requires building a comparable database for Europe and the US, particularly with respect to the treatment of survivor bias.14 First, we track every fund existing during our sample period, as in Brown and Goetzmann (1994); Carhart (1997); Malkiel (1995).
Then, following Eltonet al. (1996), we use the risk-adjusted returns and perform a 4-factor CAPM Carhart (1997) using a single-index model. However, our approach differs from previous studies, as we complete missing returns not only at the end of the sample period but also for the missing returns of mutual funds at the beginning of the sample. Indeed, we take into account newly born funds as soon as they exist for at least two years. This decision is motivated by the fact that we will consider a balanced panel framework, and thus, we cannot afford to have missing returns at the end or at the beginning of the sample. In addition, completely excluding these “newborn” funds would have reinforced the issue of selection bias.
-4.5cm0cm [custom]
| 1 | The use of the Morningstar Sustainability Rating and MSCI ESG Fund Metrics databases is a novelty in the literature. To the best of our knowledge, only Hartzmark and Sussman (2019) use fund-level data from Morningstar, showing that investors widely refer to Morningstar Sustainability Rating. However, they are working with pre-categorization SRI ratings (called “globes”), whereas we instead consider continuous ratings (underlying these “globes”). Our choice is motivated by the desire of avoiding potential nonlinear effects in the model. If MSCI ESG Research and MSCI ESG KLD STATS are widely used firm-level databases in the literature (e.g., El Ghoul and Karoui (2017)), the introduction and use of MSCI ESG Fund Metrics is an innovation. Compared to other data providers, Morningstar and MSCI are the only ones that provide fund-level and historical SRI and ESG scores. |
| 2 | A description of the rating methodology developed by Morningstar is presented in Appendix A. |
| 3 | A description of the rating methodology developed by MSCI is presented in Appendix B. |
| 4 | Terminology available at https://www.ussif.org/sribasics—accessed on 4 November 2021. |
| 5 | See Princeton University “About WordNet.” WordNet. Princeton University. 2010. |
| 6 | |
| 7 | When considering the management fees of the mutual funds, we do not observe significant differences across categories. Instead, mutual funds holding a sustainable fund label are associated with significantly higher management fees, suggesting that asset managers charge investors for the certification by non-financial rating agencies. Considering our data sample, we find that mutual funds holding the Novethic label are associated with fees being on average 39.78% higher than the other socially responsible mutual funds. |
| 8 | |
| 9 | The overall () is the sum of the full-sample () and the specific to socially responsible funds () such that = . |
| 10 | The score ranges from 0, which means no controversy, to 5, which indicates high controversy. |
| 11 | We slightly modify the normalization of MSCI ESG score to scale the rating between 0 and 100 instead of 0 and 10 to make the interpretation of the coefficients easier. See Appendixes Appendix A and Appendix B. |
| 12 | http://www.sustainalytics.com—accessed on 4 November 2021. |
| 13 | |
| 14 | See Hanke et al. (2018) on the causes of the non-comparability of different databases such as CRSP and Morningstar. |
References
- Adrian, Tobias, and Markus K Brunnermeier. 2016. Covar. The American Economic Review 106: 1705. [Google Scholar] [CrossRef]
- Akerlof, George. 1970. The market for “lemons”: Quality uncertainty and the market mechanism. Quarterly Journal of Economics 84: 488–500. [Google Scholar] [CrossRef]
- Ando, Tomohiro, and Jushan Bai. 2015. Asset pricing with a general multifactor structure. Journal of Financial Econometrics 13: 556–604. [Google Scholar] [CrossRef]
- Argyropoulos, Christos, Bertrand Candelon, Jean-Baptiste Hasse, and Ekaterini Panopoulou. 2020. Toward a Macroprudential Regulatory Framework for Mutual Funds. Technical report. Louvain-La-Neuve: Université Catholique de Louvain, Louvain Finance (LFIN). [Google Scholar]
- Armstrong, Will J., Egemen Genc, and Marno Verbeek. 2019. Going for gold: An analysis of morningstar analyst ratings. Management Science 65: 2310–27. [Google Scholar]
- Bauer, Rob, Kees Koedijk, and Roger Otten. 2005. International evidence on ethical mutual fund performance and investment style. Journal of Banking & Finance 29: 1751–67. [Google Scholar]
- Berg, Florian, Julian F. Koelbel, and Roberto Rigobon. 2019. Aggregate confusion: The Divergence of ESG Ratings. Cambridge: MIT Sloan School of Management. [Google Scholar]
- Berrone, Pascual, Andrea Fosfuri, and Liliana Gelabert. 2017. Does greenwashing pay off? understanding the relationship between environmental actions and environmental legitimacy. Journal of Business Ethics 144: 363–79. [Google Scholar] [CrossRef]
- Blomquist, Johan, and Joakim Westerlund. 2013. Testing slope homogeneity in large panels with serial correlation. Economics Letters 121: 374–78. [Google Scholar] [CrossRef]
- Bollen, Nicolas P. B. 2007. Mutual fund attributes and investor behavior. Journal of Financial and Quantitative Analysis 42: 683–708. [Google Scholar] [CrossRef] [Green Version]
- Borgers, Arian, Jeroen Derwall, Kees Koedijk, and Jenke Ter Horst. 2015. Do social factors influence investment behavior and performance? evidence from mutual fund holdings. Journal of Banking & Finance 60: 112–26. [Google Scholar]
- Brown, Stephen J., and William Goetzmann. 1994. Attrition and mutual fund performance. Journal of Finance 49: 57–82. [Google Scholar]
- Brown, Stephen J., William Goetzmann, Roger G. Ibbotson, and Stephen A. Ross. 1992. Survivorship bias in performance studies. The Review of Financial Studies 5: 553–80. [Google Scholar] [CrossRef] [Green Version]
- Carhart, Mark M. 1997. On persistence in mutual fund performance. The Journal of Finance 52: 57–82. [Google Scholar] [CrossRef]
- Cooper, Michael J., Huseyin Gulen, and P. Raghavendra Rau. 2005. Changing names with style: Mutual fund name changes and their effects on fund flows. The Journal of Finance 60: 2825–58. [Google Scholar] [CrossRef] [Green Version]
- Driscoll, John C., and Aart C. Kraay. 1998. Consistent covariance matrix estimation with spatially dependent panel data. Review of Economics and Statistics 80: 549–60. [Google Scholar] [CrossRef]
- El Ghoul, Sadok, and Aymen Karoui. 2017. Does corporate social responsibility affect mutual fund performance and flows? Journal of Banking & Finance 77: 53–63. [Google Scholar]
- El Ghoul, Sadok, and Aymen Karoui. 2020. Fund names vs. family names: Implications for mutual fund flows. Family Names: Implications for Mutual Fund Flows, April 7. [Google Scholar]
- El Ghoul, Sadok, and Aymen Karoui. 2021. What’s in a (green) name? the consequences of greening fund names on fund flows, turnover, and performance. Finance Research Letters 39: 101620. [Google Scholar] [CrossRef]
- Ellison, Glenn, and Sara Fisher Ellison. 2009. Search, obfuscation, and price elasticities on the internet. Econometrica 77: 427–52. [Google Scholar]
- Elton, Edwin J., Martin J. Gruber, and Christopher R. Blake. 1996. Survivor bias and mutual fund performance. The Review of Financial Studies 9: 1097–120. [Google Scholar] [CrossRef]
- Espenlaub, Susanne, Imtiaz ul Haq, and Arif Khurshed. 2017. It’s all in the name: Mutual fund name changes after sec rule 35d-1. Journal of Banking & Finance 84: 123–34. [Google Scholar]
- Fama, Eugene F., and Kenneth R. French. 1993. Common risk factors in the returns on stocks and bonds. Journal of Financial Economics 33: 3–56. [Google Scholar] [CrossRef]
- Fama, Eugene F., and Kenneth R. French. 2007. Disagreement, tastes, and asset prices. Journal of Financial Economics 83: 667–89. [Google Scholar] [CrossRef]
- Fellbaum, Christiane. 1998. A semantic network of english verbs. WordNet: An electronic Lexical Database 3: 153–78. [Google Scholar]
- Flammer, Caroline. 2021. Corporate green bonds. Journal of Financial Economics 142: 499–516. [Google Scholar] [CrossRef]
- Goldreyer, Elizabeth F., and J. David Diltz. 1999. The performance of socially responsible mutual funds: Incorporating sociopolitical information in portfolio selection. Managerial Finance 25: 23–36. [Google Scholar] [CrossRef]
- Green, T. Clifton, and Russell Jame. 2013. Company name fluency, investor recognition, and firm value. Journal of Financial Economics 109: 813–34. [Google Scholar] [CrossRef]
- Grinblatt, Mark, and Sheridan Titman. 1989. Mutual fund performance: An analysis of quarterly portfolio holdings. Journal of Business 62: 393–416. [Google Scholar] [CrossRef]
- Hamilton, Sally, Hoje Jo, and Meir Statman. 1993. Doing well while doing good? the investment performance of socially responsible mutual funds. Financial Analysts Journal 49: 62–66. [Google Scholar] [CrossRef]
- Hanke, Bernd, Aneel Keswani, Garrett Quigley, and Maxim Zagonov. 2018. Survivorship bias and comparability of uk open-ended fund databases. Economics Letters 172: 110–14. [Google Scholar] [CrossRef]
- Hansen, Bruce E. 2000. Sample splitting and threshold estimation. Econometrica 68: 575–603. [Google Scholar] [CrossRef] [Green Version]
- Hartzmark, Samuel M., and Abigail B. Sussman. 2019. Do investors value sustainability? a natural experiment examining ranking and fund flows. The Journal of Finance 74: 2789–837. [Google Scholar] [CrossRef]
- Jacobs, Heiko, and Alexander Hillert. 2016. Alphabetic bias, investor recognition, and trading behavior. Review of Finance 20: 693–723. [Google Scholar] [CrossRef]
- Lyon, Thomas P., and John W. Maxwell. 2011. Greenwash: Corporate environmental disclosure under threat of audit. Journal of Economics & Management Strategy 20: 3–41. [Google Scholar]
- Lyon, Thomas P., and A. Wren Montgomery. 2015. The means and end of greenwash. Organization & Environment 28: 223–49. [Google Scholar]
- Malkiel, Burton G. 1995. Returns from investing in equity mutual funds 1971 to 1991. The Journal of Finance 50: 549–72. [Google Scholar] [CrossRef]
- Marquis, Christopher, Michael W. Toffel, and Yanhua Zhou. 2016. Scrutiny, norms, and selective disclosure: A global study of greenwashing. Organization Science 27: 483–504. [Google Scholar] [CrossRef]
- Miller, George A. 1995. Wordnet: A lexical database for english. Communications of the ACM 38: 39–41. [Google Scholar] [CrossRef]
- Nofsinger, John, and Abhishek Varma. 2014. Socially responsible funds and market crises. Journal of Banking & Finance 48: 180–93. [Google Scholar]
- Pesaran, M. Hashem, and Takashi Yamagata. 2008. Testing slope homogeneity in large panels. Journal of Econometrics 142: 50–93. [Google Scholar] [CrossRef] [Green Version]
- Petersen, Mitchell A. 2009. Estimating standard errors in finance panel data sets: Comparing approaches. The Review of Financial Studies 22: 435–80. [Google Scholar] [CrossRef] [Green Version]
- Renneboog, Luc, Jenke Ter Horst, and Chendi Zhang. 2008. The price of ethics and stakeholder governance: The performance of socially responsible mutual funds. Journal of Corporate Finance 14: 302–22. [Google Scholar] [CrossRef]
- Riley, John G. 1979. Informational equilibrium. Econometrica: Journal of the Econometric Society 47: 331–59. [Google Scholar] [CrossRef]
- Schwartz, Mark S. 2003. The “ethics” of ethical investing. Journal of Business Ethics 43: 195–213. [Google Scholar] [CrossRef]
- Schwert, G. William. 2003. Anomalies and market efficiency. Handbook of the Economics of Finance 1: 939–74. [Google Scholar]
- Spence, M. 1973. Job market signaling. The Quarterly Journal of Economics 87: 355–74. [Google Scholar] [CrossRef]
- Statman, Meir. 2000. Socially responsible mutual funds (corrected). Financial Analysts Journal 56: 30–39. [Google Scholar] [CrossRef]
- Statman, Meir, and Denys Glushkov. 2016. Classifying and measuring the performance of socially responsible mutual funds. The Journal of Portfolio Management 42: 140–51. [Google Scholar] [CrossRef]
Figure 1.
Density functions of mutual funds’ SRI scores: Europe and the United States. Notes: This figure plots the distribution of SRI scores of European and US mutual funds. Scores proxy for de facto SRI. The classification “Conventional”/”SRI” represents de jure SRI. Distributions of the ESG scores from Morningstar and MSCI exhibit the same features (figure available upon request).

Figure 2.
Scheme of the SRI classification from the density function of the SRI score. Notes: This figure is an illustrative scheme of the 2-dimensional measure of SRI. The left-hand distribution corresponds to the conventional mutual funds (category A ∪ B), and the right-hand distribution corresponds to the de jure socially responsible mutual funds (category C ∪ D). Specifically, we define two thresholds ( and ) to distinguish subcategories (A, B, C and D). Then, mutual funds to the left of the threshold (subcategory A) correspond to conventional mutual funds with low scores, whereas mutual funds to the right of the threshold (subcategory B) correspond to conventional mutual funds with high scores. Similarly, de jure socially responsible mutual funds to the left of the threshold (subcategory C) correspond to de jure socially responsible mutual funds with low scores, whereas mutual funds to the right of the threshold (subcategory D) correspond to de jure socially responsible mutual funds with high scores.

Table 1.
SRI Terminology.
| Nofsinger and Varma (2014) | Extended Dictionary |
|---|---|
| Baptist | Baptist |
| Christian | blue |
| environment | carbon |
| ethical | Catholic |
| ethics | Christian |
| faith | climate |
| green | community |
| Islam | durable |
| Lutheran | environment |
| religion | ESG |
| Social | ethical |
| socially | faith |
| sustainable | governance |
| sustainability | green |
| human rights | |
| impact | |
| Islam | |
| Lutheran | |
| mission | |
| moral | |
| peace | |
| philosophy | |
| religion | |
| responsible | |
| social | |
| solidarity | |
| subsidiarity | |
| sustainable | |
| sustainability | |
| values |
Table 2.
Europe/US–Descriptive Statistics–Conventional vs. de jure socially responsible (SR) mutual funds.
Table 2.
Europe/US–Descriptive Statistics–Conventional vs. de jure socially responsible (SR) mutual funds.
| Europe | |||
|---|---|---|---|
| Conventional funds | de jure SR funds | Total | |
| Number | 554 | 52 | 606 |
| 55.18 | 57.61 | 55.39 | |
| 1.996 | 1.953 | 2.103 | |
| The United States | |||
| Conventional funds | de jure SR funds | Total | |
| Number | 862 | 25 | 887 |
| 45.85 | 48.19 | 45.92 | |
| 1.725 | 1.500 | 1.761 | |
Notes: This table reports the number of funds included in our database and the corresponding SRI rating means and standard errors.
Table 3.
Categorization of funds according to de jure/de facto SRI.
| Europe | ||
|---|---|---|
| Conventional Real. | Ethical Real. | |
| Conventional Obj. | A n = 276 (49.82%) | B n = 278 (50.18%) |
| Ethical Obj. | C n = 23 (44.23%) | D n = 29 (55.77%) |
| The United States | ||
| Conventional Real. | Ethical Real. | |
| Conventional Obj. | A n = 510 (59.16%) | B n = 352 (40.84%) |
| Ethical Obj. | C n = 9 (36.00%) | D n = 16 (64.00%) |
Notes: This table reports the categorization of mutual funds. The double entry table classifies funds relative to asset managers’ commitments (de jure ESG) and to their realized investments (de facto ESG). Category A ∪ B (resp. C ∪ D) corresponds to the de jure conventional (resp. de jure socially responsible) mutual funds. Category A ∪ C (resp. B ∪ D) corresponds to the mutual funds with low ESG ratings (resp. high ESG ratings), considered as the de facto conventional (resp. de facto socially responsible) mutual funds. Subcategory A (resp. B) corresponds to conventional mutual funds with low (resp. high) SRI scores. Subcategory C (resp. D) corresponds to de jure socially responsible mutual funds with low (resp. high) SRI scores.
Table 4.
Descriptive statistics—Mutual fund performance—2013–2018.
| Europe | ||||
|---|---|---|---|---|
| AB | CD | AC | BD | |
| Fund Return () | ||||
| Fund Risk () | ||||
| Sharpe () | 0.615 | 0.713 | 0.641 | 0.606 |
| The United States | ||||
| AB | CD | AC | BD | |
| Fund Return () | ||||
| Fund Risk () | ||||
| Sharpe () | 1.285 | 1.310 | 1.309 | 1.251 |
Notes: This table reports the annualized average returns of different types of funds. It also reports corresponding standard deviations and Sharpe ratios. Category A ∪ B (resp. C ∪ D) corresponds to the de jure conventional (resp. de jure socially responsible) mutual funds. Category A ∪ C (resp. B ∪ D) corresponds to the mutual funds with low ESG scores (resp. high ESG scores), considered as the de facto conventional (resp. de facto socially responsible) mutual funds. Subcategory A (resp. B) corresponds to conventional mutual funds with low (resp. high) de facto SRI scores. Subcategory C (resp. D) corresponds to de jure socially responsible mutual funds with low (resp. high) de facto SRI scores.
Table 5.
Estimation of the panel version of Carhart’s model (2013–2018).
| Europe | US | |||
|---|---|---|---|---|
| Estimates | Estimates | |||
| −0.0018 | 0.0135 | −0.0017 | 0.0011 | |
| 0.980 3 *** | 0.0185 | 1.0068 *** | 0.0084 | |
| 0.1996 *** | 0.0465 | 0.0711 *** | 0.0158 | |
| −0.0268 | 0.0215 | −0.0470 ** | 0.0210 | |
| 0.0031 | 0.0239 | 0.0207 | 0.0217 | |
| 0.7599 | 0.8466 | |||
| Fixed Effects: | ||||
| Fund | Yes | Yes | ||
| Time | Yes | Yes | ||
| Obs | 40,602 | 59,429 | ||
Notes: This table reports estimates of the augmented nonlinear panel version of Carhart’s model (Equation (1)) based on the GLM method. The Driscoll and Kraay (1998) correction is applied such that standard errors are robust to heteroskedasticity and autocorrelation. The notations , and indicate that the null hypothesis of a zero coefficient is rejected at the , and significance levels.
Table 6.
Estimation of the panel version of Carhart’s model (2013–2018) with dummy de jure.
| Europe | US | |||
|---|---|---|---|---|
| Estimates | Estimates | |||
| −0.0018 | 0.0069 | −0.0017 | 0.0010 | |
| 0.9803 *** | 0.0185 | 1.0068 *** | 0.0084 | |
| 0.1996 *** | 0.0465 | 0.0711 *** | 0.0158 | |
| −0.0268 | 0.0215 | −0.0470 ** | 0.0210 | |
| 0.0031 | 0.0239 | 0.0207 | 0.0217 | |
| 0.0011 | 0.0073 | 0.0041 | 0.0020 | |
| 0.7545 | 0.8464 | |||
| Fixed Effects: | ||||
| Fund | Yes | Yes | ||
| Time | Yes | Yes | ||
| Obs | 40,602 | 59,429 | ||
Notes: This table reports estimates of the augmented nonlinear panel version of Carhart’s model (Equation (1)) based on the GLM method with an extra de jure dummy. The Driscoll and Kraay (1998) correction is applied such that standard errors are robust to heteroskedasticity and autocorrelation. The notations , and indicate that the null hypothesis of a zero coefficient is rejected at the , and significance levels.
Table 7.
Estimation of the augmented nonlinear panel version of Carhart’s model (2013–2018).
| Europe | US | |||
|---|---|---|---|---|
| Estimates | Estimates | |||
| Full Sample | ||||
| 0.0088 ** | 0.0035 | 0.0094 *** | 0.0028 | |
| 0.9638 *** | 0.0178 | 1.0218 *** | 0.0141 | |
| 0.1136 *** | 0.0312 | 0.0896 *** | 0.0259 | |
| −0.0953 *** | 0.0315 | −0.0361 | 0.0271 | |
| −0.0192 | 0.0145 | −0.0006 | 0.0140 | |
| de jure Socially Responsible Mutual Funds | ||||
| −0.0013 *** | 0.0003 | −0.0004 * | 0.0003 | |
| 0.0181 | 0.0175 | −0.0154 | 0.0143 | |
| 0.0940 *** | 0.0336 | −0.0190 | 0.0261 | |
| 0.0750 ** | 0.0345 | −0.0112 | 0.0283 | |
| 0.0244 | 0.0188 | 0.0219 * | 0.0116 | |
| de facto SRI Score | ||||
| −0.0118 ** | 0.0000 | −0.0170 *** | 0.0000 | |
| 0.7528 | 0.8418 | |||
| Fixed Effects: | ||||
| Fund | Yes | Yes | ||
| Time | Yes | Yes | ||
| Obs | 40,602 | 59,429 | ||
Notes: This table reports estimates of the augmented nonlinear panel version of Carhart’s model (Equation (4)) based on the GLM method. The Driscoll and Kraay (1998) correction is applied such that standard errors are robust to heteroskedasticity and autocorrelation. The notations , and indicate that the null hypothesis of a zero coefficient is rejected at the , and significance levels.
Table 8.
Static (constant SRI ratings) estimation of the augmented nonlinear panel version of Carhart’s model (2017–2018).
Table 8.
Static (constant SRI ratings) estimation of the augmented nonlinear panel version of Carhart’s model (2017–2018).
| Europe | US | |||
|---|---|---|---|---|
| Estimates | Estimates | |||
| Full Sample | ||||
| 0.0129 | 0.0127 | 0.0266 | 0.0275 | |
| 0.8951 *** | 0.0316 | 0.9625 *** | 0.0121 | |
| −0.0549 | 0.0607 | −0.0243 | 0.0244 | |
| −0.1095 ** | 0.0165 | −0.0696 | 0.0759 | |
| 0.1086 *** | 0.0368 | −0.0152 | 0.0608 | |
| de jure Socially Responsible Mutual Funds | ||||
| −0.0007 | 0.0007 | −0.0014 | 0.0011 | |
| 0.0367 | 0.0240 | 0.0066 | 0.0088 | |
| 0.1379 *** | 0.0277 | −0.0123 | 0.0119 | |
| 0.0727 ** | 0.0287 | 0.0943 | 0.0720 | |
| 0.0463 * | 0.0229 | 0.1012 | 0.0501 | |
| de facto SRI Score | ||||
| −0.0213 *** | 0.0001 | −0.0524 ** | 0.0001 | |
| 0.7566 | 0.8381 | |||
| Fixed Effects: | ||||
| Fund | Yes | Yes | ||
| Time | Yes | Yes | ||
| Obs | 7,878 | 11,531 | ||
Notes: This table reports estimates of the augmented nonlinear panel version of Carhart’s model (Equation (4)) derived from the GLM method. The Driscoll and Kraay (1998) correction is applied such that standard errors are robust to heteroskedasticity and autocorrelation. The notations , and indicate that the null hypothesis of a zero coefficient is rejected at the , and significance levels.
Table 9.
Dynamic (time-varying SRI ratings) estimation of the augmented nonlinear panel version of Carhart’s model (2017–2018).
Table 9.
Dynamic (time-varying SRI ratings) estimation of the augmented nonlinear panel version of Carhart’s model (2017–2018).
| Europe | US | |||
|---|---|---|---|---|
| Estimates | Estimates | |||
| Full Sample | ||||
| 0.0118 | 0.0145 | 0.0071 | 0.0065 | |
| 0.9083 *** | 0.0326 | 0.9277 *** | 0.0331 | |
| −0.0496 | 0.0620 | 0.0100 | 0.0394 | |
| −0.0989 *** | 0.0172 | −0.0358 | 0.0580 | |
| 0.1085 *** | 0.0381 | −0.0271 | 0.0357 | |
| de jure Socially Responsible Mutual Funds | ||||
| −0.0006 | 0.0007 | −0.0003 | 0.0008 | |
| 0.0174 | 0.0221 | 0.0127 | 0.0340 | |
| 0.1348 *** | 0.0293 | −0.0140 | 0.0415 | |
| 0.0659 ** | 0.0281 | 0.0876 | 0.0607 | |
| 0.0496 * | 0.0231 | 0.0986 | 0.0385 | |
| de facto SRI Score | ||||
| −0.0196 *** | 0.0001 | −0.0154 *** | 0.0001 | |
| 0.7515 | 0.7980 | |||
| Fixed Effects: | ||||
| Fund | Yes | Yes | ||
| Time | Yes | Yes | ||
| Obs | 7,878 | 11,531 | ||
Notes: This table reports estimates of the augmented nonlinear panel version of Carhart’s model (Equation (5)) derived from the GLM method. The Driscoll and Kraay (1998) correction is applied such that standard errors are robust to heteroskedasticity and autocorrelation. The notations , and indicate that the null hypothesis of a zero coefficient is rejected at the , and significance levels.
Table 10.
Estimation of the augmented nonlinear panel version of Carhart’s model (2013–2018) with ESG and Controversy scores.
Table 10.
Estimation of the augmented nonlinear panel version of Carhart’s model (2013–2018) with ESG and Controversy scores.
| Europe | US | |||
|---|---|---|---|---|
| Estimates | Estimates | |||
| Full Sample | ||||
| 0.0121 *** | 0.0004 | 0.0083 *** | 0.0020 | |
| 0.9638 *** | 0.0178 | 1.0218 *** | 0.0141 | |
| 0.1136 *** | 0.0312 | 0.0896 *** | 0.0267 | |
| −0.0953 *** | 0.0315 | −0.0361 | 0.0297 | |
| −0.0192 | 0.0145 | −0.0007 | 0.0119 | |
| de jure Socially Responsible Mutual Funds | ||||
| −0.0012 *** | 0.0003 | −0.0002 | 0.0002 | |
| 0.0181 | 0.0175 | −0.0154 | 0.0144 | |
| 0.0940 *** | 0.0336 | −0.0190 | 0.0261 | |
| 0.0750 ** | 0.0345 | −0.0112 | 0.0283 | |
| 0.0244 | 0.0188 | 0.0220 * | 0.0116 | |
| de facto SRI Score | ||||
| −0.0139 *** | 0.0001 | 0.0000 | 0.0000 | |
| −0.0215 *** | 0.0001 | −0.0130 *** | 0.0000 | |
| 0.7527 | 0.8416 | |||
| Fixed Effects: | ||||
| Fund | Yes | Yes | ||
| Time | Yes | Yes | ||
| Obs | 40,602 | 59,429 | ||
Notes: This table reports estimates of the augmented nonlinear panel version of Carhart’s model (Equation (4)) based on the GLM method. The Driscoll and Kraay (1998) correction is applied such that standard errors are robust to heteroskedasticity and autocorrelation. The notations ***, ** and * indicate that the null hypothesis of a zero coefficient is rejected at the 99%, 95% and 90% significance levels.
Table 11.
Estimation of the augmented nonlinear panel version of Carhart’s model (2013–2018).
| Europe | US | |||||||
|---|---|---|---|---|---|---|---|---|
| Morningstar | MSCI | Morningstar | MSCI | |||||
| Estimates | Estimates | Estimates | Estimates | |||||
| Full Sample | ||||||||
| 0.0240 *** | 0.0043 | 0.0096 *** | 0.0019 | 0.0549 ** | 0.0239 | 0.0079** | 0.0036 | |
| 0.9859 *** | 0.0052 | 0.9859 *** | 0.0052 | 1.0127 *** | 0.0043 | 1.0127 *** | 0.0043 | |
| 0.1327 *** | 0.0219 | 0.1327 *** | 0.0219 | 0.0799 *** | 0.011 | 0.0799 *** | 0.0110 | |
| −0.1067 *** | 0.0218 | −0.1067 *** | 0.0218 | −0.0541 *** | 0.0138 | −0.0541 *** | 0.0138 | |
| −0.0381 *** | 0.0087 | −0.0381 *** | 0.0087 | 0.0196 | 0.0142 | 0.0196 | 0.0142 | |
| de jure Socially Responsible Mutual Funds | ||||||||
| −0.0022 *** | 0.0008 | −0.0043 *** | 0.0012 | −0.0010 | 0.0008 | −0.0047 *** | 0.0015 | |
| 0.0108 *** | 0.0037 | 0.0108 *** | 0.0037 | −0.0043 * | 0.0024 | −0.0043 * | 0.0024 | |
| 0.0599 *** | 0.0145 | 0.0599 *** | 0.0145 | −0.0095 ** | 0.0047 | −0.0095 ** | 0.0047 | |
| 0.0287 *** | 0.0084 | 0.0287 *** | 0.0084 | −0.0073 | 0.0101 | −0.0073 | 0.0101 | |
| 0.0554 *** | 0.0053 | 0.0554 *** | 0.0053 | 0.0073 * | 0.0042 | 0.0073 * | 0.0042 | |
| de facto SRI Score | ||||||||
| −0.0340 *** | 0.0062 | −0.0104 *** | 0.0020 | −0.0993 ** | 0.0442 | −0.0089 * | 0.0053 | |
| 0.7569 | 0.7569 | 0.8478 | 0.8478 | |||||
| Fixed Effects: | ||||||||
| Fund | Yes | Yes | Yes | Yes | ||||
| Time | Yes | Yes | Yes | Yes | ||||
| Obs | 14,606 | 14,606 | 42,478 | 42,478 | ||||
Notes: This table reports estimates of the augmented nonlinear panel version of Carhart’s model (Equation (4)) based on the GLM method. The Driscoll and Kraay (1998) correction is applied such that standard errors are robust to heteroskedasticity and autocorrelation. The notations ***, ** and * indicate that the null hypothesis of a zero coefficient is rejected at the 99%, 95% and 90% significance levels.
Table 12.
Estimation of the augmented nonlinear panel version of Carhart’s model (2013–2018).
| Europe | US | |||
|---|---|---|---|---|
| Estimates | Estimates | |||
| Full Sample | ||||
| 0.0088 *** | 0.0024 | 0.0094 *** | 0.0020 | |
| 0.9638 *** | 0.0103 | 1.0218 *** | 0.0088 | |
| 0.1136 *** | 0.0215 | 0.0896 *** | 0.0129 | |
| −0.0953 *** | 0.0145 | −0.0361 | 0.0144 | |
| −0.0192 | 0.0147 | −0.0006 | 0.0122 | |
| de jure Socially Responsible Mutual Funds | ||||
| −0.0013 *** | 0.0003 | −0.0004 * | 0.0002 | |
| 0.0181 * | 0.0108 | −0.0154 * | 0.0090 | |
| 0.0940 *** | 0.0256 | −0.0190 | 0.0132 | |
| 0.0750 ** | 0.0152 | −0.0112 | 0.0149 | |
| 0.0244 | 0.0154 | 0.0219 * | 0.0126 | |
| de facto SRI Score | ||||
| −0.0118 *** | 0.0000 | −0.0170 *** | 0.0000 | |
| 1.43 *** | 3.91 *** | |||
| Fixed Effects: | ||||
| Fund | Yes | Yes | ||
| Time | Yes | Yes | ||
| Obs | 40,602 | 59,429 | ||
Notes: This table reports estimates of the augmented nonlinear panel version of Carhart’s model (Equation (4)) based on the GMM method. The Driscoll and Kraay (1998) correction is applied such that standard errors are robust to heteroskedasticity and autocorrelation. The notations , and indicate that the null hypothesis of a zero coefficient is rejected at the , and significance levels.
Publisher’s Note: MDPI stays neutral with regard to jurisdictional claims in published maps and institutional affiliations. |
© 2021 by the authors. Licensee MDPI, Basel, Switzerland. This article is an open access article distributed under the terms and conditions of the Creative Commons Attribution (CC BY) license (https://creativecommons.org/licenses/by/4.0/).
Share and Cite
MDPI and ACS Style
Candelon, B.; Hasse, J.-B.; Lajaunie, Q. ESG-Washing in the Mutual Funds Industry? From Information Asymmetry to Regulation. Risks 2021, 9, 199. https://0-doi-org.brum.beds.ac.uk/10.3390/risks9110199
AMA Style
Candelon B, Hasse J-B, Lajaunie Q. ESG-Washing in the Mutual Funds Industry? From Information Asymmetry to Regulation. Risks. 2021; 9(11):199. https://0-doi-org.brum.beds.ac.uk/10.3390/risks9110199
Chicago/Turabian StyleCandelon, Bertrand, Jean-Baptiste Hasse, and Quentin Lajaunie. 2021. "ESG-Washing in the Mutual Funds Industry? From Information Asymmetry to Regulation" Risks 9, no. 11: 199. https://0-doi-org.brum.beds.ac.uk/10.3390/risks9110199
Note that from the first issue of 2016, this journal uses article numbers instead of page numbers. See further details here.