
Myopic Savings Behaviour of Future Polish Pensioners


1
Department of Economics I, Collegium of Economic Analysis, SGH Warsaw School of Economics, 02554 Warsaw, Poland
2
Institute of Labor Economics (IZA), 53113 Bonn, Germany
*
Author to whom correspondence should be addressed.
Risks 2021, 9(2), 36; https://0-doi-org.brum.beds.ac.uk/10.3390/risks9020036
Submission received: 31 December 2020
/
Revised: 1 February 2021
/
Accepted: 2 February 2021
/
Published: 6 February 2021
(This article belongs to the Special Issue Pension Design, Modelling and Risk Management)
Abstract
:Low saving rates combined with low effective retirement age herald old-age poverty. This paper examines the preferred strategies of future Polish pensioners in order to sustain the standard of living in the future. A two-step approach is used: as a first-best strategy, we explore determinants of supplementary saving with binary logistic models; as a second-best strategy, we examine alternative options with principal component analysis. Future retirees rarely accumulate long-term savings, do not use dedicated instruments, and they start to save additionally far too late. Savings are concentrated in wealthier and better educated groups. Such myopia is governed by their political stance and not by awareness of dire prospects. Second-best strategies are based on optimistic assumptions about future health (seeking for additional jobs), on the assumed generosity of acquaintances or social institutions (relying on external assistance), or on rebelling. Given the increasing political power of elder generations, balancing the interests of workers and retirees will be an increasingly difficult task for policy makers.
1. Introduction
Even though population ageing is a common challenge for developed countries, none have been hit as hard as the Central and Eastern European countries in recent decades. The demographic shift of the early 1990s included a significant improvement in life expectancy, and a drop in fertility rates to levels around the lowest-low. Post-war baby-boom cohorts are exiting labour markets on a massive scale, and the burden of prolonged economically inactive lives must be borne. Favourable age structure no longer supports pension systems. Their long-term sustainability is threatened unless the system automatically adjusts to changes in demographic structure.
Such system was introduced in Poland in 1999. Its implementation resulted from the 1993 ruling of the Constitutional Tribunal calling for a systemic reform, reinforced by calls issued by international bodies (World Bank 1994; OECD 1996). Despite several cases of misuse for current political goals and ad hoc tweaks, the main principles of the Polish pension system have remained unchanged for 20 years. These include a strong emphasis on income allocation over the life course, transparency, and a direct link between contributions and benefits, fulfilled within a joint non-financially and financially defined contribution scheme (Góra and Palmer 2004). Contributions are collected on individual accounts, and the benefit (in the form of an annuity) is calculated by dividing the value of the account by unisex life expectancy at retirement age for the individual’s cohort.
From the perspective of a future retiree, this design has clear consequences. There are three options to increase one’s old-age pension: raising the sum of contributions, increasing the contributing period, and delaying retirement. Extraordinarily high rates of return are least likely. The amount of benefit may be increased by supplementary pensions. Apart from the obligatory part, individuals have additional tools for pension saving, and individual account statements with estimated future benefits are sent regularly to the system participants.
All in all, the key message for an individual is that responsibility for one’s own pension is passed onto oneself. Individuals who do not contribute much or do it infrequently should expect lower benefit levels. This refers to cases of low labour participation, interruptions in working careers, fixed-term contracts (only recently and partly covered by contributions), and work in the shadow economy—all of which occur in Poland (Buchholtz et al. 2020). The received amount is the outcome of actions over the whole period of participation in the pension system, preceded by plans, based on knowledge and rational preferences. In consequence, low financial literacy, short-term perspective, and procrastination worsen the individual’s financial standing.
There is also additional historical background. The twentieth century hit the region economically. First, world wars destroyed fixed capital and decimated working-age populations. Second, the subsequent period of a socialist economy successfully undermined incentives for long-term saving due to property nationalisation programmes, currency denominations, periods of high inflation, and inefficient governance. Three decades after the fall of the Iron Curtain, saving habits have not changed dramatically. Despite robust economic growth, doubtlessly Poland is the case of a country which will become old before becoming rich. There is no prospect of extensive support for impoverished elder individuals given the negative demographic dividend and the need to finance benefits from the pre-reform universal system and occupational schemes. Several actions may be undertaken to maintain decent living standards in the last stage of life, including raising caring children, investment in extending employability, and increased savings.
The objective of this paper is to examine the strategies aimed at smoothing consumption in old age by future retirees in Poland. Keeping in mind the historical context, we consider strategies regarding more and less favourable material conditions. In addition, we identify the determinants of actions, and perform strategy segmentation with regard to individual characteristics. To our knowledge, such analysis has neither been performed in the region, nor for countries with a defined contribution pension setting.
The remainder of this paper is organized as follows: Section 2 reviews the literature on individual retirement decision-making processes. Section 3 provides the national context. Section 4 describes methodology. Section 5 and Section 6 present the results of the empirical analysis. The former contains descriptive statistics, drawing a picture of individual pension decisions. The latter—econometric modelling and principal component analysis distinguishing first-best and second-best solutions as well as describing the determinants of the odds of supplementary savings. Section 7 discusses the results in the context of population ageing, social purposes of the pension system, and future social policy. Section 8 concludes.
2. Literature Review
2.1. Rational Retirement Strategy
The journey leading individuals to optimal retirement savings decisions is quite long. First, one needs to be informed about possible options on retirement savings and needs to know future replacement rates and how pension savings work. In that context, financial literacy is important in shaping retirement decisions. The second step is to decide on the behaviour and create a savings plan regarding future retirement. Thirdly, individuals need to stick to this plan and save the planned amount regularly. Only after this step is retirement behaviour complete and affects the welfare of a given individual (Hershey et al. 2010). The actual behaviour of individuals found empirically is far from perfect, which leads to inefficiencies.
2.2. Financial Literacy
Financial literacy is considered to be a necessary, yet not sufficient, precondition of various rational financial decisions, including those related to pensions. Being financially savvy is perceived as necessary in long-term decisions, as it helps in assessing relative profitability and portfolio risks. Sound pension wealth requires some insight in survival probabilities, investment rates, expected values, opportunity cost, as well as compound interest, risk diversification, real rate of return, etc. Recent studies from China (Niu and Zhou 2018), Canada (Boisclair et al. 2017), Malaysia (Kimiyagahlam et al. 2019), Vietnam (Do 2017), Singapore (Koh and Mitchell 2019), and many others show that financial literacy is an important precondition of sound retirement planning (see Goyal and Kumar 2021 for the review). By contrast, financial illiteracy is characterized by diminished probability of planning for retirement, increased propensity to excessive consumption, lower saving rate, suboptimal portfolios, overpaying for financial services, making more errors, and higher probability of abuse. Not surprisingly, financial illiteracy often leads to premature retirement (Klapper et al. 2012). As Fornero and Lo Prete (2019) show on a sample of 21 European countries over the last 20 years, insufficient financial knowledge also increases electoral costs, which are borne by whole societies. Angelici et al. (2020) point out that the gender gap in financial literacy translates into retirement differences between males and females.
There is consensus when it comes to individual-level characteristics correlated with high and low financial literacy levels. In general, most knowledgeable are prime-agers (however, age and cohort effects are significant), men, individuals with better educational background, and urban dwellers (for a comprehensive overview, see Lusardi and Mitchell 2014 or Stolper and Walter 2017). Additionally, there are country effects resulting from historical experiences of inflation, crises, or habits formed in planned economies (Lusardi and Mitchell 2011a). Moreover, knowledge about future pension income can be based on the current experience of retirees, which may be misleading, when retirees fail to accurately take changing conditions into account.
2.3. Retirement Planning
Controlling for endogeneity, retirement planning is a strong predictor of wealth, especially for younger workers (Lusardi and Mitchell 2011b). This hypothesis was confirmed by Almenberg and Säve-Söderbergh (2011) for Sweden, Fornero and Monticone (2011) for Italy, and Bucher-Koenen and Lusardi (2011) for Germany.
The reasons for difficulties in converting knowledge into retirement planning are various and complex. For instance, van Rooij et al. (2007) argue that even though risk aversion in the pension domain is very high, most participants consider themselves as financially illiterate and do not fully understand the details of the pension programme. They also show that individuals lack the financial knowledge to manage their own pension portfolios and prefer to delegate the management of their assets to pension funds.
Moreover, even if financial knowledge is present, there are other obstacles in creating a comprehensive retirement savings plan. Benartzi and Thaler (2007) challenge the assumptions of standard economic models that individuals are able to optimize their behaviour to achieve maximum welfare. Instead, they typically use heuristics and rules-of-thumb in planning their retirement behaviour. Moreover, retirement planning is affected by inevitable inertia and laziness, which may be linked to intellectual difficulties while planning for retirement—Kiso and Hershey (2017) show that about 40% of individuals report moderate to significant discomfort while thinking about retirement. Therefore, the pension plan should require participants to opt out instead of opting in. Simplifying enrolment should also be useful to achieve this goal (cf. Choi et al. 2005).
Nevertheless, the problem with automatic or default enrolment plans is that they impose very low savings rates as well as relatively safe (and therefore, not profitable) forms of investment. Even though many participants are aware that their savings rates are too low, they spend little time elaborating on it. For instance, Hewitt Associates (2002) shows that when employees can decide how much to save, they often choose multiples of 5% or minimal (maximal) rates allowed by the plan. Furthermore, asset diversification strategies are either absent or very naïve. The experiment by Read and Loewenstein (1995) proves that when facing a full spectrum of investment products, simple strategies prevail. Indeed, Butt et al. (2018) show that the default strategies of pension providers do not match the expectations of future retirees, who do not intervene due to lack of knowledge, not interest. As plan providers do not differentiate their strategies based on such traits as income, family size, or health, they will be unsuited to individual conditions and the risk–return balance will be almost always skewed towards less risk, generating insufficient returns. Regulations limiting the size of investment in riskier assets do not help. Salamanca et al. (2020) use the Netherlands pension system to show that the decision on the investment vehicle is often affected by external factors. In their case, the changes in pension funds—the funding ratio, which served as a proxy for pension risk—significantly affected individuals’ decisions on their savings portfolio, contributing to diminishing their lifetime accumulated welfare. On the other hand, Komada et al. (2019) shows that the reaction of Polish retirees-to-be to changes in early retirement eligibility is relatively weak, suggesting that by now, the decision on retirement is shaped primarily by other factors.
In addition, future retirees tend to ask their spouses or friends for financial advice instead of seeking professional help. Duflo and Saez (2002) show the importance of peer effects in the study of American university staff, where colleagues’ choice from the same department was a strong determinant of the savings level. A potential solution to overcome the problem of designing a retirement strategy is to force workers to invest in professionally managed assets. Portfolios of professionally managed funds outperform portfolios of individual investors, even if those who chose individual investing were financially savvy (Cronqvist and Thaler 2004; Benartzi and Thaler 2002). A recent study by Harlow et al. (2020) shows not only that the decision to hire a professional advisor is positively correlated with income and wealth, but also that using their advice increases replacement rates at retirement by 15 percentage points. Therefore, the use of financial advisors is more prevalent in groups that need it less and leads to further increases in retirement inequalities.
Finally, thinking about retirement is unpleasant and requires difficult decision making. It involves thinking about the future self (e.g., an experiment by Hershfield et al. (2011) shows that those who imaged themselves in the future tend to accept later monetary rewards) and requires imaging themselves as ill and inefficient. Furthermore, they require difficult decisions which tend to be postponed (Steel 2010). As Brown et al. (2016) show, procrastination in financial decisions can even predict financial default and therefore, it is important to help employees to overcome this problem while planning for retirement.
2.4. Actual Behaviour
Even if a sound retirement plan is present, the link between retirement intentions and actual behaviour is often not sufficiently strong. An early study by Hurd et al. (2004) claims that although most workers retire as early as possible, there is a small impact of pro-retirement savings patterns. The apparent conflict between the actual and optimal behaviour of pensioners is also a subject of interest for behavioural economics. In general, the reasons for too low retirement savings are believed to be lack of self-control and bounded rationality. Thaler and Shefrin (1981) proposed a model in which lack of self-control is framed as a principal agent problem and showed how to design a system that would make individuals save more for their retirement using their natural tendency to postpone savings. Strömbäck et al. (2017) showed that, indeed, the people with more self-control do save more both for retirement and for other purposes. In general, they behave more financially responsibly, which affects their entire lives.
Actual behaviour at retirement also depends on several factors deeply rooted in psychology. For instance, decisions on saving and the timing of retirement depend on the behaviour of peers (Brown 2013; Chalmers et al. 2008). Additionally, the exact timing of retirement depends on many individual factors and conditions that may differ from those prevalent at the time when the plan was made, such as health status, family needs, or simply demand for leisure (e.g., Chevalier et al. 2013; Scharn et al. 2018). Moreover, research shows that this decision also depends on one’s current labour market status and stock market conditions. For instance, Coile and Levine (2011) found that less educated workers react to changes in unemployment and advance the retirement decision when labour market conditions are unfavourable, while more financially literate workers tend to postpone that decision if stock market return rates are lower, allowing more accrual on their pension accounts. They show that the former effect outweighed the latter during the global financial crisis of 2008–2009. Furthermore, the decision on work-to-retirement transition is heavily influenced by the regulations and the employer. As Philipson et al. (2019) point out, in the past, the retirement policy was used by the governments to facilitate structural changes and fight with unemployment. Even though nowadays this policy is rarely used, technical progress also limits opportunities for people without the appropriate skill set to adjust. Consequently, they are discouraged by employers and the government from delaying retirement. As this applies mostly to poorly paid, low-skilled workers, it further exacerbates the inequalities in retirement benefits. Conversion of retirement plans into actual behaviour is a very important policy issue, which needs to be addressed to ensure sufficient replacement rates.
3. National Context
In 1999, Poland replaced an old universal NDB (non-financially defined benefit) pension system with a new one, an NDC + FDC (non-financially + financially defined contribution) system (typology according to (Góra and Palmer 2004, 2020)). Participants contribute through old-age contributions to individual accounts of two types (NDC and FDC), in total 19.52%. Pension contributions have been paid since 1999, while for older workers, pension rights were recalculated into account values (initial capital). Nonfinancial accounts are indexed to economic growth, while financial ones are invested in financial markets and earn a market-based return (except for the last 10 years before retirement, in order to avoid bad timing risk).
At the moment of retirement, account values (both types of accounts) are annuitized using unisex life tables (for a detailed description, see Buchholtz et al. 2020). The old-age system is also separated from other life risks, including disability pensions. The system adjusts automatically to demographic and economic changes. The minimum pension guarantee is financed outside the pension system via an additional tax-financed top-up payment for those whose own sum of NDC and FDC pension is below the minimum.
As a consequence, under such scheme, redistribution is removed from the universal system and a one-to-one link between contributions and pensions applies. In other words, if one does not contribute consistently, s/he should not expect a sufficient benefit. Reasons for not contributing typically include: low labour market participation, excessive use of fixed-term contracts, penalized individual interruptions (e.g., for part-time workers), and working in the shadow economy (Buchholtz et al. 2020; OECD 2019). Moreover, retiring prematurely significantly reduces the benefit—first, the missed opportunity to save, and second, the lower expected lifetime. This in particular refers to women with the gender pension gap (OECD 2019). As a result, in order to receive sufficient levels of retirement income, one needs to work longer and contribute throughout their whole working life (by contrast to the previous system with the last 10 years binding). Alternatively, individuals preferring early labour market exit need to save on their own.
On the one hand, Poles have a strong preference towards low retirement age. The retirement age reform was withdrawn after 3 years and the legal pension age is 60 for women and 65 for men. Poles have, on average, 30.7 (women) and 36.3 years (men) of working lives (Eurostat). On the other hand, propensity to save remains extremely low (average household saving rate of 2.7% in 2017–2019 and long-term downward trend, Eurostat), and long-term voluntary saving is neglected (Rutecka-Góra 2016). In particular, dedicated and subsidized quasi-compulsory employee capital plans have enrolment at the level of 30% as of 2020. As a consequence, Poland is among countries with the largest projected decrease in replacement rates—according to the European Commission (2018), from 57.8% in 2020 to 40% in 2030, and below 25% in 2045. That assumes retirement age will not be increased, which is unlikely. Nevertheless, by now, the poverty rate has been systematically increasing (35% for a single older household in 2019, Eurostat). However, this might not be fully internalized as the majority of current retirees have their old-age pension benefits either drawn from the old system or at least have a share of favourably recalculated initial capital that was high.
4. Methodology
In this paper, we make use of the micro-database from the Pension awareness of Poles survey (Czapiński and Góra 2016). Its main purpose was to assess the level of pension knowledge and real actions undertaken on one’s initiative. This is the most informative database on what expectations are regarding future pensions and the level of preparedness for retirement, including both saving practice and labour market participation.
The survey covered 1006 working individuals, aged 18–67, regardless of their type of contract. Multi-stage sampling was applied. Due to weighting, the sample is representative for the Polish working population in terms of gender, age, education, and place of residence. The sampling frame was taken from Statistics Poland. The sample characteristics are presented in Table 1.
Analysing the working population has an important rationale. First, workers are a far more homogenous group than the whole labour force (the latter also covers parental leave users, long-term and frictionally unemployed, youth entering the labour market, disability pensioners, etc.). Despite the wide spectrum of contracts, restricting the sample to working respondents leads to more adequate and precise conclusions. Second, workers should be on average more up to date with the rules and changes implemented in the labour market and pension regulations. Finally, asking working individuals excludes unnecessary assumptions on the potential behaviour of the non-working population. The relationship between preferences and actions should be disturbed neither by lack of resources, nor by additional public transfers. Due to this assumption, six respondents combining paid work with receiving (old-age) pension were removed from the sample.
The questionnaire consists of over 40 questions focused on respondents’ own future as a retiree, preferred retirement age, actions undertaken in order to counteract the deterioration in material conditions, and strategies to supplement insufficient income in the last stage of life. Five questions remain as the core interest of this study:
- What material conditions do you expect as a retiree? (better/similar/worse than current retirees with similar tenure and occupation, do not know)
- Do you undertake any actions in order to avoid significant deterioration in material conditions after retiring? (yes, no)
- What type of actions do you undertake? (multiple choice with eight categories)
- Would you make ends meet if you were an old-age pensioner with minimal benefit today? (approx. EUR 200) (yes, no)
- Assuming not making ends meet, would you consider the following actions? (multiple choice with six categories, none, do not know)
The analytical framework is based on the observation that providing a necessary consumption level is the individuals’ responsibility. Regardless of how poorly individuals manage their pension wealth, they have to consume in old age. In consequence, we can distinguish two decision steps. First, we examine actions aimed at providing the necessary level of pension wealth (including compulsory and voluntary savings, regardless of instruments used). Second, we examine actions oriented at making ends meet, provided insufficient pension benefit levels. In the other words, we analyse what other sources may supplement low pension benefits. These two steps are perceived as an approximation of pension strategy.
In this paper, we make use of binary logistic regression and principal component analysis (PCA). The binary logistic regression measures the impact of an incremental change in an independent variable on the odds of an event or a state measured by the dependent variable. In this case, we measure the impact of demographic and socioeconomic variables on undertaking the voluntary actions to counteract the deterioration in material conditions as a retiree. Individuals who declared doing so were assigned as 1, and 0 otherwise. The descriptors included: gender, age groups, education, urbanisation, household size, personal net income, and labour market status. We run three models: a simple and complete model on a full sample (the former pass over the labour status), and a complete model on a subsample of individuals expecting deteriorated material conditions.
Furthermore, logistic regression is used to assess the impact of political attitudes, knowledge of the pension system, and awareness of the possibly gloomy future on savings behaviour. In this step, we extend the model with socioeconomic variables to include different proxies of attitude towards the role of state in providing retirement benefit and answers to questions related to retirement awareness.
Principal component analysis is used to reduce several strategy combinations to a few easy to interpret dimensions. This method was unsuccessful in distinguishing savers (it extracted only two categories: savers and non-savers), but turns out useful in the identification of general groups of actions that provided insufficient levels of income in the last stage of life. The variables used for this exercise included seven dummy variables showing whether the respondent was willing to pursue a given strategy or not. This allowed us to distinguish three types of strategies—relying on external support, working longer at retirement, or rebelling. The scree plot of eigenvalues identified three components. In order to make the interpretation clearer, we implement a VARIMAX rotation procedure and restrict the values displayed to those above |0.3|. Quality of sampling adequacy was examined successfully with the Kaiser–Meyer–Olkin test (0.6504). The abovementioned methods were supplemented with descriptive statistics with a chi-square test, where necessary (the test refers to the unweighted values); α = 0.05.
5. Level of Knowledge and Preparedness of Polish Future Retirees
5.1. Contributing to the Pension System and Expected Benefits
Virtually all respondents declared paying pension contributions. Verification of this declaration may be performed only for several types of contracts (labour-code contracts, self-employed, firm owners, and farmers). Except for the latter group, approx. 4% of respondents declare not paying contributions or no awareness of doing it. Among fixed-term civil-law contract holders, only 60% confirmed paying, 31% denied, and 9% did not know.
Almost half of respondents see no trade-off between working beyond the legal pension age and the benefit level perceived. Statistically significant (at 5% level) differences between answers are observed for farmers (with a separate pension scheme), education level, labour-code contract holders, gender, and age groups. Furthermore, even high education levels do not necessarily translate into comprehensive knowledge. In this group, one in four respondents are unable to estimate how much postponing retirement will increase the old-age pension benefit. The higher the income, the bigger the expected benefits of postponing retirement.
If it was possible to transform compulsory contributions to higher net remuneration, individuals would not be very keen to save the surplus with the pension aim. Only 46% of respondents would prefer doing so, and 20% is not sure. Statistically significant differences are observed for various age, income, and education groups (Figure 1). When analysing how much of this increased net remuneration would be saved for retirement, 56% of respondents were willing to devote for this goal below 30% of the additional net income and only 15% would allocate the whole sum to voluntary pension contributions.
When asked about support for those who saved too little, at least its minimal form was mentioned by 71% of respondents. Within this group, for 35% of respondents, the threshold should be related to current minimal pension; for 23.6%, it should even exceed this level. One in ten individuals are against any form of support. Preference regarding this issue varies among income (the higher the income, the lower the support) and gender (males are generally against).
5.2. Expected Future Living Standards
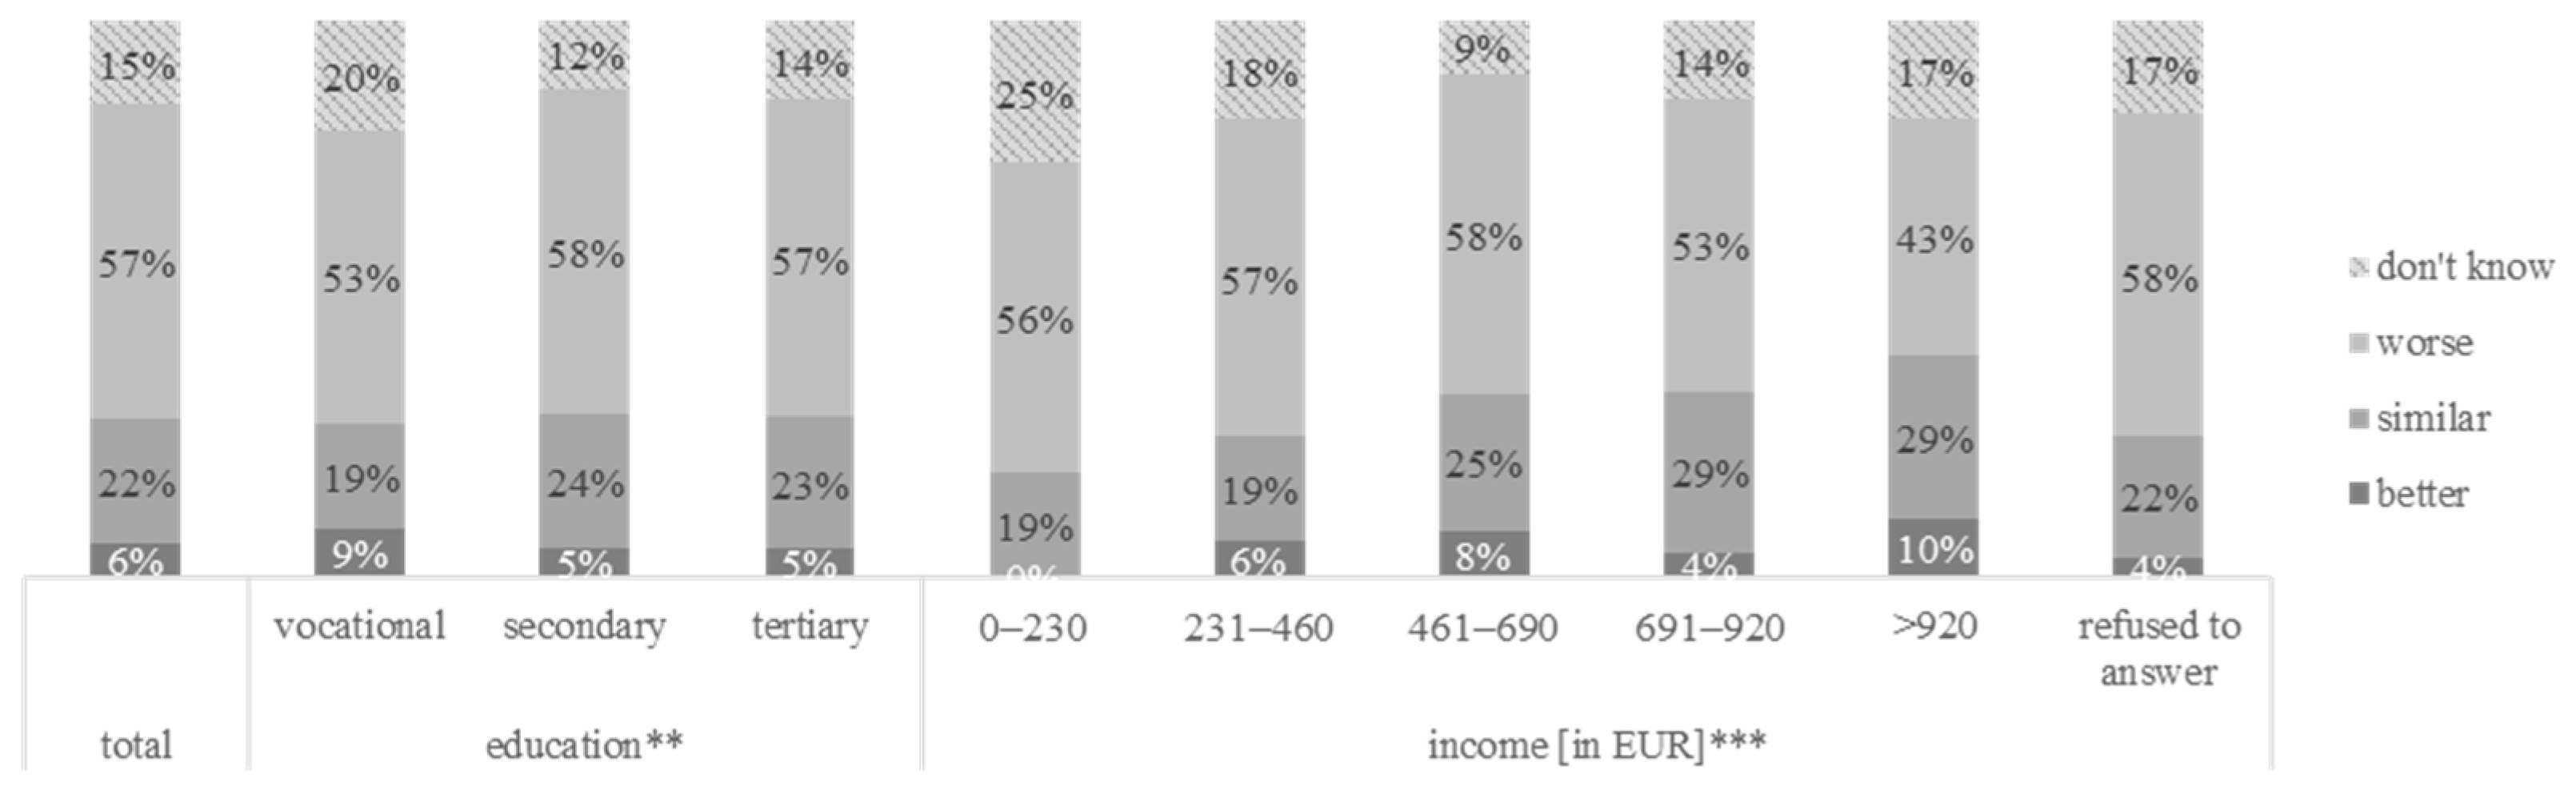
Approximately 57% of respondents expect worsening living conditions compared to today’s old-age pensioners with similar occupation and tenure. This share is quite similar for the majority of analysed cross-sections, except for income and education (Figure 2). The higher the income, the better the prospects. In general, individuals representing the lowest levels of income are least prone to optimism—but at the same time, they most often declare expecting nothing. By contrast, individuals with vocational education are more optimistic or simply do not know what to expect, compared to counterparts with secondary or tertiary education.
The future living standard does not easily transfer to replacement rate. For 38% of respondents, it is impossible to estimate the expected replacement rate. The remaining part declares 0–30%, 30–50%, and over 50% (20–21%) in almost equal amounts. This picture looks completely different when cross-sectioned by assessment of future conditions. The shares of unaware respondents are high, and the better conditions are expected to be, the more individuals refuse to predict their replacement rates. Moreover, those who are not able to describe their expectations either cannot translate them into values (69%) or make a wild guess (31%). Significant confounders also included education, income, and type of labour contract (fixed-term civil-law contract, running own company). When analysing education, as its level increases, so does the share of answers below 50% and the share of do not know answers decreases. For income, the relationship is more complex. Individuals with the lowest income frequently indicate do not know, as do those who do not want to disclose their income. Most sure about low replacement rates (below 50%) are individuals with the highest income.
Even though future replacement rates are either unknown or lower than contemporary ones, there is an option to raise it by postponing the moment one starts receiving old-age pension. The whole population can be divided into three almost equal parts: those who indicate a specific retirement age, those who have no plan to retire (it may not mean the same as work as long as possible, though), and those who do not know yet. When performing cross-sections of this variable by socioeconomic characteristics, only income was significant at the highest levels of significance. Individuals with the lowest declared personal income were most prone to declare specific, low retirement age. By contrast, respondents with the highest income most frequently indicated no plans to retire. When choosing the specific retirement age, they also declared a higher one.
5.3. Maintaining Sufficient Living Standard
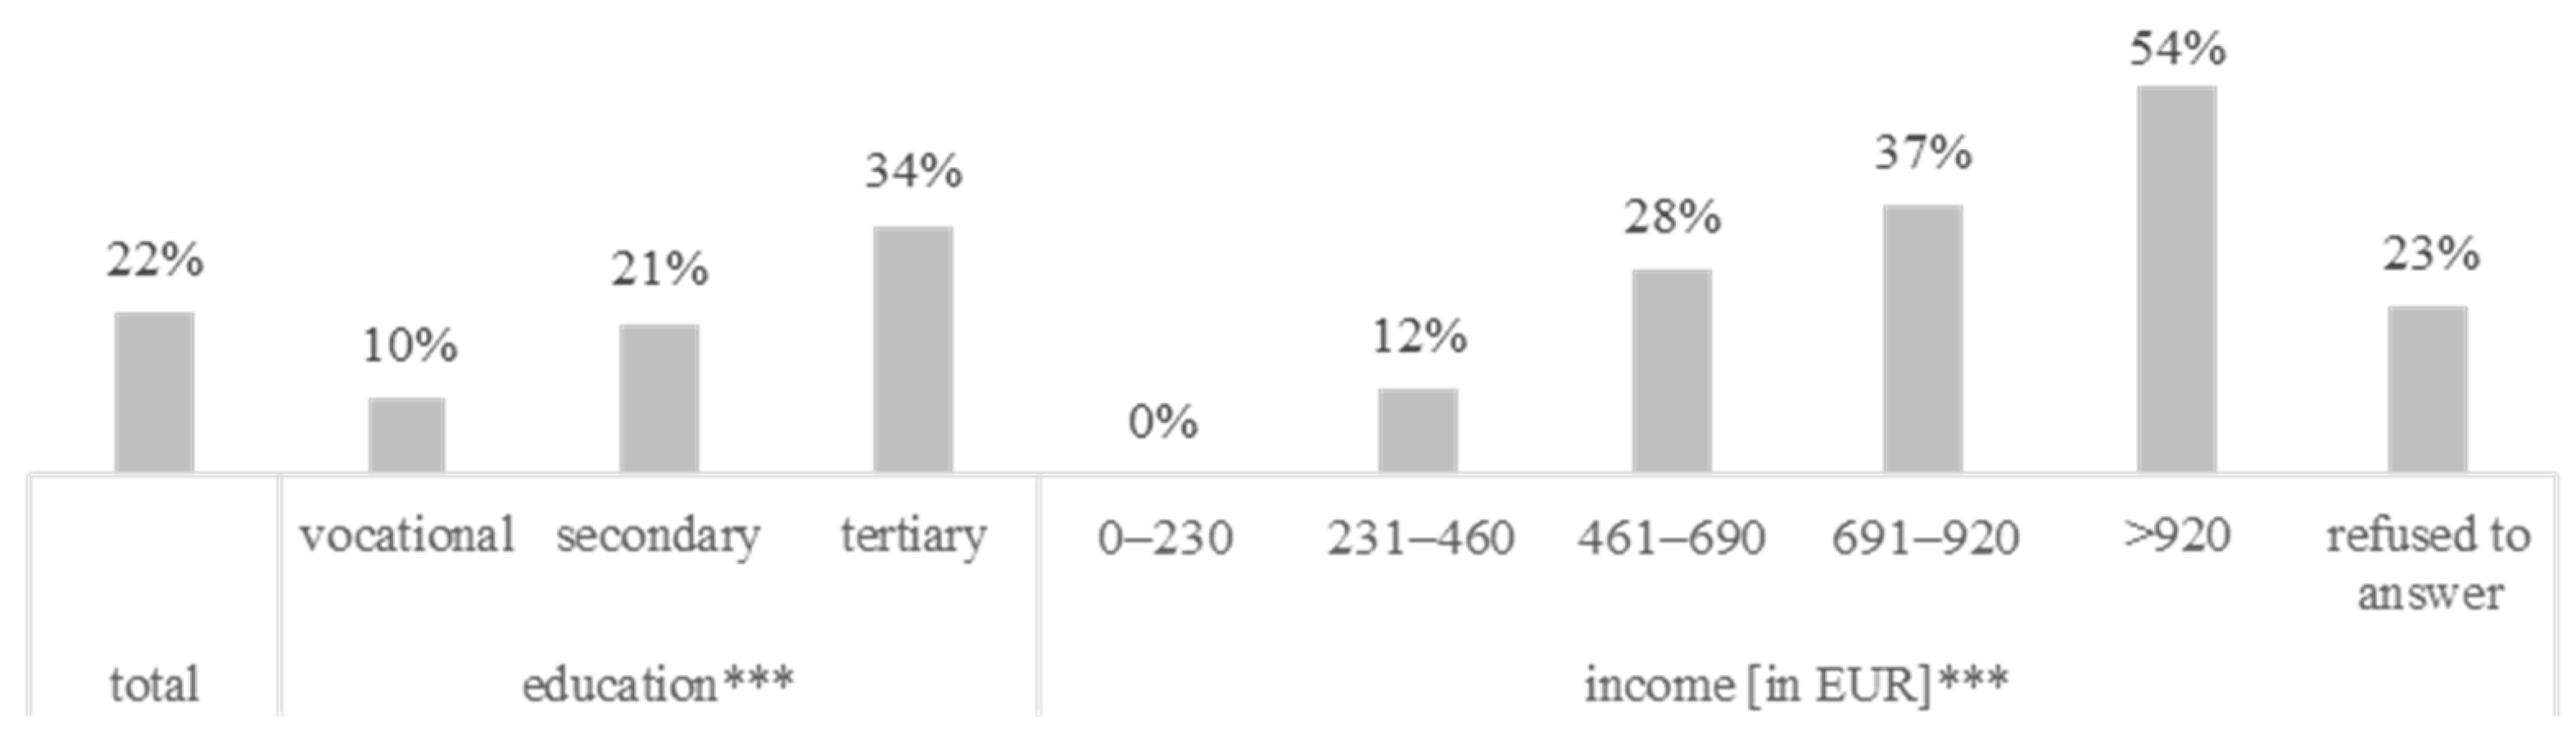
However, expecting worse conditions does not necessarily mean counteracting them. When individuals expecting deterioration in material conditions were asked about such actions, only about 1 in 5 persons declared doing so (Figure 3). Once again, the actions are statistically significant when using cross-sections with education and personal income, as well as for self-employed and running own business (for the latter two cases, low samples should be mentioned). The situation does not improve much when we extend the sample. By contrast, only education is a statistically distinctive variable in describing propensity to take precautionary matters among individuals who expect improvement.
In 2016, the Polish pension system provided three dedicated tools for additional long-term saving: IKE, IKZE, and PPE (individual retirement accounts, individual retirement protection accounts, and employee pension schemes). Since 2018, a fourth tool has been introduced (PPK, employee capital plans). With quasi-compulsory character and behavioural mechanisms (incl. auto-enrolment), its spread is higher than IKE, IKZE, and PPE. Despite its long-term character, due to political reasons, the pension context is not emphasized. Participation among those eligible is modest (30%), though.
There are also endless forms of saving and investment available on financial markets and in alternative forms. They are not especially popular—in the complete sample, additional long-term saving was declared by approx. 20% of respondents, and the most popular tool is a savings account or cash (13.3%). Subsequent tangible investments (especially real estate) and raising a caring child are not especially popular: 3.1% and 2.7%, respectively. Dedicated instruments were mentioned even less often: IKE by 1.4% and IKZE and PPE by 0.1% each. Saving using more than one tool is almost non-existent. Moreover, for those using a savings account or saving in cash, no other instrument is used (Table 2).
Keeping in mind the fact that replacement rates of Polish pensioners are expected to decrease to 40% in 2030, expecting benefit levels close to the current minimum pensions is a good enough guess. When asked whether they would be able to make ends meet with this amount each month, almost 84% denied (Figure 4). Statistically significant differences were recorded for gender, education, and—to a lesser extent—also age.
6. Pension Strategies
6.1. Second-Best Solution
As mentioned earlier, 84% of respondents denied being able to make ends meet with the minimum old-age pension. Keeping in mind the fact that most of them expect worsening material conditions and that the dominant expected replacement rate was well below 50%, a logical question to raise is what the alternative sources of financing consumption in the last stage of life are. The most popular option was having a paid job (58.7%). Less popular alternatives included support from acquaintances (28.2%), and social assistance (24.4%). Protesting was mentioned by 12.5% of respondents expecting insufficient income in the future.
In the next step, we analysed how these second-best actions interact with each other and translate into strategies. The scree plot of eigenvalues identified three components (Table 3). Component 1 included the support of social assistance, charity, and acquaintances. Component 2 included a paid job and no action. Component 3 included protesting and breaking the law. Thus, it would seem that available strategies concentrate around three types of actions: asking for external support, managing with insufficient income on one’s own (with particular focus on a paid job), and rebelling, reflected respectively by the three components. Transforming the answers to the question into these artificial variables allows for the distinction of the three types of personalities among the surveyed population.
6.2. First-Best Solutions
We have run binary logistic regressions in order to identify the determinants of supplementary saving. We assume drivers of supplementary saving should increase if one expects material deterioration in the last stage of life. This landscape is, however, much more complex.
Regardless of specification and sample selection, several conclusions can be drawn. Firstly, only few categories are statistically significant. The higher the education level, the higher the odds of supplementary saving. Similarly, personal income is a statistically significant descriptor. Generally, its higher levels declared are associated with higher odds of saving. The monotonic pattern is observed for the whole sample, and among payers of compulsory contributions, but not among those who are pessimistic about their future material conditions. In this group, maximum odds are observed for respondents declaring income between EUR 691 and 920, whereas the median salary was slightly above EUR 800. Some statistical regularities can be drawn for various household sizes. In general, large households tend to save more than single households, while medium-sized ones always save less. When analysing age groups, the youngest category represents the lowest propensity to save—except for those who expect deteriorating material conditions, while the eldest represent almost twice as high odds of saving than the prime-age group. Last, but not least, labour market status was analysed. The only statistically significant impact was for the self-employed, who save systematically more often than other categories (however, we should keep in mind the small sample in this case).
Apart from socioeconomic variables affecting the first-best strategy, we may think about the other determinants—e.g., attitude towards state or political partisanship. Quite surprisingly, savings behaviour does not depend on the awareness of the limited replacement rates in the future and does not affect the odds of taking additional actions to secure retirement income. The number of responses to the questions on pension knowledge is too small to be included in the regressions, so we were unable to assess the relationship between the knowledge and the odds of supplementary savings. However, the knowledge of the link between retirement age and benefit does affect behaviour in a statistically significant way.
To further examine this issue, several potential explanations may be offered. The questionnaire contains several questions that describe the general view on the role of the state in providing support for retirement. These questions include whether the individual would prefer to be paid more instead of contributing to the pension system, whether the pension should be based on contributions paid to the system or financed from the current pension system revenues (defined contribution versus defined benefit choice), or whether additional savings should be subsidized by the state (this question did not go into details of the Universal Public Penson Schemes as analysed in Góra and Palmer (2020)). Additionally, there is a question on how much the state should subsidize the minimum pension of people who did not accrue enough savings on their pensions accounts. In addition, the second-best strategy can also serve as a proxy of general attitude towards the role of the state; as described in the PCA analysis, three groups were formed—active (that aim at managing on one’s own), passive (that will rely on external support), and rebellious. Consequently, the predictions of different components from a previous point can be included in logistic regressions.
To examine this issue further, we extend the regressions presented in Table 4 (full sample regression with labour market status included) to assess the influence of general attitude towards the state on the odds of supplementary savings. In the case of using PCA from the previous paragraph, the results are in line with intuition—those who are planning to rebel or rely on social support, in general, tend to be more likely to save for retirement. In contrary, those planning to work, save less, apparently believing that they will be able to secure labour income until their old age. Furthermore, those who believe that pension savings should not be subsidized are more likely to save more, which indicates that their behaviour is consistent with their view on the pension system. Those who believe that the state should subsidize pensioners who did not accrue enough on their retirement accounts are less likely to save.
These results are robust across specifications—in any case, the view on future pensions perspectives or the knowledge of the link between retirement and benefit in the DC system does not affect the odds of taking additional actions to secure savings. However, quite robustly, those who believe in a strong role of the state in providing pensions tend to be less likely to take additional action to secure their retirement income. When second-best strategies are considered, those who plan to work towards their late retirement tend to save less.
7. Discussion
The primary objective of this article was to analyse strategies working Poles undertake in order to maintain decent living conditions as retirees. By pension strategy, we mean a sequence of actions aimed at providing the necessary level of consumption in the last stage of life, in particular saving practices and labour market activity. Our interest is strongly associated with the fact that the Polish pension system introduced in 1999 has the following basic features: (1) it is a tool of intertemporal consumption smoothing over the life cycle; (2) it shapes the distribution of GDP between working and non-working generations—no intended redistribution occurs; (3) it is a tool of distribution and owns only negligible assets. For the future retiree, it means that the more that is saved, the more that can be received in old age. Moreover, the earlier economic inactivity starts, the longer the period that has to be financed from pension wealth. Finally, expectations regarding future material conditions can be adjusted, as the system is transparent: key parameters are publicly known and communicated to the future retiree.
The logistic regressions we performed emphasized several interesting patterns regarding saving practices. Some of them are in agreement with the empirical literature. First, higher education level (which is a justified proxy of literacy) doubtlessly leads to higher probability of supplementary long-term saving. Second, income—in general, the higher the income, the higher the odds of saving; however, the relationship is not always monotonic. In this context, an additional educated guess arises, that—if reversed causation is holding—respondents refusing to answer on their income largely represent patterns typical for lower quantiles.
Furthermore, atypical behaviour of elder individuals is observed. In the 60–67 age group, the highest odds of saving were observed for those who expect deterioration in material conditions in old age (that is, soon). This is not a sign of forward-looking behaviour—it is just enforced by raising awareness. In addition, this group has not yet experienced the increased expenses characteristic for oldest-olds. It would seem that saving happens either when one has sufficient income and knowledge (which, technically, are correlated), or when one is forced by soon-to-be-realized poverty.
Slightly different is the case of labour contract types. Except for the self-employed (companies with one worker, namely the owner), all categories were characterised by high p-values and wide confidence intervals. The self-employed are systematically more prone to long-term saving on their own. The reason for this state of things is quite intuitive—this category was the only one not forced to pay social contributions. This situation referred to cleaning persons forced to reduce labour costs as well as well-paid experts optimising their incomes. While both groups have different capacities for additional saving, responsibility is completely transferred onto the company.
The projections of gloomy and modest lives of future retirees, in combination with their passiveness, led us to ask, what actions are considered if the level of income will be insufficient to make ends meet. This level was approximated by today’s minimum old-age pension. In some sense, this is a useful, but a not very precise example—the amount of approx. 200 EUR was far above the social minimum (not to mention, the subsistence minimum) and the projections of the European Commission (2018) leave no doubt this level cannot be kept. Moreover, some future pensioners (especially wealthier ones) will actually receive more than the current minimum benefit. Nevertheless, only 3 people in 20 believe they would cover all their needs with this amount. It should be mentioned that as individuals age, their needs grow, and in the future, most of them will have to be satisfied with purchased goods and services (due to changing demographic structures), while the ability to earn a living will decrease.
As one may see, our question is not groundless. Principal component analysis led us to the conclusion that individuals not meeting their needs would form three separate strategies: rely on themselves, in particular—search for a paid job; ask for external support (of which most popular is acquaintances support, and slightly less popular—social assistance support); rebel (including protesting and breaking the law). The latter was considered by approx. 15% of respondents, which is quite a lot.
On the other hand, those who believe that they will be able to work until their late old age tend to save less for retirement. Interestingly, neither the expectations of life quality on future retirement nor the awareness of the link between retirement age and future benefits seem to affect the odds of additional actions in a statistically significant way. What actually shapes the actions aiming at securing savings for retirement is the attitude towards state and society (proxied by the second-best strategies)—people who aim to work in such case are less likely to take additional actions now. In addition, those who support stronger subsidization of pensions by the state are less likely to take precautionary actions. That means subsidisation by the rest of population. Most likely (not tested, though), people are not aware of that consequence, namely higher contributions or taxes to be paid. Consequently, the actions today are governed by the general view of people on the role of the state in providing the old-age security and not by the awareness of their retirement prospects or the mechanics of the pension system (knowledge of the link between retirement age and benefit). That may, to some extent, explain why awareness campaigns have limited impact on the savings behaviour of future retirees.
All these results can—and should—be interpreted in light of public policy. First, the introduction of the universal pension system in Poland was not preceded by significant dissemination of financial literacy. Future generations will most likely save more and retire later on the basis of the experiences of today’s generations, but such a crash test for more advanced generations was not an intended outcome. In addition, polarisation of knowledge, plans, and actions is observed for different education levels, income, and type of contract group, which will most likely lead to unintended redistribution. Second, keeping in mind financial illiteracy, low saving rates, and planned early withdrawals, in times of demographic ageing, the role of politicians will be even more difficult. The increasing political power of elder generations will be oriented at shifting the balance of interests between working and retiring generations. Changing it in reaction to this increasing power is an unsustainable solution.
These results need to be carefully interpreted, though. As pension literacy and level of preparedness are typically not subject to regular measurement, the abovementioned results are drawn from the survey. It would be highly recommended to check their robustness and the potential impact of recently introduced long-term saving instruments on a larger sample.
8. Conclusions
In this article, we aimed at describing pension strategies that are taken by future pensioners to sustain their consumption in the future. Under the existing pension system, these strategies can include such actions as delaying retirement or increase savings. In the context of the literature review, documenting a low level of financial literacy in CEE countries, it is not surprising that pension awareness in Poland is weak—employees do not know the contribution rates or how the system is constructed. This ignorance leads to unreasonable excitement around the minimum retirement age (which is of secondary importance in the DC system as retirement can always be delayed unless enough balance is accrued) and far too low savings. These savings are concentrated in wealthier and better educated groups, which would be in a better position even without these additional actions. Moreover, Polish employees start to save additionally far too late to achieve the level of income that exceeds their perceived income that is sufficient to make ends meet, which is way above the current (already high) minimum pension. To their defence though, the house ownership rates in Poland are relatively high as compared to rest of Europe, providing some security for future retirees. Their savings behaviour is governed by their political stance and not by awareness of dire prospects.
In the context of insufficient future retirement income, strategies are either based on optimistic assumptions on future health (seeking for additional job) or on the assumed generosity of acquaintances or social institutions (relying on external assistance). The third strategy is rebelling. Given these strategies as well as the increasing power of elder generations, keeping the balance of interest between workers and retirees will be an increasingly difficult task for policy makers.
Author Contributions
Conceptualization, S.B.; methodology, S.B.; software, S.B. and J.G.; formal analysis, S.B. and J.G.; investigation, S.B., J.G. and M.G.; resources, M.G.; writing—original draft preparation, S.B. and J.G.; writing—review and editing, M.G.; visualization, S.B. All authors have read and agreed to the published version of the manuscript.
Funding
The APC was funded by the SGH Warsaw School of Economics.
Institutional Review Board Statement
Not applicable.
Informed Consent Statement
Not applicable.
Data Availability Statement
Data available on request due to restrictions. The data presented in this study are available on request from the corresponding author. The data are not publicly available due to privacy considerations (EU GDPR).
Acknowledgments
The authors would like to thank Dariusz Stańko, Michał Gradzewicz, and Piotr Bartkiewicz for useful comments to the early versions of this manuscript. A very early version of this article was published as IZA Discussion Paper No. 11830.
Conflicts of Interest
The authors declare no conflict of interest.
References
- Almenberg, Johan, and Jenny Säve-Söderbergh. 2011. Financial Literacy and Retirement Planning in Sweden. Journal of Pension Economics and Finance 10: 585–98. [Google Scholar] [CrossRef]
- Angelici, Marta, Daniela Del Boca, Noemi Oggero, Paola Profeta, Maria Christina Rossi, and Claudia Villosio. 2020. Pension Information and Women’s Awareness. CESifo Working Paper Series; Munich: CESifo. [Google Scholar]
- Benartzi, Shlomo, and Richard H. Thaler. 2002. How Much Is Investor Autonomy Worth? The Journal of Finance 57: 1593–616. [Google Scholar] [CrossRef]
- Benartzi, Shlomo, and Richard Thaler. 2007. Heuristics and Biases in Retirement Savings Behavior. Journal of Economic Perspectives 21: 81–104. [Google Scholar] [CrossRef] [Green Version]
- Boisclair, David, Annamaria Lusardi, and Pierre-Carl Michaud. 2017. Financial Literacy and Retirement Planning in Canada. Journal of Pension Economics & Finance 16: 277–96. [Google Scholar] [CrossRef] [Green Version]
- Brown, Kristine M. 2013. The Link between Pensions and Retirement Timing: Lessons from California Teachers. Journal of Public Economics 98: 1–14. [Google Scholar] [CrossRef]
- Brown, Jeffrey R., Anne M. Farrell, and Scott J. Weisbenner. 2016. Decision-Making Approaches and the Propensity to Default: Evidence and Implications. Journal of Financial Economics 121: 477–95. [Google Scholar] [CrossRef]
- Bucher-Koenen, Tabea, and Annamaria Lusardi. 2011. Financial Literacy and Retirement Planning in Germany. Journal of Pension Economics and Finance 10: 565–84. [Google Scholar] [CrossRef] [Green Version]
- Buchholtz, Sonia, Agnieszka Chłon-Domincza, and Marek Góra. 2020. The Polish NDC Scheme: Success in the Face of Adversity. In Progress and Challenges of Nonfinancial Defined Contribution Pension Schemes. Washington, DC: The World Bank. [Google Scholar]
- Butt, Adam, M. Scott Donald, F. Douglas Foster, Susan Thorp, and Geoffrey J. Warren. 2018. One Size Fits All? Tailoring Retirement Plan Defaults. Journal of Economic Behavior & Organization 145: 546–66. [Google Scholar] [CrossRef]
- Chalmers, John M. R., Woodrow T. Johnson, and Jonathan Reuter. 2008. Who Determines When You Retire? Peer Effects and Retirement. Cambridge: National Bureau of Economic Research. [Google Scholar]
- Chevalier, Severine, Evelyne Fouquereau, Nicolas Gillet, and Virginie Demulier. 2013. Development of the Reasons for Entrepreneurs’ Retirement Decision Inventory (RERDI) and Preliminary Evidence of Its Psychometric Properties in a French Sample. Journal of Career Assessment 21: 572–86. [Google Scholar] [CrossRef]
- Choi, Stephen J., Jill E. Fisch, and Adam C. Pritchard. 2005. Do Institutions Matter? The Impact of the Lead Plaintiff Provision of the Private Securities Litigation Reform Act. SSRN Journal. [Google Scholar] [CrossRef] [Green Version]
- Coile, Courtney C., and Phillip B. Levine. 2011. The Market Crash and Mass Layoffs: How the Current Economic Crisis May Affect Retirement. The BE Journal of Economic Analysis & Policy 11. [Google Scholar] [CrossRef]
- Cronqvist, Henrik, and Richard H. Thaler. 2004. Design Choices in Privatized Social-Security Systems: Learning from the Swedish Experience. American Economic Review 94: 424–28. [Google Scholar] [CrossRef] [Green Version]
- Czapiński, Janusz, and Marek Góra. 2016. Świadomość “Emerytalna” Polaków. Raport z Badania Ilościowego (“Pension” Awareness of Poles. Report from the Quantitative Survey). Technical Report. Warsaw: IGTE. [Google Scholar]
- Do, Huong. 2017. Financial Literacy and Retirement Planning in Vietnam. VNU Journal of Science: Policy and Management Studies 33. [Google Scholar] [CrossRef] [Green Version]
- Duflo, Esther, and Emmanuel Saez. 2002. Participation and Investment Decisions in a Retirement Plan: The Influence of Colleagues’ Choices. Journal of Public Economics 85: 121–48. [Google Scholar] [CrossRef] [Green Version]
- European Commission. 2018. The 2018 Ageing Report: Economic and Budgetary Projections for the EU Member States (2016–2070). Institutional Paper 079. Brussels: European Commission. [Google Scholar]
- Fornero, Elsa, and Anna Lo Prete. 2019. Voting in the Aftermath of a Pension Reform: The Role of Financial Literacy. Journal of Pension Economics and Finance 18: 1–30. [Google Scholar] [CrossRef]
- Fornero, Elsa, and Chiara Monticone. 2011. Financial Literacy and Pension Plan Participation in Italy. Journal of Pension Economics and Finance 10: 547–64. [Google Scholar] [CrossRef]
- Góra, Marek, and Edward Palmer. 2004. Shifting Perspectives in Pensions. IZA Discussion Paper 1369. Bonn: IZA. [Google Scholar]
- Góra, Marek, and Edward E. Palmer. 2020. NDC: The Generic Old-Age Pension Scheme. In Progress and Challenges of Nonfinancial Defined Pension Schemes. Edited by Robert Holzmann, Edward Palmer, Robert Palacios and Stefano Sacchi. Washington, DC: The World Bank. [Google Scholar]
- Goyal, Kirti, and Satish Kumar. 2021. Financial Literacy: A Systematic Review and Bibliometric Analysis. International Journal of Consumer Studies 45: 80–105. [Google Scholar] [CrossRef]
- Harlow, William V., Keith C. Brown, and Stephen E. Jenks. 2020. The Use and Value of Financial Advice for Retirement Planning. The Journal of Retirement 7: 46–79. [Google Scholar] [CrossRef]
- Hershey, Douglas A., Kene Henkens, and Hendrik P. Van Dalen. 2010. Aging and Financial Planning for Retirement: Interdisciplinary Influences Viewed through a Cross-Cultural Lens. The International Journal of Aging and Human Development 70: 1–38. [Google Scholar] [CrossRef] [PubMed] [Green Version]
- Hershfield, Hal E., Daniel G. Goldstein, William F. Sharpe, Jesse Fox, Leo Yeykelis, Laura L. Carstensen, and Jeremy N. Bailenson. 2011. Increasing Saving Behavior through Age-Progressed Renderings of the Future Self. Journal of Marketing Research 48: S23–S37. [Google Scholar] [CrossRef]
- Hewitt Associates. 2002. Investing in Round Numbers. Technical Report. Kalamazoo: Hewitt Associates. [Google Scholar]
- Hurd, Michael D., James P. Smith, and Julie M. Zissimopoulos. 2004. The Effects of Subjective Survival on Retirement and Social Security Claiming. Journal of Applied Econometrics 19: 761–75. [Google Scholar] [CrossRef] [Green Version]
- Kimiyagahlam, Fatemeh, Meysam Safari, and Shaheen Mansori. 2019. Influential Behavioral Factors on Retirement Planning Behavior: The Case of Malaysia. Journal of Financial Counseling and Planning 30: 244–61. [Google Scholar] [CrossRef]
- Kiso, Helen, and Douglas A. Hershey. 2017. Working Adults’ Metacognitions Regarding Financial Planning for Retirement. Work, Aging and Retirement 3: 77–88. [Google Scholar] [CrossRef] [Green Version]
- Klapper, Leora F., Annamaria Lusardi, and Georgios A. Panos. 2012. Financial Literacy and the Financial Crisis. Policy Research Working Papers. Washington, DC: The World Bank. [Google Scholar]
- Koh, Benedict S., and Olivia S. Mitchell. 2019. Retirement Preparedness and Financial Literacy in Singapore: How Do the Self-Employed Compare? Rochester: Social Science Research Network. [Google Scholar]
- Komada, Oliwia, Pawel Strzelecki, and Joanna Tyrowicz. 2019. A Regression Discontinuity Evaluation of Reducing Early Retirement Eligibility in Poland. International Journal of Manpower 40: 286–303. [Google Scholar] [CrossRef] [Green Version]
- Lusardi, Annamaria, and Olivia S. Mitchell. 2011a. Financial Literacy around the World: An Overview. Journal of Pension Economics and Finance 10: 497–508. [Google Scholar] [CrossRef] [Green Version]
- Lusardi, Annamaria, and Olivia S. Mitchell. 2011b. Financial Literacy and Planning: Implications for Retirement Wellbeing. Cambridge: National Bureau of Economic Research. [Google Scholar]
- Lusardi, Annamaria, and Olivia S. Mitchell. 2014. The Economic Importance of Financial Literacy: Theory and Evidence. Journal of Economic Literature 52: 5–44. [Google Scholar] [CrossRef] [PubMed] [Green Version]
- Niu, Geng, and Yang Zhou. 2018. Financial Literacy and Retirement Planning: Evidence from China. Applied Economics Letters 25: 619–23. [Google Scholar] [CrossRef]
- Organization of Economic Cooperation and Development. 1996. Ageing in OECD Countries: A Critical Policy Challenge; Social Policy Studies. Paris: OECD, ISBN 9789264153189. [Google Scholar]
- OECD. 2019. Pensions at a Glance 2019: OECD and G20 Indicators. Paris: OECD Publishing. [Google Scholar] [CrossRef]
- Phillipson, Chris, Sue Shepherd, Mark Robinson, and Sarah Vickerstaff. 2019. Uncertain Futures: Organisational Influences on the Transition from Work to Retirement. Social Policy and Society 18: 335–50. [Google Scholar] [CrossRef] [Green Version]
- Read, Daniel, and George Loewenstein. 1995. Diversification Bias: Explaining the Discrepancy in Variety Seeking between Combined and Separated Choices. Journal of Experimental Psychology: Applied 1: 34–49. [Google Scholar] [CrossRef]
- Rutecka-Góra, Joanna, ed. 2016. Długoterminowe Oszczędzanie. Postawy, strategie i wyzwania (Long-Term Savings: Attitudes, Strategies and Challenges). Warsaw: Oficyna Wydawnicza SGH. [Google Scholar] [CrossRef]
- Salamanca, Nicolás, Andries de Grip, and Olaf Sleijpen. 2020. How People React to Pension Risk. SSRN Journal. [Google Scholar] [CrossRef]
- Scharn, Micky, Ranu Sewdas, Cécile R. L. Boot, Martijn Huisman, Maarten Lindeboom, and Allard J. Van Der Beek. 2018. Domains and Determinants of Retirement Timing: A Systematic Review of Longitudinal Studies. BMC Public Health 18: 1083. [Google Scholar] [CrossRef]
- Steel, Piers. 2010. Arousal, Avoidant and Decisional Procrastinators: Do They Exist? Personality and Individual Differences 48: 926–34. [Google Scholar] [CrossRef]
- Stolper, Oscar A., and Andreas Walter. 2017. Financial Literacy, Financial Advice, and Financial Behavior. Journal of Business Economics 87: 581–643. [Google Scholar] [CrossRef] [Green Version]
- Strömbäck, Camilla, Thérèse Lind, Kenny Skagerlund, Daniel Västfjäll, and Gustav Tinghög. 2017. Does Self-Control Predict Financial Behavior and Financial Well-Being? Journal of Behavioral and Experimental Finance 14: 30–38. [Google Scholar] [CrossRef]
- Thaler, Richard H., and Hersh M. Shefrin. 1981. An Economic Theory of Self-Control. Journal of Political Economy 89: 392–406. [Google Scholar] [CrossRef] [Green Version]
- Van Rooij, Maarten C. J., Clemens J. M. Kool, and Henriëtte M. Prast. 2007. Risk-Return Preferences in the Pension Domain: Are People Able to Choose? Journal of Public Economics 91: 701–22. [Google Scholar] [CrossRef] [Green Version]
- The World Bank. 1994. Averting the Old Age Crisis: Policies to Protect the Old and Promote Growth. Edited by The World Bank. A World Bank Policy Research Report. Oxford: Oxford University Press, ISBN 9780195209969. [Google Scholar]
Figure 1.
Preference for replacing compulsory contributions with higher net remuneration. Source: authors’ own elaboration, *** p < 0.01, ** p < 0.05, * p < 0.1.
Figure 1.
Preference for replacing compulsory contributions with higher net remuneration. Source: authors’ own elaboration, *** p < 0.01, ** p < 0.05, * p < 0.1.

Figure 2.
Expectations of future living standard as a pensioner, comparing to today’s old-age pensioners with similar tenure and occupation—by statistically significant cross-sections. Source: authors’ own elaboration, *** p < 0.01, ** p < 0.05, * p < 0.1.
Figure 2.
Expectations of future living standard as a pensioner, comparing to today’s old-age pensioners with similar tenure and occupation—by statistically significant cross-sections. Source: authors’ own elaboration, *** p < 0.01, ** p < 0.05, * p < 0.1.

Figure 3.
Actions undertaken to counteract deterioration in material conditions in old age, providing expected deterioration. Source: authors’ own elaboration, *** p < 0.01, ** p < 0.05, * p < 0.1.
Figure 3.
Actions undertaken to counteract deterioration in material conditions in old age, providing expected deterioration. Source: authors’ own elaboration, *** p < 0.01, ** p < 0.05, * p < 0.1.

Figure 4.
Share of individuals declaring ability to make ends meet with minimal old-age pension. Source: authors’ own elaboration, *** p < 0.01, ** p < 0.05, * p < 0.1.
Figure 4.
Share of individuals declaring ability to make ends meet with minimal old-age pension. Source: authors’ own elaboration, *** p < 0.01, ** p < 0.05, * p < 0.1.


Table 1.
Sample characteristics.
| Variable | Categories | N | |||
|---|---|---|---|---|---|
| total | 1006 | age group | 18–29 | 183 | |
| gender | female | 551 | 30–44 | 492 | |
| male | 455 | 45–59 | 304 | ||
| 60+ | 27 | ||||
| education | primary | 15 | personal net income (EUR) | 0–230 | 43 |
| vocational | 231 | 231–460 | 285 | ||
| secondary | 429 | 461–690 | 316 | ||
| tertiary | 331 | 691–920 | 64 | ||
| urbanisation | rural areas | 379 | >920 | 38 | |
| urban areas, population < 50,000 | 224 | refused to answer | 260 | ||
| urban areas, population 50,000–200,000 | 133 | labour market status | open-ended labour-code contract | 555 | |
| urban areas, population > 200,000 | 270 | fixed-term labour-code contract | 279 | ||
| household size | 1 | 159 | fixed-term civil-law contract | 84 | |
| 2 | 316 | self-employment | 26 | ||
| 3 | 274 | business owner | 35 | ||
| 4 | 184 | farm owner | 42 | ||
| 5+ | 73 | student | 13 |
Table 2.
Spearman’s correlation of the use of additional saving instruments.
| I | II | III | IV | V | VI | VII | VIII | ||
|---|---|---|---|---|---|---|---|---|---|
| I | savings account/in cash | 1 | |||||||
| II | raising caring children | −0.1137 | 1 | ||||||
| III | tangible investment | −0.1673 * | 0.1320 | 1 | |||||
| IV | IKE | −0.3242 * | −0.0558 | −0.1203 | 1 | ||||
| V | IKZE | −0.1310 | −0.0359 | −0.0398 | −0.0284 | 1 | |||
| VI | PPE | −0.1609 * | −0.0441 | 0.0641 | 0.1121 | −0.0115 | 1 | ||
| VII | insurance-based investment product | −0.3058 * | 0.0102 | −0.0554 | −0.0712 | 0.0982 | −0.0488 | 1 | |
| VIII | other | −0.3175 * | 0.0756 | −0.0547 | −0.0773 | −0.0256 | −0.0314 | −0.1083 | 1 |
* for significance at 0.05 level. IKE—individual retirement accounts; IKZE—individual retirement protection accounts; PPE—employee pension schemes.
Table 3.
Principal component analysis of the actions undertaken provided insufficient old-age pension levels.
Table 3.
Principal component analysis of the actions undertaken provided insufficient old-age pension levels.
| Variable | Before Rotation | After VARIMAX Rotation | Unexplained | ||||
|---|---|---|---|---|---|---|---|
| Comp 1 | Comp 2 | Comp 3 | Comp 1 | Comp 2 | Comp 3 | ||
| social assistance support | 0.4611 | 0.1555 | −0.4186 | 0.6224 | −0.0827 | 0.1335 | 0.3754 |
| charity support | 0.5016 | 0.1820 | −0.2397 | 0.5780 | −0.0770 | 0.0464 | 0.4038 |
| acquaintances support | 0.4084 | −0.2118 | −0.2154 | 0.4191 | 0.2809 | −0.0590 | 0.5672 |
| paid job | 0.0789 | −0.7120 | 0.1018 | −0.0999 | 0.7159 | −0.0332 | 0.3292 |
| protest | 0.4723 | 0.1154 | 0.2979 | 0.2891 | 0.0427 | 0.4897 | 0.4543 |
| breaking the law | 0.2989 | 0.1888 | 0.7844 | −0.0772 | −0.0143 | 0.8569 | 0.1682 |
| none | −0.2244 | 0.5847 | −0.0803 | −0.0578 | −0.6276 | −0.0386 | 0.4570 |
Source: author’s own elaboration. Note: bolded = levels above |0.3|.
Table 4.
Determinants of taking additional actions for retirement savings.
| Model 1—OR | Model 2—OR | Model 3—OR | Model 4—OR | Model 5—OR | ||
|---|---|---|---|---|---|---|
| Gender (male) | female | 0.981 | 0.988 | 1.119 | 1.044 | 1.169 |
| −0.172 | −0.176 | −0.227 | −0.19 | −0.243 | ||
| Age group (30–44) | 18–29 | 0.432 *** | 0.437 *** | 0.492 ** | 0.424 *** | 0.480 ** |
| −0.12 | −0.123 | −0.148 | −0.121 | −0.147 | ||
| 45–59 | 0.954 | 0.914 | 0.963 | 0.881 | 0.901 | |
| −0.211 | −0.205 | −0.245 | −0.202 | −0.234 | ||
| 60–67 | 1.295 | 1.175 | 1.678 * | 1.192 | 1.646 * | |
| −0.316 | −0.292 | −0.475 | −0.301 | −0.473 | ||
| Education (secondary) | vocational | 0.510 *** | 0.572 ** | 0.513 ** | 0.599 * | 0.516 ** |
| −0.129 | −0.147 | −0.156 | −0.157 | −0.161 | ||
| tertiary | 1.867 *** | 1.860 *** | 2.074 *** | 1.847 *** | 2.010 *** | |
| −0.369 | −0.377 | −0.471 | −0.38 | −0.462 | ||
| Urbanization (urban areas, pop. 50,000–200,000) | rural areas | 0.833 | 0.835 | 0.545 ** | 0.788 | 0.542 ** |
| −0.218 | −0.222 | −0.161 | −0.213 | −0.164 | ||
| urban areas, pop. < 50,000 | 1.032 | 1.059 | 0.668 | 1.003 | 0.625 | |
| −0.287 | −0.301 | −0.213 | −0.29 | −0.203 | ||
| urban areas, pop. > 200,000 | 0.926 | 0.88 | 0.648 | 0.812 | 0.617 | |
| −0.245 | −0.238 | −0.192 | −0.222 | −0.184 | ||
| Household size (1) | 2 | 0.783 | 0.739 | 0.972 | 0.724 | 0.981 |
| −0.199 | −0.191 | −0.287 | −0.191 | −0.296 | ||
| 3 | 0.560 ** | 0.545 ** | 0.821 | 0.547 ** | 0.821 | |
| −0.149 | −0.147 | −0.257 | −0.15 | −0.26 | ||
| 4 | 0.536 ** | 0.493 ** | 0.824 | 0.486 ** | 0.788 | |
| −0.164 | −0.153 | −0.294 | −0.153 | −0.285 | ||
| 5+ | 1.831 * | 1.584 | 3.149 *** | 1.512 | 2.887 ** | |
| −0.639 | −0.563 | −1.283 | −0.547 | −1.199 | ||
| Personal net income—EUR (231–460) | 0–230 | 0.502 | 0.528 | 0.874 | 0.573 | 0.92 |
| −0.349 | −0.371 | −0.715 | −0.406 | −0.762 | ||
| 461–490 | 1.949 *** | 1.887 ** | 2.069 ** | 1.847 ** | 2.103 ** | |
| −0.477 | −0.467 | −0.587 | −0.466 | −0.609 | ||
| 691–920 | 3.884 *** | 3.777 *** | 5.100 *** | 3.758 *** | 5.273 *** | |
| −1.363 | −1.349 | −2.069 | −1.361 | −2.168 | ||
| >920 | 2.864 ** | 3.203 ** | 3.977 *** | 2.724 ** | 3.502 ** | |
| −1.3 | −1.503 | −2.009 | −1.306 | −1.82 | ||
| refused to answer | 1.455 | 1.468 | 1.793 ** | 1.536 | 1.834 ** | |
| −0.373 | −0.381 | −0.531 | −0.409 | −0.556 | ||
| Declared labour market status (no declaration) | labour-code contract | 1.878 | 1.617 | 1.832 | 1.283 | 1.531 |
| −1.53 | −1.34 | −1.648 | −1.116 | −1.443 | ||
| fixed-term civil-law contract | 1.574 | 1.37 | 1.591 | 1.087 | 1.395 | |
| −1.328 | −1.174 | −1.489 | −0.977 | −1.371 | ||
| self-employment | 6.140 ** | 5.547 ** | 5.576 * | 4.655 * | 5.189 * | |
| −5.077 | −4.679 | −5.084 | −4.075 | −4.915 | ||
| own business | 2.283 | 1.831 | 1.618 | 1.412 | 1.408 | |
| −2.01 | −1.638 | −1.553 | −1.332 | −1.417 | ||
| own farm | 1.359 | 1.238 | 0.388 | 0.92 | 0.314 | |
| −1.283 | −1.18 | −0.496 | −0.909 | −0.41 | ||
| student | 3.760 * | 3.385 | 1.213 | 2.518 | 1.029 | |
| −2.956 | −2.714 | −1.128 | −2.029 | −0.959 | ||
| Later retirement = higher benefit (no) | yes | 1.211 | 1.098 | 1.244 | 1.111 | |
| −0.235 | −0.243 | −0.251 | −0.254 | |||
| do not know | 0.793 | 0.684 | 0.986 | 0.836 | ||
| −0.225 | −0.225 | −0.292 | −0.286 | |||
| Material conditions at retirement (worse than current retirees) | better than current retirees | 0.59 | 0.636 | 0.53 | 0.607 | |
| −0.239 | −0.297 | −0.222 | −0.292 | |||
| similar to current retirees | 1.261 | 1.175 | 1.321 | 1.213 | ||
| −0.248 | −0.265 | −0.266 | −0.279 | |||
| DK | 0.487 ** | 0.397 ** | 0.524 ** | 0.434 ** | ||
| −0.155 | −0.15 | −0.17 | −0.166 | |||
| Minimum pension is sufficient for me (no) | yes | 1.082 | 1.192 | |||
| −0.261 | −0.298 | |||||
| Additional retirement savings should be subsidized: (do not know) | by state only | 1.451 | 1.292 | |||
| −0.473 | −0.472 | |||||
| by employer only | 1.752 * | 1.32 | ||||
| −0.588 | −0.514 | |||||
| by state and by employer | 1.51 | 1.494 | ||||
| −0.432 | −0.471 | |||||
| neither by state nor by employer | 2.557 *** | 2.151 ** | ||||
| −0.859 | −0.797 | |||||
| State subsidizes those without minimum pension: (do not know) | not at all | 1.694 | 1.517 | |||
| −0.598 | −0.592 | |||||
| to less than minimum benefit | 2.214 ** | 2.156 ** | ||||
| −0.737 | −0.801 | |||||
| to minimum benefit | 1.145 | 1.094 | ||||
| −0.327 | −0.338 | |||||
| to more than minimum benefit | 1.019 | 0.957 | ||||
| −0.311 | −0.313 | |||||
| PCA component 1 (relying on external support) | 1.205 *** | 1.186 ** | ||||
| −0.0803 | −0.0797 | |||||
| PCA component 2 (additional paid job) | 0.809 ** | 0.813 ** | ||||
| −0.079 | −0.0803 | |||||
| PCA component 3 (rebelling & illegal actions) | 1.238 ** | 1.202 ** | ||||
| −0.108 | −0.106 | |||||
| Constant | 0.124 ** | 0.144 ** | 0.104 ** | 0.0865 ** | 0.0749 ** | |
| −0.11 | −0.132 | −0.104 | −0.0865 | −0.0807 | ||
| pseudo R2 | 10.70% | 12.30% | 17.30% | 14.40% | 19.00% | |
| Observations | 985 | 985 | 824 | 985 | 824 | |
Source: author’s own elaboration. Note: standard errors in parentheses, *** p < 0.01, ** p < 0.05, * p < 0.1.
Publisher’s Note: MDPI stays neutral with regard to jurisdictional claims in published maps and institutional affiliations. |
© 2021 by the authors. Licensee MDPI, Basel, Switzerland. This article is an open access article distributed under the terms and conditions of the Creative Commons Attribution (CC BY) license (http://creativecommons.org/licenses/by/4.0/).
Share and Cite
MDPI and ACS Style
Buchholtz, S.; Gąska, J.; Góra, M. Myopic Savings Behaviour of Future Polish Pensioners. Risks 2021, 9, 36. https://0-doi-org.brum.beds.ac.uk/10.3390/risks9020036
AMA Style
Buchholtz S, Gąska J, Góra M. Myopic Savings Behaviour of Future Polish Pensioners. Risks. 2021; 9(2):36. https://0-doi-org.brum.beds.ac.uk/10.3390/risks9020036
Chicago/Turabian StyleBuchholtz, Sonia, Jan Gąska, and Marek Góra. 2021. "Myopic Savings Behaviour of Future Polish Pensioners" Risks 9, no. 2: 36. https://0-doi-org.brum.beds.ac.uk/10.3390/risks9020036
Note that from the first issue of 2016, this journal uses article numbers instead of page numbers. See further details here.