
Analyzing Indo-European Language Similarities Using Document Vectors
Department of Computer Science, Southern Illinois University Edwardsville, Edwardsville, IL 62026, USA
*
Author to whom correspondence should be addressed.
Informatics 2023, 10(4), 76; https://0-doi-org.brum.beds.ac.uk/10.3390/informatics10040076
Submission received: 9 August 2023
/
Revised: 13 September 2023
/
Accepted: 23 September 2023
/
Published: 26 September 2023
(This article belongs to the Special Issue Digital Humanities and Visualization)
Abstract
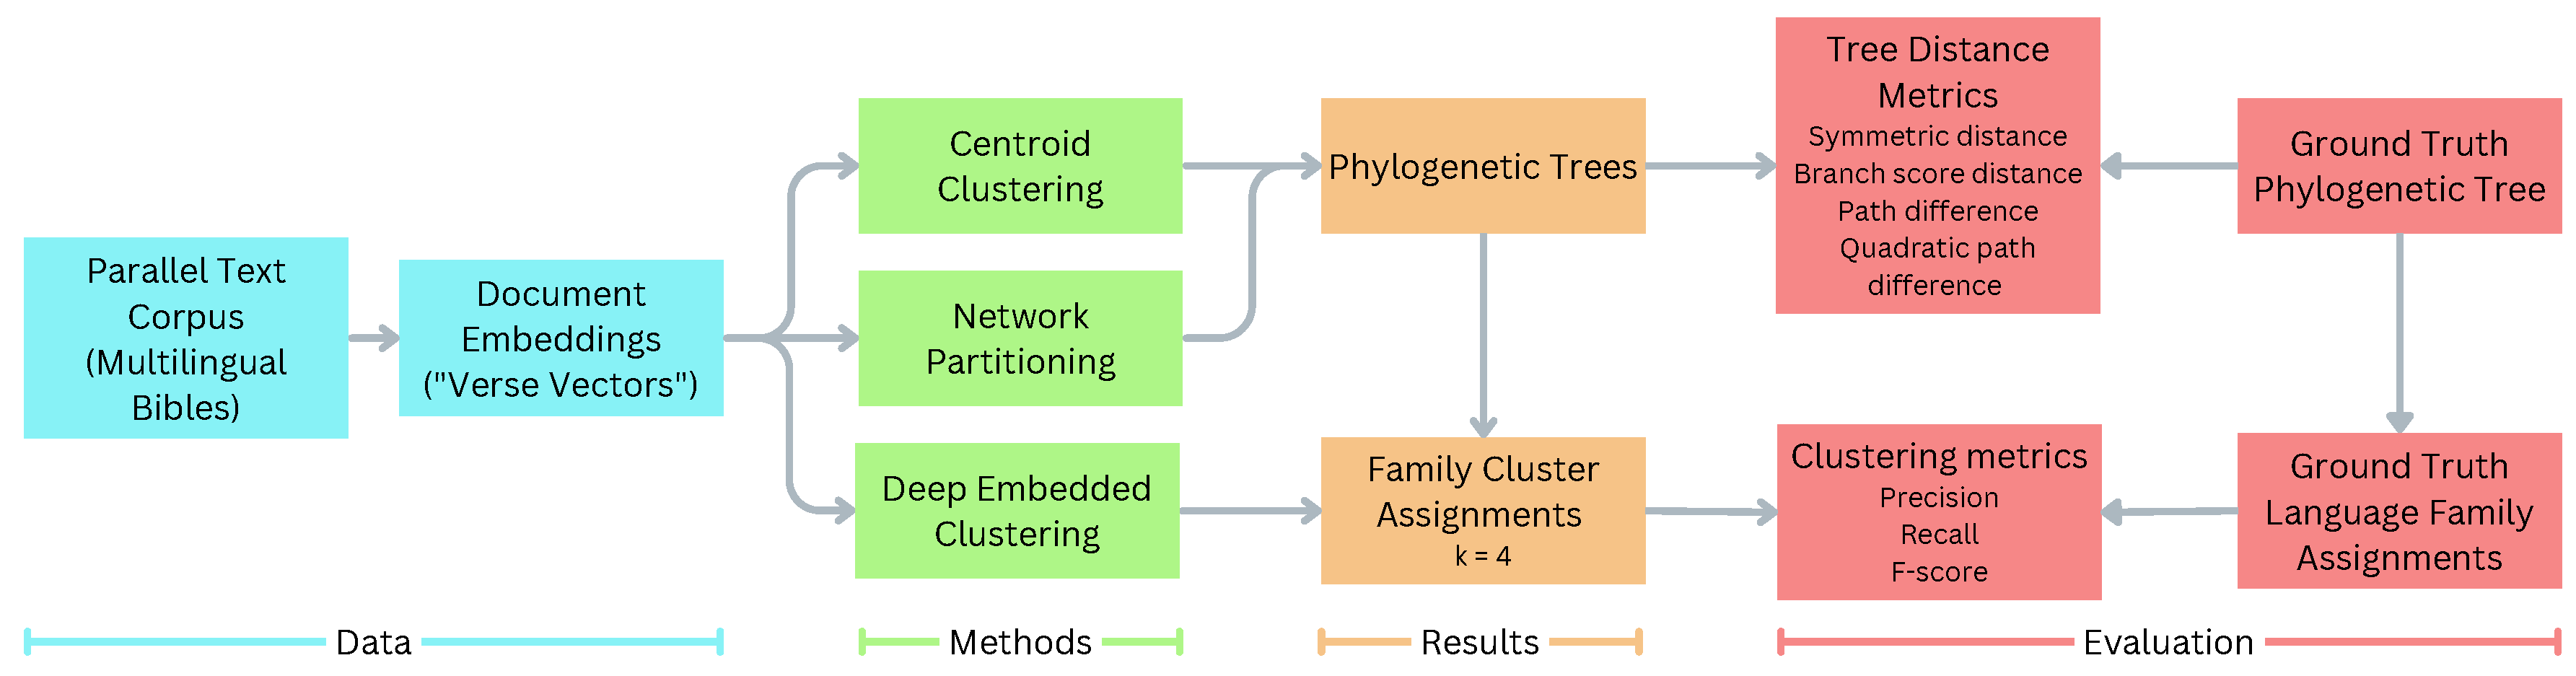
:The evaluation of similarities between natural languages often relies on prior knowledge of the languages being studied. We describe three methods for building phylogenetic trees and clustering languages without the use of language-specific information. The input to our methods is a set of document vectors trained on a corpus of parallel translations of the Bible into 22 Indo-European languages, representing 4 language families: Indo-Iranian, Slavic, Germanic, and Romance. This text corpus consists of a set of 532,092 Bible verses, with 24,186 identical verses translated into each language. The methods are (A) hierarchical clustering using distance between language vector centroids, (B) hierarchical clustering using a network-derived distance measure, and (C) Deep Embedded Clustering (DEC) of language vectors. We evaluate our methods using a ground-truth tree and language families derived from said tree. All three achieve clustering F-scores above 0.9 on the Indo-Iranian and Slavic families; most confusion is between the Germanic and Romance families. The mean F-scores across all families are 0.864 (centroid clustering), 0.953 (network partitioning), and 0.763 (DEC). This shows that document vectors can be used to capture and compare linguistic features of multilingual texts, and thus could help extend language similarity and other translation studies research.
1. Introduction
All Indo-European languages can be traced back to the common ancestor of Proto-Indo-European languages, but some groups of Indo-European languages have a more recent common ancestor. On the broadest level, these are called “language families” and include the Germanic, Romance, and Slavic families [1]. The comparative method has been used to establish the borders and interrelationships of these families since well before the dawn of computing. This involves the identification of linguistic features such as “cognates”, words hypothesized or known to have the same origin based on the similarity of their spellings and definitions [2]. More recently, researchers have used computational techniques to construct phylogenetic trees that show familial relationships by analyzing the grammar and word sequences of various languages [2,3,4,5,6,7].
In our research, we have developed language-agnostic methods of measuring language similarities that do not rely on the domain knowledge of how a specific language operates, such as an explicit description of its grammar or common words. This approach is data-driven and uses document embedding techniques to create vectors that capture important syntactic features of texts without having to explicitly label them. The only requirement is a dataset of short, parallel translations for each of the languages being analyzed; no other domain knowledge is necessary, apart from that needed for light preprocessing of the text. These methods could be used as a preliminary first pass for researchers to test the quality of their dataset before the extraction of more sophisticated linguistic features. In addition, they could potentially be applied to classify languages with scant historic documentation, or to test outstanding language origin hypotheses, provided the appropriate translations can be procured or produced.
1.1. Related Work
Past research has focused on measuring language similarity and reconstructing the phylogenetic trees of various language families, with many restricting their domain to the Indo-European languages. There is typically an emphasis on keeping the topics and semantic content of the dataset parallel across languages by using translations. We identify two recurring approaches: detecting source language interference in translated texts and comparing the spelling of translations of common words. These are used to define some measure of distance or similarity between pairs of languages (or pairs of feature vectors representing the languages). Hierarchical clustering is performed on the languages based on this distance measure to generate a phylogenetic tree. Both techniques have yielded accurate language family trees where closely related languages often cluster together.
Source language interference is the phenomenon where the characteristics of a source language transfer through the process of translation and can be measured in the target language. Nagata and Whittaker [3] investigate mother tongue interference by comparing English texts written by non-native speakers (“L2 texts”) to their corrected versions produced by native English speakers (“L1 texts”). They replace words with part-of-speech (POS) tags to reduce the influence of semantic content and sentence topics; a vector-based approach with POS trigram features is used, as well as a probabilistic word-sequence model. Zhao et al. [7] use a similar dataset of parallel texts written by non-native speakers who are learning English, comparing their initial sentences to later revisions corrected by native speakers.
Rabinovich et al. [4] investigate source language interference in the Europarl dataset, a collection of documents from the proceedings of the European Parliament. Speakers of the European Parliament write speeches and documents in their native language, which are first translated to English before being translated to all other EU languages by competent translators who are typically native speakers [4]. The authors show that traces of source languages are present after multiple rounds of translation. They construct phylogenetic trees using POS trigrams as in Nagata and Whittaker [3]; they also tested the use of more universal markers of translation, which ultimately did not provide the same accuracy in the resulting tree.
Another approach to constructing language family trees is used by Serva and Petroni [5] on a set of 50 Indo-European languages. It extends the glottochronological tactic of grouping languages based on the percentage of shared cognates but reduces the subjectivity of identifying cognates through the use of Swadesh lists. Swadesh lists are collections of words that are considered universal and resistant to changes in meaning, such as common pronouns, interpersonal relationships, and environmental objects. Serva and Petroni procure a Swadesh list for each language and transliterate them to the Latin alphabet. The distance between a pair of languages is taken to be the mean edit distance between word pairs with parallel meanings in their Swadesh lists; the specific edit distance used is the renormalized Levenshtein distance. These language distances are then run through hierarchical clustering to create phylogenetic trees. The authors later applied this technique to the Austronesian language group [8]. Crawford [6] applies a similar approach to a set of 41 languages using Jaro distance instead of renormalized Levenshtein distance.
In a departure from the previously described papers, which focus on text analysis, Wu et al. [9] use deep learning to find language similarities in the Wilderness dataset, a collection of raw speech recordings representing 195 different languages. They input the spectrogram features of the speech recordings into a long short-term memory (LSTM) neural network to compute 64-dimensional vector embeddings for each language. The Euclidean distance between language embeddings is found to correlate with geographical distance between languages, and languages in the same family, as determined by external sources, are highly likely to be neighbors in the embedding space.
A common thread between the papers analyzing text datasets is the use of language-specific domain knowledge. Groups of related words are collected and compared between languages, or text is scanned for specific linguistic features, such as parts of speech and cohesive markers. This typically requires a catalog for each language describing common words and their functions or definitions, such as a Swadesh list.
1.2. Research Aim
While word catalogs and relevant natural language processing (NLP) libraries are available for many languages, we sought to develop methods which do not rely on prior knowledge of any particular language. To that end, we use document vectors trained on parallel translations to measure language similarity. These vectors encode important syntactic and semantic features of the training documents without the need for explicit feature engineering. By maintaining a set of equivalent documents across our considered languages, we can compare the vector sets for each language; information about the semantic content and topics should be consistent, leaving linguistic properties as the main source of divergence. We employ three methods which process these document vectors to produce phylogenetic trees and language family clusters. In the first method, centroid clustering, we find the centroid of each language’s document vectors, then use hierarchical clustering with Ward linkage to create the language family tree. The second method, network partitioning, involves creating a network for each language by running kNNs (k-Nearest Neighbors) on its document vectors. Community detection is run on each network to produce a partition of its nodes, and the Normalized Mutual Information (NMI) is computed between the partitions of each distinct language pair to measure language similarity. As in the first method, hierarchical clustering with Ward linkage is applied to these language similarities to produce a language family tree. In the third method, we apply Deep Embedded Clustering (DEC) to the document vectors for all languages to group them into a predefined number of clusters.
Our work is the first to apply document vector techniques to the problem of estimating language similarities. We also introduce a novel network-based clustering method that exploits the structure of our parallel text corpus and associated document vector dataset.
2. Materials and Methods
Here, we describe our corpus of parallel translations of the Bible, choice of languages, and how the text is processed to yield document vectors trained on individual Bible verses. We then detail the three methods used to measure language similarity: centroid clustering, network partitioning, and Deep Embedded Clustering (DEC). Finally, we list the specific metrics used for evaluating the performance of our methods. Figure 1 depicts the overall processing pipeline for our work.
2.1. Dataset
2.1.1. Text Corpus
Previous work in language similarity analysis has sought to reduce the influence of topics and semantic content in the text, e.g., by comparing sentence pairs with identical meanings [7] or abstracting away from word definitions using POS-tagging [3,4]. This ensures that differences between texts are linguistic in nature, rather than semantic. For this research, a text corpus was compiled using parallel translations of the Bible. Bibles were downloaded from eBible [10] and WordProject [11]; each chapter of the Bible is contained in a separate text file which lists its book and chapter information in the filename.
The Bible was chosen because it is widely translated, contains a large amount of structured text, and has been shown to be an effective dataset for multilingual NLP research [12,13,14]. Other parallel text corpora used in previous translation research [3,4] such as the Europarl [15] and ICLEv2 [16] corpora represent 21 languages and 11 languages, respectively, while the full canon of the Bible has been translated into 724 languages [17]. The hierarchical organization of the Bible into books, chapters, and verses allows for the connection of specific sections of the Bible across different languages. As detailed in Section 2.1.2, the texts are corresponded between languages at the verse level to obtain a set of 24,186 identical Bible verses translated into each language; this is roughly analogous to the sentence pair approach used in Zhao et al. [7]. Our text dataset satisfies several useful properties for translation research corpora, including parallelism, multilinguality, and one-to-one translations [18].
Bibles were obtained in nearly 50 languages; however, some languages were removed from consideration due to poor text representation or poor verse matching—either the language did not have a large enough portion of the Bible or too many of its verses were unable to be corresponded with those of other languages. Non-Indo-European languages were also removed from consideration so that our results could be compared directly with those of Serva and Petroni [5]. Ultimately, 22 languages were selected representing 4 Indo-European language families, which are detailed in Table 1.
2.1.2. Preprocessing
Before creating document vectors, the text corpus is preprocessed. Numerals, punctuation, and nontextual characters are deleted, and capital letters are replaced with their lowercase equivalents. The chapter text files are “matched” based on their line counts, which correspond to their number of verses. Chapters that have differing line counts for at least one language are removed from consideration. This guarantees that when a chapter is split into verses using line breaks, these verses are equal in number across all languages and can be corresponded based on the order in which they appear in the chapter. For our chosen set of 22 languages, this reduces the number of chapters from 1066 common chapters to 880 matched chapters, with a total of 24,186 verses per language.
2.1.3. Document Vectors
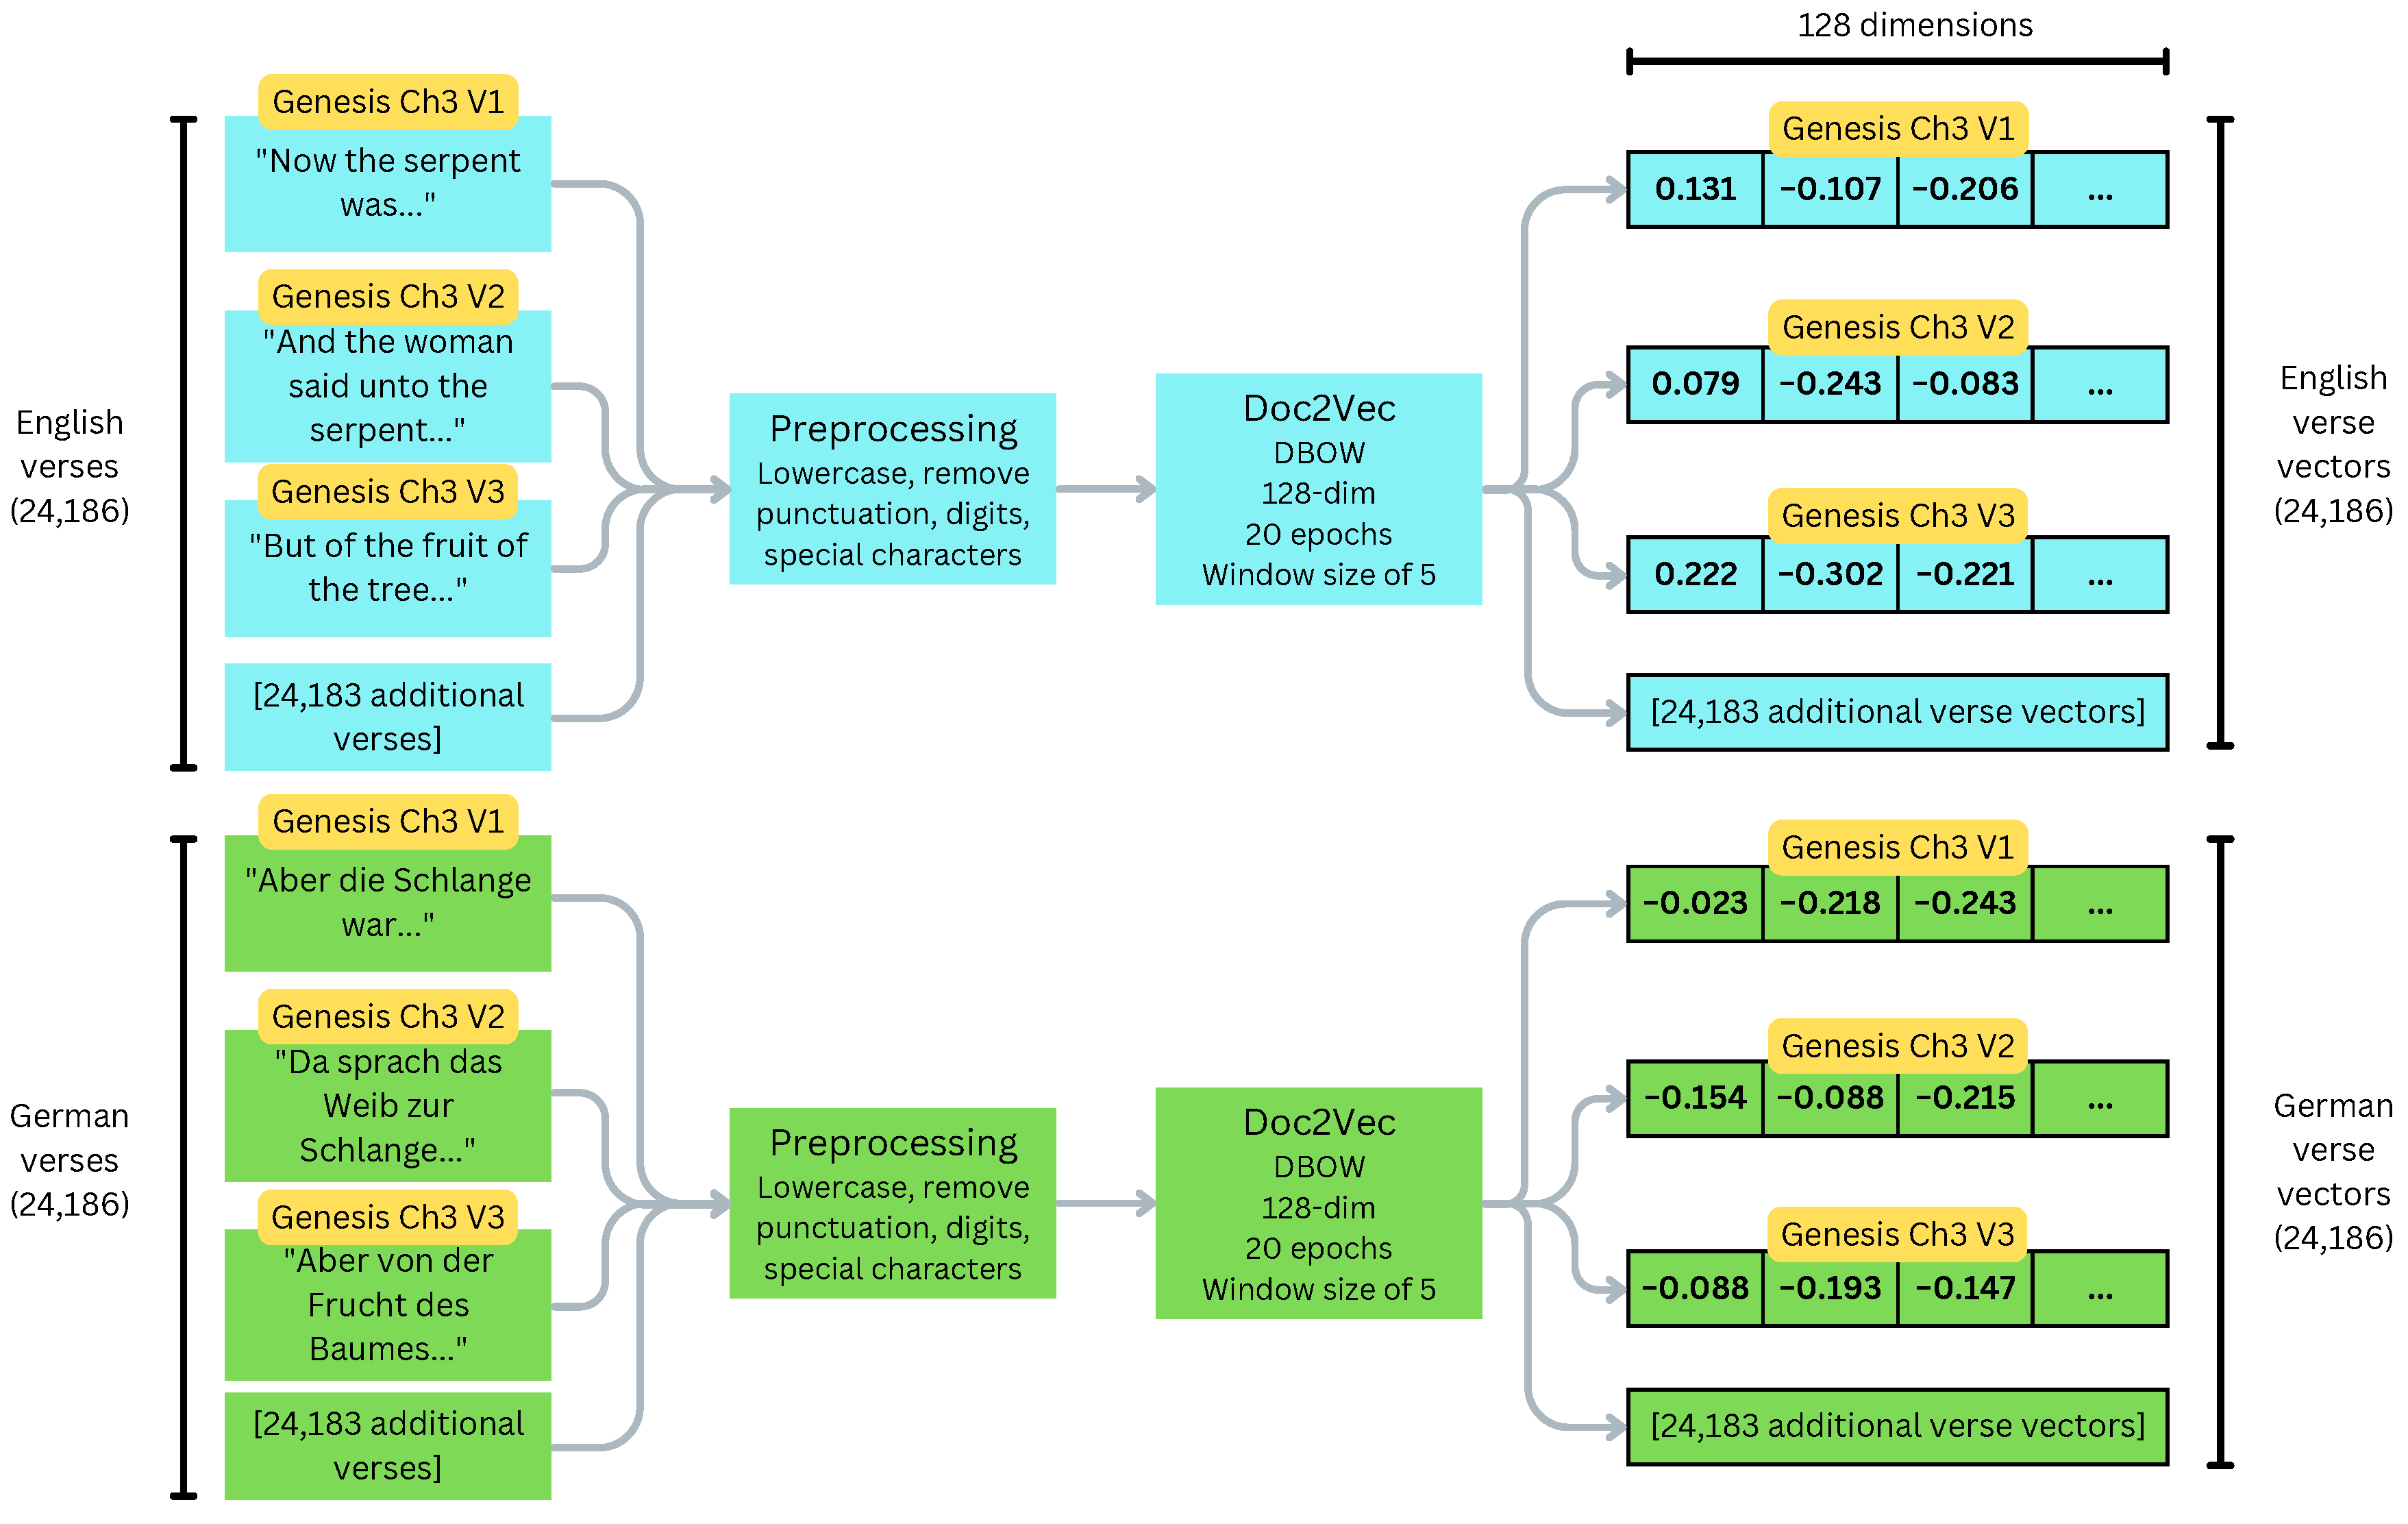
Each language’s Bible is processed to generate a document vector for each verse in the list of matched chapters. These “verse vectors” are used as input to the methods for assaying language similarity. They are trained using Doc2Vec [19], a framework for creating embeddings that capture important semantic and syntactic properties of variable-length text sequences. Document similarity can be estimated by computing the cosine similarity between two document vectors [20]; a smaller angle between the vectors gives a larger cosine similarity.
These embeddings are trained in a similar fashion to word vectors in Word2Vec [21]; a document vector is initialized randomly for each document, then updated using word prediction tasks on samples from the document. The Distributed Memory (DM) method concatenates the document vector with the word vectors of context words, then uses the concatenated vector to predict the next word in the document. The Distributed Bag of Words (DBOW) method uses only the document vector to predict words from the document. DM is analogous to the Continuous Bag of Words method of Word2Vec, while DBOW is analogous to the Skip-Gram method [19].
Using the Gensim implementation of Doc2Vec [22], 128-dimensional verse vectors are trained for 20 epochs using the DBOW method and a window size of 5. These parameters were chosen through experimentation; in particular, while the DM method achieves state-of-the-art performance on most tasks [19], using DBOW greatly improved the computed language similarities over DM. The verse vectors for each language are trained separately using a new Doc2Vec model, and each vector is given an associated ID containing its language, book, chapter, and verse number. Figure 2 shows the processing pipeline for generating verse vectors from our text corpus. A visualization of the verse vector dataset using Principal Component Analysis (PCA) can be found in Section 3.5.
2.2. Determining Language Families and Structure
In the following section, three methods for estimating language similarity are described: hierarchical clustering of language centroids (Method A), hierarchical clustering using language network partitioning and NMI (Method B), and Deep Embedded Clustering of verse vectors (Method C). Methods A and B use hierarchical clustering to generate language family trees, while Method C uses a neural network-based approach to group verse vectors into 4 clusters which are compared with the 4 ground-truth families. Hierarchical clustering is a common technique for building language family trees, given some measure of distance between languages [3,4,5,6]. It groups observations into a hierarchy of nested clusters; the result can be represented as a phylogenetic tree with each leaf being a distinct observation. Phylogenetic trees fit the process of language evolution as it is currently understood: like living organisms, languages change gradually over time as “mutations” accumulate [8], and languages with a more recent common ancestor share similarities and can be grouped into families.
Phylogenetic trees can be compared numerically using a variety of metrics, and we discuss our chosen metrics in Section 2.3. They are also useful for visualizing the relationships between languages, as different levels of the tree correspond to larger groups of languages: two languages that are merged directly are more similar to each other than to other languages in the set, while a subtree of several languages represents a language family or subfamily. At the highest level of the tree, the relationships between entire families can be inferred from the order in which they are merged.
2.2.1. Method A: Hierarchical Clustering of Language Centroids
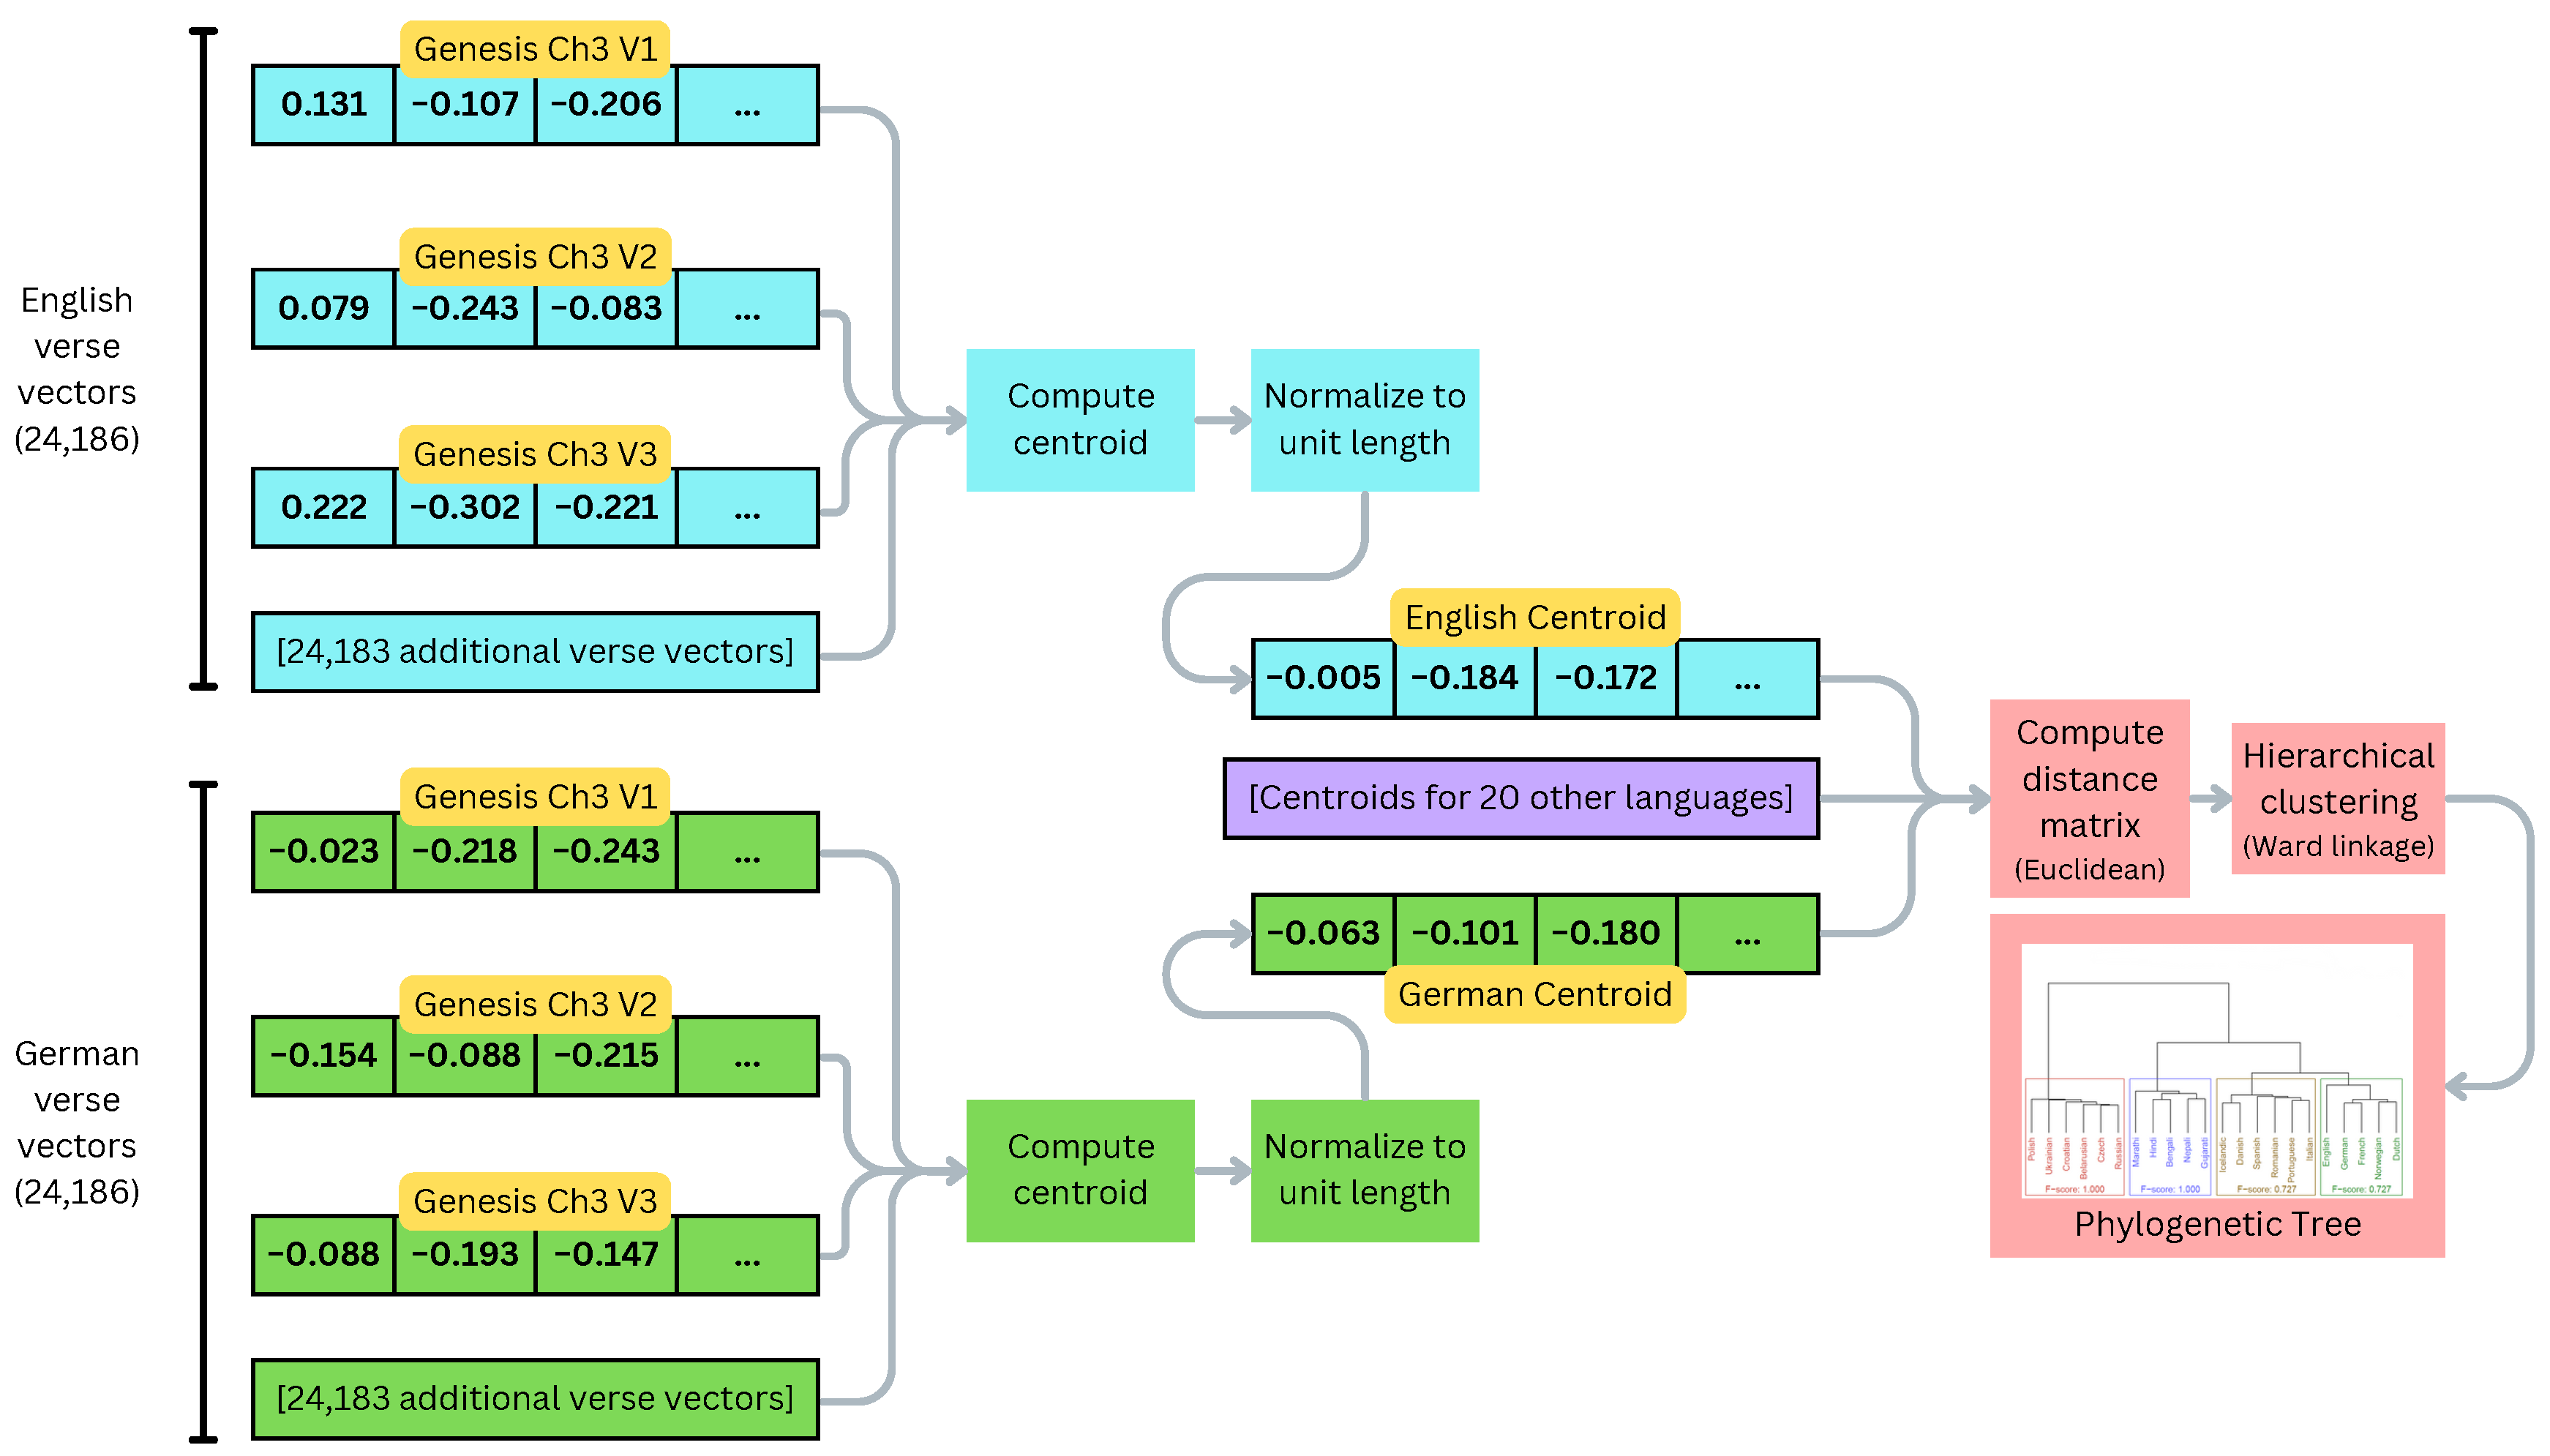
For each language, the centroid of its verse vectors is computed, yielding one observation per language. Clustering the full set of verse vectors requires excessive memory, while the centroid of a set of document vectors is an effective summary [23,24]. The centroids are then normalized to unit length before computing the Euclidean distance between each centroid to generate a distance matrix D, where is the distance between the ith and jth observations. Normalizing the vectors and computing the Euclidean distance matrix is an alternative to computing the cosine distance matrix, which was unavailable in our software environment. The exact distance values can differ, but the relative ranking of vectors is preserved; in other words, ordering a vector’s neighbors from least to most distant yields identical results under both distance metrics. Hierarchical clustering is then performed on D using the Ward linkage method [25]. This is carried out using the hclust method in R, and the resulting hclust object is coerced into a phylogenetic tree for visualization and evaluation. Figure 3 shows the processing pipeline for this method.
2.2.2. Method B: Network Partitioning and NMI
The basic idea behind this method is to consider each language separately and examine the structure of its verse vectors using network science, then compare these structures between languages. This distinguishes it from the vector clustering methods, which consider the verse vectors of all languages simultaneously. Like the centroid clustering method, a distance matrix between languages is generated and used to perform hierarchical clustering, yielding a phylogenetic tree. This method would be classified as a Known Node-Correspondence (KNC) method for network comparison [26].
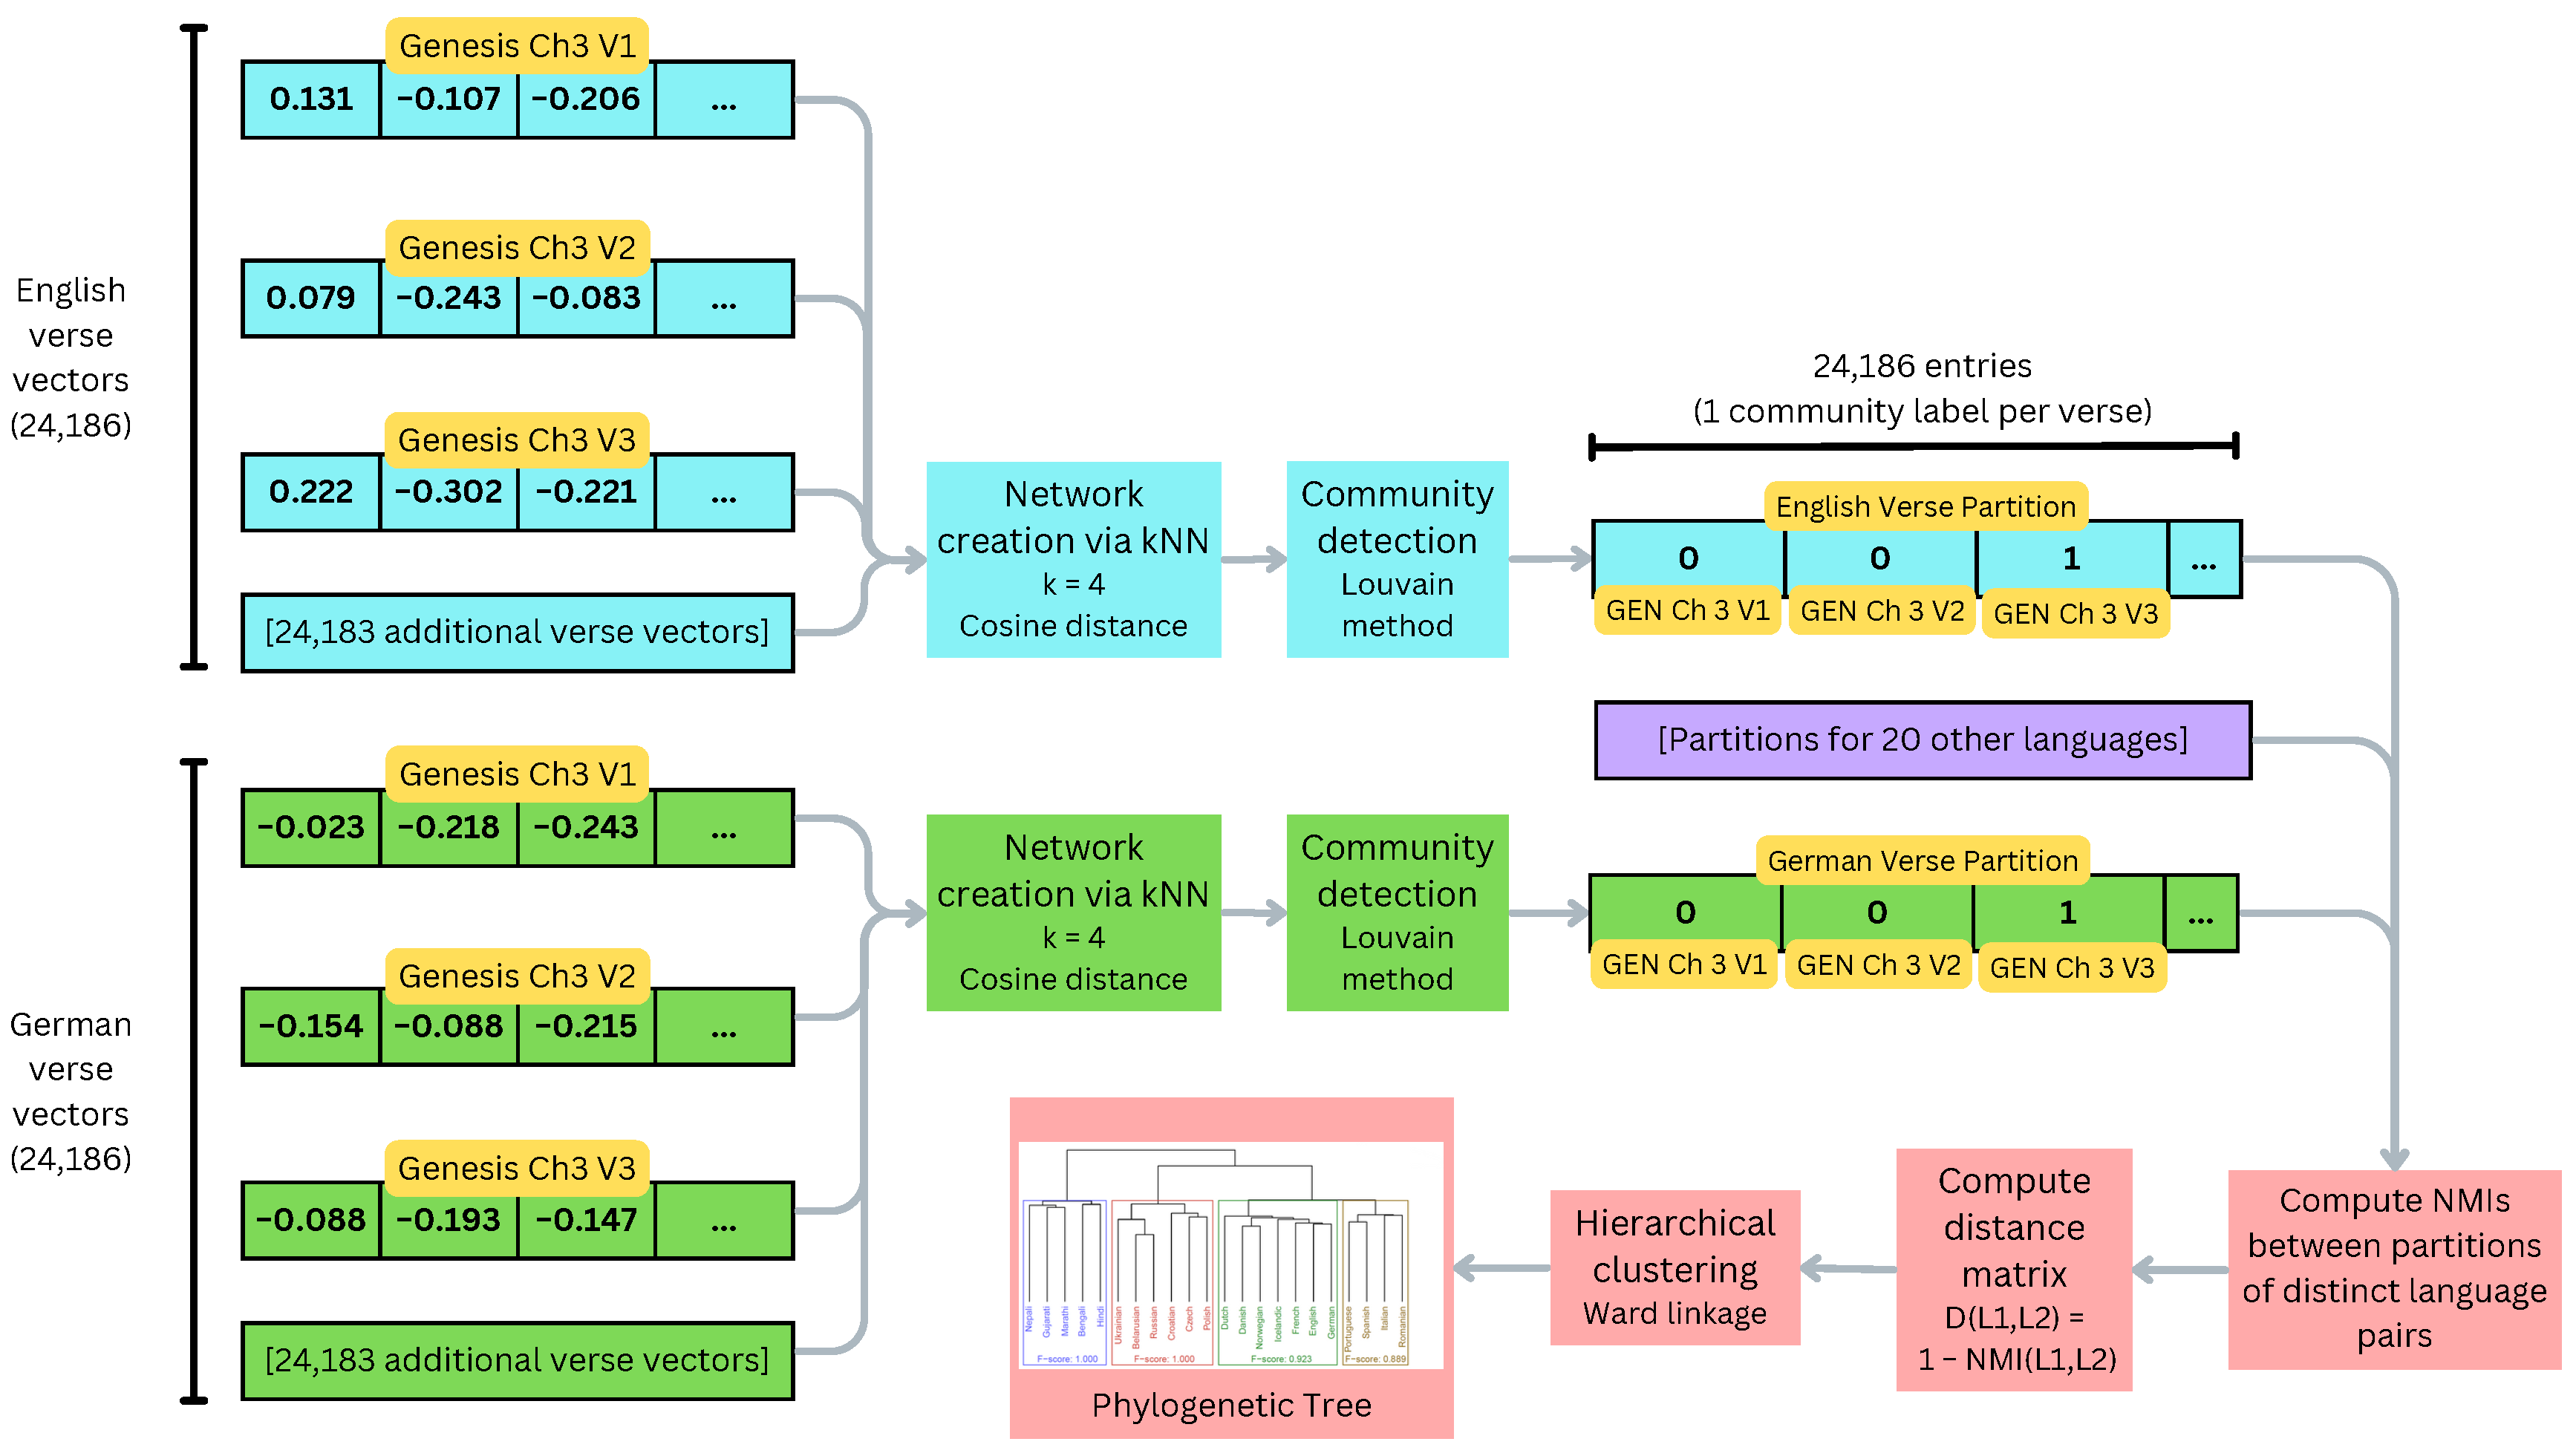
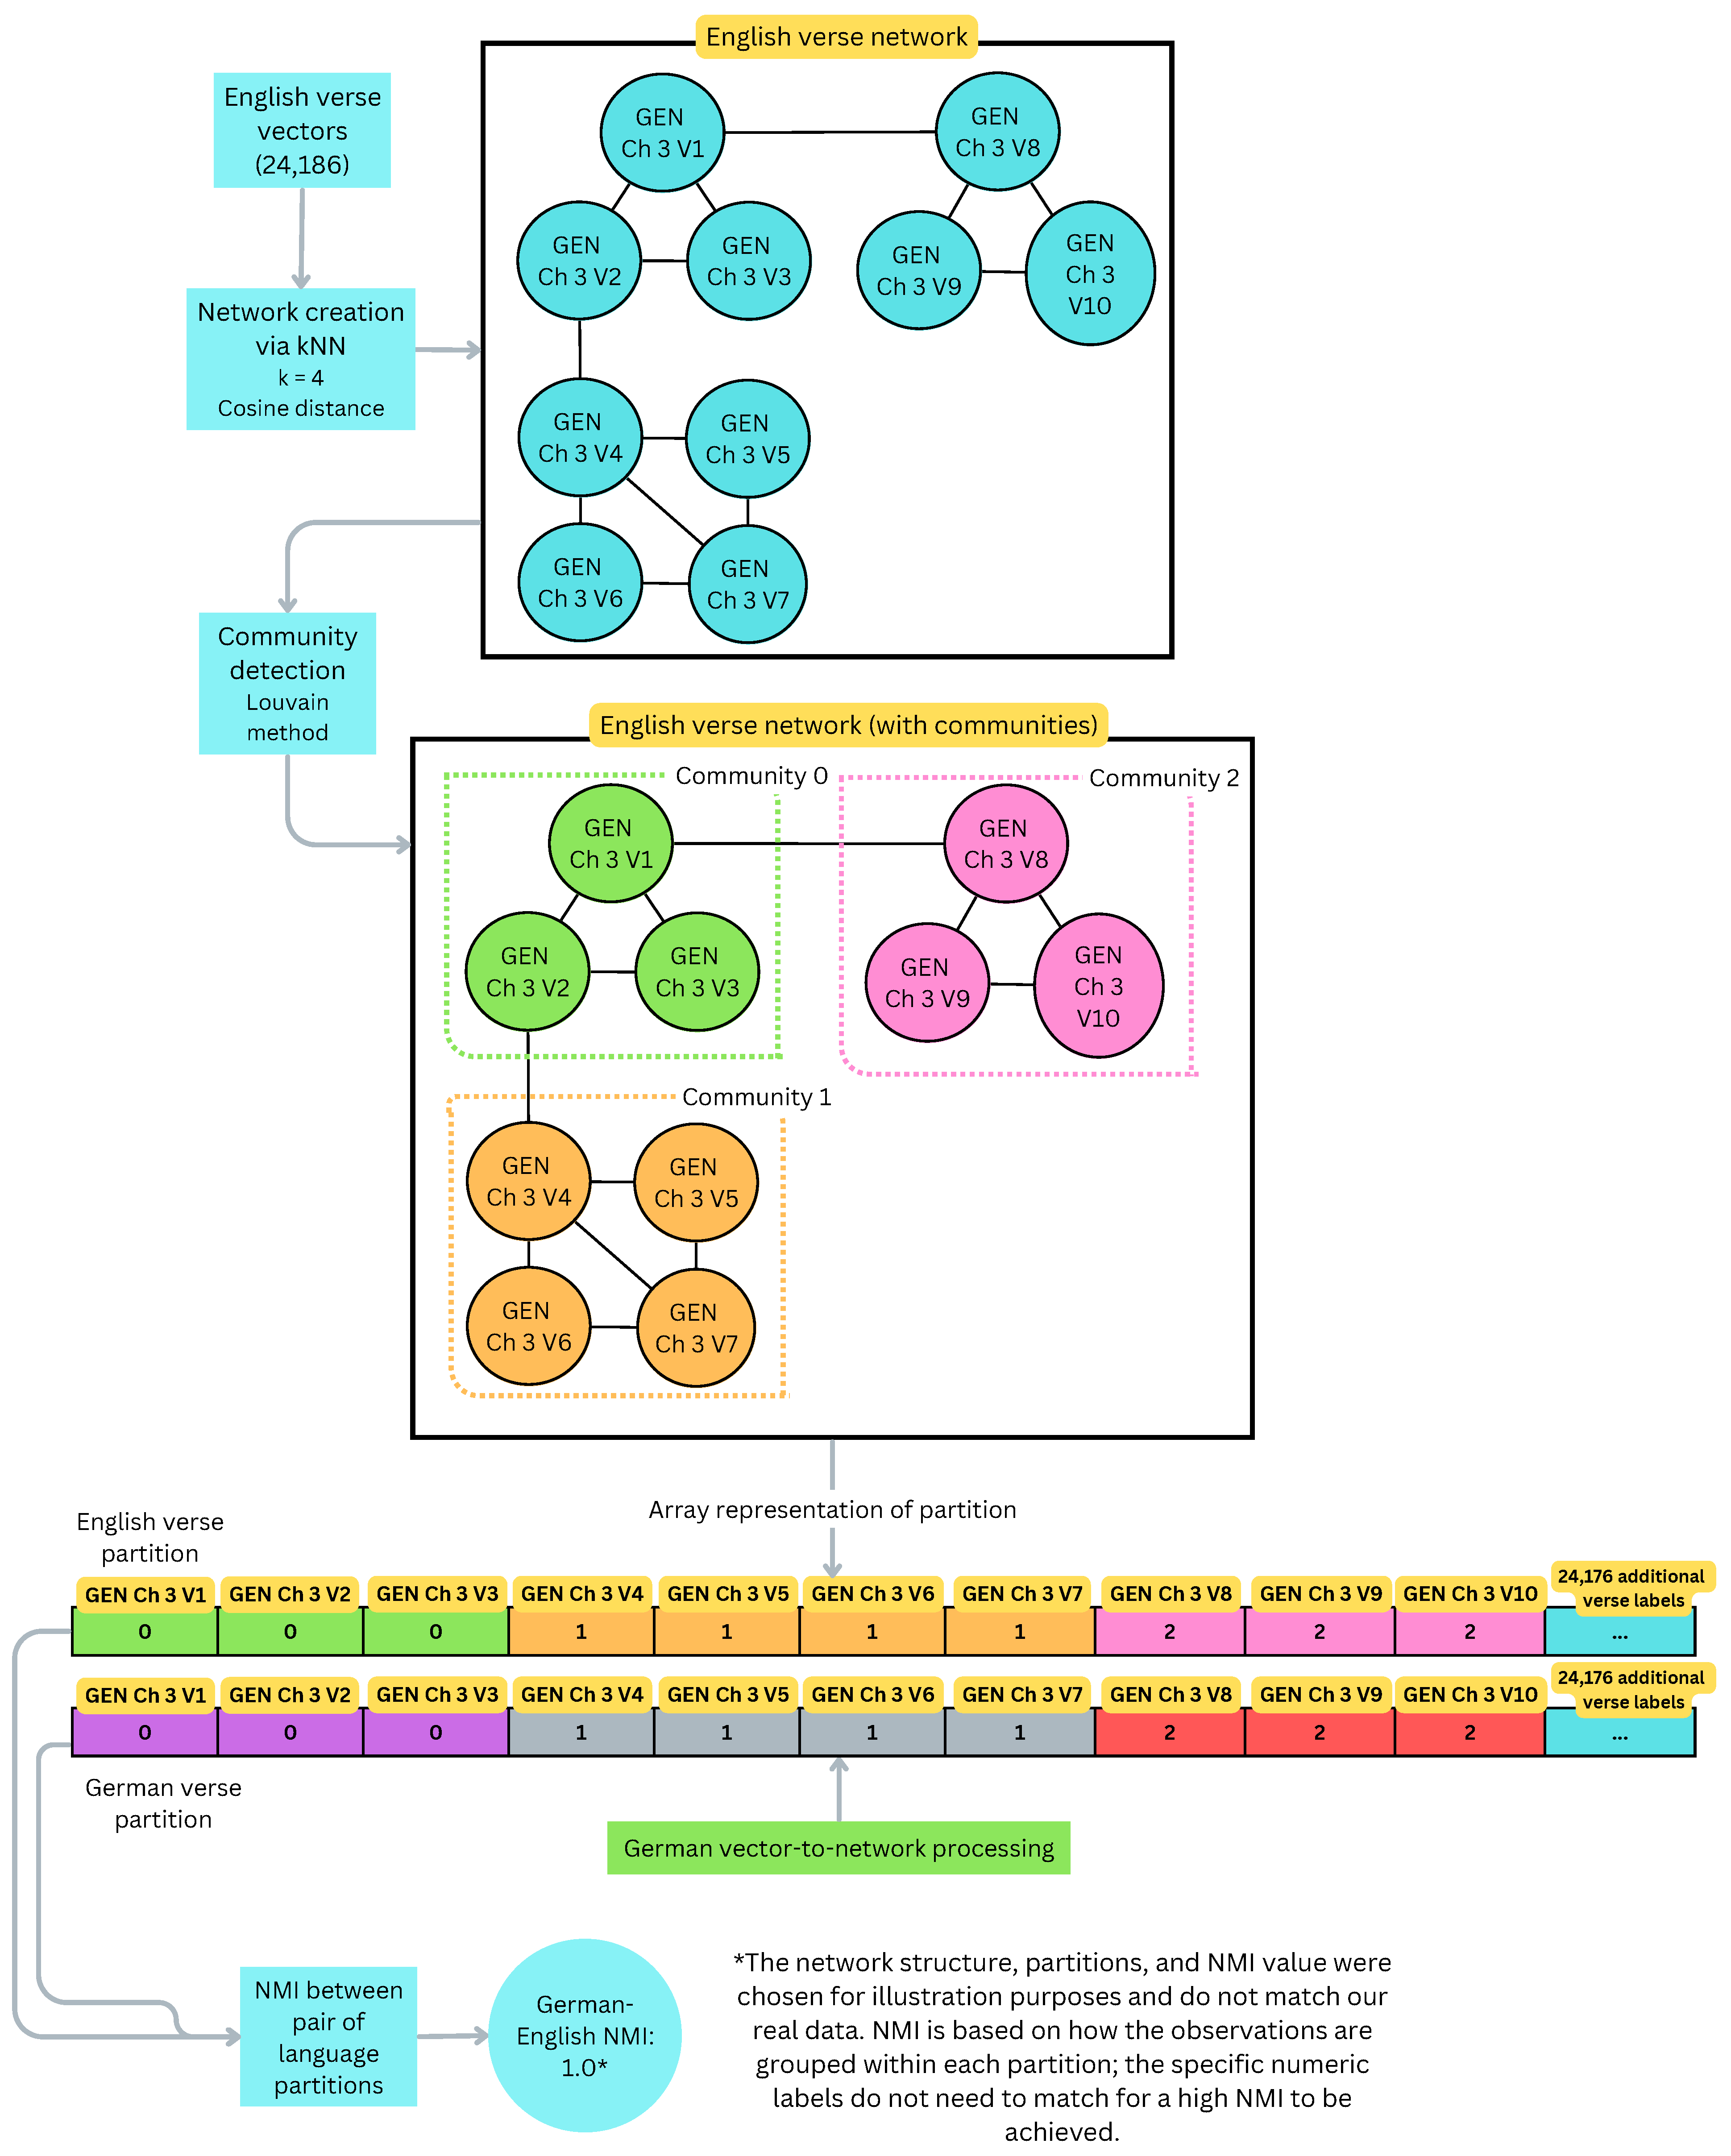
First, a network is created for each language based on its verse vectors. A node is added for each verse and tagged with its book, chapter, and verse ID. For each vector, k-Nearest Neighbors (kNN) is used to find its 4 nearest neighbors in the embedding space based on cosine distance. An edge is added to the network between the target vector’s node and each of its neighbors’ nodes; the edge weight is the cosine similarity between the two vectors, so more similar verses have larger weights. This produces a network for each language which captures and summarizes the relationships between its verses.
Modularity maximization is then run on each language’s network to detect communities. Modularity is a measure of the quality of a specific partition of a network into communities, and was initially defined by Newman and Girvan [27] as , where is the fraction of edges with both nodes in community i, and is the fraction of edges that attach to nodes in community i. For this work, we used the Louvain method of modularity maximization [28]; this was conducted in cuGraph [29], which allows for GPU-accelerated graph processing. This resulted in 20–40 communities per language, and each verse is assigned an integer label corresponding to its community.
To measure similarity between languages, the Normalized Mutual Information (NMI) is computed between their networks’ partitions. Mutual information is a useful similarity metric for determining the shared information between two clusterings of a set of observations, and NMI is a variant designed to aid in comparison between different NMI values [30]. It is defined by Strehl and Ghosh [30] as
where is the mutual information between clusterings X and Y, and is the entropy of X. The entropy of a clustering X measures the average amount of information needed to describe it and is defined by Cover and Thomas [31] as
The mutual information measures the amount of information a clustering X contains about a clustering Y (and vice versa). It can be defined in terms of entropy [31] as
As has no upper bound, Strehl and Ghosh [30] choose to normalize this by the geometric mean of the two clusterings’ entropies. This restricts to a maximum value of 1 in the case of identical clusterings, as [31].
Using these NMIs, a distance matrix D is constructed, where ; hierarchical clustering with Ward linkage is run on D to obtain a phylogenetic tree. Figure 4 shows the overall processing pipeline for this method, while Figure 5 shows a detailed view of the community detection and partition comparison steps for an example network.
In addition to NMIs between pairs of languages, NMIs between pairs of language families are computed for evaluation purposes. This provides another avenue for showing family similarities alongside the phylogenetic tree. For each ground-truth family, the language pair NMIs involving a language of this family are partitioned into sets based on the family of the secondary language; the family-to-family NMI is the mean NMI of the appropriate set. For example, the Germanic–Slavic NMI is the mean NMI for all distinct language pairs of a Germanic language and a Slavic language. A similar process is used to compute self-similar family-to-family NMIs, such as the Germanic–Germanic NMI, except these do not include the NMIs between a language’s network and itself. (Trivially, these would be 1, and we are interested in the similarity of each language in a family to the other languages in that family, not to itself).
Formally, we compute the NMI between 2 distinct families, and , as
while the NMI between a family and itself is computed as
2.2.3. Method C: Deep Embedded Clustering
The other direct vector clustering method used is Deep Embedded Clustering (DEC) [32]. This is performed to investigate how verse vectors cluster in a nonhierarchical setting and whether these clusters correspond to the ground-truth language families. Additionally, DEC allows for the use of batch processing, which enables clustering of the entire vector dataset without the need for intermediate processing as in the previous two methods.
DEC uses a deep autoencoder to learn feature mappings of the input vectors. Encoding layers reduce the dimensionality of the input vectors to the size of a bottleneck layer in the middle, then a symmetric set of decoding layers attempts to reconstruct the vectors. After pretraining the autoencoder, the decoding layers are discarded; the encoding layers are used to generate the feature mappings which are then fed to a clustering algorithm. Cluster centroids are initialized using k-means clustering. DEC uses Kullback–Leibler (KL) divergence as the loss function for clustering, given in Equation (6), which seeks to minimize the difference between two probability distributions based on the feature mappings and their cluster centroids.
Here, is the soft cluster assignment of an embedding given its centroid , while is a normalization of based on soft cluster frequencies. This approach emphasizes high-confidence cluster assignments while reducing the impact of larger clusters on learned feature mappings [32]. The output is a set of cluster assignments, one for each verse vector.
We use a Keras implementation of DEC by Guo [33]. The autoencoder is pretrained on the full set of verse vectors for 40 epochs; the Stochastic Gradient Descent (SGD) optimizer was used for pretraining, and the layers were initialized using the VarianceScaling initializer (1/3 scale, uniform distribution). A tolerance of 0.01 is used during clustering, meaning that clustering is stopped if fewer than 1% of vectors have changed clusters between iterations. The desired number of clusters is set to 4 so that the generated clusters can be directly compared to the 4 ground-truth families. Unlike the network method, this does not permit the construction of a phylogenetic tree, but the language composition of the 4 clusters can be analyzed to determine whether DEC generates meaningful groups of verse vectors.
2.3. Performance Evaluation
Generated phylogenetic trees are compared with the ground-truth tree described in Section 3 using 4 different distance measures: symmetric (Robinson–Foulds) distance [34], branch score distance [35], path difference [36], and weighted path difference; this is carried out via the treedist method of the phangorn library in R [37].
To compare family clustering results, the generated trees are each cut into 4 subtrees using the cutree method in R; then, each language is assigned an integer value according to its subtree. The ground-truth labels are acquired by cutting the ground-truth tree in the same fashion (DEC provides cluster assignments directly). The Hungarian algorithm [38] is applied to our generated cluster labels to correspond them appropriately with the ground-truth labels; this permutes the integer labels between clusters to maximize overlap between the generated clusters and the ground-truth clusters but does not move observations from one cluster to another [39]. Thus, each generated cluster is labeled with the “best estimate” language family based on its contained languages. We then compute the precision, recall, and F-score between each predicted family and the ground-truth families; equations for precision and recall are listed below, while F-score is simply the harmonic mean of precision and recall. “Matched languages” refers to languages in the predicted family from the correct ground-truth family.
For example, the precision for the predicted Germanic family would be the fraction of languages in the family that are Germanic, while the recall would be the fraction of all Germanic languages that are in the family. A predicted Germanic family that contained only Germanic languages would have a precision of 1, but its recall would be lower if it is missing any Germanic languages. A predicted Germanic family that contained all Germanic languages would have a recall of 1, but its precision would be lower if it contained additional languages from other families.
Significance Testing
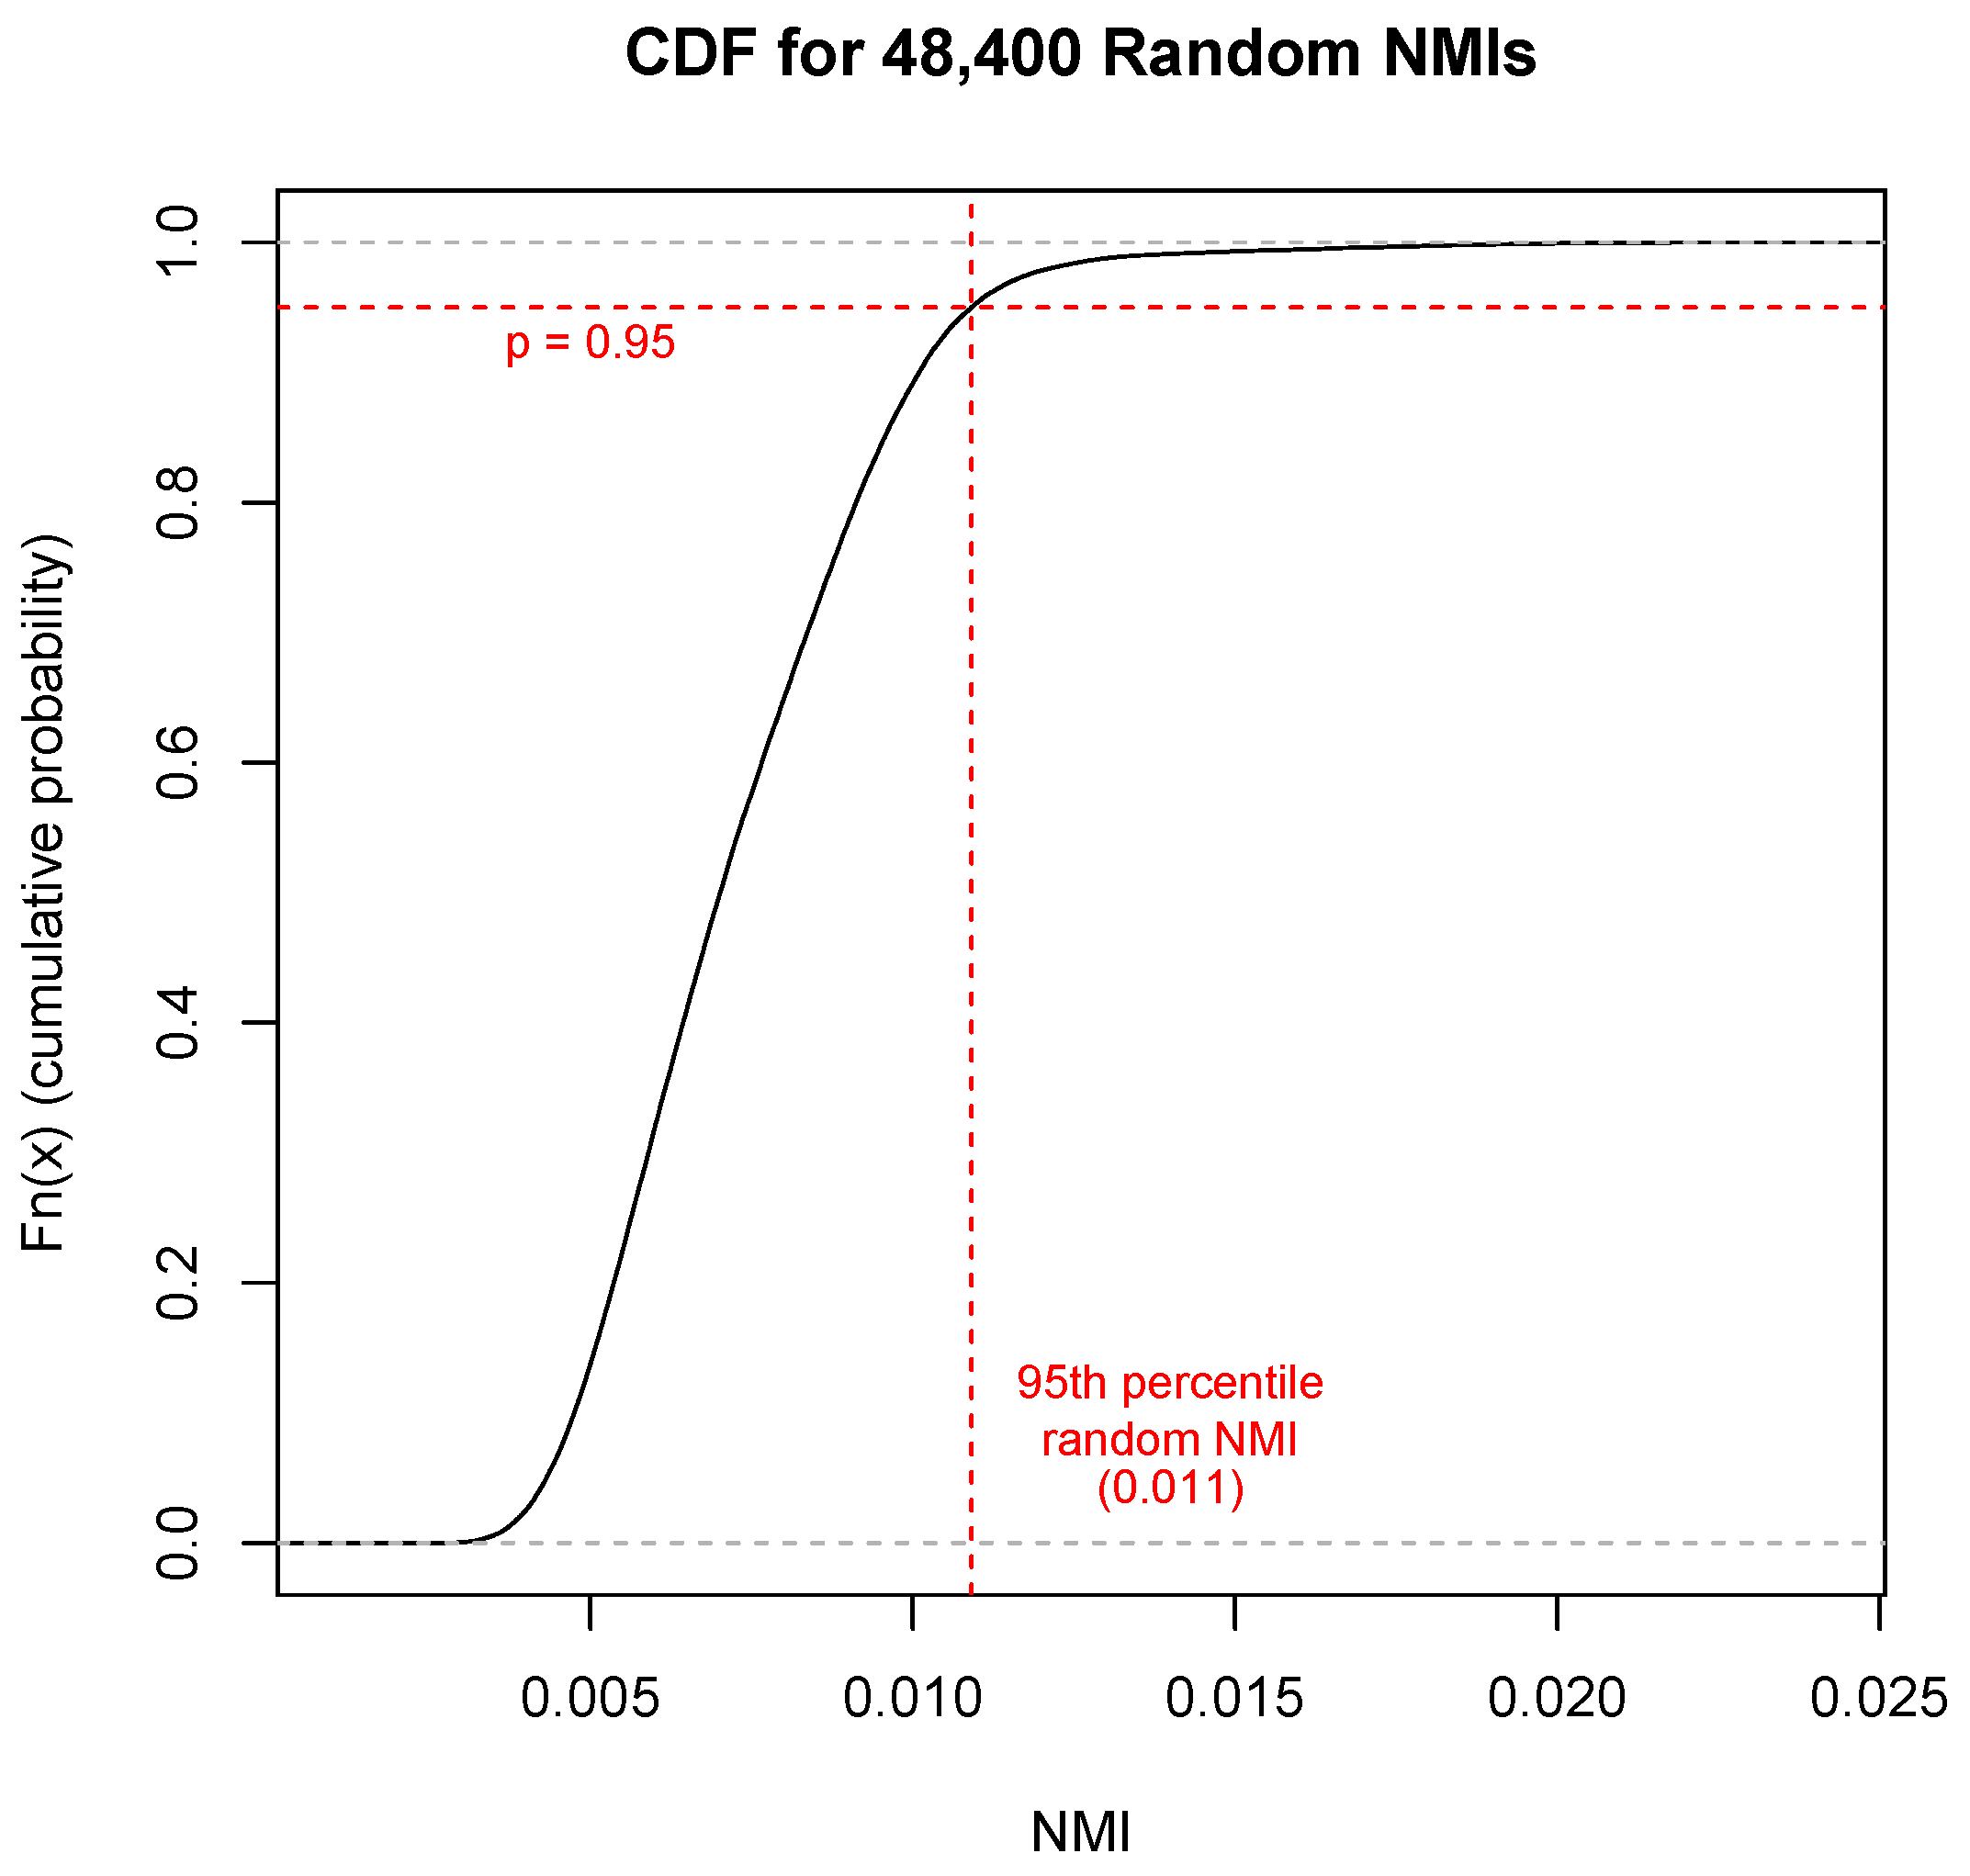
To test the significance of tree distances and language pair NMIs, a method is adapted from Gultepe et al. [40]. A cumulative distribution function (CDF) for the relevant metric is computed based on a series of random trials, and the real value is considered significant if it falls below the p = 0.05 threshold for random distances (or above the p = 0.95 threshold for random similarities). Significance of tree distances is tested by generating 1000 random trees. Each random tree is created by permuting the values of the network partitioning distance matrix, then hierarchical clustering is run on the randomized distance matrix. These are compared with the ground truth, and if the corresponding value for a method’s generated tree falls below the 5th percentile, this is considered significant. A similar approach is used to test the significance of language pair NMIs for the network partitioning method: random verse vectors are generated for each language, converted to networks, and partitioned, then NMIs are computed between pairs of partitions. Real language pair NMIs are considered significant if they are higher than the 95th percentile random NMI. Because family-to-family NMIs are computed by averaging language pair NMIs, their significance is also determined via comparison to these random NMIs. Figure 6 shows the CDF used for NMI significance testing.
3. Results
3.1. Ground Truth
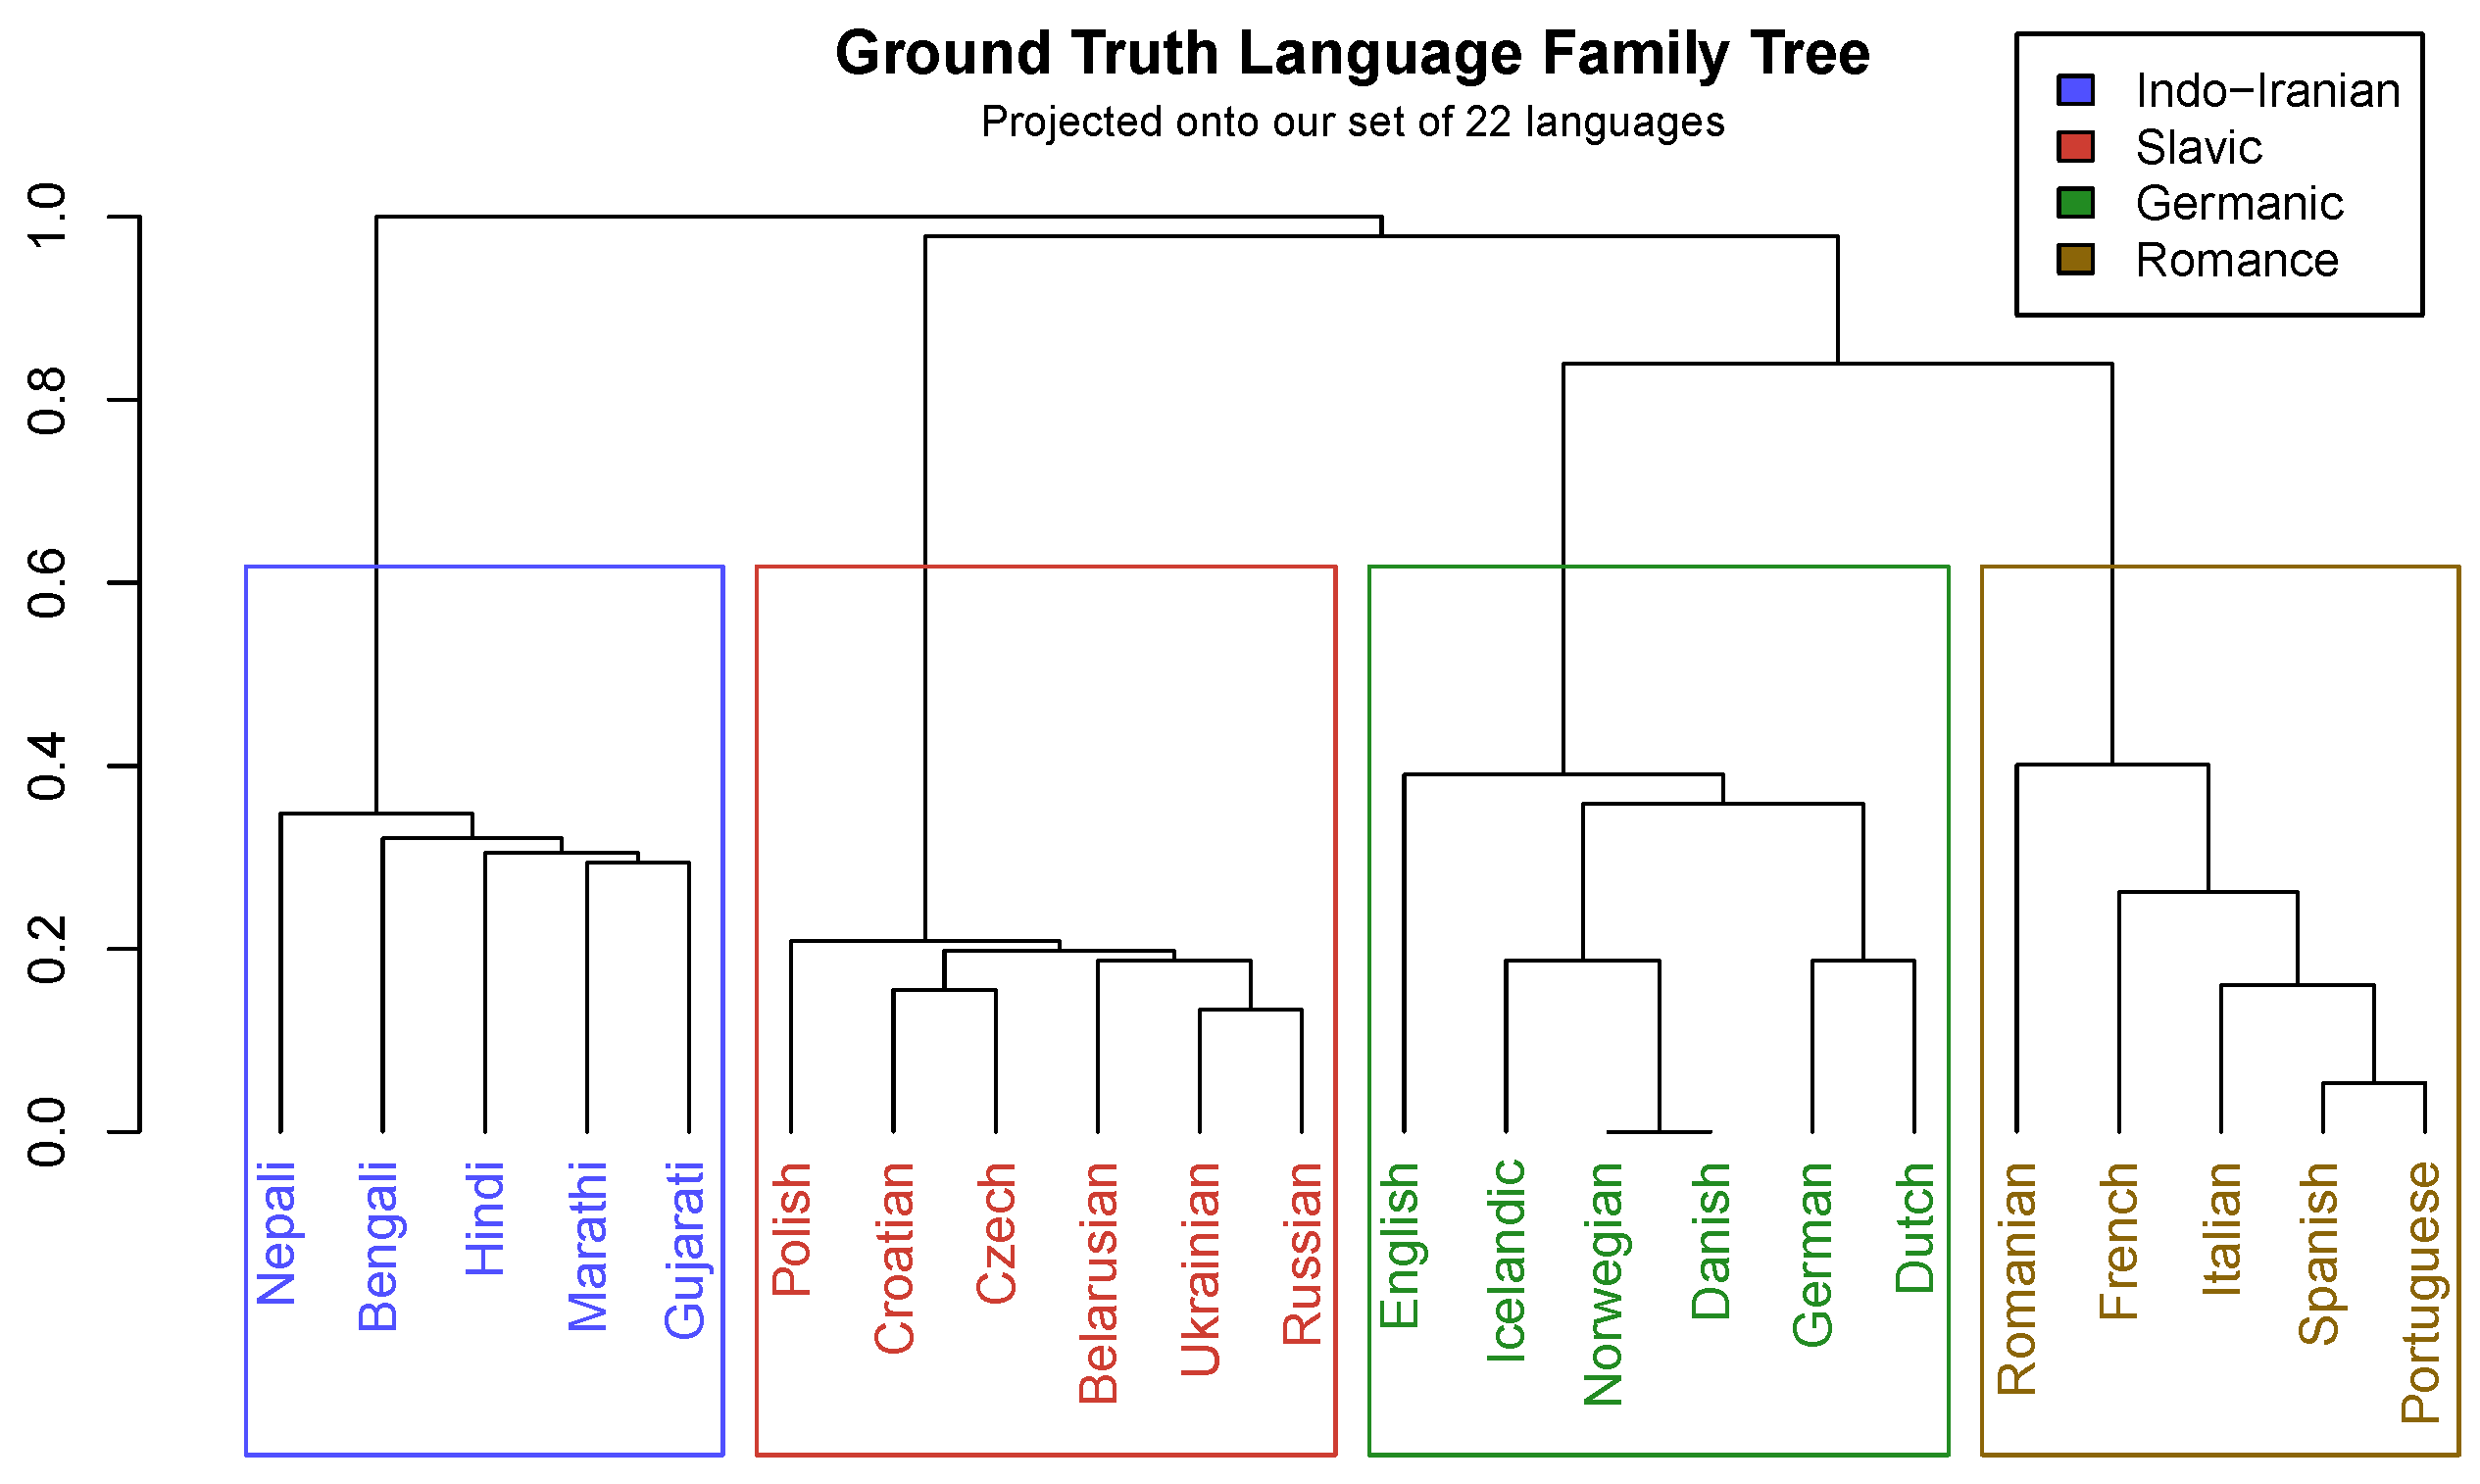
A version of the Indo-European phylogenetic tree from Serva and Petroni [5] is used as the ground truth for family tree and family cluster evaluation. Specifically, their original tree was projected onto our set of 22 languages by pruning branches that did not lead to a member of the set; this projected tree is shown in Figure 7. Both the ground-truth tree and our generated trees are scaled to a height of 1; branch heights maintain the same proportions. There are six pairs of “sibling” languages that have the most recent common ancestors: (Marathi, Gujarati), (Croatian, Czech), (Ukrainian, Russian), (Norwegian, Danish), (German, Dutch), and (Spanish, Portuguese). In addition, each family has an “earliest offshoot” language which is the most chronologically distant from the other family members. These are Nepali for the Indo-Iranian family, Polish for the Slavic family, English for the Germanic family, and Romanian for the Romance family.
3.2. Evaluation of Centroid Clustering Method
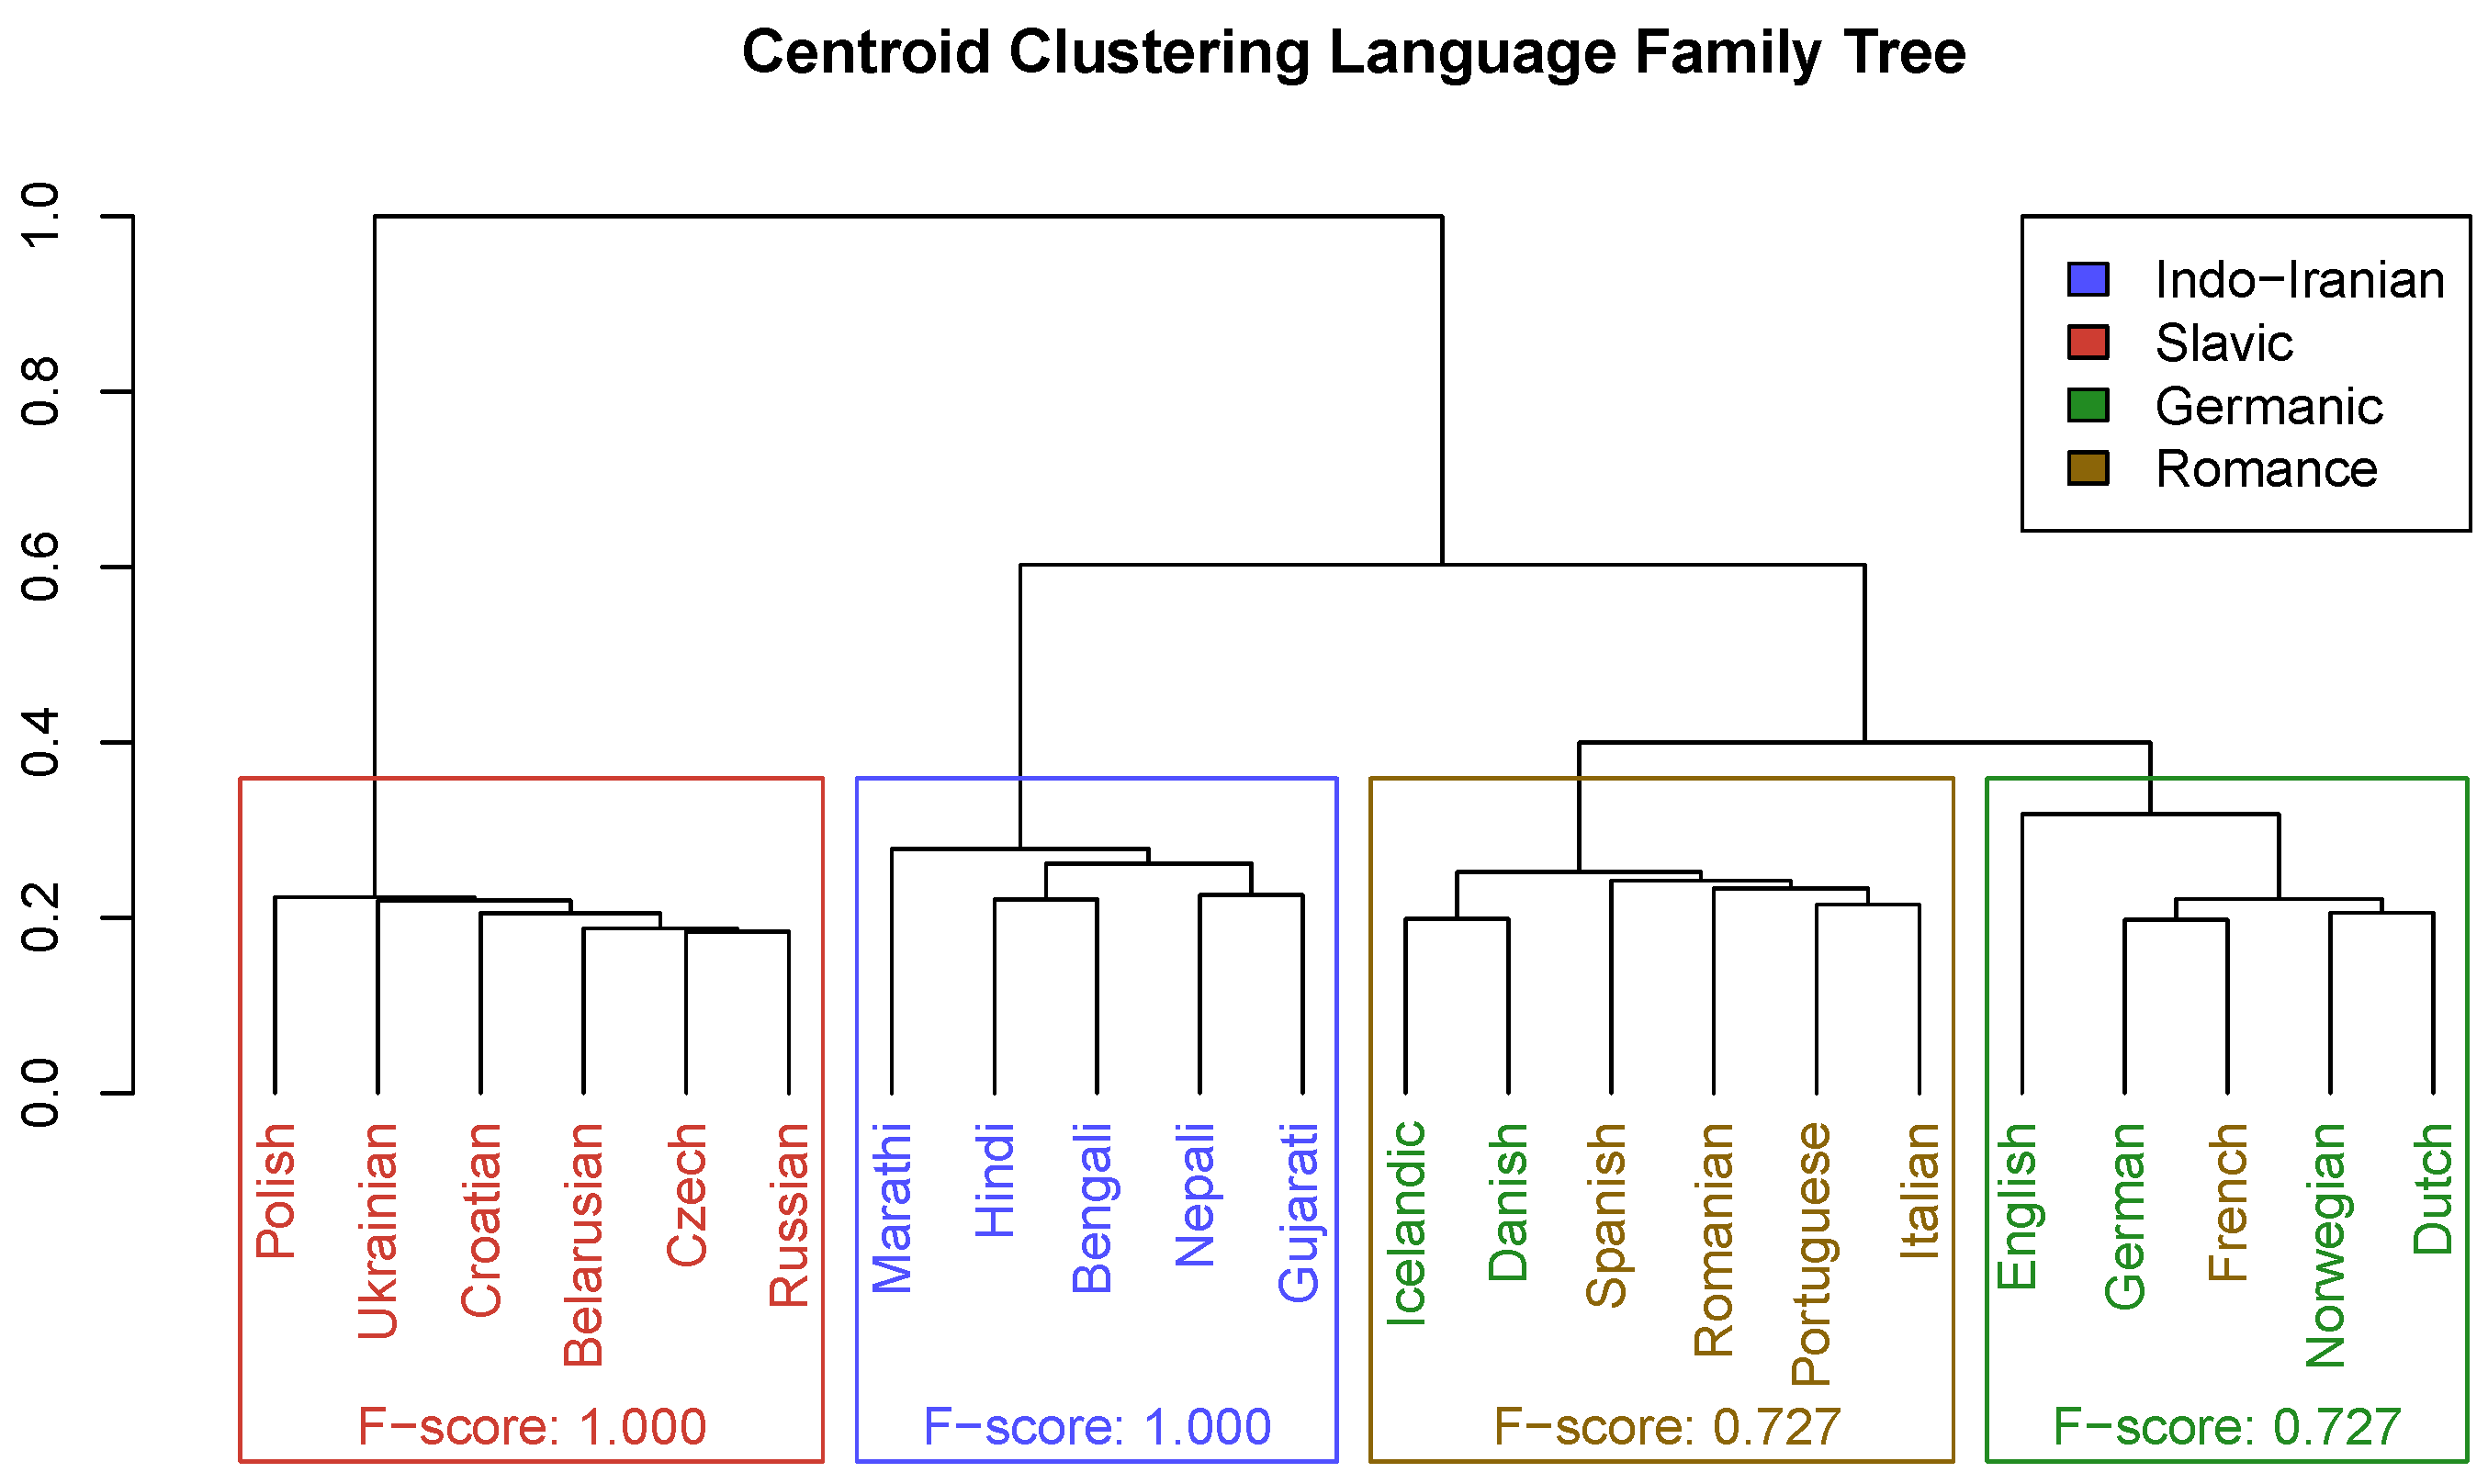
Figure 8 shows the phylogenetic tree generated by the centroid clustering method. To obtain language families, this tree is cut into four subtrees, which are interpreted as the predicted language families for clustering metrics. The Indo-Iranian and Slavic families are identical to the ground-truth families in terms of member languages. However, the Germanic and Romance families are not pure; specifically, Icelandic and Danish should swap with French. The Germanic and Romance families are correctly merged first, but this Germanic–Romance cluster should subsequently merge with the Slavic family (not the Indo-Iranian family, which is the most distant). In addition, intrafamily relationships are somewhat noisy; 0 of the 6 sibling language pairs from the ground truth are represented here. The centroid tree does correctly place Polish as the earliest offshoot of the Slavic family but does not do the same for Nepali, English, or Romanian in their respective families. A visualization of the verse vectors and centroids for each language can be found in Section 3.5.
For clustering metrics, the Hungarian algorithm is used to align the predicted numeric cluster labels with the ground-truth numeric cluster labels; the numeric labels are then substituted for the appropriate language family names. Table 2 and Table 3 give the confusion matrix and clustering evaluation metrics for the centroid clustering method. All Indo-Iranian and Slavic languages are clustered correctly, and thus centroid clustering achieves the maximum precision, recall, and F-score of 1 for these families. There is some confusion between Germanic and Romance languages; two Germanic languages are in the Romance cluster, while one Romance language is in the Germanic cluster. The two misclassified German languages reduce Germanic recall and Romance precision to 0.667 (4/6), while the one misclassified Romance language reduces Germanic precision and Romance recall to 0.800 (4/5); this leads to F-scores of 0.727 for both families.
3.3. Evaluation of Network Partitioning Method
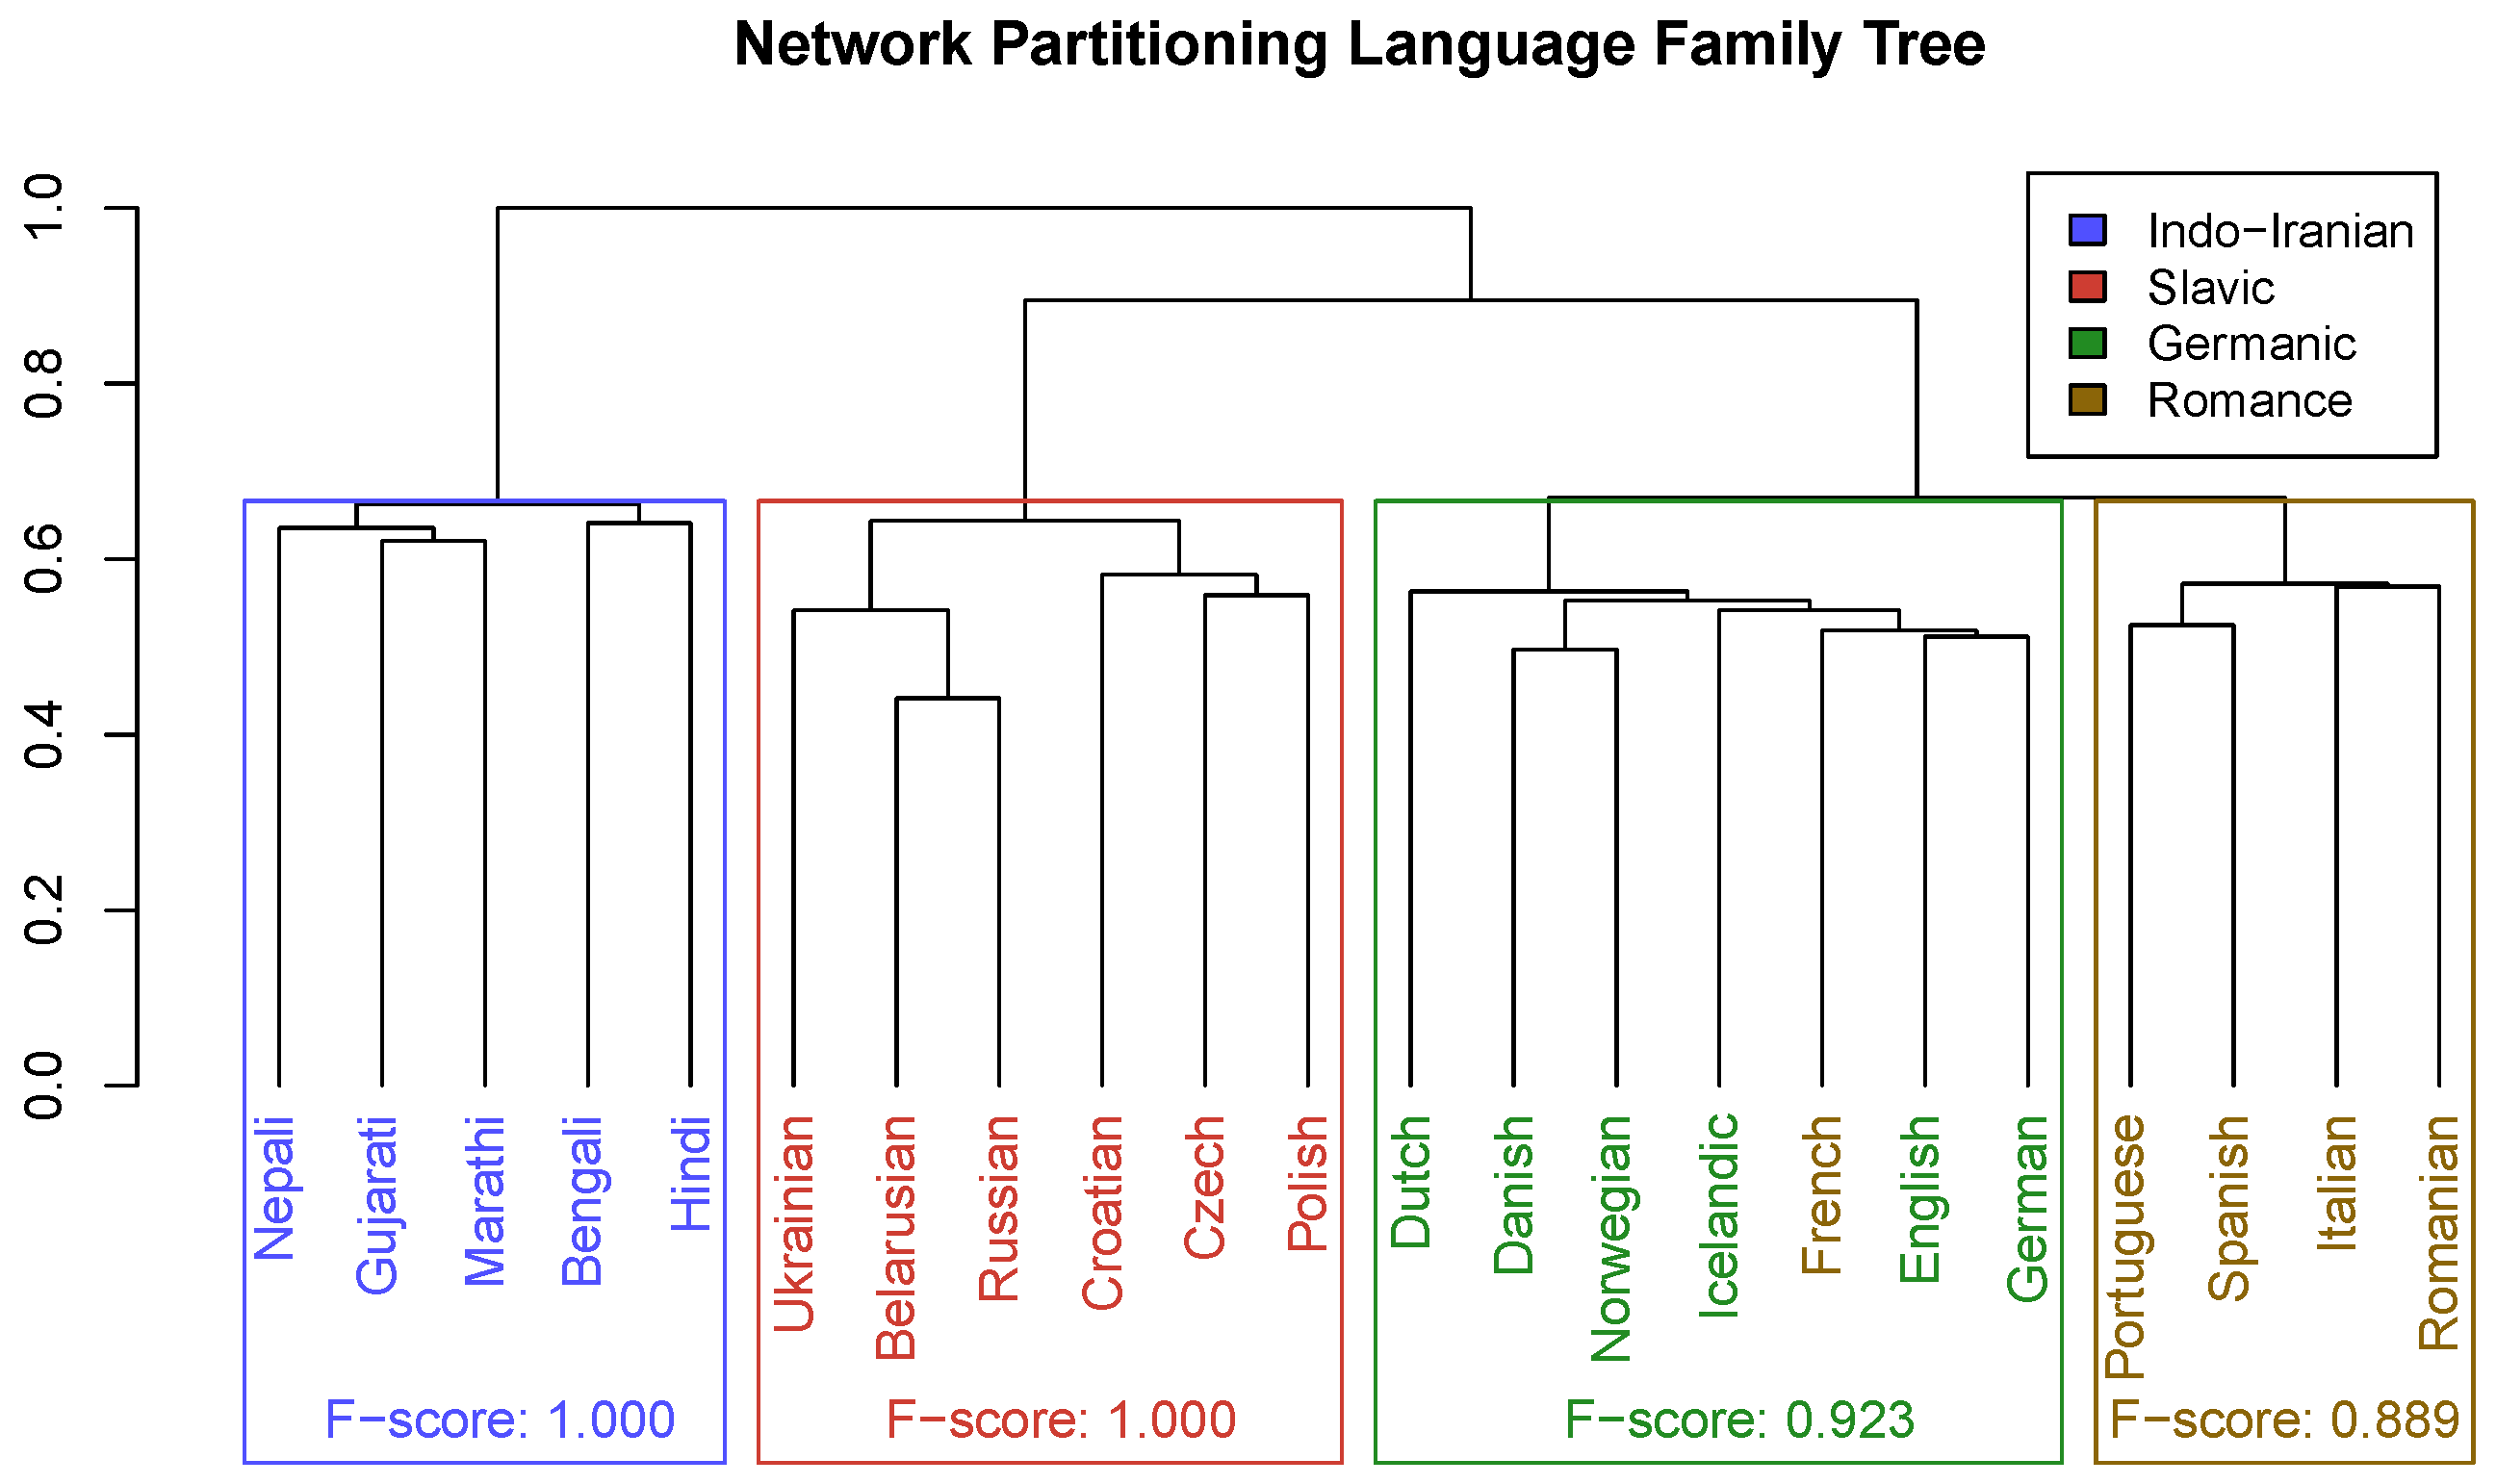
Figure 9 shows the phylogenetic tree generated by the network partitioning method; as with the centroid clustering tree, this tree is cut into four subtrees, and appropriate family labels are obtained via the Hungarian algorithm. The family composition is purer than that of the centroid tree; if French were moved to the Romance cluster, the predicted families would be identical to the ground truth in terms of language membership. Additionally, the order of family merging is correct: Germanic merges with Romance first, then Slavic, and finally Indo-Iranian. Three of the six sibling language pairs are represented: (Marathi, Gujarati), (Norwegian, Danish), and (Portuguese, Spanish). However, the earliest offshoot languages merge with other languages at a lower height than they should.
Table 3 and Table 4 give the confusion matrix and clustering evaluation metrics for the network partitioning method. Three of the predicted families contain all languages from the corresponding actual family, achieving the maximum recall of 1. The Indo-Iranian and Slavic clusters correspond exactly to the respective ground-truth families, and thus, network partitioning achieves the maximum precision, recall, and F-score of 1 for these families. The only misclassification is a single Romance language in the predicted German family, which reduces Germanic precision to 0.857 and Romance recall to 0.800. The F-scores for Germanic and Romance are 0.923 and 0.889, respectively. Overall, network partitioning outperforms both centroid clustering and DEC on all clustering metrics.
Family-to-Family Similarity
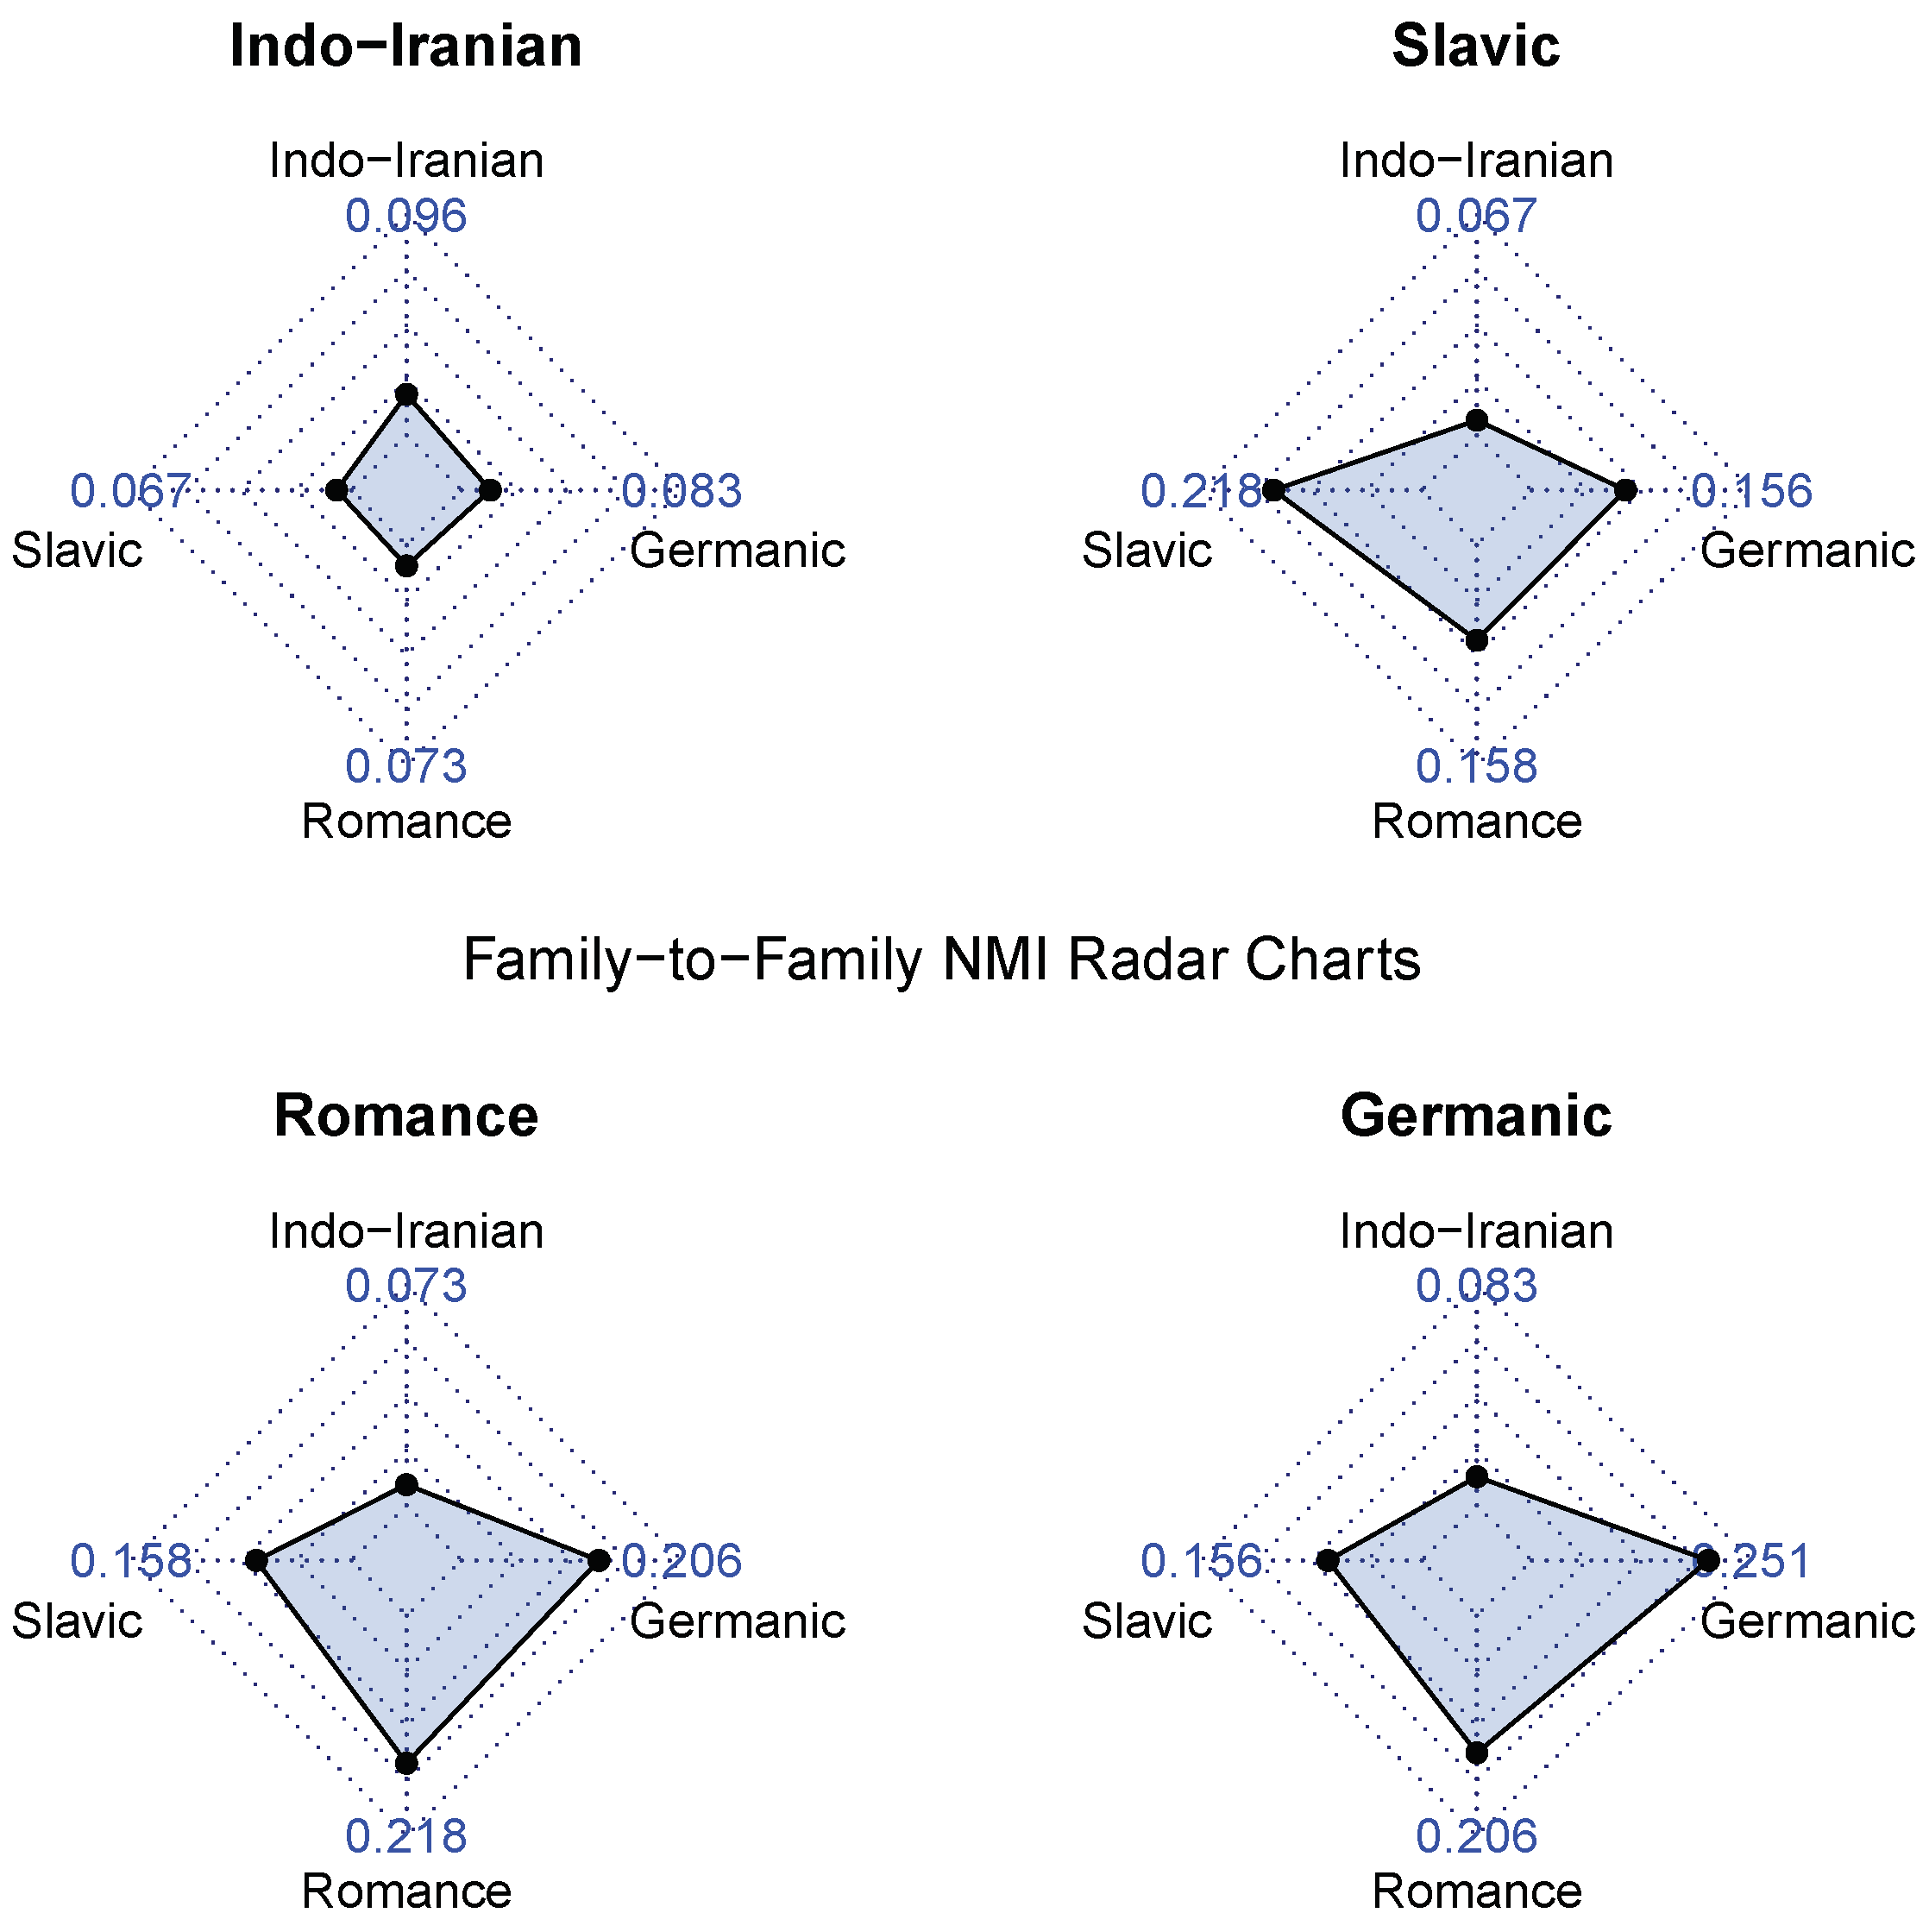
Figure 10 shows the average family-to-family NMI values for the network partitioning method, with one radar chart per language family. For each family, the highest NMI is with itself, implying that languages in that family are more similar to each other than to languages outside the family. The Slavic family demonstrates this by the widest margin, with a Slavic–Slavic NMI of 0.218; the Slavic–Germanic and Slavic–Romance NMIs are roughly 30% lower at 0.156 and 0.158. The Romance and Germanic charts show that the languages in these families have similar verse partitions; the Germanic–Romance NMI of 0.206 is comparable to the Germanic–Germanic and Romance–Romance NMIs of 0.251 and 0.218. Conversely, the Indo-Iranian NMIs are low across the board but still demonstrate that Indo-Iranian languages are the most similar to each other, rather than outside languages.
To test the significance of our language pair NMI values, 100 random networks were generated for each language using random vectors derived from the language’s verse vectors using PCA [40]. Community detection is run on each random network to obtain its verse partition, which is compared with the partitions of the 22 real language networks using NMI. This provided 48,400 random NMI values for comparison; the 95th percentile NMI was 0.011, while the maximum NMI was 0.023. All family-to-family NMI values are higher than the 95th percentile random NMI and thus statistically significant, as are all language pair NMIs (the lowest being Hindi–Polish at 0.055).
3.4. Tree Distance Metrics
Four tree distance metrics were computed between each generated tree and the ground-truth tree: symmetric distance, branch score distance, path difference, and quadratic path difference. Results are displayed in Table 5. For all metrics, the generated trees fall below the p = 0.05 threshold established by the random trees and are thus statistically significant [40]. The network partitioning method has the best symmetric distance and quadratic path difference, while the centroid method has the best branch score distance. The generated trees are separated by around 0.1 standard deviation for path difference and thus perform equally well.
3.5. Evaluation of DEC Method
Table 3 and Table 6 give the confusion matrix and clustering evaluation metrics for the DEC method. Because DEC provides a cluster label for each vector, rather than the entire language, there are 24,186 observations per language. To accommodate this, the ground-truth cluster labels are expanded to contain 24,186 observations per language; all observations for a particular language have identical cluster labels based on the language’s ground-truth family.
Unlike centroid clustering and network partitioning, none of the clusters are pure, with some confusion happening for each family. The actual Slavic vectors are the most pure, with less than 0.1% being clustered incorrectly (recall of 0.999). Roughly 10% of the actual Indo-Iranian vectors are predicted as Slavic, leading to a recall of 0.906 for Indo-Iranian. The predicted Slavic cluster also contains 10% of the actual Romance vectors, thus reducing the precision of Slavic to 0.864. The Germanic and Romance vectors are spread more widely, though most confusion is between Germanic and Romance themselves; 15.7% of actual Germanic vectors are clustered as Romance, and 46.3% of actual Romance vectors are clustered as Germanic. Like the other two methods, this leads to very high clustering metrics for the Indo-Iranian and Slavic families (F-scores of 0.944 and 0.927) and lower values for Germanic and Romance families (F-scores of 0.726 and 0.453).
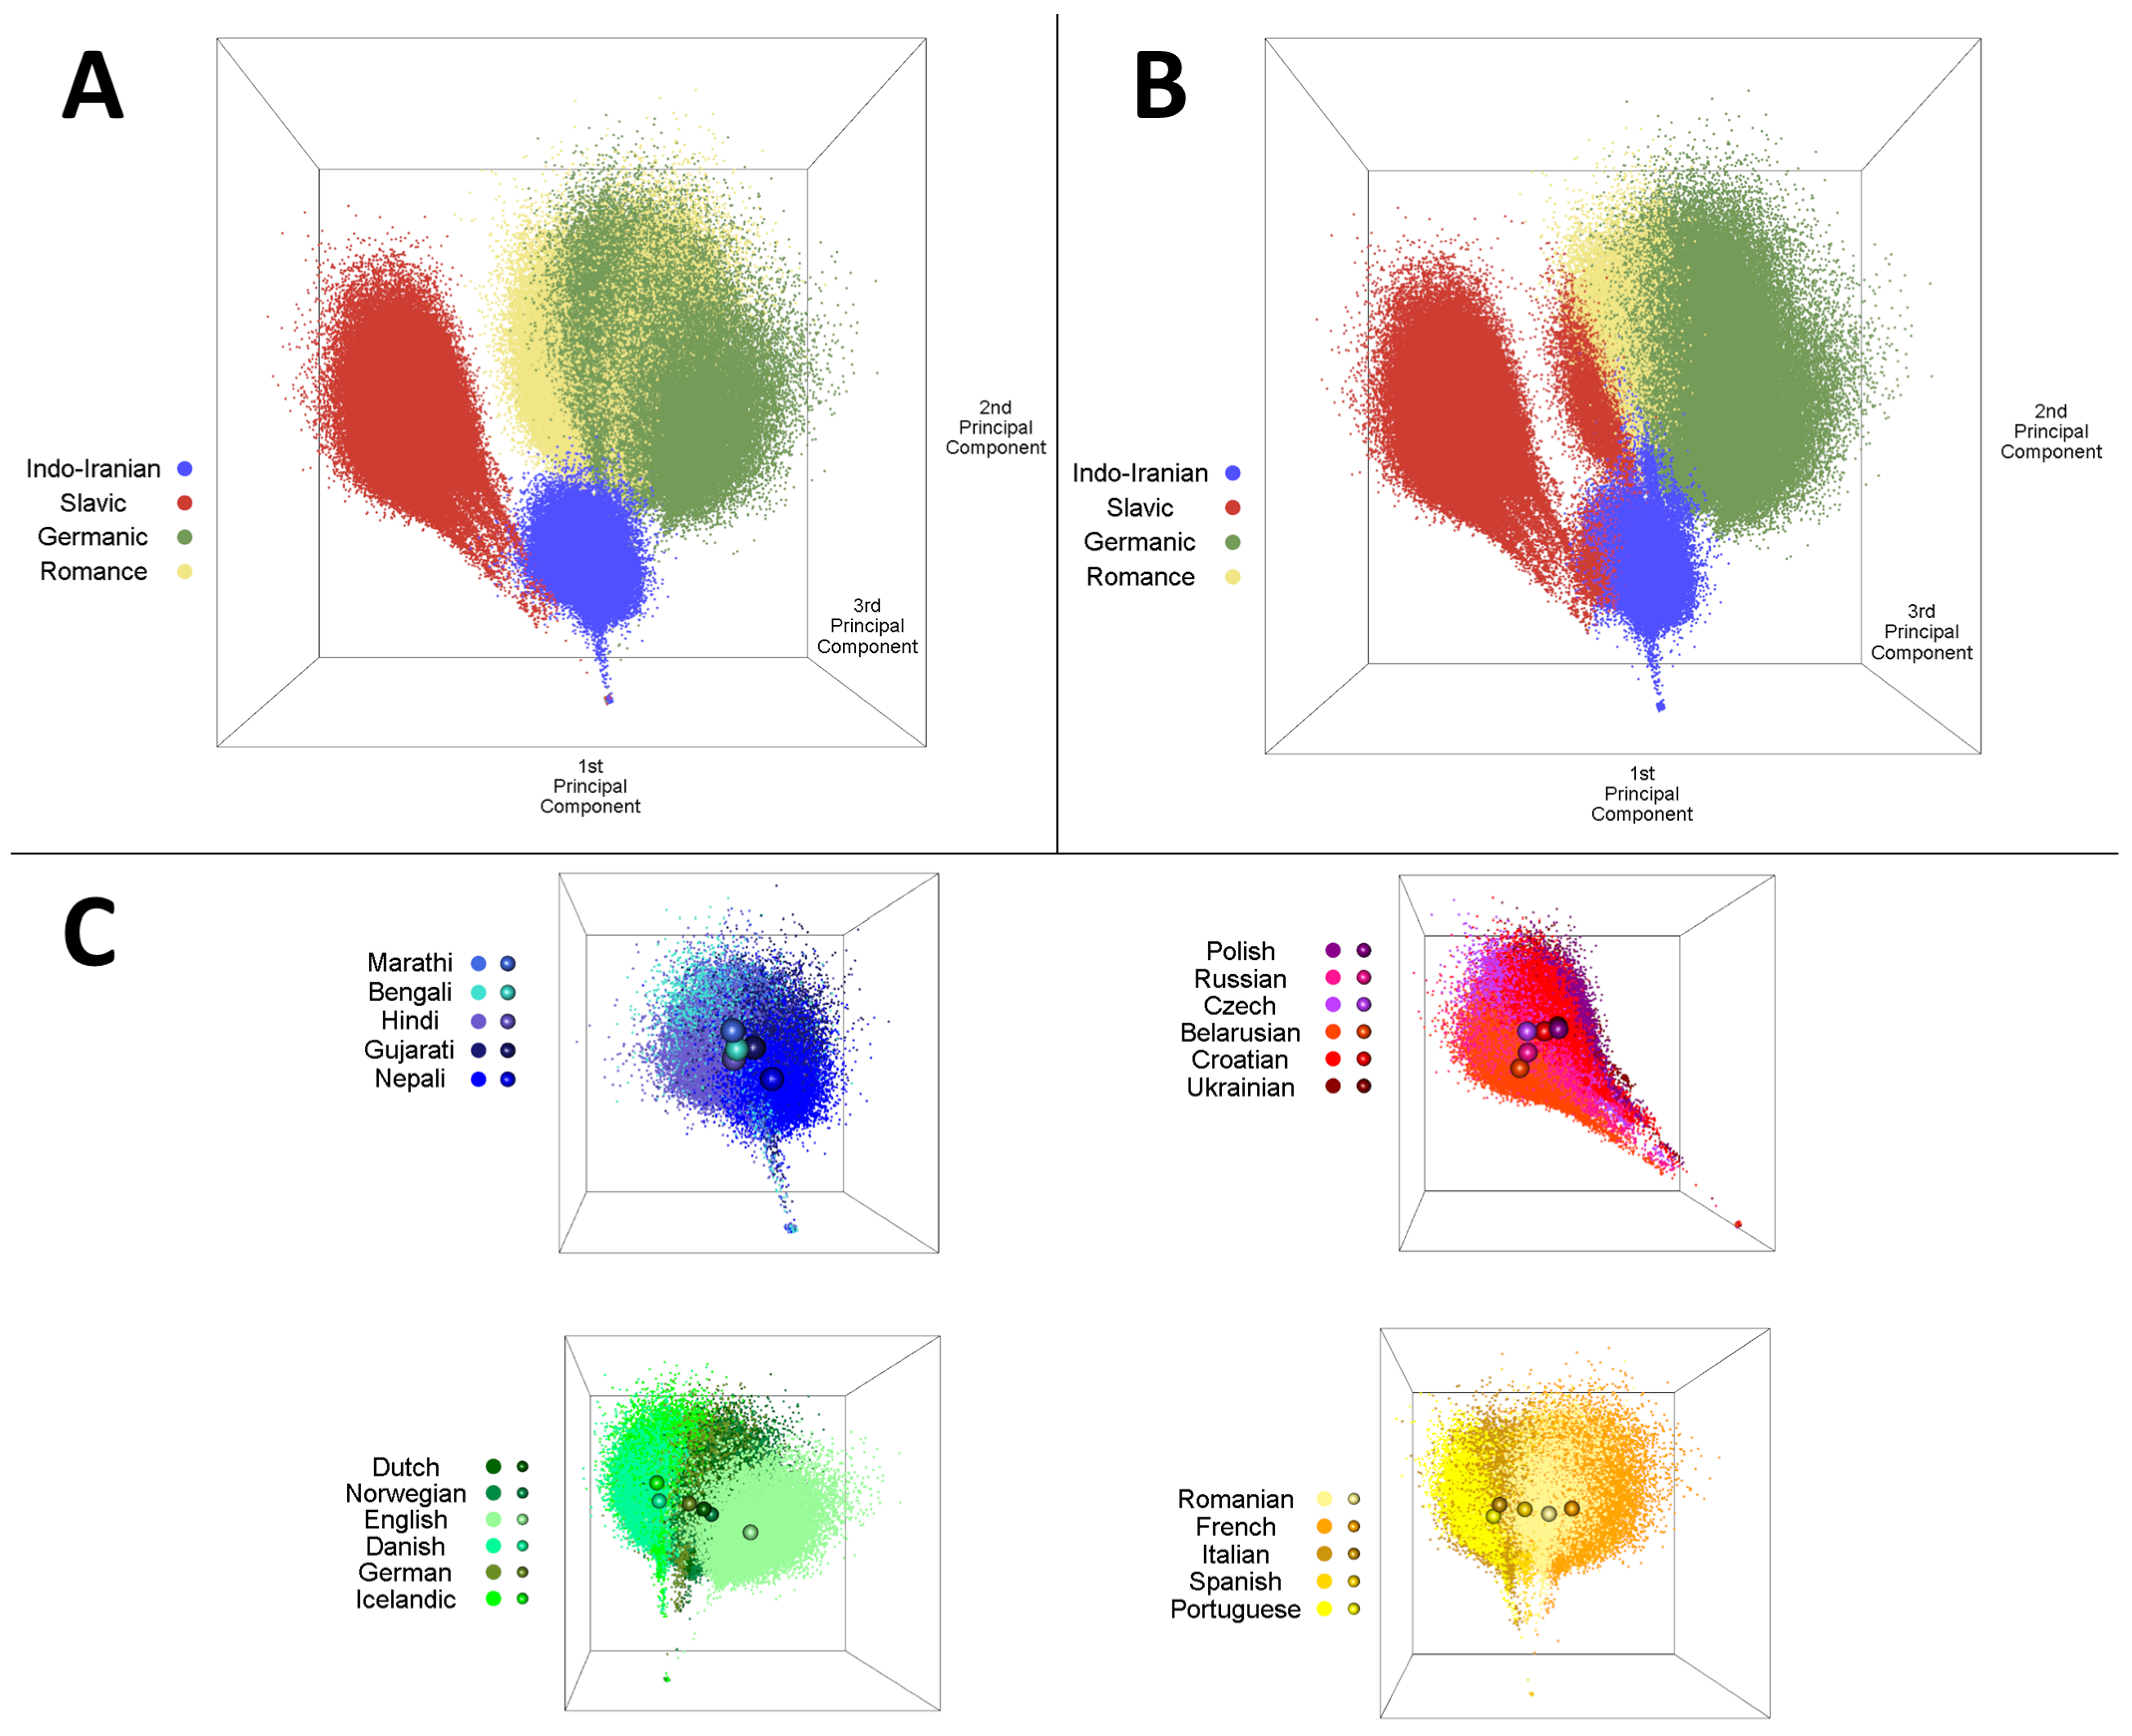
To visualize these results, PCA was run on the verse vector dataset, and the first three principal components for each verse vector were plotted. Figure 11 shows three views of the verse vectors in PCA space: the ground-truth families (Figure 11A), DEC clusters (Figure 11B), and the languages within each ground-truth family (Figure 11C). Figure 11A show that the Indo-Iranian and Slavic verse vectors are clearly separated from the other families; however, the Germanic and Romance vectors intermingle, which coincides with the Germanic–Romance confusion in the results for all three methods. Figure 11B provides another view of the DEC confusion matrix. All Slavic vectors are correct, but the Slavic cluster also encompasses a portion of the Romance and Indo-Iranian vectors; the remaining Indo-Iranian vectors are correct, but the Indo-Iranian cluster also encompasses a portion of the Germanic and Romance vectors. The Romance vectors are the most skewed, with portions being annexed by the other three clusters.
Figure 11C demonstrates that although the language verse vectors intermingle within their families, there is reasonable separation between them, as evidenced by the distribution of language centroids within each family. The proximity of some pairs of language centroids matches sibling languages in the centroid tree discussed previously, such as Icelandic and Danish. The position of Icelandic/Danish in the Germanic cluster is in an area of strong overlap with the Romance cluster, which explains why they were classified as Romance by the centroid clustering method.
4. Discussion
By introducing document vectors to the task of language similarity and clustering, we obtained sensible language family trees and demonstrated that document vectors can be used to extract relevant linguistic features from texts. We also compiled a multilingual, parallel dataset which could be useful for benchmarking. The best performance on clustering metrics was obtained by our novel network-based method, which creates a node-corresponded network for each language and compares their partitions using NMI. While it is well known that the Doc2Vec method can represent and distinguish the topics of documents [20], by controlling for the content of our text corpus across languages, we show that they can capture linguistic differences even when the semantic content is the same.
In contrast to some previous work, this approach is language-agnostic; it does not require any domain knowledge of specific language features, such as grammar (parts of speech, function words) or vocabulary (word meanings, word spellings, transliteration). Differences in the spelling of cognates between languages have been used to assay language similarity [5,6], but the document vector training algorithm operates at and above the token level; it does not leverage any information about spelling other than to identify a specific sequence of characters as a unique token, and thus does not require transliteration of texts with different alphabets. This could allow for the similarity analysis of languages such as Chinese or Japanese, which do not historically use an alphabet but can be Romanized using systems like Pinyin.
Learned representations of words and sentences have been used to study linguistic phenomena in more recent papers [41,42]. Beinborn and Choenni [41] investigate multilingual semantic drift, which is the variation in how concepts are organized between languages. Chowdhury et al. [42] use graph distance measures on networks generated from word vectors to detect source language interference, a topic investigated previously by Nagata and Whittaker [3] and Rabinovich et al. [4]. In contrast, the provenance of the Bibles in our text corpus is unknown. While the Old Testament was originally written in Hebrew and the New Testament in Greek, each language’s Bible may have taken a longer path, being translated through multiple source languages before reaching its final form. Regardless, our focus was on constructing an Indo-European language phylogeny, and our methods were able to discern relationships between the target languages in spite of any possible source language interference.
A direct comparison of clustering performance can be made between our results and those of related work; for papers that provided their generated phylogenetic trees, the metrics of precision, recall, and F-score can be computed for each family. (Nagata and Rabinovich did not investigate Indo-Iranian languages. Zhao separated the Indian and Iranian families but only included one language from each; so, we combined them for this comparison.) Crawford [6] achieved perfect scores of 1.000 for all metrics, which is unsurprising as their methodology is very similar to that of Serva and Petroni [5], whose results were used as the ground truth in this paper; the only major difference was the specific edit distance used. Nagata and Whittaker [3] also achieved scores of 1.000 on their set of languages, though their set of languages was smaller, with three Romance languages, four Germanic languages, and four Slavic languages. The best-performing method (tree-to-tree patterns) in Zhao et al. [7] achieved perfect scores, with the other methods being mixed; like Nagata, their set of languages was relatively small at 10 languages, with only 1 Germanic language and 2 Indo-Iranian languages. The family-level clustering is suboptimal, as the Germanic/Slavic and Romance/Indo-Iranian families are merged; this transposition is comparable to our centroid clustering method, but the network partitioning method merges families in the correct order. Rabinovich et al. [4] used a larger set of 17 languages and achieved results comparable to ours, with their English translation tree yielding Slavic/Germanic/Romance F-scores of 0.875/1.000/0.750; this outperforms the centroid clustering method (1.000/0.727/0.727) and DEC method (0.927/0.726/0.453) on the Germanic and Romance families but underperforms the network partitioning method on the Slavic and Romance families (1.000/0.923/0.889).
All three methods exhibited common traits upon evaluation. Languages from the Indo-Iranian and Slavic families were consistently grouped correctly, and most confusion was found between the Germanic and Romance languages. This is likely due to the close relationship between the Germanic and Romance families and has affected previous work, such as Rabinovich’s identification of source languages from translated texts [4]. The main difference in performance between methods is a result of how well they separated the Germanic and Romance families; network partitioning misclassified a single Romance language as Germanic, while centroid clustering switched two Germanic languages out for a Romance language. (In both cases, the misclassified Romance language was French.) DEC performed the worst job of distinguishing between the Germanic and Romance families, with the largest portion of Romance verse vectors being assigned to the predominantly Germanic cluster. This is reflected in the relatively low recall and F-scores for the Romance family. In addition, while network partitioning and centroid clustering perfectly separated the Indo-Iranian and Slavic languages, DEC also made some misclassifications there, with roughly 10% of Indo-Iranian vectors being assigned to the predominantly Slavic cluster.
Network partitioning best captures both the larger-scale relationships between families, as well as the smaller-scale relationships between languages. The phylogenetic trees in Figure 8 and Figure 9 show that network partitioning merges language families in the same order as the ground truth, while centroid clustering incorrectly considers Indo-Iranian to be more similar to Germanic and Romance, with Slavic being the most distant family. The intrafamily arrangements of the network partitioning tree more closely fit the ground truth, as evidenced by the close connections between Marathi/Gujarati, Norwegian/Danish, and Portuguese/Spanish, as well as Ukrainian/Belarusian/Russian. This contrasts with the centroid clustering tree, which more readily permutes the language relationships within each family.
In terms of processing time and efficiency, the centroid clustering method is the fastest and least complex of the three methods. The most complex step is computing the centroid of each set of vectors, but this is where n is the number of vectors and d is their dimensionality (24,186 and 128, respectively, for our dataset). For our implementation, loading the vector dataset into memory takes longer than computing the centroids and clustering them. In contrast, the network partitioning method requires several intermediate steps to obtain a language distance matrix from the vector dataset: first, each language’s set of vectors is converted to a network via kNN, then each network is partitioned into communities using the Louvain method, and finally, the NMI is computed between pairs of partitions to obtain a language distance matrix. With cuGraph, the partitioning can be performed on a GPU, but this portion alone takes longer than the entire centroid clustering method.
At the other end of the spectrum, DEC is arguably the most compute-intensive method. It necessitates training a deep neural network with 1,337,050 parameters, and a GPU is essentially required to obtain timely results. Another drawback is that it can only provide clustering but not a phylogenetic tree; however, a hybrid approach could be to use the autoencoder to generate feature mappings for centroid clustering. It does have two major advantages over the other methods, which are the affordance of batch processing of the vectors and finer-grained clustering of vectors rather than languages.
As described in this paper, the dataset consists of parallel translations with matched sections of roughly a few sentences each. However, one could train vectors on longer documents, such as chapters or books of the Bible; in addition to reducing processing time, this would simplify the correspondence of sections of text across languages and enable the use of a larger portion of the text corpus—recall that many chapters, and even entire languages, were discarded due to matching quality issues. Centroid clustering and DEC could be performed without identical, matched document sets across all languages, though we enforced this for consistency of evaluation with the network partitioning method (which requires matched document sets). A potentially fruitful avenue for future work would be to explore the relaxation of these requirements and how they affect the performance of our methods.
Other directions for future work involve the application of these methods to broader datasets and problems. If translations can be acquired, the relationships between languages in other families can be estimated, such as Uralic, Austronesian, or Sino-Tibetan languages. More broadly, the general structure of our methods enable the comparison and clustering of sets of document vectors. This implies that they could be used to analyze the semantic organization of documents; for example, if one had a collection of essays on the same topic, each essay could be used to train a set of document vectors, and the essays could be clustered using our methods.
5. Conclusions
We described three methods for analyzing language similarities which can be used to build phylogenetic trees and cluster languages: hierarchical clustering of language centroids, language network partitioning, and Deep Embedded Clustering. These methods operate on document vectors, which are learned representations, and do not require the extraction of predetermined linguistic features. Testing and evaluation was performed using a multilingual corpus of Bibles; each language’s Bible was segmented into short, matched sections of translated text, and these sections were used to train the document vectors for each language. While the network-based method yielded the best clustering results, all three methods performed well, and this demonstrated that document vectors can encode relevant linguistic features.
While we investigated similarities between Indo-European languages, further analysis can be conducted using languages from other families. In addition, work can be carried out to enhance the applicability of our methods by investigating their performance on longer documents, as well as nonmatched document sets with differences in representation between languages.
Author Contributions
Conceptualization, E.G.; methodology, E.G. and S.R.S.; software, S.R.S.; validation, S.R.S.; investigation, S.R.S.; resources, E.G.; data curation, S.R.S.; writing—original draft preparation, S.R.S.; writing—review and editing, E.G. and S.R.S.; visualization, S.R.S.; supervision, E.G.; project administration, E.G. All authors have read and agreed to the published version of the manuscript.
Funding
This research received no external funding.
Institutional Review Board Statement
Not applicable.
Informed Consent Statement
Not applicable.
Data Availability Statement
The data presented in this study and code implementing the described methods will be available on the author’s website.
Conflicts of Interest
The authors declare no conflict of interest.
Abbreviations
The following abbreviations are used in this manuscript:
| DEC | Deep Embedded Clustering |
| POS | Part-of-Speech |
| LSTM | Long Short-Term Memory |
| NLP | Natural Language Processing |
| kNNs | K-Nearest Neighbors |
| NMI | Normalized Mutual Information |
| DM | Distributed Memory |
| DBOW | Distributed Bag of Words |
| PCA | Principal Component Analysis |
| KNC | Known Node-Correspondence |
| KL Divergence | Kullback–Leibler Divergence |
| SGD | Stochastic Gradient Descent |
| CDF | Cumulative Distribution Function |
References
- Jasonoff, J.H.; Cowgill, W. Indo-European Languages|Definition, Map, Characteristics, & Facts|Britannica. Available online: https://www.britannica.com/topic/Indo-European-languages/ (accessed on 24 July 2023).
- Gray, R.D.; Atkinson, Q.D. Language-tree divergence times support the Anatolian theory of Indo-European origin. Nature 2003, 426, 435–439. [Google Scholar] [CrossRef]
- Nagata, R.; Whittaker, E. Reconstructing an Indo-European family tree from non-native English texts. In Proceedings of the 51st Annual Meeting of the Association for Computational Linguistics, Sofia, Bulgaria, 4–9 August 2013; Volume 1: Long Papers, pp. 1137–1147. [Google Scholar]
- Rabinovich, E.; Ordan, N.; Wintner, S. Found in Translation: Reconstructing Phylogenetic Language Trees from Translations. In Proceedings of the 55th Annual Meeting of the Association for Computational Linguistics, Vancouver, BC, Canada, 30 July–4 August 2017; Volume 1: Long Papers, pp. 530–540. [Google Scholar] [CrossRef]
- Serva, M.; Petroni, F. Indo-European languages tree by Levenshtein distance. EPL 2008, 81, 68005. [Google Scholar] [CrossRef]
- Crawford, D. Language Family Analysis and Geocomputation. Bachelor’s Thesis, University of Pittsburgh, Pittsburgh, PA, USA, 2020. [Google Scholar]
- Zhao, Y.; Sun, W.; Wan, X. Constructing a Family Tree of Ten Indo-European Languages with Delexicalized Cross-linguistic Transfer Patterns. arXiv 2020, arXiv:2007.09076. [Google Scholar]
- Petroni, F.; Serva, M. Language distance and tree reconstruction. J. Stat. Mech. Theory Exp. 2008, 2008, P08012. [Google Scholar] [CrossRef]
- Wu, P.; Zhong, Y.; Black, A.W. Automatically Identifying Language Family from Acoustic Examples in Low Resource Scenarios. arXiv 2020, arXiv:2012.00876. [Google Scholar]
- Johnson, M.P. eBible: Bible Translations|Bible List. Available online: https://ebible.org/download.php (accessed on 13 June 2023).
- WordProject. WordProject Bibles Index—Choose the Bible in Your Own Language. Available online: https://www.wordproject.org/bibles/index.htm (accessed on 21 February 2023).
- Bader, B.W.; Kegelmeyer, W.P.; Chew, P.A. Multilingual Sentiment Analysis Using Latent Semantic Indexing and Machine Learning. In Proceedings of the 2011 IEEE 11th International Conference on Data Mining Workshops, Vancouver, BC, Canada, 11 December 2011; pp. 45–52. [Google Scholar] [CrossRef]
- Östling, R.; Tiedemann, J. Continuous multilinguality with language vectors. In Proceedings of the 15th Conference of the European Chapter of the Association for Computational Linguistics, Valencia, Spain, 3–7 April 2017; Volume 2, Short Papers, pp. 644–649. [Google Scholar] [CrossRef]
- Malaviya, C.; Neubig, G.; Littell, P. Learning Language Representations for Typology Prediction. In Proceedings of the 2017 Conference on Empirical Methods in Natural Language Processing, Copenhagen, Denmark, 7–11 September 2017; pp. 2529–2535. [Google Scholar] [CrossRef]
- Koehn, P. Europarl: A Parallel Corpus for Statistical Machine Translation. In Proceedings of the Machine Translation Summit X: Papers, Phuket, Thailand, 13–15 September 2005; pp. 79–86. [Google Scholar]
- Granger, S.; Dagneaux, E.; Meunier, F.; Paquot, M. International Corpus of Learner English v2; Presses universitaires de Louvain: Louvain-la-Neuve, Belgium, 2009. [Google Scholar]
- Wycliffe Global Alliance. 2022 Global Scripture Access. 2022. Available online: https://www.wycliffe.net/resources/statistics/ (accessed on 24 July 2023).
- Rabinovich, E.; Wintner, S.; Lewinsohn, O.L. A parallel corpus of translationese. In Proceedings of the Computational Linguistics and Intelligent Text Processing: 17th International Conference, CICLing 2016, Konya, Turkey, 3–9 April 2016; Revised Selected Papers, Part II. pp. 140–155. [Google Scholar]
- Le, Q.; Mikolov, T. Distributed Representations of Sentences and Documents. In Proceedings of the 31st International Conference on Machine Learning, Bejing, China, 22–24 June 2014; Xing, E.P., Jebara, T., Eds.; Proceedings of Machine Learning Research. JMLR: Cambridge, MA, USA, 2014; Volume 32, pp. 1188–1196. [Google Scholar]
- Dai, A.M.; Olah, C.; Le, Q.V. Document Embedding with Paragraph Vectors. arXiv 2015, arXiv:1507.07998. [Google Scholar]
- Mikolov, T.; Sutskever, I.; Chen, K.; Corrado, G.S.; Dean, J. Distributed representations of words and phrases and their compositionality. Adv. Neural Inf. Process. 2013, 26, 3111–3119. [Google Scholar]
- Rehurek, R.; Sojka, P. Gensim–Python Framework for Vector Space Modelling; NLP Centre, Faculty of Informatics, Masaryk University: Brno, Czech Republic, 2011; Volume 3, p. 2. [Google Scholar]
- Rossiello, G.; Basile, P.; Semeraro, G. Centroid-based text summarization through compositionality of word embeddings. In Proceedings of the MultiLing 2017 Workshop on Summarization and Summary Evaluation across Source Types and Genres, Valencia, Spain, 3 April 2017; pp. 12–21. [Google Scholar] [CrossRef]
- Radev, D.R.; Jing, H.; Styś, M.; Tam, D. Centroid-based summarization of multiple documents. Inf. Process. Manag. 2004, 40, 919–938. [Google Scholar] [CrossRef]
- Ward, J.H., Jr. Hierarchical Grouping to Optimize an Objective Function. J. Am. Stat. Assoc. 1963, 58, 236–244. [Google Scholar] [CrossRef]
- Tantardini, M.; Ieva, F.; Tajoli, L.; Piccardi, C. Comparing methods for comparing networks. Sci. Rep. 2019, 9, 17557. [Google Scholar] [CrossRef]
- Newman, M.E.J.; Girvan, M. Finding and evaluating community structure in networks. Phys. Rev. E 2004, 69, 026113. [Google Scholar] [CrossRef]
- Blondel, V.D.; Guillaume, J.L.; Lambiotte, R.; Lefebvre, E. Fast unfolding of communities in large networks. J. Stat. Mech. Theory Exp. 2008, 2008, P10008. [Google Scholar] [CrossRef]
- RAPIDS Development Team. RAPIDS: Libraries for End to End GPU Data Science. 2023. Available online: https://rapids.ai (accessed on 24 July 2023).
- Strehl, A.; Ghosh, J. Cluster ensembles—A knowledge reuse framework for combining multiple partitions. J. Mach. Learn. Res. 2002, 3, 583–617. [Google Scholar] [CrossRef]
- Cover, T.M.; Thomas, J.A. Elements of Information Theory (Wiley Series in Telecommunications and Signal Processing); Wiley-Interscience: Hoboken, NJ, USA, 2006. [Google Scholar]
- Xie, J.; Girshick, R.; Farhadi, A. Unsupervised deep embedding for clustering analysis. In Proceedings of the International Conference on Machine Learning, New York, NY, USA, 19–24 June 2016; pp. 478–487. [Google Scholar]
- Guo, X. Keras Implementation for Deep Embedding Clustering (DEC). Available online: https://github.com/XifengGuo/DEC-keras/commit/2438070110b17b4fb9bc408c11d776fc1bd1bd56 (accessed on 18 April 2023).
- Robinson, D.F.; Foulds, L.R. Comparison of phylogenetic trees. Math. Biosci. 1981, 53, 131–147. [Google Scholar] [CrossRef]
- Kuhner, M.K.; Felsenstein, J. A simulation comparison of phylogeny algorithms under equal and unequal evolutionary rates. Mol. Biol. Evol. 1994, 11, 459–468. [Google Scholar] [CrossRef]
- Steel, M.A.; Penny, D. Distributions of Tree Comparison Metrics—Some New Results. Syst. Biol. 1993, 42, 126–141. [Google Scholar] [CrossRef]
- Schliep, K. Phangorn: Phylogenetic analysis in R. Bioinformatics 2011, 27, 592–593. [Google Scholar] [CrossRef] [PubMed]
- Kuhn, H.W. The Hungarian method for the assignment problem. Nav. Res. Logist. Q. 1955, 2, 83–97. [Google Scholar] [CrossRef]
- Gultepe, E.; Makrehchi, M. Improving clustering performance using independent component analysis and unsupervised feature learning. Hum. Cent. Comput. Inf. Sci. 2018, 8, 25. [Google Scholar] [CrossRef]
- Gultepe, E.; Conturo, T.E.; Makrehchi, M. Predicting and grouping digitized paintings by style using unsupervised feature learning. J. Cult. Herit 2018, 31, 13–23. [Google Scholar] [CrossRef]
- Beinborn, L.; Choenni, R. Semantic Drift in Multilingual Representations. Comput. Linguist. Assoc. Comput. Linguist. 2020, 46, 571–603. [Google Scholar] [CrossRef]
- Dutta Chowdhury, K.; España-Bonet, C.; van Genabith, J. Tracing Source Language Interference in Translation with Graph-Isomorphism Measures. In Proceedings of the International Conference on Recent Advances in Natural Language Processing (RANLP 2021), Online, 1–3 September 2021; pp. 375–385. [Google Scholar] [CrossRef]
Figure 1.
Overall processing pipeline.

Figure 2.
Dataset processing pipeline using the English and German languages as an example. Processing for the other 20 languages is identical.
Figure 2.
Dataset processing pipeline using the English and German languages as an example. Processing for the other 20 languages is identical.

Figure 3.
Centroid clustering pipeline using the English and German languages as an example. Processing for the other 20 languages is identical; only the resulting centroids are shown here.
Figure 3.
Centroid clustering pipeline using the English and German languages as an example. Processing for the other 20 languages is identical; only the resulting centroids are shown here.

Figure 4.
Network partitioning pipeline using the English and German languages as an example. Processing for the other 20 languages is identical; only the resulting partitions are shown here.
Figure 4.
Network partitioning pipeline using the English and German languages as an example. Processing for the other 20 languages is identical; only the resulting partitions are shown here.

Figure 5.
Detailed view of community detection and partition comparison for Method B. The English network is shown before and after community detection. Its partition is compared with a German verse network partition obtained through identical processing. The resulting Normalized Mutual Information (NMI) measures the similarity between the English and German verse sets.

Figure 6.
The cumulative distribution function (CDF) for random NMIs used to verify statistical significance of language pair and family-to-family NMIs.
Figure 6.
The cumulative distribution function (CDF) for random NMIs used to verify statistical significance of language pair and family-to-family NMIs.

Figure 7.
The phylogenetic tree used as ground truth. Language families are highlighted by colored rectangles; these correspond to the family labels in Table 1 and are the true labels used for evaluating clustering results.
Figure 7.
The phylogenetic tree used as ground truth. Language families are highlighted by colored rectangles; these correspond to the family labels in Table 1 and are the true labels used for evaluating clustering results.

Figure 8.
The phylogenetic tree generated via centroid clustering. Language families are highlighted by colored rectangles; family labels are the “best fit” based on the true families of their members. Language labels are colored based on their ground-truth family.
Figure 8.
The phylogenetic tree generated via centroid clustering. Language families are highlighted by colored rectangles; family labels are the “best fit” based on the true families of their members. Language labels are colored based on their ground-truth family.

Figure 9.
The phylogenetic tree generated via network partitioning. Language families are highlighted by colored rectangles; family labels are the “best fit” based on the true families of their members. Language labels are colored based on their ground-truth family.
Figure 9.
The phylogenetic tree generated via network partitioning. Language families are highlighted by colored rectangles; family labels are the “best fit” based on the true families of their members. Language labels are colored based on their ground-truth family.

Figure 10.
Radar charts showing average family-to-family NMI for the network partitioning method. Each chart focuses on a specific language family; each point in the chart gives the average NMI between languages in the chart label family and languages in the point label family.
Figure 10.
Radar charts showing average family-to-family NMI for the network partitioning method. Each chart focuses on a specific language family; each point in the chart gives the average NMI between languages in the chart label family and languages in the point label family.

Figure 11.
Visualization of the verse vectors using Principal Component Analysis (PCA). Viewing angle is identical across panels: (A) Verse vectors colored based on their ground-truth family. (B) Verse vectors colored based on their DEC predicted family. (C) Verse vectors for each ground-truth family colored based on their language; the centroid of each language is marked with a sphere.


Table 1.
Our considered set of 22 Indo-European languages, organized by family.
| Family | Languages |
|---|---|
| Indo-Iranian | Bengali, Gujarati, Hindi, Marathi, Nepali |
| Slavic | Belarusian, Croatian, Czech, Polish, Russian, Ukrainian |
| Germanic | Danish, Dutch, English, German, Icelandic, Norwegian |
| Romance | French, Italian, Portuguese, Romanian, Spanish |
Table 2.
Confusion matrix for the centroid clustering method.
| Predicted Family | Actual Family | |||
|---|---|---|---|---|
| Indo-Iranian | Slavic | Germanic | Romance | |
| Indo-Iranian | 5 | 0 | 0 | 0 |
| Slavic | 0 | 6 | 0 | 0 |
| Germanic | 0 | 0 | 4 | 1 |
| Romance | 0 | 0 | 2 | 4 |
Table 3.
Clustering evaluation metrics for all three methods.
| Method | Family | Precision | Recall | F-Score |
|---|---|---|---|---|
| Centroid clustering | Indo-Iranian | 1.000 | 1.000 | 1.000 |
| Slavic | 1.000 | 1.000 | 1.000 | |
| Germanic | 0.800 | 0.667 | 0.727 | |
| Romance | 0.667 | 0.800 | 0.727 | |
| Network partitioning | Indo-Iranian | 1.000 | 1.000 | 1.000 |
| Slavic | 1.000 | 1.000 | 1.000 | |
| Germanic | 0.857 | 1.000 | 0.923 | |
| Romance | 1.000 | 0.800 | 0.889 | |
| Deep Embedded Clustering (DEC) | Indo-Iranian | 0.984 | 0.906 | 0.944 |
| Slavic | 0.864 | 0.999 | 0.927 | |
| Germanic | 0.643 | 0.834 | 0.726 | |
| Romance | 0.648 | 0.348 | 0.453 |
Table 4.
Confusion matrix for the network partitioning method.
| Predicted Family | Actual Family | |||
|---|---|---|---|---|
| Indo-Iranian | Slavic | Germanic | Romance | |
| Indo-Iranian | 5 | 0 | 0 | 0 |
| Slavic | 0 | 6 | 0 | 0 |
| Germanic | 0 | 0 | 6 | 1 |
| Romance | 0 | 0 | 0 | 4 |
Table 5.
Tree distances between generated trees and ground-truth tree. Lower values imply a closer fit.
Table 5.
Tree distances between generated trees and ground-truth tree. Lower values imply a closer fit.
| Method | Symmetric Distance | Branch Score Difference | Path Difference | Quadratic Path Difference |
|---|---|---|---|---|
| Network tree | 24.000 | 0.972 | 32.311 | 2.747 |
| Centroid tree | 30.000 | 0.526 | 32.078 | 4.114 |
| Random tree (mean) | 37.498 | 1.181 | 50.102 | 5.712 |
| Random tree (stdev) | 0.947 | 0.077 | 2.337 | 0.218 |
Table 6.
Confusion matrix for the for the Deep Embedded Clustering (DEC) method.
| Predicted Family | Actual Family | |||
|---|---|---|---|---|
| Indo-Iranian | Slavic | Germanic | Romance | |
| Indo-Iranian | 109,557 | 119 | 1001 | 639 |
| Slavic | 11,367 | 144,997 | 284 | 11,106 |
| Germanic | 5 | 0 | 121,026 | 67,149 |
| Romance | 1 | 0 | 22,805 | 42,036 |
Disclaimer/Publisher’s Note: The statements, opinions and data contained in all publications are solely those of the individual author(s) and contributor(s) and not of MDPI and/or the editor(s). MDPI and/or the editor(s) disclaim responsibility for any injury to people or property resulting from any ideas, methods, instructions or products referred to in the content. |
© 2023 by the authors. Licensee MDPI, Basel, Switzerland. This article is an open access article distributed under the terms and conditions of the Creative Commons Attribution (CC BY) license (https://creativecommons.org/licenses/by/4.0/).
Share and Cite
MDPI and ACS Style
Schrader, S.R.; Gultepe, E. Analyzing Indo-European Language Similarities Using Document Vectors. Informatics 2023, 10, 76. https://0-doi-org.brum.beds.ac.uk/10.3390/informatics10040076
AMA Style
Schrader SR, Gultepe E. Analyzing Indo-European Language Similarities Using Document Vectors. Informatics. 2023; 10(4):76. https://0-doi-org.brum.beds.ac.uk/10.3390/informatics10040076
Chicago/Turabian StyleSchrader, Samuel R., and Eren Gultepe. 2023. "Analyzing Indo-European Language Similarities Using Document Vectors" Informatics 10, no. 4: 76. https://0-doi-org.brum.beds.ac.uk/10.3390/informatics10040076
Note that from the first issue of 2016, this journal uses article numbers instead of page numbers. See further details here.