The Effects of Perceived Quality of Augmented Reality in Mobile Commerce—An Application of the Information Systems Success Model

Department of Business Administration, Duksung Women’s University, Seoul 01369, Korea
Informatics 2020, 7(2), 14; https://0-doi-org.brum.beds.ac.uk/10.3390/informatics7020014
Submission received: 20 April 2020
/
Revised: 8 May 2020
/
Accepted: 9 May 2020
/
Published: 15 May 2020
(This article belongs to the Section Human-Computer Interaction)
Abstract
:Augmented reality (AR) enables consumers to browse and try products virtually by providing additional information and functionality to mobile shopping. Retailers continue to develop AR technology to engage consumers and enhance their digital shopping experiences. However, despite the growing interest in this technology, consumers rarely rely on AR due to the quality of its content. This study applies an information systems success model to examine the antecedents that influence the adoption of mobile technology, specifically focusing on consumers’ perception of AR quality and its effect on perceived diagnosticity and consumer satisfaction when using AR technology. Moreover, the study examines how perceived diagnosticity and satisfaction influence loyalty. The study participants were 283 shoppers in Korea who have previously experienced mobile shopping, with data collected through an online survey. The results show that when using AR, (1) the consumer’s perceptions of information quality and visual quality positively influence perceived diagnosticity and satisfaction, (2) perceived diagnosticity positively influences satisfaction and (3) satisfaction positively influences loyalty. These results have practical implications for mobile retailers seeking to develop effective product presentation strategies using innovative technologies.
1. Introduction
According to eMarketer [1], total retail sales in the United States (US) are expected to reach US$5.62 trillion in 2020, of which m-commerce sales will account for US$304.86 billion (5.4%) and e-commerce sales will account for US$674.88 billion (12%). Moreover, both online and mobile commerce sales share of the market are expected to continue growing; total retail sales in the US are projected to be US$6.309 trillion in 2024, with m-commerce and e-commerce expected to represent 9.1% and 17.1% of total sales, respectively [1]. Approximately 46% of consumers use mobile shopping apps to seek product information and 40% of consumers use mobile shopping apps to make purchases [2].
With the rapid growth of digital commerce, the retail industry continues to apply new technology and, consequently, the term “retail 4.0” has emerged. Consumer demands for seamless omnichannel experiences have increased, and retailers rely on digital transformation for channel integration to satisfy consumer experiences at all touchpoints [3]. Augmented reality (AR) is one of the technologies that supports this process. AR refers to a technology that creates computer-generated images overlaying real objects in real-time [4]. When used in digital retailing, AR enables consumers to merge their online and offline experiences through a smartphone or a tablet. An example is Home Depot’s AR paint visualizer app, which enables consumers to use their smartphone camera to superimpose an overlay of color on a wall in their home. Using this technology, consumers can conceptualize how the new paint color will look without visiting the physical Home Depot store. AR creates a 3D artificial view by combining product images that are virtually displayed on the mobile app with real-world features [4], helping consumers to evaluate products before making a purchase. AR was ranked as one of the top 10 technology trends in 2019 and 2020 [3,5] and AR market is expected to reach US$75 billion in revenue by 2023 [6]. AR has been adopted in various industries, including retail, design and modeling, tourism, education and medical training [7] and is used in the retail industry most frequently through mobile apps [8].
Despite the growing interest in AR and the benefits to both consumers and digital retailers, problems with its quality remain. According to Shopify [9], 66% of digital consumers want to use AR technology when they browse products in mobile apps; however, AR technology has not reached its potential use due to lack of quality content, the technological gap between AR devices and inadequate design that does not provide sufficient product information [10,11,12]. Thus, digital retailers must understand and provide a level of quality that will enhance consumers’ digital shopping experiences. The current study provides a new approach to the innovative management of digital retailing by incorporating DeLone and McLean’s [13] information systems (IS) success model. In assessing predictors of IS success or effectiveness in the context of mobile retailing, this study aims to examine the effect of quality perception on loyalty through consumers’ perceived diagnosticity and satisfaction. The use of AR is in its infancy in digital retailing and the findings of this study provide insights to scholars and practitioners on the importance of perceived quality by applying a comprehensive and contemporary approach based on marketing, psychology and media studies.
1.1. Literature Review
1.1.1. The IS Success Model
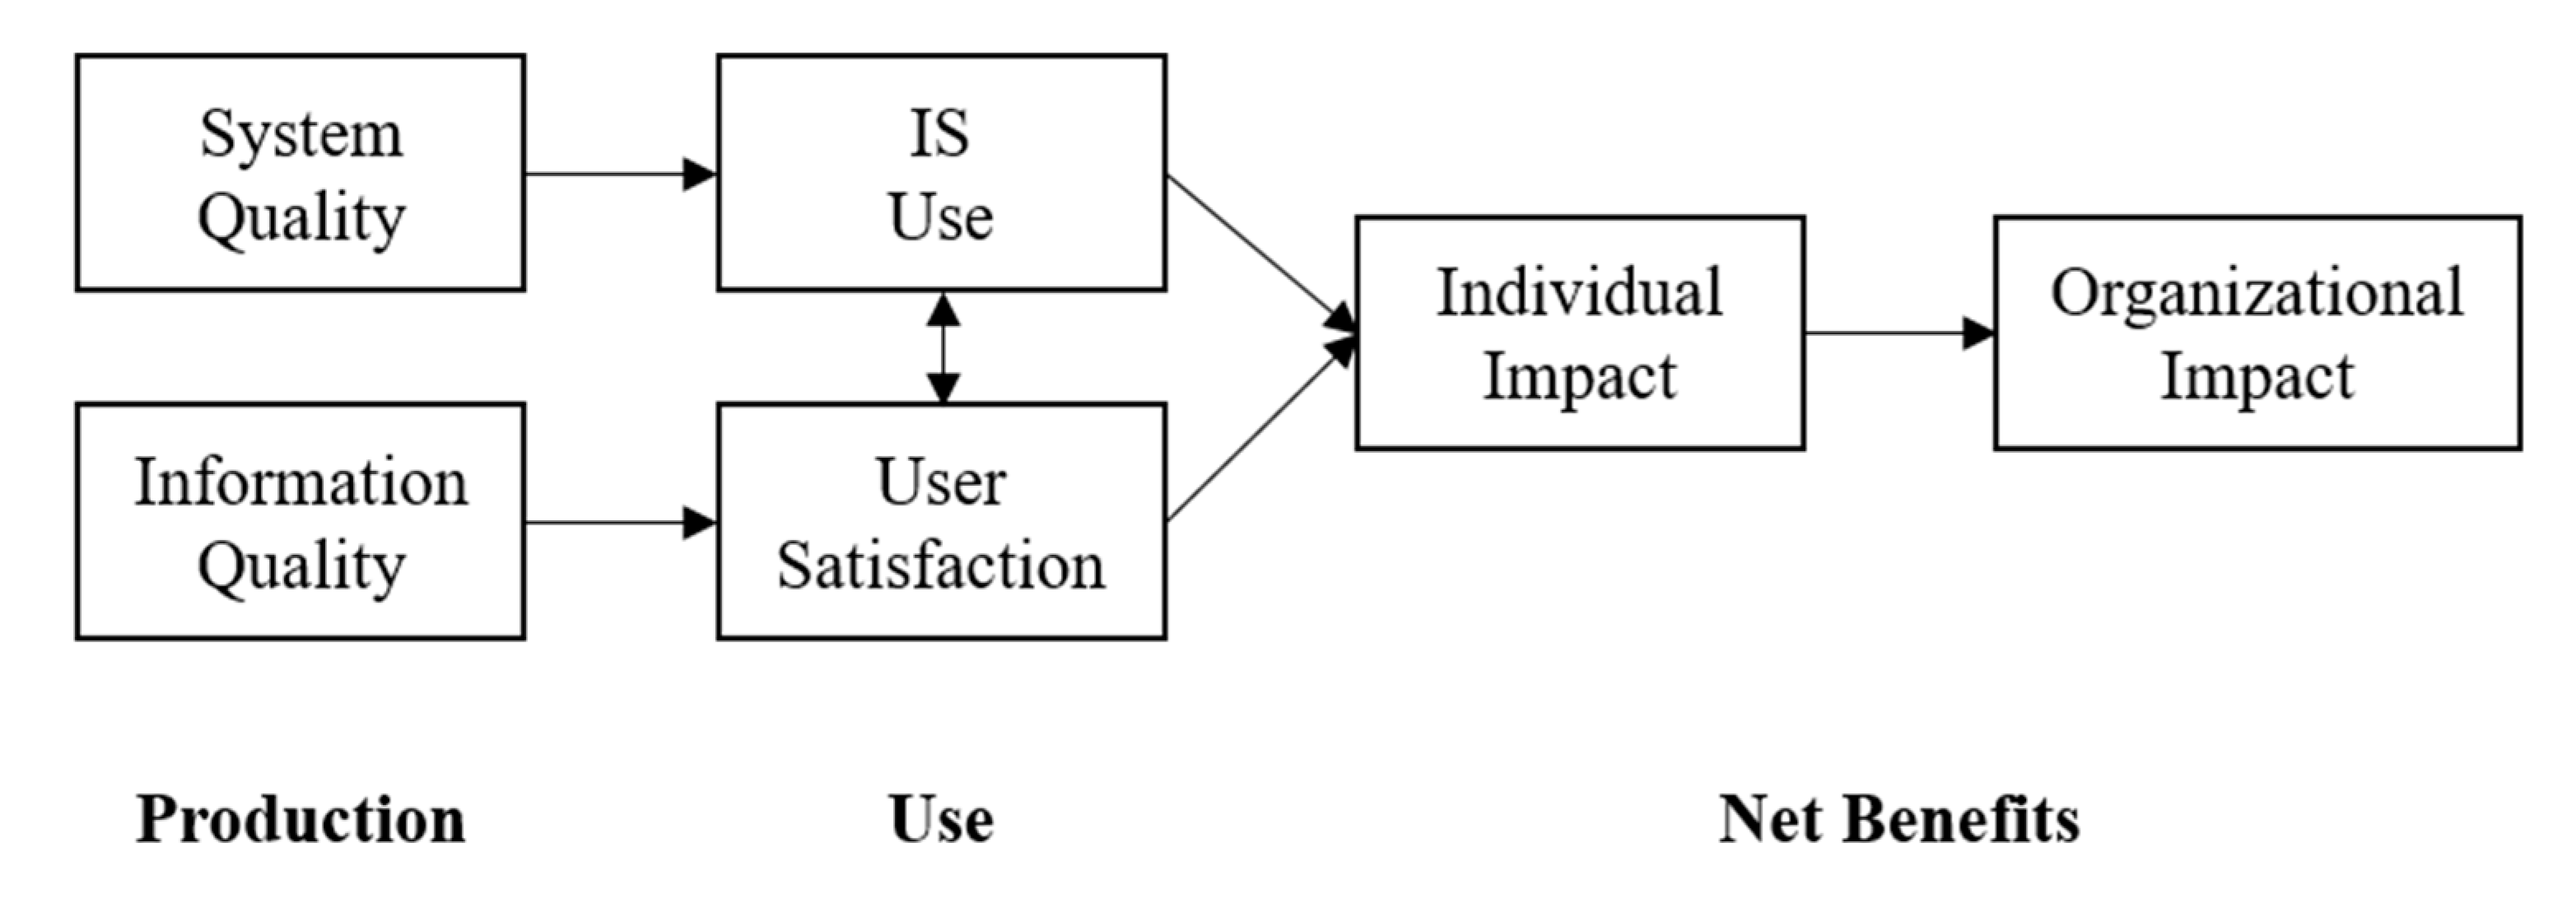
The IS success model [13] proposed six interrelated variables for understanding the success or effectiveness of IS (see Figure 1). The model provides a process to explain the production, use and net benefits of IS. An IS is created, containing varying levels of system and information quality (i.e., production). Consumers use features of the IS (i.e., use) and, based on their experiences, become either satisfied or dissatisfied with the IS (i.e., use), which influences individual or organizational productivity (i.e., net benefits). In addition to the process, the model further explains causal interdependencies among the six variables.
Seddon [14], proposed an alternative to DeLone and McLean’s model that focuses on causal relationships among the six variables. Seddon’s IS success model is based on three causal steps—measures of system and information quality, measures of perceptual net benefits of IS use (e.g., perceived usefulness, user satisfaction) and other measures of net benefits of IS use. Based on Seddon’s IS success model, DeLone and McLean [15] updated their IS success model, including “service quality” and “intention to use”, to adapt to the rapid growth of e-commerce. The model postulates that system quality, information quality and service quality influence the consumer’s intention to use and user satisfaction, which in turn positively influences net benefits.
Both the original DeLone and McLean IS success model [13] and the updated version [15] have been applied to examine the success of e-commerce [15,16]. The current study applies the updated DeLone and McLean IS success model and examines how perceived quality influences net benefits from a consumer perspective. Specifically, this study measures the perceived quality of AR technology used in mobile shopping and examines its impacts on the net benefits of IS use, such as perceived diagnosticity, satisfaction and loyalty.
1.1.2. The Perceived Quality of AR
Delone and Mclean [15] proposed three types of IS quality in the updated IS success model—system quality, information quality and service quality, and these three measures, evaluated by an individual’s perception, have been considered major predictors of the effectiveness of IS. System quality indicators are those that relate to the overall performance of the system, such as usability and reliability, while information quality is related to the content of the e-commerce websites, such as personalization, relevance, completeness and ease of understanding. Service quality reflects the level of assurance, empathy and responsiveness of the websites [13,15].
While DeLone and McLean [15] added service quality to their updated model, they argued that the inclusion is dependent on the type of system; that is, whether the system is a single IS or a whole IS. System quality and information quality are sufficient to measure the success of a single system; however, service quality should be included and is even the most significant among the three types of quality, to measure the overall success of the whole IS, such as the whole e-commerce system and the service provider. Accordingly, Lee and Chung [17] only measured system quality and information quality to evaluate the individual mobile banking system. Similarly, Zheng, Zhao and Stylianou [18] investigated the effects of information quality and system quality on consumer satisfaction and benefits in virtual communities. In their study, system quality reflected effective navigation without information overload, security to protect an individual’s privacy, the method of information presentation and interactivity with other users in the community. Information quality was measured differently from traditional IS and e-commerce websites because of its nature of virtual community, where users, who do not know each other, can express their opinions freely. Thus, information quality pertains to its reliability, relevance and objectivity of the contents.
From an AR technology perspective, system quality reflects the degree to which users can control the AR function in a mobile shopping app. AR helps consumers to shop efficiently by providing an image through the smartphone screen to allow the customer to virtually “try on” the product; therefore, the AR function must be fast, reliable and easy and convenient to use [17]. Poor system quality indicates an AR function that is difficult to use, unstable or slow to apply a product image to the consumer, which negatively affects the shopping experience. AR information quality relates to the accuracy, relevancy, personalization and ease of product information. The main disadvantage of digital shopping is the inability to inspect a product [19]; therefore, AR must provide sufficient information more efficiently to be effective. The third component of perceived quality, service quality, is associated with the effectiveness of the service provider, reflecting the role of customer service in e-commerce website management [15]. The current study focuses on the AR function itself rather than the holistic e-commerce system, following DeLone and McLean’s [15] argument; therefore, service quality is considered to be irrelevant and is excluded from the study model.
Previous researchers have proposed other types of perceived quality, such as interface design quality [17], the attractiveness of the website [20,21] and visual quality [22], to evaluate the e-commerce system. Visual quality refers to the realistic and concrete presentation of visual information and a high level of visual quality helps consumers to understand product information more clearly [22]. Similarly, interface design quality focuses on visual graphics and the presentation style of mobile apps [17]. Kim and Hyun [23] examined the AR service quality of a location-based mobile app, following DeLone and McLean’s updated model [15] and included, among other factors, the visual appearance of the application, indicating the need to include visual quality as a dimension of perceived quality.
As several previous studies have emphasized the importance of visual presentation of online and mobile websites [19,24], the ability of AR to provide a realistic and clear visual image of a product through a smartphone is likely to be an important aspect of mobile shopping. Furthermore, compared to traditional Internet shopping, consumers rely on information provided on a small mobile screen for their shopping, where visual quality is critical. Therefore, the current study also considers visual quality as a key dimension of perceived quality. In sum, system quality, information quality and visual quality are measured in this study and defined as follows—(1) system quality is the degree to which the AR function is fast, reliable and convenient to use, (2) information quality indicates how product information is organized in terms of accuracy, relevancy and personalization and (3) visual quality reflects appealing visual graphics and a clear and concrete presentation of the product.
1.1.3. Perceived Quality and Perceived Diagnosticity
Perceived diagnosticity refers to “the extent to which consumers believe the shopping experience is helpful to evaluate products” [25] (p. 113). Kempf [26] introduced the concept of perceived diagnosticity to examine the use of direct product experience in evaluating product attributes. Later, Jiang and Benbasat [25] adopted this concept to virtual environments; in an e-commerce system, perceived diagnosticity indicates the ability of the Web interface to deliver product information that helps consumers to evaluate the products available online. Visual and functional controls in online shopping malls are used to manipulate the Web interface. Consumers can experience visual control when they change product colors by clicking on sample color images or when they enlarge a product image by clicking on the plus button (+) shown on a product image. Consumers can experience functional control through product trial options available on the website; for example, when shopping for a sports watch, consumers can try the alarm, stopwatch and night light functions by clicking on trial buttons on the website to learn how these functions work. According to Jiang and Benbasat [25], when compared to regular websites in which product information is displayed only with static images and plain text, consumers perceive higher diagnosticity in websites implementing such visual and functional control features because these features help consumers to evaluate the products. Similarly, if a mobile shopping app provides AR technology, consumers will perceive higher diagnosticity because they can control the visual and functional features of a product virtually.
Although the use of AR can increase consumers’ perceived diagnosticity of the mobile environment, many mobile retailers do not provide a high-quality AR experience. For example, a cosmetics app with high-quality AR can accurately present eye shadow on a consumer’s face, while an app with poor-quality AR may not be able to provide an exact overlap between the eye shadow and the consumer’s eyes, which does not help the consumer with their purchase decision. According to Kim and Hyun [23], perceived quality positively influences usefulness, which refers to the degree to which consumers believe that using a system helps to enhance their performance [27]. In a mobile shopping context, usefulness is similar to the perceived diagnosticity of AR—that is; the degree to which consumers believe that AR technology helps in learning about a product or assists with the virtual shopping experience [25]. In an empirical study, Beemer and Gregg [28] measured perceived diagnosticity to examine consumers’ beliefs about the usefulness of information. Thus, perceived diagnosticity may be an important construct to measure IS effectiveness (i.e., the effectiveness of AR in this study) in the IS success model. Although no previous research has examined the relationship between perceived quality and perceived diagnosticity, it is reasonable to predict that the perceived quality of AR positively influences consumers’ perceived diagnosticity. While AR technology in mobile shopping apps can influence perceived diagnosticity by providing visual and functional control, the level of quality may mediate this influence. If consumers perceive the system quality, information quality and visual quality of AR to be high, they may perceive that the diagnosticity of AR is also high. Thus, the following hypotheses were developed:
Hypothesis 1 (H1).
Higher quality ((a) system quality, (b) information quality and (c) visual quality) will be positively associated with the perceived diagnosticity of AR for product evaluation.
1.1.4. Perceived Quality and Satisfaction
Satisfaction refers to the consumer’s psychological and emotional response after experiencing a product or service [29]. Product performance or service quality that exceeds a consumer’s initial expectation leads to satisfaction. Conversely, a consumer will be dissatisfied if their expectation exceeds the actual performance of the product or quality of the service [29]. Satisfaction reflects the degree to which consumers have positive feelings for a product or service. The link between perceived quality and satisfaction is well established in several research areas, such as tourism [30,31], retail [32,33,34], online banking [17] and communication [35]. Several empirical studies have confirmed that perceived quality is a significant antecedent of consumer satisfaction. In the context of mobile shopping, high-quality AR technology facilitates efficient decision-making by providing a more realistic view of a product’s features without the requirement for direct inspection [24], which increases the consumer’s satisfaction. Thus, this study hypothesizes that a higher quality of AR technology induces greater satisfaction.
Hypothesis 2 (H2).
Higher quality ((a) system quality, (b) information quality and (c) visual quality) will be positively associated with consumer satisfaction with a mobile shopping app.
1.1.5. Perceived Diagnosticity and Satisfaction
The relationship between perceived diagnosticity and satisfaction has not been directly examined in previous studies; however, research has confirmed that as consumers perceive higher diagnosticity when evaluating a product, they are more likely to have positive attitudes toward a product, a brand or a website [26,36]. Some researchers have argued that attitude and satisfaction are synonymous as they are both categorized as affect factors [37]. However, other researchers have identified differences between these two constructs. For example, Oliver [29] suggested that satisfaction occurs prior to post-purchase attitude. Thus, satisfaction is experience-specific, while attitude is a culmination of all prior experiences. The current study investigates the effects of AR quality in a mobile shopping app, which pertains to the experience-specific effect rather than the enduring effect of the product or the mobile shopping app. Thus, it is reasonable to hypothesize that if a consumer perceives higher diagnosticity, they will be more satisfied with the mobile shopping app. Therefore, the following hypothesis was developed.
Hypothesis 3 (H3).
A Higher level of perceived diagnosticity will be positively associated with satisfaction with a mobile shopping app.
1.1.6. Loyalty Toward a Mobile Shopping App
Customer loyalty is divided into two perspectives—behavioral and attitudinal. The behavioral perspective reflects repeat purchasing behaviors, whereas the attitudinal perspective pertains to a favorable attitude toward a retailer and is often measured by brand recommendation, brand preference, commitment and behavioral intent [38]. According to previous research findings, loyal consumers are more likely to recommend a brand to others [39], repurchase a product in that brand [40] and pay a premium price [41]. Furthermore, loyal consumers are less likely to switch to other brands, even if other brands offer superior products [41] and are less likely to be influenced by negative information about the product or service [42]. Consequently, building consumer loyalty is important for mobile retailers to achieve a competitive advantage. The current study focuses on the attitudinal perspective and operationalized loyalty as the willingness to purchase a product, the willingness to recommend a mobile shopping app to others and the willingness to patronize the mobile app.
According to DeLone and McLean [43], loyalty can be measured to identify the net benefits of the IS success model. Loyalty toward a mobile shopping app may be increased if consumers have a higher perceived diagnosticity through using the AR function. In an online shopping context, Wang and Chang [44] empirically tested the relationship between perceived diagnosticity and purchase intention based on the stimulus-organism-response model [45], holding that environmental stimuli influence consumers’ affective or cognitive states (i.e., perceived diagnosticity), which in turn influence positive or negative responses (i.e., purchase intention). The finding revealed that if consumers perceive higher diagnosticity when making a purchase decision, they are more likely to have greater purchase intentions due to effective product evaluation. Likewise, a higher perceived diagnosticity (i.e., organism) due to a high-quality AR function (i.e., stimulus) offered by the mobile shopping app may lead to greater loyalty (i.e., response) toward the mobile app because consumers do not need to visit physical stores to assess product features. Subsequently, consumers will tend to use the mobile app more frequently, recommend it to their friends and use it to buy products. Although no previous research examines a positive relationship between perceived diagnosticity and loyalty, it is reasonable to hypothesize that perceived diagnosticity through using AR will increase loyalty toward a mobile shopping app.
Hypothesis 4 (H4).
A Higher level of perceived diagnosticity will be positively associated with loyalty toward a mobile shopping app.
Along with perceived diagnosticity, satisfaction is an important predictor of consumer loyalty. Sivadas and Baker-Prewitt [46] argued that customer loyalty is the final goal of satisfaction measurement. The relationship between satisfaction and loyalty are well established [35]. For example, satisfied consumers are more likely to buy additional products or services, stay longer in stores and be undisturbed by competitors [47]. Furthermore, satisfied consumers purchase products or services repeatedly, spend more money and recommend the retailer to their friends and family [48]. Similarly, if consumers are satisfied with a mobile shopping app that uses AR technology, their loyalty toward the mobile app will increase. Therefore, the following hypothesis was developed.
Hypothesis 5 (H5).
Satisfaction will be positively associated with loyalty toward a mobile shopping app.
2. Materials and Methods
2.1. Procedure
An online survey was conducted via a research company in South Korea. Cosmetics shoppers who have experienced mobile shopping were recruited as the sample for this study. The research company emailed an invitation letter to potential participants, which included the research objectives, instructions for use of the mobile shopping app and the URL link to the online survey. For external validity, this study used an existing virtual makeup mobile app, “YouCam Makeup”, which provides a number of cosmetics products with the aid of AR technology, and which has been rated by consumers as the most impressive AR app [12]. Participants who agreed to take the survey downloaded the mobile app to their mobile device, browsed through cosmetic products and tried products using AR. When a participant opens the “YouCam Makeup” app, their face shows on the smartphone screen. The participant selects a cosmetic product listed at the bottom of the smartphone screen and it is immediately applied to the face in the correct location. The user can continue selecting products to experience a virtual makeover. Once participants were finished experiencing the mobile app, they could complete the survey based on their experience. The data were collected over a time period of two weeks.
2.2. Instrument Development
All measurement scales were adapted from previous research, with satisfactory reliabilities (Cronbach’s αs > 0.70). System quality and information quality were measured with four items each from Kim and Hyun’s [23] study and visual quality was measured with three items from studies by Kim and Hyun [23] and Kim et al. [22]. Three items of perceived diagnosticity were adopted from Lee’s [49] study. Satisfaction and loyalty were measured with three items each and adapted from studies by Kim et al. [22] and Yoo and Park [50] (see Table 1). All the items were measured on a 7-point Likert-type scale (anchors of 1 = strongly disagree and 7 = strongly agree) except for the perceived diagnosticity measurement; the first two items of perceived diagnosticity were anchored by 1 = not helpful and 7 = extremely helpful and the last item was anchored by 1 = it did not enable me to evaluate the product at all and 7 = it fully enabled me to evaluate the product.
2.3. Sample Characteristics
Of the 283 female participants, 38.5% (n = 109) were aged between 20 and 29, 35.3% (n = 100) were aged between 30 and 39 and 26.1% (n = 74) were aged between 40 and 49. The mean age of the participants was 33. In terms of education, 70.0% (n = 200) of the participants answered, “graduated college”, 17% (n = 48) answered “high school and above”, and 12% (n = 34) answered “graduate school and above”. Office workers comprised 48.1% (n = 136) of the sample followed by housewives at 18% (n = 51), professionals at 12% (n = 34) and students at 9.5% (n = 27).
3. Results
3.1. Data Analysis
SPSS version 25.0 (SPSS Inc., Chicago, IL, USA) and AMOS version 23.0 (SPSS Inc., Chicago, IL, USA) were used to analyze the data. Descriptive analyses were performed to identify sample characteristics. Preliminary analyses examining the reliability of measures and model specification were performed using confirmatory factor analysis. Structural equation modeling was conducted for hypotheses testing.
3.2. Preliminary Analysis
An exploratory factor analysis was conducted to test the dimensionality of the six variables—system quality, information quality, visual quality, perceived diagnosticity, satisfaction and loyalty. All variables yielded one factor.
Based on a two-step modeling approach [51], confirmatory factor analysis was conducted to assess the convergent validity of the measurements. The chi-square statistic was significant, χ2(155) = 234.39, p < 0.001, owing to the large sample size (n = 283) and other fit indices suggested an acceptable fit to the data as follows—Root Mean Square Residual (RMSEA) = 0.04, Normal Fit Index (NFI) = 0.95, Tucker-Lewis Index (TLI) = 0.98 and Comparative Fit Index (CFI) = 0.98. All the critical ratio (C.R.) values for the factor loadings were significant and all the average variances extracted (AVE) were greater than 0.50, supporting convergent validity (see Table 2).
Discriminant validity was assessed using chi-square difference tests between an unconstrained model and constrained models [51]. Since all chi-square difference tests were significant, discriminant validity between constructs was established (see Table 3). Therefore, the measurement model contained six latent variables and 20 manifest variables, which were used to conduct the structural equation modeling analysis for hypotheses testing. The reliabilities of all the measurements were greater than 0.80, indicating an adequate level of internal consistency for the scales.
3.3. Hypotheses Testing
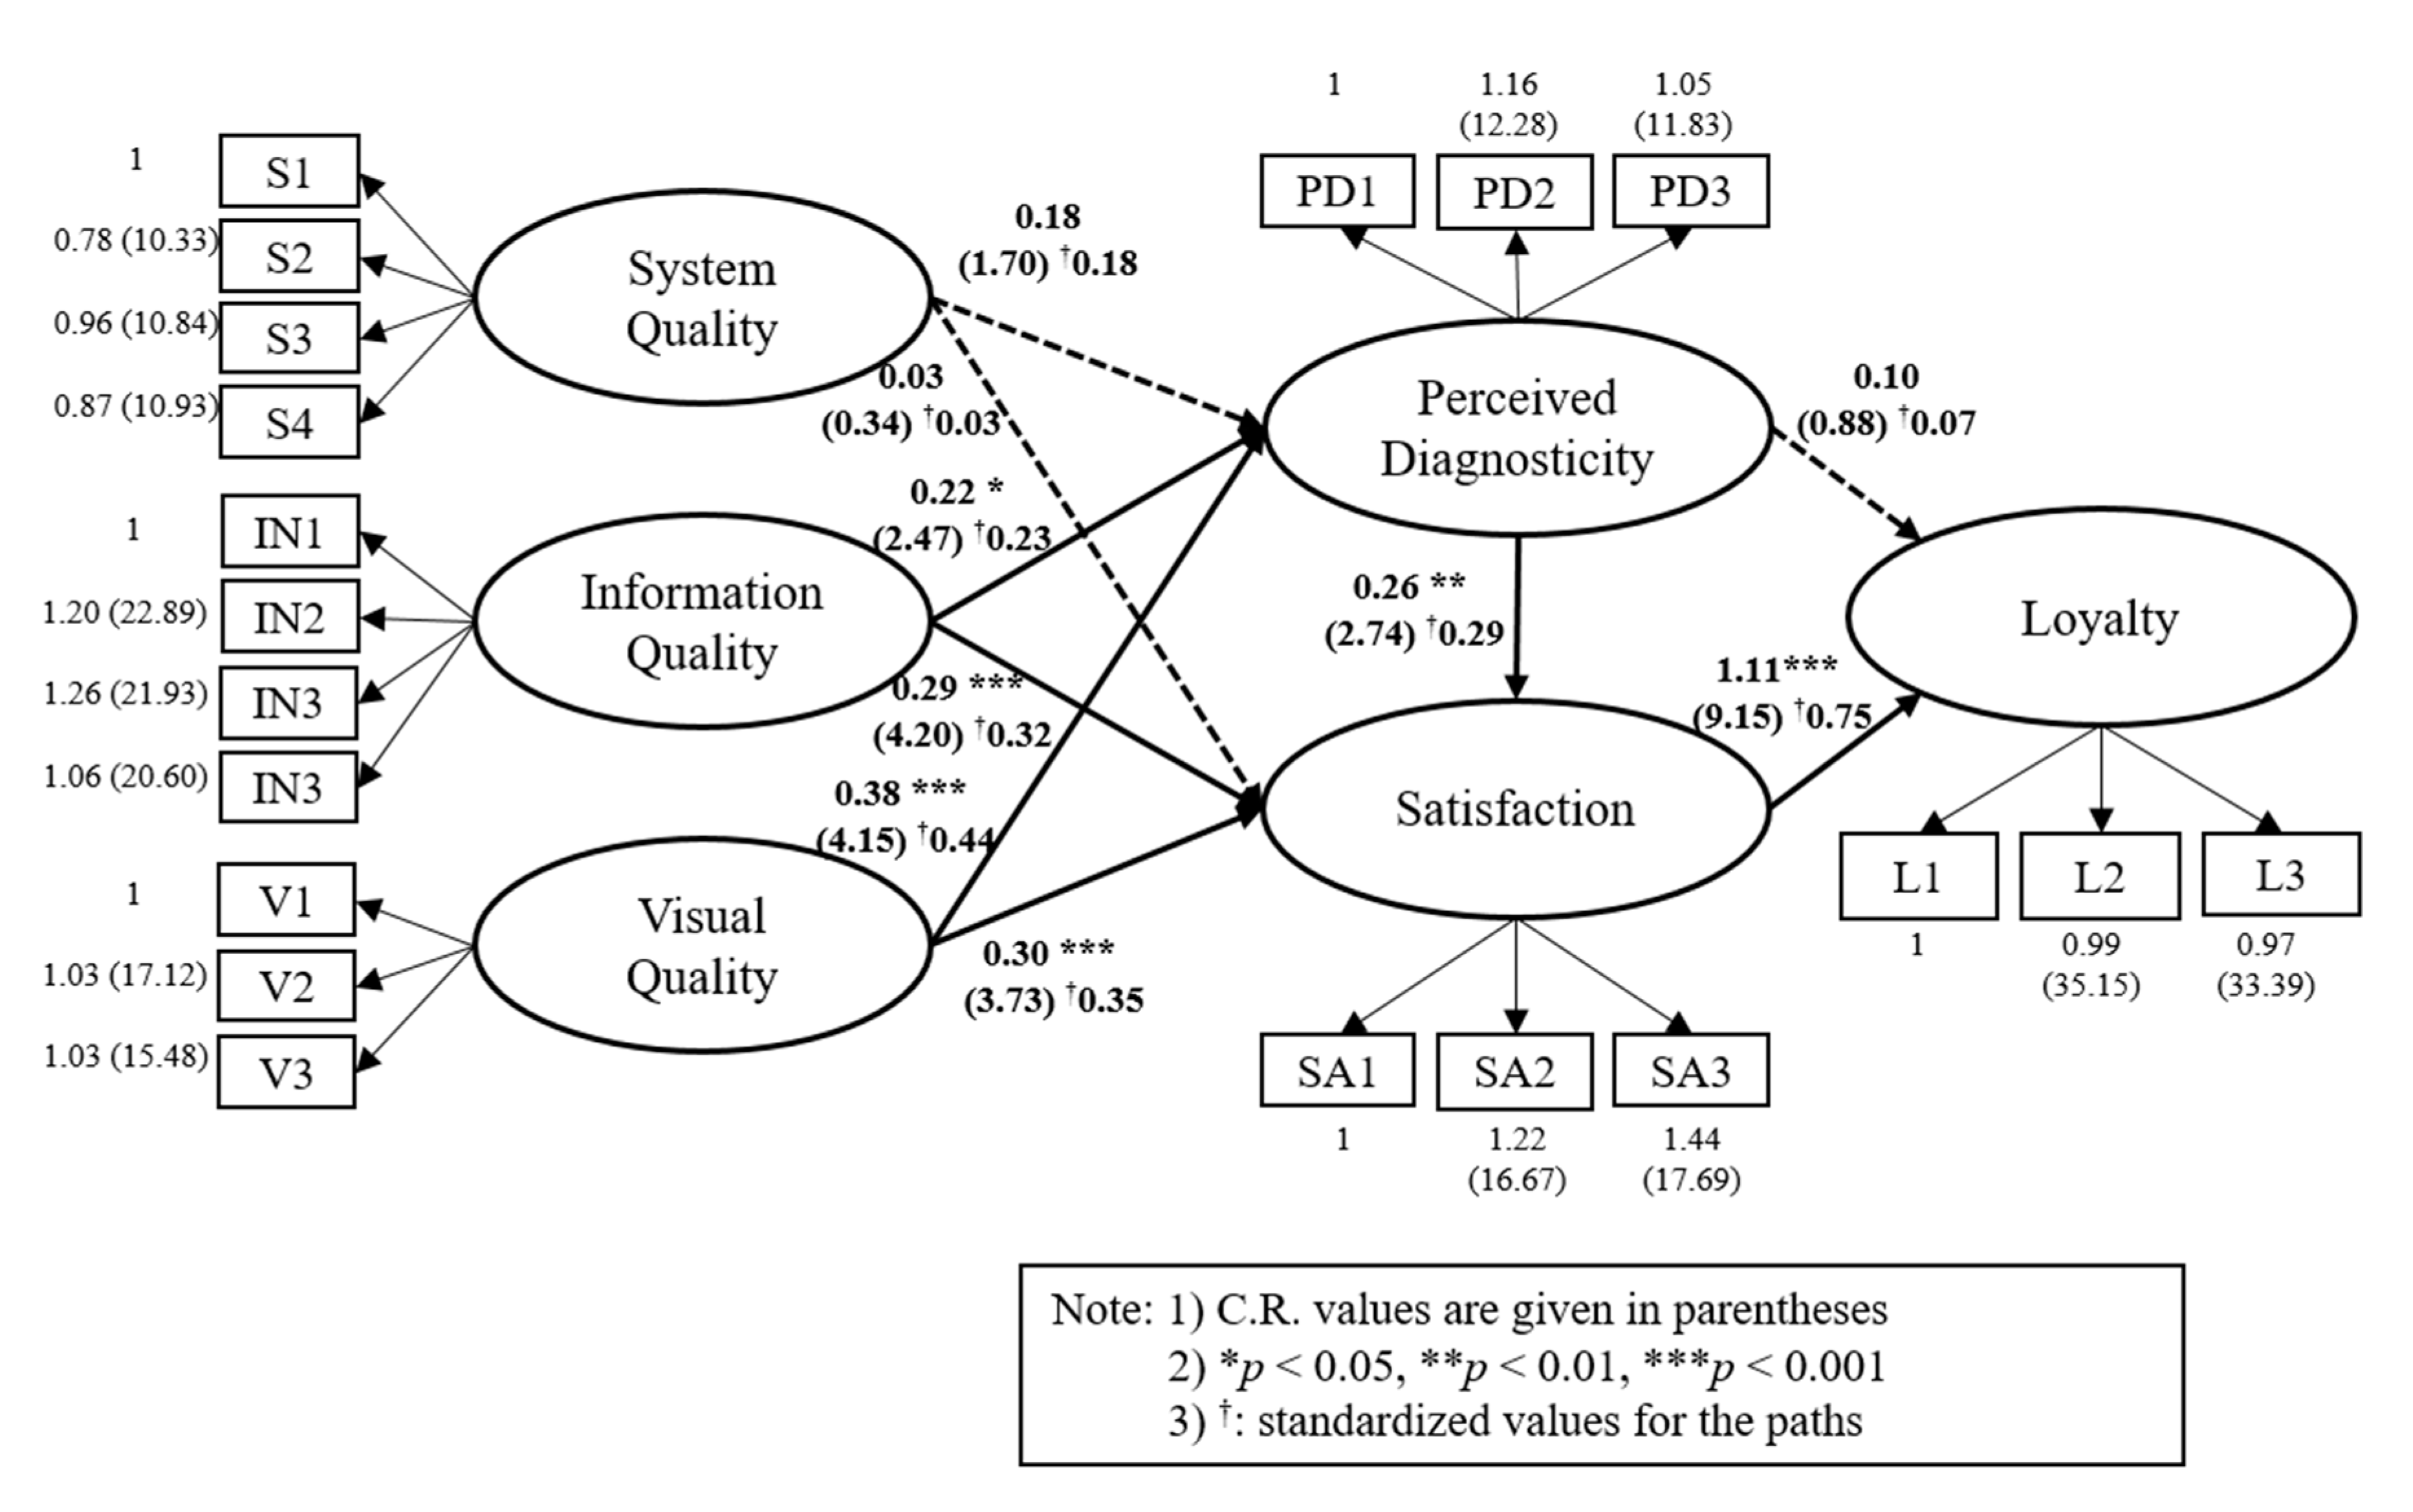
Hypotheses were tested using single-group structural equation modeling, which addresses the effect of perceived quality (system quality, information quality and visual quality) on perceived diagnosticity and satisfaction and the effect of perceived diagnosticity and satisfaction on loyalty. The fit indices of the structural equation model showed a satisfactory fit as follows—χ2(158) = 238.96 (p < 0.001), TLI = 0.98, CFI = 0.98, RMSEA = 0.04. The path coefficients of the structural equation modeling showed the significant positive impacts of information quality (β = 0.23) and visual quality (β = 0.44) on perceived diagnosticity and the positive impacts of information quality (β = 0.32) and visual quality (β = 0.35) on satisfaction. However, system quality did not influence perceived diagnosticity and satisfaction. Thus, H1(b), H1(c), H2(b) and H2(c) were supported but H1(a) and H2(a) were not supported. The effect of perceived diagnosticity on satisfaction (β = 0.29) and the effect of satisfaction on loyalty (β = 0.75) were significant but the effect of perceived diagnosticity on loyalty was not significant, supporting H3 and H5 (see Figure 2).
Since perceived diagnosticity did not influence loyalty directly (β = 0.07), the significance of an indirect effect of perceived diagnosticity on loyalty through satisfaction was further examined. The results of a decomposition of effect analysis revealed that satisfaction is a perfect mediator in the relationship between perceived diagnosticity and loyalty (β = 0.22, p < 0.05).
4. Discussion
The current study focuses on consumer-computer interactions and investigates the use of innovative technology from marketing and psychological perspectives. The purpose of this study is to examine the effects of the perceived quality of AR on loyalty through perceived diagnosticity and satisfaction. The findings suggest that the information quality and visual quality dimensions of perceived quality positively influence perceived diagnosticity and satisfaction, which further positively influences loyalty. Consumers who recognize the information and visual quality of AR technology perceive higher diagnosticity and experience greater satisfaction with AR. If consumers use the AR function in mobile shopping apps to assess product features and perceive the information provided to be accurate and relevant, they perceive a high ability of AR to deliver product information that is helpful in evaluating the product. Furthermore, if consumers find the visual graphics provided by AR are clear and accurate, they are more satisfied with the AR and perceive higher diagnosticity, supporting Jiang and Benbasat [25] and Kim et al.’s [22] results. However, system quality does not influence perceived diagnosticity and satisfaction. Although previous research has considered system quality as a key factor in evaluating IS success, when system quality is measured in the context of AR technology in mobile shopping, the speed, reliability and ease of use of AR may not be significant factors that increase perceived diagnosticity and user satisfaction. This may be because consumers attribute speed and reliability issues to the mobile app, the Wi-Fi connection or the telecommunications carrier, rather than to a malfunction of the AR technology. This result supports previous literature [24], which finds that the speed of AR is not a significant aspect in consumer responses. Furthermore, the ease of use of AR may be dependent on individual characteristics, such as innovativeness, compatibility, openness and task complexity [52,53,54]. The result suggests that although system quality is a critical factor for IS success in the context of digital commerce systems [17,55,56], it is not critical when applied to a single technology application because consumers may not link the specific technology to the system attributes; therefore, it does not influence the consumers’ perceived diagnosticity or satisfaction with AR.
The results also reveal that perceived diagnosticity positively influences satisfaction, which, in turn, positively influences loyalty. Although previous research has not found a relationship between perceived diagnosticity and satisfaction, the relationship between perceived diagnosticity and positive attitude has been established; therefore, this study supports the rationale that satisfaction is a similar construct to positive attitude [37] and finds a positive relationship between perceived diagnosticity and satisfaction. Furthermore, the finding corresponds with the results of previous research on the relationship between satisfaction and loyalty [35].
In contrast to the research hypothesis, the results of this study show that perceived diagnosticity does not directly influence loyalty but rather indirectly influences loyalty through consumer satisfaction. This suggests that perceived diagnosticity is not sufficient in itself to increase loyalty. Mobile retailers need to satisfy their consumers by enhancing perceived diagnosticity and a high quality of AR that enables consumers to perceive higher diagnosticity may help to improve customer satisfaction and increase loyalty.
An important finding of this study is the role of perceived diagnosticity in satisfaction with a mobile shopping app. Mobile shopping involves higher uncertainty and more cognitive effort to evaluate products. Perceived diagnosticity of AR technology may play a significant role in the consumer’s decision-making process and the information quality and visual quality of AR are important predictors that increase perceived diagnosticity. Furthermore, the perceived diagnosticity of AR affects consumer satisfaction, which increases loyalty toward the mobile shopping app.
This study provides theoretical insights that extend the IS success model [15] to a mobile shopping app and develops an understanding of the importance of information and visual quality to the success of IS. While recent studies have successfully applied the IS success model to the IS as a whole, such as e-commerce, few have adopted the IS success model in the context of an individual technology used in the IS. Accordingly, instead of examining service quality alone, this study includes the visual quality of AR in the research model, which is found to be a significant predictor of perceived diagnosticity and satisfaction. Furthermore, this study suggests that high quality in a single technology used in the IS can lead to loyalty toward the whole IS. The current study contributes to closing a knowledge gap by considering AR technology as an important factor in the success and effectiveness of IS.
Although this study contributes to the existing literature, there are some limitations. First, participants of this study were female mobile shoppers in South Korea. The reason why female shoppers were selected was due to the cosmetic products used in this study. A more diverse range of mobile shoppers and other product types should be examined to enhance the generalizability of future research. Second, since AR availability in mobile shopping apps is a relatively new technology that was developed to help consumers shop efficiently, some participants experienced difficulty using the AR function and were subsequently eliminated. This might influence the finding that system quality (i.e., the ease of use of AR), is not a significant predictor of perceived diagnosticity. Therefore, further analysis is necessary to assess consumers’ perceived difficulty in using mobile shopping technology and how the technology could be improved to remove these difficulties.
5. Conclusions
Due to the nature of mobile shopping environment, where consumers evaluate produts without direct inpection, mobile shopping involves higher uncertainty on decision making. The purpose of this study is to provide a new perspective to enhance effectiveness of AR technology in mobile shopping app. Drawing on information systems success model, this study identifies ways to enhance perceived diagnosticity and satisfaction through AR quality in a mobile shopping context. This study further examines the effects of perceived diagnosticity and satisfaction on loyalty. Based on the previous literature, this study divides perceived quality into three dimensions: system quality, information quality and visual quality. The findings reveals that information quality and visual quality positively influence perceived diagnosticity and satisfaction. Furthermore, perceived diagnosticity leads to satisfaction with the mobile shopping app, which ultimately increases loyalty. The findings of this study provides theoretical and practical insights that will help both scholars and practicitioners understand effectiveness of new technology in mobile shopping.
Funding
This research was funded by Duksung Women’s University Research Grant of 2018.
Conflicts of Interest
The authors declare no conflict of interest.
References
- eMarketer. US Commerce Snapshot. Available online: https://www.cdn.neustar/resources/whitepapers/marketingzz/neustar-emarketer-us-commerce-snapshot.pdf (accessed on 26 March 2020).
- eMarketer. How Digital Are Millennials in Their Shopping? Available online: https://www.emarketer.com/content/how-digital-are-millennials-in-their-shopping?ecid=NL1001 (accessed on 26 March 2020).
- Samsung Business Insights. 5 Retail Technology Trends to Watch in 2020. Available online: https://insights.samsung.com/2020/01/03/5-retail-technology-trends-to-watch-in-2020/ (accessed on 24 March 2020).
- Zhou, F.; Duh, H.B.-L.; Billinghurst, M. Trends in augmented reality tracking, interaction and display: A review of ten years of ISMAR. In Proceedings of the 7th IEEE/ACM International Symposium on Mixed and Augmented Reality, Cambridge, UK, 15–18 September 2008; pp. 193–202. [Google Scholar]
- Forbes. The Top 10 Technology Trends in Retail: How Tech Will Transform Shopping in 2020. Available online: https://www.forbes.com/sites/bernardmarr/2019/11/25/the-top-10-technology-trends-in-retail-how-tech-will-transform-shopping-in-2020/#5e4e4a0a4e03 (accessed on 26 March 2020).
- vXchange. Top 7 Augmented Reality Statistics for 2020. Available online: https://www.vxchnge.com/blog/augmented-reality-statistics (accessed on 2 April 2020).
- Inc. 10 Real Use Cases for Augmented Reality: AR Is Set to a Big Impact on Major Industries. Available online: https://www.inc.com/james-paine/10-real-use-cases-for-augmented-reality.html (accessed on 2 April 2020).
- Goldman Sachs. Augmented Reality Starts to Liven Up the VR/AR Market. Available online: http://pg.jrj.com.cn/acc/Res/CN_RES/INVEST/2016/7/18/fb09e321-675c-4f4d-9098-630bb3ff7b31.pdf (accessed on 13 January 2020).
- Shopify. How These Retailers Use Augmented Reality to Enhance the Customer Experience. Available online: https://www.shopify.com/retail/how-these-retailers-areusing-augmented-reality-to-enhance-the-customer-experience (accessed on 26 March 2020).
- App Solution. Augmented Reality Issues: What You Need to Know. Available online: https://theappsolutions.com/blog/development/augmented-reality-challenges/ (accessed on 2 April 2020).
- eMarketer. Why Isn’t Everyone Living in an AR/VR World? Poor User Experience among Many Hampering Widespread Appeal. Available online: https://www.emarketer.com/content/why-isn-t-everyone-living-in-an-ar-vr-world (accessed on 3 April 2020).
- Strategy & Business. The Long Nose of Augmented Reality. Available online: https://www.strategy-business.com/blog/The-long-nose-of-augmented-reality?gko=fcbad (accessed on 2 April 2020).
- DeLone, W.H.; McLean, E.R. Information systems success: The quest for the dependent variable. Inf. Syst. Res. 1992, 3, 60–95. [Google Scholar] [CrossRef]
- Seddon, P.B. A respecification and extension of the DeLone and McLean model of IS success. Inf. Syst. Res. 1997, 8, 240–253. [Google Scholar] [CrossRef]
- DeLone, W.H.; McLean, E.R. The DeLone and McLean model of information system success: A ten-year update. J. Manag. Inform. Syst. 2003, 19, 9–30. [Google Scholar]
- Molla, A.; Licker, P.S. E-commerce system success: An attempt to extend and respecify the DeLone and McLean model of IS success. J. Electron. Commer. Res. 2001, 2, 1–11. [Google Scholar]
- Lee, K.C.; Chung, N. Understanding factors affecting trust in and satisfaction with mobile banking in Korea: A modified DeLone and McLean’s model perspective. Interact. Comp. 2009, 21, 385–392. [Google Scholar] [CrossRef]
- Zheng, Y.; Zhao, K.; Stylianou, A. The impact of information quality and system quality on users’ continuance intention in information-exchange virtual communities: An empirical investigation. Decis. Support. Syst. 2013, 56, 513–524. [Google Scholar] [CrossRef]
- Yoo, J.; Kim, M. The effects of online product presentation on consumer responses: A mental imagery perspective. J. Bus. Res. 2014, 67, 2464–2472. [Google Scholar] [CrossRef]
- Cao, M.; Zhang, Q.; Seydel, J. B2C e-commerce web site quality: An empirical examination. Ind. Manag. Data Syst. 2005, 105, 645–661. [Google Scholar] [CrossRef]
- Pantano, E.; Rese, A.; Baier, D. Enhancing the online decision-making process by using augmented reality: A two country comparison of youth markets. J. Retail Consum. Serv. 2017, 38, 81–95. [Google Scholar] [CrossRef]
- Kim, K.; Hwang, J.; Zo, H.; Lee, H. Understanding users’ continuance intention toward smartphone augmented reality applications. Inf. Dev. 2016, 32, 161–174. [Google Scholar] [CrossRef]
- Kim, H.-C.; Hyun, M.Y. Predicting the use of smartphone-based augmented reality (AR): Does telepresence really help? Comput. Hum. Behav. 2016, 59, 28–38. [Google Scholar] [CrossRef]
- Park, M.; Yoo, J. Effects of perceived interactivity of augmented reality on consumer responses: A mental imagery perspective. J. Retail Consum. Serv. 2020, 52, 101912. [Google Scholar] [CrossRef]
- Jiang, Z.; Benbasat, I. Virtual product experience: Effects of visual and functional control of products on perceived diagnosticity and flow in electronic shopping. Manag. Inf. Syst. 2004, 21, 111–147. [Google Scholar] [CrossRef]
- Kempf, D.S. Attitude formation from product trial: Distinct roles of cognition and affect for hedonic and functional products. Psychol. Mark. 1999, 16, 35–50. [Google Scholar] [CrossRef]
- Venkatesh, V.; Davis, F.D. A theoretical extension of the technology acceptance model: Four longitudinal field studies. Manage. Sci. 2000, 46, 186–204. [Google Scholar] [CrossRef] [Green Version]
- Beemer, B.A.; Gregg, D.G. Dynamic interaction in decision support: Effects on perceived diagnosticity and confidence in unstructured domains. IEEE T. Syst. Man. CY-S 2012, 43, 74–84. [Google Scholar] [CrossRef]
- Oliver, R.L. Measurement and evaluation of satisfaction processes in retail settings. J. Retail. 1981, 57, 25–48. [Google Scholar]
- Baker, D.A.; Crompton, J.L. Quality, satisfaction and behavioral intentions. Ann. Tour. Res. 2000, 27, 785–804. [Google Scholar] [CrossRef]
- González, M.E.A.; Comesaña, L.R.; Brea, J.A.F. Assessing tourist behavioral intentions through perceived service quality and customer satisfaction. J. Bus. Res. 2007, 60, 153–160. [Google Scholar] [CrossRef]
- Babakus, E.; Bienstock, C.C.; Van Scotter, J.R. Linking perceived quality and customer satisfaction to store traffic and revenue growth. Decis. Sci. 2004, 35, 713–737. [Google Scholar] [CrossRef]
- Cristobal, E.; Flavian, C.; Guinaliu, M. Perceived e-service quality (PeSQ). Manag. Serv. Qual. 2007, 17, 317–340. [Google Scholar] [CrossRef]
- Ha, Y.; Im, H. Role of web site design quality in satisfaction and word of mouth generation. J. Serv. Manag. 2012, 23, 79–96. [Google Scholar] [CrossRef]
- Deng, Z.; Lu, Y.; Wei, K.K.; Zhang, J. Understanding customer satisfaction and loyalty: An empirical study of mobile instant messages in China. Int. J. Inf. Manag. 2010, 30, 290–300. [Google Scholar] [CrossRef]
- Lee, K.-Y.; Li, H.; Edwards, S.M. The effect of 3-D product visualization on the strength of brand attitude. Int. J. Advert. 2012, 31, 377–396. [Google Scholar] [CrossRef]
- LaTour, S.A.; Peat, N.C. Conceptual and methodological issues in consumer satisfaction research. In Advances in Consumer Research; Wilkie, W.L., Ed.; Association for Consumer Research: Ann Arbor, MI, USA, 1979; pp. 431–437. [Google Scholar]
- Lee, J.; Lee, J.; Feick, L. The impact of switching costs on the customer satisfaction-loyalty link: Mobile phone service in France. J. Serv. Mark. 2001, 15, 35–48. [Google Scholar] [CrossRef]
- Boulding, W.; Kalra, A.; Staelin, R.; Zeithaml, V.A. A dynamic process model of service quality from expectations to behavioral intentions. J. Mark. Res. 1993, 30, 7–27. [Google Scholar] [CrossRef]
- Cronin, J.J., Jr.; Taylor, S.A. Measuring service quality: A reexamination and extension. J. Mark. 1992, 56, 55–68. [Google Scholar] [CrossRef]
- Narayandas, N. The Link between Customer Satisfaction and Customer Loyalty: An Empirical Investigation; Division of Research, Harvard Business School: Boston, MA, USA, 1996. [Google Scholar]
- Donio, J.; Massari, P.; Passiante, G. Customer satisfaction and loyalty in a digital environment: An empirical test. J. Consum. Mark. 2006, 23, 445–457. [Google Scholar] [CrossRef]
- DeLone, W.H.; McLean, E.R. Measuring e-commerce success: Applying the DeLone and McLean information systems success model. Int. J. Electron. Commer. 2004, 9, 31–47. [Google Scholar] [CrossRef]
- Wang, J.-C.; Chang, C.-H. How online social ties and product-related risks influence purchase intentions: A Facebook experiment. Electron. Commer. R. A 2013, 12, 337–346. [Google Scholar] [CrossRef]
- Mehrabian, A.; Russell, J.A. Environmental effects on affiliation among strangers. Humanitas 1975, 11, 219–230. [Google Scholar]
- Sivadas, E.; Baker-Prewitt, J.L. An examination of the relationship between service quality, customer satisfaction and store loyalty. Int. J. Retail Distrib. Manag. 2000, 28, 72–82. [Google Scholar] [CrossRef]
- Zineldin, M. TRM: Total Relationship Management; Studentlitteratur: Lund, Sweden, 2000. [Google Scholar]
- Bowen, J.T.; Chen, S.L. The relationship between customer loyalty and customer satisfaction. Int. J. Contemp. Hosp. Manag. 2001, 13, 213–217. [Google Scholar] [CrossRef]
- Lee, K.-Y. Consumer processing of virtual experience in e-commerce: A test of an integrated framework. Comput. Hum. Behav. 2012, 28, 2134–2142. [Google Scholar] [CrossRef]
- Yoo, J.; Park, M. The effects of e-mass customization on consumer perceived value, satisfaction and loyalty toward luxury brands. J. Bus. Res. 2016, 69, 5775–5784. [Google Scholar] [CrossRef]
- Anderson, J.C.; Gerbing, D.W. Structural equation modeling in practice: A review and recommended two-step approach. Psychol. Bull. 1988, 103, 411–423. [Google Scholar] [CrossRef]
- Aldás-Manzano, J.; Ruiz-Mafé, C.; Sanz-Blas, S. Exploring individual personality factors as drivers of M-shopping acceptance. Ind. Manag. Data Syst. 2009, 109, 739–757. [Google Scholar] [CrossRef]
- Jiang, Z.; Benbasat, I. The effects of presentation formats and task complexity on online consumers’ product understanding. Manag. Inf. Syst. Q. 2007, 31, 475–500. [Google Scholar] [CrossRef] [Green Version]
- Yoon, H.S.; Steege, L.M.B. Development of a quantitative model of the impact of customers’ personality and perceptions on Internet banking use. Comput. Hum. Behav. 2013, 29, 1133–1141. [Google Scholar] [CrossRef]
- Gao, L.; Waechter, K.A.; Bai, X. Understanding consumers’ continuance intention towards mobile purchase: A theoretical framework and empirical study—A case of China. Comput. Hum. Behav. 2015, 53, 249–262. [Google Scholar] [CrossRef]
- Zhou, T. Examining the critical success factors of mobile website adoption. Online Inf. Rev. 2011, 35, 636–652. [Google Scholar] [CrossRef]
Figure 1.
The information systems (IS) success model.

Figure 2.
Findings for hypotheses 1 to 5 (n = 283).


Table 1.
Variables and Measurements.
| Variable | Measurement Scales |
|---|---|
| System Quality | S1: The AR function in the application is fast. |
| S2: The AR function in the application is reliable. | |
| S3: The AR function in the application is easy to navigate. | |
| S4: The AR function in the application is easy to use. | |
| Information Quality | IN1: The AR provides accurate information. |
| IN2: The information provided by the AR is easy to understand. | |
| IN3: The information provided by the AR is relevant to my needs. | |
| IN4: The AR provides personalized information to me. | |
| Visual Quality | V1: The visual features on the screen using the AR are realistic. |
| V2: The visual features on the screen using the AR are appealing. | |
| V3: The visual features on the screen using the AR are expressed vividly. | |
| Perceived Diagnosticity | PD1: In judging the quality and performance of the product presented, overall, how helpful would you rate the AR function? |
| PD2: In understanding different features of the product presented, overall, how helpful would you rate the AR function in the mobile shopping app? | |
| PD3: To what extent did the AR function enable you to accurately evaluate the product presented? | |
| Satisfaction | SA1: I am satisfied with the mobile shopping app providing the AR function. |
| SA2: I am not complaining about the mobile shopping app providing the AR function. | |
| SA3: The mobile shopping app providing the AR function fulfills my demand. | |
| Loyalty | L1: I would patronize this mobile shopping app providing the AR function. |
| L2: I would purchase a product in the near future in this mobile shopping app providing the AR function. | |
| L3: I would recommend this mobile shopping app to a friend or relative. |
Table 2.
Results of the confirmatory factor analysis.
| Variable | Unstandardized Factor Loadings | Standardized Factor Loadings | Critical Ratio |
|---|---|---|---|
| System Quality (α: 0.80, AVE: 0.50) | |||
| S1 | 0.81 | 0.72 | 13.12 |
| S2 | 0.64 | 0.68 | 12.03 |
| S3 | 0.76 | 0.72 | 12.92 |
| S4 | 0.71 | 0.72 | 13.02 |
| Information Quality (α: 0.95, AVE: 0.82) | |||
| IN1 | 0.86 | 0.85 | 17.60 |
| IN2 | 1.03 | 0.95 | 21.28 |
| IN3 | 1.09 | 0.93 | 20.48 |
| IN4 | 0.91 | 0.90 | 19.39 |
| Visual Quality (α: 0.86, AVE: 0.69) | |||
| V1 | 0.93 | 0.86 | 17.56 |
| V2 | 0.96 | 0.84 | 16.73 |
| V3 | 0.95 | 0.78 | 15.13 |
| Perceived Diagnosticity (α: 0.81, AVE: 0.58) | |||
| PD1 | 0.80 | 0.75 | 13.66 |
| PD2 | 0.93 | 0.79 | 14.83 |
| PD3 | 0.84 | 0.76 | 13.95 |
| Satisfaction (α: 0.90, AVE: 0.75) | |||
| SA1 | 0.79 | 0.78 | 15.49 |
| SA2 | 0.97 | 0.88 | 18.46 |
| SA3 | 0.84 | 0.92 | 20.00 |
| Loyalty (α: 0.96, AVE: 0.90) | |||
| L1 | 1.17 | 0.95 | 21.53 |
| L2 | 1.17 | 0.95 | 21.44 |
| L3 | 1.14 | 0.94 | 20.99 |
AVE: average variances extracted.
Table 3.
Chi-square difference tests for discriminant validity.
| Constraint | χ2 | df | Δχ2 | Δdf |
|---|---|---|---|---|
| Unconstrained model | 234.39 | 155 | ||
| System quality ↔ Information quality | 326.95 | 156 | 92.56 *** | 1 |
| System quality ↔ Visual quality | 331.35 | 156 | 96.97 *** | 1 |
| System quality ↔ Diagnosticity | 373.34 | 156 | 138.95 *** | 1 |
| System quality ↔ Loyalty | 447.45 | 156 | 213.06 *** | 1 |
| Information quality ↔ Visual quality | 399.02 | 156 | 164.63 *** | 1 |
| Information quality ↔ Diagnosticity | 362.12 | 156 | 127.73 *** | 1 |
| Information quality ↔ Satisfaction | 479.09 | 156 | 244.70 *** | 1 |
| Information quality ↔ Loyalty | 932.09 | 156 | 697.70 *** | 1 |
| Visual quality ↔ Diagnosticity | 316.64 | 156 | 82.25 *** | 1 |
| Visual quality ↔ Satisfaction | 359.09 | 156 | 124.70 *** | 1 |
| Visual quality ↔ Loyalty | 476.96 | 156 | 242.57 *** | 1 |
| Diagnosticity ↔ Satisfaction | 336.53 | 156 | 102.14 *** | 1 |
| Diagnosticity ↔ Loyalty | 399.10 | 156 | 164.71 *** | 1 |
| Satisfaction ↔ Loyalty | 461.45 | 156 | 227.06 *** | 1 |
Note. * p < 0.05, ** p < 0.01, *** p < 0.001; Δχ2 = χ2 (constrained) − χ2 (unconstrained); Δdf = df (constrained) − df (unconstrained).
© 2020 by the author. Licensee MDPI, Basel, Switzerland. This article is an open access article distributed under the terms and conditions of the Creative Commons Attribution (CC BY) license (http://creativecommons.org/licenses/by/4.0/).
Share and Cite
MDPI and ACS Style
Yoo, J. The Effects of Perceived Quality of Augmented Reality in Mobile Commerce—An Application of the Information Systems Success Model. Informatics 2020, 7, 14. https://0-doi-org.brum.beds.ac.uk/10.3390/informatics7020014
AMA Style
Yoo J. The Effects of Perceived Quality of Augmented Reality in Mobile Commerce—An Application of the Information Systems Success Model. Informatics. 2020; 7(2):14. https://0-doi-org.brum.beds.ac.uk/10.3390/informatics7020014
Chicago/Turabian StyleYoo, Jungmin. 2020. "The Effects of Perceived Quality of Augmented Reality in Mobile Commerce—An Application of the Information Systems Success Model" Informatics 7, no. 2: 14. https://0-doi-org.brum.beds.ac.uk/10.3390/informatics7020014
Note that from the first issue of 2016, this journal uses article numbers instead of page numbers. See further details here.