Article

Development of an Ultrasound-Assisted Emulsification Microextraction Method for the Determination of Volatile Compounds in Wines

by
Ioanna Chalvantzi
1,2,
Aspasia Nisiotou
1,
Georgios Banilas
2 and
Athanasios Mallouchos
3,*
1
Hellenic Agricultural Organization “Dimitra”, Institute of Technology of Agricultural Products, Sofokli Venizelou 1, 141 23 Lykovryssi, Greece
2
Department of Wine, Vine and Beverage Sciences, University of West Attica, Ag. Spyridonos 28, 122 43 Aegaleo, Greece
3
Laboratory of Food Chemistry and Analysis, Department of Food Science and Human Nutrition, Agricultural University of Athens, Iera Odos 75, 118 55 Athens, Greece
*
Author to whom correspondence should be addressed.
Submission received: 31 August 2023 / Revised: 15 September 2023 / Accepted: 20 September 2023 / Published: 27 September 2023

Abstract

:
A fast and simple method based on ultrasound-assisted emulsification microextraction (USAEME) was developed for the analysis of volatile compounds in wines. A full factorial 24 screening design was built to investigate the main factors affecting the extraction of volatile components, namely the volume of extraction solvent, sonication time, salt content, and pH. Then, the factors with significant effects were optimized using an I-optimal design. The optimal value for all the variables studied was reached under the following experimental conditions: volume of extraction solvent 200 μL and salt content 5% m/v. The suitability of the optimized method was evaluated, resulting in very good linearity with coefficients of determination (R2) higher than 0.995 in all cases, while repeatability was lower than 8.4% except for d-limonene and p-cymene. Recoveries higher than 82% were observed for the groups of ethyl esters, acetate esters, alcohols, and terpenoid alcohols (linalool, α-terpineol). The recovery of acids ranged from 70.5% to 88.9%, whereas the three monoterpenes studied (d-limonene, γ-terpinene, p-cymene) were not extracted satisfactorily. The proposed method was effectively applied for the analysis of volatile compounds in laboratory-scale fermentations with selected strains of Saccharomyces cerevisiae.

Graphical Abstract

1. Introduction

Wine is widely recognized as one of the oldest alcoholic beverages worldwide [1]. Wine aroma, primarily attributed to odorous and volatile compounds, has a major impact on determining both wine quality and consumer preferences [2,3]. According to different sources, volatile compounds are classified as (1) primary aromas, derived from grape varieties cultivated in viticultural regions with different soils, terrains, and climates; (2) secondary aromas, formed during the fermentation process by a population of different yeast and malolactic bacteria species and strains; and (3) tertiary aromas, which result from a number of variables, including container size, material, storage methods, and time [1,4,5].
Numerous substances from diverse groups, including higher alcohols, esters, organic acids, aldehydes, terpenes, ketones, lactones, and phenols, can be found in the volatile fraction of wine [6]. This great variety of volatile compounds, with different polarities, volatilities, and concentrations ranging from nanograms per liter to milligrams per liter, contributes to the richness of wine aroma [7,8]. It is noteworthy that only a few of these compounds are detected in concentrations above odor thresholds, contributing significantly to the overall aroma of the wine [5]. Hence, the quantitative and qualitative studies of volatile compounds attract the interest of the scientific community [5].
One of the main issues faced by researchers who try to obtain a representative extract containing all the volatile compounds originally contained in wine is sample preparation, which includes extraction [9]. Liquid–liquid extraction (LLE), solid-phase extraction (SPE), solid-phase microextraction (SPME), and stir-bar sorptive extraction (SBSE) are the extraction techniques most often used for the qualitative and quantitative analysis of volatile compounds in grapes and wines [8]. However, LLE and SPE have several drawbacks. LLE requires significant volumes of organic solvents, leading to high environmental pollution and posing risks to operators. In contrast, SPE reduces the volume of solvents employed but utilizes relatively large sample volumes. Also, the multiple steps needed in these extraction methods contribute to the loss of analytes [8].
As a result, innovations in sample preparation techniques have focused on miniaturized approaches that reduce or eliminate the usage of hazardous solvents, which are harmful to humans and the environment [10]. Green extraction techniques can eventually replace traditional methods for analyte extraction and preconcentration [11]. Microextraction techniques have grown in popularity since they are an innovative step in sample preparation that fulfills the principles of green chemistry. Additionally, they are quick and easy techniques which are also ecologically friendly and compatible with a variety of analytical instruments [12].
The reasons above have led to the development of SPME and SBSE. Since SPME was developed, it has been applied for the analysis of volatile compounds in wines in a large number of publications [6,13,14,15,16]. SPME is a technique that enables extraction and concentration in a single step with a solvent-free sample preparation. Additionally, SPME is a simple technique with high sensitivity and can be used in various sample matrices. However, this technique also has some disadvantages, such as the expense of the fibers, the potential binding of high-molar-mass compounds to the fiber, and the limitation of extracting the samples one-by-one and not simultaneously [8,17]. SBSE has emerged as a prominent approach for analyzing the volatile fraction of wines [16,18,19,20]. The advantages of SPME are also present in SBSE; however, SBSE offers a significantly higher sensitivity (up to 50–250 times) and is more robust in comparison to SPME. On the other hand, there are a few drawbacks to using SBSE, such as the limited number of absorbents available and the requirement of a custom-designed thermal desorption unit (TDU) [21].
Over the last few decades, there has been a notable increase in the application of ultrasounds for the isolation of analytes. This trend may be attributed to the various drawbacks related to conventional or other newer methods [11]. The use of clean energies, such as ultrasonic radiation, and the reduction of organic solvents are consistent with the trend toward green chemistry [22]. By applying ultrasonic radiation, an emulsion is formed which facilitates the transfer of analytes from the aqueous phase to the immiscible organic phase. Ultrasound’s ability to produce smaller droplets of organic solvent in an aqueous sample increases their contact surface, leading to a high extraction efficiency in a shorter amount of time [12,23]. Combining the benefits of microextraction and ultrasound radiation, a novel microextraction technique, the ultrasound-assisted emulsification microextraction method (USAEME), has been developed. Since it was proposed, USAEME has been proven to be a straightforward and efficient technique for extracting and preconcentrating nine bisphenol analogues in water and wastewater [24], UV filters in water [25], water contaminants and pesticides [26], fragrance allergens in water [27,28] and cosmetics [28], selenium in water samples [29], cadmium in water samples [30,31,32], urban effluent, bivalve mollusks [31], and tea samples [32], β-sitosterol in dietary supplements and fresh fruits and vegetables [33], bisphenol A in beverages [12], ethyl carbamate in alcoholic beverages [34], and phenolic compounds in olive oils [23]. Several chemical compounds have been identified in wine by applying USAEME, such as geosmin and 2-methylisoborneol [35], fungicide residues [36,37], monoterpenes [38], 2,4,6-trichloroanisole (TCA) [10], the main compounds causing cork taint [39], compounds responsible for Brett character [22], haloanisoles and volatile phenols [40], and sulfur compounds [1].
According to our knowledge, there is a lack of research evidence regarding the application of USAEME for the study of the whole volatile fraction of wine. The current study aimed to provide a simple, rapid, and efficient USAEME procedure for the extraction of volatile compounds in white wine samples and their subsequent determination by gas chromatography with a flame ionization detector. For this purpose, the main factors that affect the efficiency of the method (type and volume of extraction solvent, sonication time, salt content, and pH) were investigated using response surface methodology. The suitability of the optimized method was evaluated by studying its linearity, limits of detection and quantification, repeatability, and recovery. The optimized method was effectively employed to analyze volatile compounds in laboratory-scale fermentations using selected strains of Saccharomyces cerevisiae.

2. Materials and Methods

2.1. Chemicals and Standard Solutions

The volatile compounds studied were ethyl butanoate, ethyl decanoate, 2-phenylethyl acetate, diethyl succinate, 1-hexanol, 1-propanol, (E)-3-hexen-1-ol, (Z)-3-hexen-1-ol, 2-phenylethanol, acetic acid, butanoic acid, hexanoic acid, octanoic acid, decanoic acid, d-limonene, γ-terpinene, and γ-butyrolactone supplied by Sigma-Aldrich (St. Louis, MO, USA), as well as 1-octanol, 1-butanol, 2-methyl-1-propanol, 3-methyl-1-butanol, 3-methyl-1-pentanol, butyl acetate, isobutyl acetate, 3-methylbutyl acetate, ethyl hexanoate, ethyl octanoate, hexyl acetate, p-cymene, a-terpineol, and linalool purchased from Acros Organics (Geel, Belgium). 4-Methyl-2-pentanol and tetradecane (internal standards) were purchased from Sigma-Aldrich. The purity of all standards was higher than 95%. Ethanol was supplied by Sigma-Aldrich, chloroform by Merck (Darmstadt, Germany), and dichloromethane by Honeywell (Seelze, Germany). Tartaric acid was purchased from Merck, while sodium hydroxide and sodium chloride were supplied by Sigma-Aldrich.
Target volatile compounds were categorized into four groups (esters, alcohols, acids, and terpenes), and stock solutions of each group were prepared gravimetrically in volumetric flasks using ethanol as a solvent (at a level of 1 g L−1 for each compound). A fifth stock solution was prepared for the major wine volatiles, i.e., 1-propanol (40 g L−1), 2-methyl-1-propanol (40 g L−1), 3-methyl-1-butanol (80 g L−1), 2-phenylethanol (20 g L−1), 3-methylbutyl acetate (2 g L−1), and acetic acid (100 g L−1). Acetaldehyde and ethyl acetate were also included but were not identified due to chromatographic interferences from the solvent. The exact mass of each compound was recorded (at four decimal places) and accounted for in the calculation of the exact concentrations.
A mix solution (100 mL) consisting of all the target volatile compounds was prepared by combining the appropriate volumes of each stock solution in ethanol to obtain concentrations of 10 mg L−1 for the esters, alcohols, terpenes, and γ-butyrolactone; 50 mg L−1 for the acids; 2 g L−1 for 1-propanol and 2-methyl-1-propanol; 4 g L−1 for 3-methyl-1-butanol; 1 g L−1 for phenylethyl alcohol; 100 mg L−1 for 3-methylbutyl acetate; and 5 g L−1 for acetic acid. A series of six working solutions was prepared in 10 mL volumetric flasks by pipetting 0.1, 0.5, 1, 2, 5, and 10 mL of mix solution and made up to the mark with ethanol. Stock and working solutions were transferred into vials and stored at −20 °C.

2.2. Sample Preparation

2.2.1. Commercial Wine

For the optimization and evaluation of the USAEME procedure, one bottle (1.5 L) of dry white wine (Moschofilero variety) was purchased at a local market and stored at 4 °C until analysis.
The commercial wine was additionally employed to calculate the recovery and repeatability of the proposed method. For this purpose, the commercial wine was spiked with the target compounds at a single concentration level: 0.5 mg L−1 for the group of esters, alcohols, terpenes, and for γ-butyrolactone; 2 mg L−1 for the group of acids; 100 mg L−1 for 1-propanol and 2-methyl-1-propanol; 150 mg L−1 for 3-methyl-1-butanol; 200 mg L−1 for acetic acid; 4 mg L−1 for 2-phenylethanol; and 0.4 mg L−1 for 3-methylbutyl acetate. Six replicate analyses of the unspiked and spiked wine samples were performed using the optimized conditions of the USAEME procedure.

2.2.2. Synthetic Wine

A synthetic wine was used for calibration purposes. It was prepared by dissolving 5 g of L-(+)-tartaric acid in 1 L of a hydroalcoholic solution containing 11% (v/v) ethanol. The pH of the synthetic wine was adjusted to 3.4 with a 1M NaOH solution. Subsequently, a series of six calibration solutions were prepared by transferring 1 mL of each working solution into 10 mL volumetric flasks and made up to the mark with synthetic wine. Thus, each target compound was present at the following concentration ranges: 0.01–1 mg L−1 for the group of esters, alcohols, terpenes, and for γ-butyrolactone; 0.05–5 mg L−1 for the group of acids; 2–200 mg L−1 for 1-propanol and 2-methyl-1-propanol; 4–400 mg L−1 for 3-methyl-1-butanol; 5–500 mg L−1 for acetic acid; and 0.1–10 mg L−1 for 2-phenylethanol and 3-methylbutyl acetate. 4-methyl-2-pentanol was used as an internal standard at a final concentration of 50 mg L−1. The calibration solutions were extracted using the optimized conditions of the USAEME procedure and analyzed by gas chromatography. The method of internal standard was used to prepare the calibration curve of each compound.

2.3. Laboratory-Scale Fermentations

After optimizing the USAEME method and establishing the quality parameters, the proposed method was applied for the analysis of the volatile compounds in wines produced by laboratory-scale fermentations with selected strains of Saccharomyces cerevisiae.

2.3.1. Yeast Strains

This study involved four native Saccharomyces cerevisiae strains, namely Sc1, Sc2, Sc3, and Sc4, sourced from the culture collection of the Institute of Technology of Agricultural Products (ITAP-ELGO). These strains, previously isolated from spontaneously fermented grape musts [41], were identified as S. cerevisiae species by restriction enzyme analysis of the 5.8S-ITS rDNA region [42]. Further differentiation at the strain level was achieved through interdelta region analysis, as described by Legras and Karst [43].

2.3.2. Alcoholic Fermentations

Fermentations were conducted in duplicate at 20 °C in 150 mL flasks, each containing 110 mL of pasteurized (100 °C, 15 min) grape must (sugars 207 g/L; pH 3.08; titratable acidity 6.4 g/L, as tartaric acid; yeast assimilable nitrogen (YAN) 220 mg/L) of the Moschofilero variety. The flasks were sealed with a silicone stopper and a fermentation lock containing 50% v/v glycerol to enable only CO2 to escape. Each strain was inoculated to give a final concentration of 6 log cfu/mL.

2.4. USAEME Procedure

During method development, the pH of the commercial wine sample was adjusted with NaOH 1M according to the experimental design scheme. Subsequently, 5 mL of sample was transferred into a 10 mL glass centrifuge tube with a conical bottom and a varying amount of sodium chloride was dissolved by vortexing. After the complete dissolution of salt, a predetermined volume of extraction solvent was rapidly injected into the sample using a 500 μL gas-tight syringe (Hamilton, Reno, NV, USA) and the tube was placed in an ultrasonic water bath (Elma Schmidbauer GmbH, Singen (Hohentwiel), Germany) with an ultrasound frequency of 37 kHz and a power of 150 W for a predetermined time interval. The emulsion formed was centrifuged (at 6000 rpm for 10 min) and the lower phase was collected from the conical bottom of the tube using a 500 μL gas-tight syringe and transferred into a 0.1 mL glass insert. A fixed concentration of tetradecane (109 mg L−1) was then added as an internal standard in a 1:1 v/v ratio. The glass insert was placed into an autosampler vial to be analyzed by gas chromatography.

2.5. Determination of Volatile Compounds

Chromatographic analyses were carried out using a GC 2010 Plus gas chromatograph (Shimadzu Inc., Kyoto, Japan) equipped with a flame ionization detector (FID). The volatiles were separated using a DB-WAX (30 m × 0.25 mm I.D., 0.25 μm film thickness; Agilent Technologies Inc., Santa Clara, CA, USA). The carrier gas, helium, was operated at a constant linear velocity of 30 cm s−1. The oven temperature was initially set to 40 °C for 5 min, then increased to 205 °C by 4 °C min−1, and finally raised to 240 °C by 20 °C min−1, where it was held for 7 min. An AOC-20i autosampler (Shimadzu Inc., Kyoto, Japan) was utilized to inject 1 μL of organic extract in split mode (split ratio 1/10). The temperatures of the injection port and FID were set to 240 °C and 260 °C, respectively. GC Solution software version 2.3 (Shimadzu) was used for data acquisition and processing. Peak identification was accomplished by comparison of (i) the retention indices based on the homologous series of n-alkanes (C8-C24, Niles, IL, USA) with those of authentic compounds (when available) and those of the NIST14 library (NIST, Gaithersburg, MD, USA), (ii) mass spectral data acquired with a Shimadzu GCMS QP-2010 Ultra system with those of reference compounds and mass spectral data obtained from NIST14 library.

2.6. Statistical Analysis

2.6.1. Experimental Design

A full factorial 24 design with 16 experiments divided into two blocks was conducted to determine the key factors influencing the extraction of volatile components. These factors included the volume of extracting solvent, sonication time, salt content, and pH. During method development, peak area data relative to that of internal standard (tetradecane added after extraction) were used as response variables. As a result of the large number of volatile compounds detected in wines, we grouped them into chemical classes (EtE: ethyl esters; AcE: acetate esters; Alc: alcohols; Acd: acids; Trp: terpenes) to reduce the number of response variables. Then, the factors showing significant effects, such as volume of extracting solvent and salt content, were optimized using an I-optimal design consisting of 22 experiments. Response surface methodology was employed to find the optimum factor levels for each response variable. Finally, the factors’ levels were optimized using the desirability function under certain criteria for each response variable. The experimental design and analysis were carried out with Design-Expert version 11 software (Stat-Ease Inc., Minneapolis, MN, USA).

2.6.2. Statistics of Wine Samples

Significant differences between the volatile compounds of laboratory-produced wines were evaluated by ANOVA and Tukey’s HSD test. Permutational multivariate analysis of variance (PERMANOVA) was used to compare volatile compounds produced by different S. cerevisiae strains. Euclidean distance metric was used to calculate pairwise distances, and 9999 permutations were randomly sampled to compute F-statistics. Statistical data processing was conducted with PAST [44] and JMP, version 8 (SAS Institute Inc., Cary, NC, USA).

3. Results and Discussion

Several factors, such as the type and volume of extraction solvent, pH, ionic strength, temperature, volume ratio of sample to solvent, and centrifugation time, can affect the efficacy of the USAEME procedure, particularly in terms of achieving a desirable recovery for the target analytes [1,22,40]. Dispersion solvents are not commonly used in the USAEME method because they decrease the partition coefficient of the analytes in the extraction solvent and might introduce additional compounds into the extraction system, leading to eventual interferences in the chromatographic analysis [45]. Prior to employing the USAEME procedure for the determination of volatile compounds in wine, it was essential to select the factors that impact the efficiency of the method. Following this, the optimal conditions associated with the key factors influencing the extraction process were determined. Finally, the developed method was assessed by applying it to the analysis of the wine samples fermented in our laboratory.

3.1. Preliminary Experiments: Selection of Extraction Solvent

Recovering the desired target analytes requires the selection of an appropriate extraction solvent. A higher density than that of water, a low solubility in water, a high extraction efficiency for the target analytes, and good chromatographic behavior are common requirements for extraction solvents [46]. Various solvents, such as hexane, methyl isobutyl ketone, petroleum ether, ethyl ether, and dichloromethane, have previously been tested as regards their suitability for the liquid–liquid extraction of the wine volatile fraction. Among them, dichloromethane has provided the best results and is the most frequently used solvent for the isolation of wine volatiles [7,47,48]. Chloroform has been employed for the extraction of selected volatile compounds, such as volatile phenols and haloanisoles [22,40]. Thus, chloroform and dichloromethane were considered as extraction solvents in the present study. Extractions were performed by combining 5 mL of commercial white wine with 450 μL of each extraction solvent at two distinct salt concentrations (0% and 20%). The samples (n = 4) were subjected to sonication for 5 min. The analysis parameters are described in the experimental section. To evaluate if there was a statistically significant difference between chloroform and dichloromethane, a paired samples t-test was applied. Dichloromethane provided the highest responses (peak area relative to that of tetradecane) for all the chemical classes studied, i.e., ethyl esters, acetate esters, terpenes, alcohols, and acids (Figure 1). However, for the latter two classes, no significant differences were observed (p > 0.05).
It is worth noting some positive and negative points observed with the use of each solvent. As regards chromatography, the chloroform peak eluted after the ethanol peak, which resulted in the masking of the ethyl butanoate and 1-propanol peaks. On the contrary, the dichloromethane peak coeluted with the ethanol peak and did not interfere with the analysis. As regards the separation of the organic from the aqueous phase, dichloromethane resulted in a smaller volume of the sedimented phase due to its higher water solubility as compared to chloroform. The identification of the peaks that eluted before both solvents, such as acetaldehyde and ethyl acetate, was rather uncertain due to the solvents’ impurities and these peaks were not further examined. Considering all the above-mentioned results, dichloromethane was chosen as the extraction solvent for the subsequent optimization steps of the method.

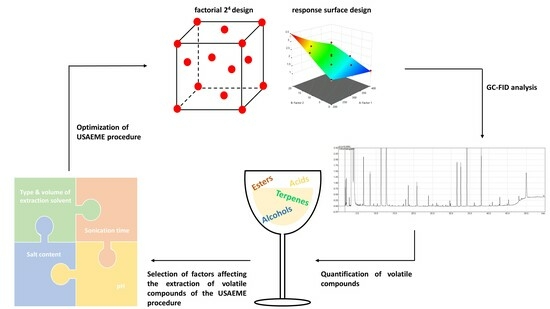
3.2. Optimization of USAEME Procedure

3.2.1. Screening Design

A two-level full (or fractional) factorial design, wherein each factor is experimentally investigated at only two levels, is the most commonly used first-order design. Because they are simple and relatively low-cost, full factorial designs are highly useful for preliminary studies or in the initial steps of optimization. Consequently, a factorial 24 design was built to determine the key factors influencing the extraction of volatile components. The factors and their levels, which were selected according to preliminary experiments taking instrumental and operative limits into consideration, were the volume of extraction solvent (150 μL and 450 μL), sonication time (0 min and 5 min), salt (NaCl) content (0% and 20% m/v), and sample pH (3 and 4). Wine pH values range from 2.8 to 4.0 [49], with most white wines requiring a pH between 3.1 and 3.4 [50]. Targeting a range typically related to wine production, pH levels of 3 and 4 were selected. The experimental runs (n = 16) were randomized to reduce the effect of uncontrolled variables and divided equally into two blocks, processed in two consecutive days. A commercial white wine (Moschofilero variety) was used as a sample matrix with a fixed volume (5 mL) for each run. A preliminary model was built for each volatile compound studied to estimate its main effects. We observed that compounds belonging to the same chemical class exhibited similar behavior during extraction, except in a few cases (acetic acid, ethyl lactate). The best model and the significance value of each term are presented in Table S1. Thus, to simplify the analysis, the volatiles were grouped into classes by calculating the sum of the peak areas of ethyl esters (ethyl butanoate, ethyl hexanoate, ethyl octanoate, ethyl decanoate, diethyl succinate, ethyl dec-9-enoate), acetate esters (3-methylbutyl acetate, hexyl acetate, 2-phenylethyl acetate), alcohols (1-propanol, 2-methyl-1-propanol, 3-methyl-1-butanol, 1-hexanol, (Z)-3-hexen-1-ol, 2,3-butanediol, 2-phenylethanol), acids (hexanoic acid, octanoic acid, decanoic acid), and terpenes (cis-linalool oxide, linalool, α-terpineol, citronellol, nerol, geraniol) relative to the peak area of the internal standard (tetradecane, added after extraction) and used as response variables. Also, ethyl lactate and acetic acid were examined separately for the reasons described previously. The design matrix and the responses are presented in Table 1.
The procedure to analyze the factorial model was as follows: Significant effects were identified and separated from insignificant effects and pure error using the half-normal probability plot, which is the default and recommended method of Design–Expert software. An initial model was built for each response variable and validated by examining the various diagnostic plots of residuals (Figure S1). After applying the suggested transformation to the response variables according to the Box–Cox plot (Figure S2), the above steps were repeated to refine the models. ANOVA was applied to determine the statistical significance of the developed models. The magnitude of the effects for each studied response variable is presented in Pareto charts (Figure 2). It is evident that the volume of extraction solvent (bar A) exerted the most significant effect in all cases, except for ethyl lactate and acetic acid, as the t-value of its absolute effect exceeds the Bonferroni limit. Specifically, when the volume of extraction solvent increased, the relative content of each volatile class decreased. Similarly, a significantly negative effect was also observed for the salt content factor (bar C) in the case of ethyl esters, acetate esters, and terpenes. Their relative content decreased with the increase in the amount of salt added to the wine before extraction. On the contrary, the relative content of alcohols, ethyl lactate, and acetic acid increased. Sonication time and pH had no significant effect on the extraction process. The above observations are also provided by means of the main effects plots (Figure S3). Analysis of variance (ANOVA) indicated that the selected models were highly significant (p < 0.0001) for all response variables.
Factorial designs are usually employed for screening significant factors. However, the related models are rather restricted because these designs only use two levels for each factor. Therefore, for the determination of the optimal combination of experimental conditions, it is necessary to employ second-order models (response surface designs), which use more than two levels and allow for the fitting of a full quadratic polynomial.

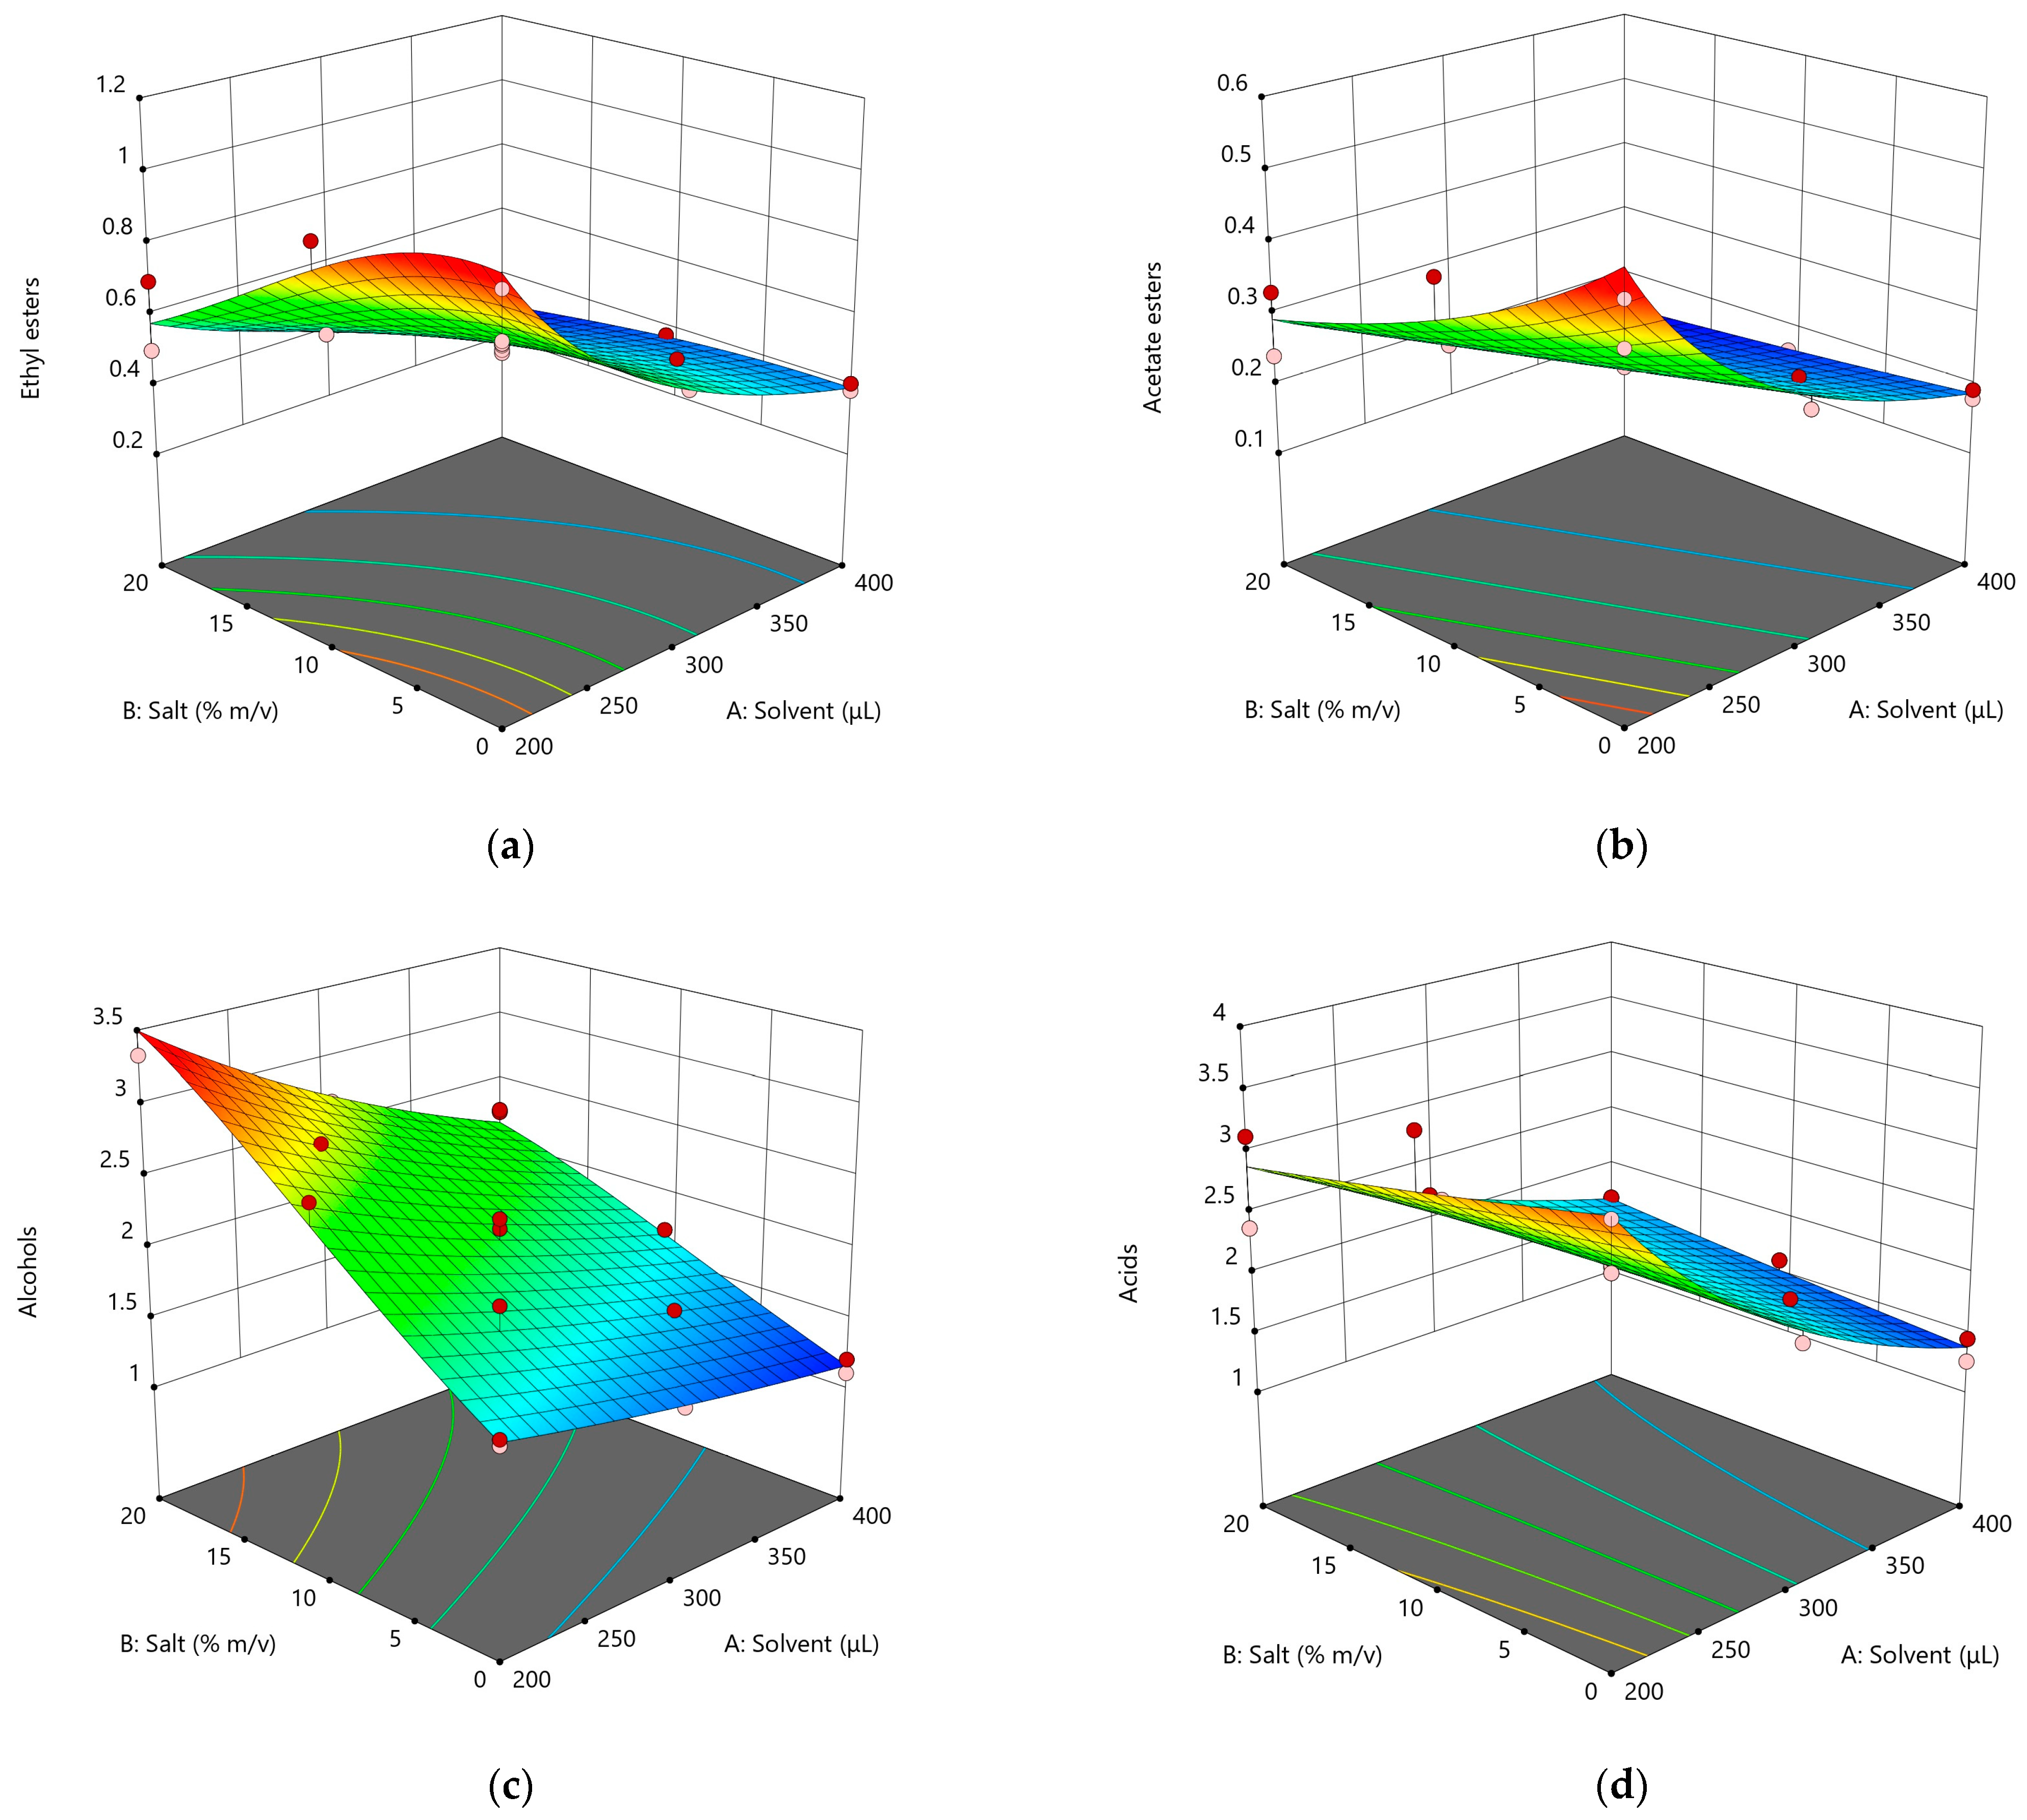
3.2.2. Response Surface Design

Optimization was required to achieve the best response for the two key factors, namely the volume of extraction solvent and salt content, as determined by the screening design. Hence, the response surface methodology (RSM) was employed to evaluate the correlations between the experimental responses and the two factors at multiple levels. It should be noted here that we increased the lower limit of the extraction solvent from 150 μL, used in the screening experiment, to 200 μL, because the volume of the sedimented organic phase was quite low (<30 μL) after centrifugation and it was impractical to manage. Also, the upper limit of the extraction solvent was decreased to 400 μL (from 450 μL) as this factor had only produced negative effects. The experiment was conducted through an I-optimal design instead of classical designs (e.g., central composite design) due to the presence of factor constraints, such as the lowest limit of the amount of salt and the lowest and highest limit of extraction solvent. Since our goal was to find the level of factors that optimize the response, the I-optimality criterion was chosen, which minimizes the average prediction variance across the design region and produces a more precise prediction than the D-criterion [51]. The design consisted of twenty-two experimental runs, including six central points. These experiments were conducted by varying the levels of the selected factors in the following ranges: (a) volume of extraction solvent: 200–400 μL and (b) salt content: 0–20% (Table S2). To minimize potential variations that might occur during the experiment, the runs were conducted in two separate blocks over two consecutive days.
After data collection, several models (linear, linear with two factor interaction—2FI, quadratic, and cubic) were built for each response variable using regression analysis. The best model was chosen based on its statistical significance (p-value < 0.05) and an insignificant lack-of-fit test (p > 0.05). An analysis of residuals indicated that a transformation should be applied to all response variables, according to the Box–Cox tool of the Design–Expert software (Figure S4). After applying the recommended mathematical function and removing the nonsignificant terms, except those to preserve hierarchy, a refined model was built for each response. ANOVA confirmed the adequacy of the linear, quadratic, and 2FI models for the two factors examined herein (volume of extraction solvent and salt content). The model’s high significance is evident from its low p-value and high F-value, which ranged from 89.98 to 241.95, implying that there was only a 0.01% chance that an F-value this large could have occurred due to noise (Table 2). Additionally, the lack-of-fit test was not significant (p > 0.05) for all cases, which shows that the model was valid. The quality of fit was evaluated by the coefficient of determination (R2), the adjusted R2, and the predicted R2, which were found to be higher than 0.9 in most cases. The low value of the coefficient of variation (CV < 10%) also demonstrated the model’s high level of accuracy and reliability. The validity of ANOVA as well as the detection of outliers were evaluated by checking the various model diagnostic plots, such as the normal probability plot of externally studentized residuals, the plot of residuals versus the ascending predicted response values, the residuals versus experimental run order plot, the residuals versus levels of each factor plot, the Cook’s distance plot, and the leverages plot (Figure S5).
Figure 3 presents the response surface plots obtained for the interactions between salt content and volume of extraction solvent on the response variables. It seems that the relative content of ethyl esters, acetate esters, acids, and terpenes increased with the simultaneous decrease in the volume of extraction solvent and salt content (Figure 3a,b,d,e). On the contrary, the relative content of alcohols (including 3-methyl-1-butanol), ethyl lactate, and acetic acid (Figure 3c,f,g,h) presented a maximum value when the salt content increased and the volume of extraction solvent decreased. Probably, the pronounced desalting effect on the latter compounds could be explained by their ability to form hydrogen bonds with water molecules. In the presence of higher salt concentrations, the ions interact with water molecules and hinder the solvation of these compounds. However, this phenomenon was not noticed in the case of acids with more carbon atoms, such as octanoic and decanoic acid.

3.3. Multiple Response Optimization

When the optimization of a method involves more than one response, an overall compromise solution should be found according to the researcher’s criteria and desires for each variable of the system. For this reason, Derringer’s desirability function was employed to find the factor levels that simultaneously achieve the optimal value for all the studied variables according to the following criteria: The goal for all variables was set to maximize the response, except for 3-methyl-1-butanol, whose response was set to range between the limits observed during model development. This can be justified by the fact that 3-methyl-1-butanol is the major fusel alcohol of wines, and it will always be present in their extracts, independently of experimental conditions. Furthermore, a higher relative importance was given to the goals of ethyl esters, acetate esters, and terpenes than to acids and alcohols, as these three classes of compounds are the most important contributors to wine aroma [50].
The desirability function ranges from d = 0, representing an undesirable response, to d = 1, indicating a fully desirable response [52]. According to the previously discussed criteria, the optimization procedure resulted in 13 solutions, with desirability ranging from 0.850 to 0.891. For all solutions, the volume of extraction solvent was equal to 200 μL (the lower limit in this study), whereas for the first seven solutions, the salt content ranged from 4.7% to 5.4% and desirability was the highest (0.891). The response surface obtained for the global desirability function is presented in Figure 4. It can be observed that the desirability is zero when the volume of extraction solvent and the salt content are set at the upper level (400 μL and 20% m/v, respectively). The desirability increases as the volume of extraction solvent decreases, and it decreases as the salt content increases, reaching the highest value (0.891) under the following optimum extraction conditions: volume of extraction solvent 200 μL, salt content 5% m/v, sample pH not adjusted (should lie between 3 and 4) and sonication time 5 min.
To confirm that the developed model could make valid predictions, four additional extraction trials were run with the two factors set at their optimum levels. The settings for sonication time and pH were the same as those used in the response surface design (i.e., 5 min and not adjusted, respectively). According to Table S3, the experimental mean of each response studied lies within the 95% prediction interval, which indicates that the model is confirmed.

3.4. Evaluation of the Methodology

3.4.1. Performance of the Analytical Method

The suitability of the proposed method for the quantification of volatile compounds in white wines was evaluated under optimal experimental conditions. This was achieved by studying its linearity, limits of detection (LOD) and quantification (LOQ), repeatability, and recovery. The linearity range was determined using synthetic wine spiked with the target compounds listed in Table 3. The calibration curve was developed using six concentration levels of the target compounds. Three replicate extractions and analyses were performed at each level. Calibration curves showed good linearity for all the target compounds, with coefficients of determination (R2) higher than 0.995 in all cases (Table 3). LOD was calculated from the calibration curve using the formula LOD = 3.3 × (SEa/m), where SEa is the standard error of the intercept and m is equal to the slope of the regression line. For the LOQ calculation, a factor of 10 was applied instead of 3.3. The LODs obtained were lower than 18 μg L−1 for all chemical classes studied, except for acetic, butanoic, and hexanoic acids, as well as the major volatile compounds (1-propanol, 2-methyl-1-propanol, 3-methyl-1-butanol, 2-phenylethanol, and 3-methylbutyl acetate), which presented higher values. The optimized method was applied to spiked and unspiked commercial wine samples by performing twelve extractions (in total) on the same day. The target analytes were spiked at a single concentration level: 0.5 mg L−1 for the group of esters, alcohols, terpenes, and γ-butyrolactone; 2 mg L−1 for the group of acids; 100 mg L−1 for the 1-propanol and 2-methyl-1-propanol; 150 mg L−1 for the 3-methyl-1-butanol; 4000 mg L−1 for acetic acid; and 4 mg L−1 for 2-phenylethanol and 3-methylbutyl acetate. Repeatability values were lower than 8.4% in all cases except for d-limonene and p-cymene (Table 3). Recoveries higher than 82% were observed in the groups of ethyl esters, acetate esters, and alcohols and terpenoid alcohols (linalool, α-terpineol). The recovery of acids ranged from 70.5% to 88.9%, whereas the three monoterpenes studied (d-limonene, γ-terpinene, p-cymene) were not extracted satisfactorily (approximately 35% recovery) (Table 3).

3.4.2. Application of the USAEME Method to White Wines

The optimized USAEME procedure developed herein was effectively employed for the analysis of volatile compounds in wines produced by laboratory-scale fermentations with selected strains of Saccharomyces cerevisiae. A total of 29 volatile compounds were determined in the wines analyzed (Table 4). Higher alcohols are usually the most abundant group of volatile compounds in alcoholic beverages [2], as in the wines analyzed, in which carboxylic acids were found at greater levels mainly due to the elevated levels of acetic acid. Sc1 wines displayed elevated levels of 1-propanol and 1-butanol compared to the other wines, whereas Sc2 and Sc4 wines yielded increased concentrations of 2-phenylethylethanol and 3-methyl-1-butanol, respectively.
Carboxylic acids, following alcohols, were the second group with high total concentrations (not accounting acetic acid). Sc1 wines exhibited high concentrations of total carboxylic acids, mostly due to increased levels of hexanoic acid, followed by Sc3 wines, which contained elevated levels of decanoic acid. Additionally, both wines showed similar concentrations of octanoic acid at significantly higher levels compared to Sc2 and Sc4. The observed differences in the concentrations of carboxylic acids between Sc2 and Sc4 wines were not significant. Acetic acid was higher in Sc2 wines, followed by Sc1, while no difference was noted in the concentrations of acetic acid in Sc3 and Sc4 wines. Our findings align with prior investigations, indicating that the production of carboxylic acids exhibits strain variability [53,54,55,56].
Esters were the most numerous group of volatile compounds in the wines produced, with a total of ten compounds quantified. The most important esters influencing wine flavor are ethyl octanoate, ethyl hexanoate, ethyl propanoate, ethyl butanoate, ethyl acetate, 3-methylbutyl acetate, and 2-phenylethyl acetate [2,57]. Only Sc3 wines showed statistically significant differences in the levels of esters as compared to the other wines. There were significant differences in the amounts of ethyl butanoate, ethyl hexanoate, ethyl octanoate, isobutyl acetate, isoamyl acetate, and 2-phenylethyl acetate.
Terpenes are considered to originate from grapes and are associated with the odor of many flowers, fruits, seeds, leaves, woods, and roots [50]. As shown in Table 4, two terpenes (linalool and α-terpineol) were identified in the wines analyzed. Their greatest content was observed in Sc3 wines. Sc2 and Sc3 wines showed similar concentrations of γ-butyrolactone, which were significantly higher compared to those of Sc1 and Sc4 wines.
PERMANOVA revealed statistically significant variations in the volatile compounds of different S. cerevisiae strains (F = 127, p = 0.0088). Sc1 wines exhibited the most distinct volatile profile among the ferments studied, as evidenced by their F-values, which ranged from 109 to 482.8. Sc2 wine followed, with F-values ranging from 100 to 243. The volatile compounds of Sc3 and Sc4 were similar to each other (F = 4.2) but not to other ferments.

4. Conclusions

The current study established a methodology for the analysis of the volatile fraction of white wines using ultrasound-assisted emulsification microextraction (USAEME) in conjunction with GC-FID. This approach eliminates the usage of large sample volumes and organic solvents, which is in line with the trend toward environmentally friendly chemistry. For this purpose, the primary factors influencing the recovery of the target compounds were investigated and optimized using experimental design and response surface methodology enhanced by the application of the desirability function. Once optimized, the satisfactory results obtained in terms of linearity, repeatability, detection, and quantification limits validated the method’s applicability for the analysis of volatile compounds in wine. The optimized method was effectively applied for the determination of volatile compounds in laboratory-scale fermentations with selected strains of Saccharomyces cerevisiae.

Supplementary Materials

The following supporting information can be downloaded at: https://0-www-mdpi-com.brum.beds.ac.uk/article/10.3390/separations10100525/s1, Figure S1: Diagnostic plots of the 24 factorial model built for each response variable [(a) ethyl esters, (b) acetate esters, (c) alcohols, (d) acids, (e) terpenes, (f) ethyl lactate, and (g) acetic acid]; Figure S2: Box–Cox power transformation plots of ethyl esters, acetate esters, alcohols, acids, terpenes, ethyl lactate, and acetic acid; Figure S3: Effect of the volume of extraction solvent and salt content on the relative response of (a) ethyl esters, (b) acetate esters, (c) alcohols, (d) acids, (e) terpenes, (f) ethyl lactate, and (g) acetic acid; Figure S4: Box–Cox power transformation plots of ethyl esters, acetate esters, alcohols, acids, terpenes, 3-methyl-1-butanol, ethyl lactate, and acetic acid; Figure S5: Diagnostic plots indicating the model’s adequacy for each response variable [(a) ethyl esters, (b) acetate esters, (c) alcohols, (d) acids, (e) terpenes, (f) 3-methyl-1-butanol, (g) ethyl lactate, and (h) acetic acid]; Table S1: Probability values of the full factorial model built for each volatile compound extracted with the USAEME procedure; Table S2: Experimental conditions and responses obtained with the I-optimal design; Table S3: Confirmation of the proposed method’s adequacy.

Author Contributions

Conceptualization, methodology, supervision, resources, A.M., A.N. and G.B.; investigation, data curation, formal analysis, writing—original draft preparation, I.C. and A.M.; writing—review and editing, I.C., A.N., G.B. and A.M. All authors have read and agreed to the published version of the manuscript.

Funding

This research received no external funding.

Data Availability Statement

The datasets generated in this study are available on request to the corresponding author.

Acknowledgments

This research work was supported by the Hellenic Foundation for Research and Innovation (HFRI) under the HFRI PhD Fellowship grant (fellowship number: 1233) awarded to I.C.

Conflicts of Interest

The authors declare no conflict of interest.

References

  1. Jofré, V.P.; Assof, M.V.; Fanzone, M.L.; Goicoechea, H.C.; Martínez, L.D.; Silva, M.F. Optimization of Ultrasound Assisted-Emulsification-Dispersive Liquid-Liquid Microextraction by Experimental Design Methodologies for the Determination of Sulfur Compounds in Wines by Gas Chromatography-Mass Spectrometry. Anal. Chim. Acta 2010, 683, 126–135. [Google Scholar] [CrossRef]
  2. Lambrechts, M.G.; Pretorius, I.S. Yeast and Its Importance to Wine Aroma—A Review. S. Afr. J. Enol. Vitic. 2000, 21, 97–129. [Google Scholar] [CrossRef]
  3. Andujar-Ortiz, I.; Moreno-Arribas, M.V.; Martín-Álvarez, P.J.; Pozo-Bayón, M.A. Analytical Performance of Three Commonly Used Extraction Methods for the Gas Chromatography-Mass Spectrometry Analysis of Wine Volatile Compounds. J. Chromatogr. A 2009, 1216, 7351–7357. [Google Scholar] [CrossRef]
  4. Costa Freitas, A.M.; Gomes da Silva, M.D.R.; Cabrita, M.J. Sampling Techniques for the Determination of Volatile Components in Grape Juice, Wine and Alcoholic Beverages. Compr. Sampl. Sample Prep. Anal. Tech. Sci. 2012, 4, 27–41. [Google Scholar] [CrossRef]
  5. Villamor, R.R.; Ross, C.F. Wine Matrix Compounds Affect Perception of Wine Aromas. Annu. Rev. Food Sci. Technol. 2013, 4, 1–20. [Google Scholar] [CrossRef]
  6. Zhang, L.; Liu, Q.; Li, Y.; Liu, S.; Tu, Q.; Yuan, C. Characterization of Wine Volatile Compounds from Different Regions and Varieties by HS-SPME/GC-MS Coupled with Chemometrics. Curr. Res. Food Sci. 2023, 6, 100418. [Google Scholar] [CrossRef] [PubMed]
  7. Hernanz, D.; Gallo, V.; Recamales, Á.F.; Meléndez-Martínez, A.J.; Heredia, F.J. Comparison of the Effectiveness of Solid-Phase and Ultrasound-Mediated Liquid-Liquid Extractions to Determine the Volatile Compounds of Wine. Talanta 2008, 76, 929–935. [Google Scholar] [CrossRef]
  8. Marín-San Román, S.; Rubio-Bretón, P.; Pérez-Álvarez, E.P.; Garde-Cerdán, T. Advancement in Analytical Techniques for the Extraction of Grape and Wine Volatile Compounds. Food Res. Int. 2020, 137, 109712. [Google Scholar] [CrossRef]
  9. Ortega-Heras, M.; González-SanJosé, M.L.; Beltrán, S. Aroma Composition of Wine Studied by Different Extraction Methods. Anal. Chim. Acta 2002, 458, 85–93. [Google Scholar] [CrossRef]
  10. Fontana, A.R.; Patil, S.H.; Banerjee, K.; Altamirano, J.C. Ultrasound-Assisted Emulsification Microextraction for Determination of 2,4,6-Trichloroanisole in Wine Samples by Gas Chromatography Tandem Mass Spectrometry. J. Agric. Food Chem. 2010, 58, 4576–4581. [Google Scholar] [CrossRef] [PubMed]
  11. Demirhan, B.; Kara, H.E.Ş.; Demirhan, B.E. Overview of Green Sample Preparation Techniques in Food Analysis. In Ideas and Applications Toward Sample Preparation for Food and Beverage Analysis; IntechOpen: London, UK, 2017. [Google Scholar] [CrossRef]
  12. Fontana, A.R.; Muñoz De Toro, M.; Altamirano, J.C. One-Step Derivatization and Preconcentration Microextraction Technique for Determination of Bisphenol a in Beverage Samples by Gas Chromatography-Mass Spectrometry. J. Agric. Food Chem. 2011, 59, 3559–3565. [Google Scholar] [CrossRef]
  13. Puertas, B.; Jimenez-Hierro, M.J.; Cantos-Villar, E.; Marrufo-Curtido, A.; Carbú, M.; Cuevas, F.J.; Moreno-Rojas, J.M.; González-Rodríguez, V.E.; Cantoral, J.M.; Ruiz-Moreno, M.J. The Influence of Yeast on Chemical Composition and Sensory Properties of Dry White Wines. Food Chem. 2018, 253, 227–235. [Google Scholar] [CrossRef]
  14. Wei, Z.; Liu, X.; Huang, Y.; Lu, J.; Zhang, Y. Volatile Aroma Compounds in Wines from Chinese Wild/Hybrid Species. J. Food Biochem. 2019, 43, 12684. [Google Scholar] [CrossRef]
  15. Knight, S.; Klaere, S.; Fedrizzi, B.; Goddard, M.R. Regional Microbial Signatures Positively Correlate with Differential Wine Phenotypes: Evidence for a Microbial Aspect to Terroir. Sci. Rep. 2015, 5, srep14233. [Google Scholar] [CrossRef]
  16. Gamero, A.; Wesselink, W.; de Jong, C. Comparison of the Sensitivity of Different Aroma Extraction Techniques in Combination with Gas Chromatography-Mass Spectrometry to Detect Minor Aroma Compounds in Wine. J. Chromatogr. A 2013, 1272, 1–7. [Google Scholar] [CrossRef]
  17. Cabredo-Pinillos, S.; Cedrón-Fernández, T.; González-Briongos, M.; Puente-Pascual, L.; Sáenz-Barrio, C. Ultrasound-Assisted Extraction of Volatile Compounds from Wine Samples: Optimisation of the Method. Talanta 2006, 69, 1123–1129. [Google Scholar] [CrossRef]
  18. Ubeda, C.; Callejón, R.M.; Troncoso, A.M.; Peña-Neira, A.; Morales, M.L. Volatile Profile Characterisation of Chilean Sparkling Wines Produced by Traditional and Charmat Methods via Sequential Stir Bar Sorptive Extraction. Food Chem. 2016, 207, 261–271. [Google Scholar] [CrossRef] [PubMed]
  19. Tredoux, A.; De Villiers, A.; Májek, P.; Lynen, F.; Crouch, A.; Sandra, P. Stir Bar Sorptive Extraction Combined with GC-MS Analysis and Chemometric Methods for the Classification of South African Wines According to the Volatile Composition. J. Agric. Food Chem. 2008, 56, 4286–4296. [Google Scholar] [CrossRef]
  20. Fang, Y.; Qian, M.C. Quantification of Selected Aroma-Active Compounds in Pinot Noir Wines from Different Grape Maturities. J. Agric. Food Chem. 2006, 54, 8567–8573. [Google Scholar] [CrossRef] [PubMed]
  21. Marín-San Román, S.; Carot-Sierra, J.M.; Sáenz de Urturi, I.; Rubio-Bretón, P.; Pérez-Álvarez, E.P.; Garde-Cerdán, T. Optimization of Stir Bar Sorptive Extraction (SBSE) and Multi-Stir Bar Sorptive Extraction (MSBSE) to Improve Must Volatile Compounds Extraction. Lwt 2022, 172, 114182. [Google Scholar] [CrossRef]
  22. Pizarro, C.; Sáenz-González, C.; Pérez-del-Notario, N.; González-Sáiz, J.M. Ultrasound-Assisted Emulsification-Microextraction for the Sensitive Determination of Brett Character Responsible Compounds in Wines. J. Chromatogr. A 2011, 1218, 8975–8981. [Google Scholar] [CrossRef] [PubMed]
  23. Reboredo-Rodríguez, P.; Rey-Salgueiro, L.; Regueiro, J.; González-Barreiro, C.; Cancho-Grande, B.; Simal-Gándara, J. Ultrasound-Assisted Emulsification-Microextraction for the Determination of Phenolic Compounds in Olive Oils. Food Chem. 2014, 150, 128–136. [Google Scholar] [CrossRef]
  24. Kiejza, D.; Kotowska, U.; Polińska, W.; Karpińska, J. USAEME-GC/MS Method for Easy and Sensitive Determination of Nine Bisphenol Analogues in Water and Wastewater. Molecules 2022, 27, 4977. [Google Scholar] [CrossRef]
  25. Vila, M.; Pablo Lamas, J.; Garcia-Jares, C.; Dagnac, T.; Llompart, M. Ultrasound-Assisted Emulsification Microextraction Followed by Gas Chromatography-Mass Spectrometry and Gas Chromatography-Tandem Mass Spectrometry for the Analysis of UV Filters in Water. Microchem. J. 2016, 124, 530–539. [Google Scholar] [CrossRef]
  26. Regueiro, J.; Llompart, M.; Garcia-Jares, C.; Garcia-Monteagudo, J.C.; Cela, R. Ultrasound-Assisted Emulsification-Microextraction of Emergent Contaminants and Pesticides in Environmental Waters. J. Chromatogr. A 2008, 1190, 27–38. [Google Scholar] [CrossRef] [PubMed]
  27. Becerril-Bravo, E.; Pablo Lamas, J.; Sanchez-Prado, L.; Lores, M.; Garcia-Jares, C.; Jimenez, B.; Llompart, M. Ultrasound-Assisted Emulsification-Microextraction of Fragrance Allergens in Water. Chemosphere 2010, 81, 1378–1385. [Google Scholar] [CrossRef]
  28. Pérez-Outeiral, J.; Millán, E.; Garcia-Arrona, R. Ultrasound-Assisted Emulsification Microextraction Coupled with High-Performance Liquid Chromatography for the Simultaneous Determination of Fragrance Allergens in Cosmetics and Water. J. Sep. Sci. 2015, 38, 1561–1569. [Google Scholar] [CrossRef] [PubMed]
  29. Najafi, N.M.; Tavakoli, H.; Abdollahzadeh, Y.; Alizadeh, R. Comparison of Ultrasound-Assisted Emulsification and Dispersive Liquid-Liquid Microextraction Methods for the Speciation of Inorganic Selenium in Environmental Water Samples Using Low Density Extraction Solvents. Anal. Chim. Acta 2012, 714, 82–88. [Google Scholar] [CrossRef]
  30. Ma, J.J.; Du, X.; Zhang, J.W.; Li, J.C.; Wang, L.Z. Ultrasound-Assisted Emulsification-Microextraction Combined with Flame Atomic Absorption Spectrometry for Determination of Trace Cadmium in Water Samples. Talanta 2009, 80, 980–984. [Google Scholar] [CrossRef]
  31. Ferreira, V.J.; De Jesus, M.S.; Dos Santos, M.C.; Guedes, W.N.; Lemos, V.A.; Novaes, C.G.; Costa, F.S.; Pacheco, C.S.V.; Da Silva, E.G.P.; Amorim, F.A.C. Multivariate Optimization of Ultrasound-Assisted Liquid-Liquid Microextraction Based on Two Solvents for Cadmium Preconcentration Prior to Determination by Flame Atomic Absorption Spectrometry. Anal. Methods 2021, 13, 267–273. [Google Scholar] [CrossRef]
  32. Nunes, L.S.; Lemos, V.A. Ultrasound-Assisted Emulsification Microextraction in an Online System for Determination of Cadmium in Water and Tea Samples. J. AOAC Int. 2018, 101, 1647–1652. [Google Scholar] [CrossRef] [PubMed]
  33. Hryniewicka, M.; Starczewska, B.; Tkaczuk, N. Simple Approach Based On Ultrasound-Assisted Emulsification Microextraction For Determination Of β-Sitosterol In Dietary Supplements And Selected Food Products. Microchem. J. 2020, 155, 104775. [Google Scholar] [CrossRef]
  34. Liao, Q.G.; Li, W.H.; Luo, L.G. Ultrasound-Assisted Emulsification-Microextraction for the Sensitive Determination of Ethyl Carbamate in Alcoholic Beverages. Anal. Bioanal. Chem. 2013, 405, 6791–6797. [Google Scholar] [CrossRef] [PubMed]
  35. Cortada, C.; Vidal, L.; Canals, A. Determination of Geosmin and 2-Methylisoborneol in Water and Wine Samples by Ultrasound-Assisted Dispersive Liquid-Liquid Microextraction Coupled to Gas Chromatography-Mass Spectrometry. J. Chromatogr. A 2011, 1218, 17–22. [Google Scholar] [CrossRef] [PubMed]
  36. You, X.; Wang, S.; Liu, F.; Shi, K. Ultrasound-Assisted Surfactant-Enhanced Emulsification Microextraction Based on the Solidification of a Floating Organic Droplet Used for the Simultaneous Determination of Six Fungicide Residues in Juices and Red Wine. J. Chromatogr. A 2013, 1300, 64–69. [Google Scholar] [CrossRef] [PubMed]
  37. Garcia-Jares, C.; Celeiro, M.; Lamas, J.P.; Iglesias, M.; Lores, M.; Llompart, M. Rapid Analysis of Fungicides in White Wines from Northwest Spain by Ultrasound-Assisted Emulsification-Microextraction and Gas Chromatography-Mass Spectrometry. Anal. Methods 2014, 6, 3108–3116. [Google Scholar] [CrossRef]
  38. Peña, R.M.; Barciela, J.; Herrero, C.; García-Martín, S. Comparison of Ultrasound-Assisted Extraction and Direct Immersion Solid-Phase Microextraction Methods for the Analysis of Monoterpenoids in Wine. Talanta 2005, 67, 129–135. [Google Scholar] [CrossRef]
  39. Pizarro, C.; Sáenz-González, C.; Pérez-del-Notario, N.; González-Sáiz, J.M. Development of an Ultrasound-Assisted Emulsification-Microextraction Method for the Determination of the Main Compounds Causing Cork Taint in Wines. J. Chromatogr. A 2012, 1229, 63–71. [Google Scholar] [CrossRef]
  40. Pizarro, C.; Sáenz-González, C.; Pérez-del-Notario, N.; González-Sáiz, J.M. Optimisation of a Sensitive Method Based on Ultrasound-Assisted Emulsification-Microextraction for the Simultaneous Determination of Haloanisoles and Volatile Phenols in Wine. J. Chromatogr. A 2012, 1244, 37–45. [Google Scholar] [CrossRef]
  41. Chalvantzi, I.; Banilas, G.; Tassou, C.; Nisiotou, A. Biogeographical Regionalization of Wine Yeast Communities in Greece and Environmental Drivers of Species Distribution at a Local Scale. Front. Microbiol. 2021, 12, 705001. [Google Scholar] [CrossRef]
  42. Esteve-Zarzoso, B.; Belloch, C.; Uruburu, F.; Querol, A. Identification of Yeasts by RFLP Analysis of the 5.8S RRNA Gene and the Two Ribosomal Internal Transcribed Spacers. Int. J. Syst. Bacteriol. 1999, 49, 329–337. [Google Scholar] [CrossRef] [PubMed]
  43. Legras, J.L.; Karst, F. Optimisation of Interdelta Analysis for Saccharomyces Cerevisiae Strain Characterisation. FEMS Microbiol. Lett. 2003, 221, 249–255. [Google Scholar] [CrossRef] [PubMed]
  44. Hammer, D.A.T.; Ryan, P.D.; Hammer, Ø.; Harper, D.A.T. Past: Paleontological Statistics Software Package for Education and Data Analysis. Palaeontol. Electron. 2001, 4, 178. [Google Scholar]
  45. Wu, C.; Liu, N.; Wu, Q.; Wang, C.; Wang, Z. Application of Ultrasound-Assisted Surfactant-Enhanced Emulsification Microextraction for the Determination of Some Organophosphorus Pesticides in Water Samples. Anal. Chim. Acta 2010, 679, 56–62. [Google Scholar] [CrossRef]
  46. Viñas, P.; Campillo, N.; López-García, I.; Hernández-Córdoba, M. Dispersive Liquid-Liquid Microextraction in Food Analysis. A Critical Review Microextraction Techniques. Anal. Bioanal. Chem. 2014, 406, 2067–2099. [Google Scholar] [CrossRef]
  47. Priser, C.; Etiévant, P.X.; Nicklaus, S.; Brun, O. Representative Champagne Wine Extracts for Gas Chromatography Olfactometry Analysis. J. Agric. Food Chem. 1997, 45, 3511–3514. [Google Scholar] [CrossRef]
  48. Ortega, C.; López, R.; Cacho, J.; Ferreira, V. Fast Analysis of Important Wine Volatile Compounds—Development and Validation of a New Method Based on Gas Chromatographic-Flame Ionisation Detection Analysis of Dichloromethane Microextracts. J. Chromatogr. A 2001, 923, 205–214. [Google Scholar] [CrossRef]
  49. Ribereau-Gayon, P.; Glories, Y.; Dubourdieu, D.; Maujean, A. Handbook of Enology, Volume 2: The Chemistry of Wine Stabilization and Treatments, 2nd ed.; Wiley: Hoboken, NJ, USA, 2006; ISBN 9780470010389. [Google Scholar]
  50. Jackson, R.S. Wine Science. In Principles and Applications, 3rd ed.; Academic Press: San Diego, CA, USA, 2008; ISBN 9780123736468. [Google Scholar]
  51. Smucker, B.; Krzywinski, M.; Altman, N. Optimal Experimental Design. Nat. Methods 2018, 15, 559–560. [Google Scholar] [CrossRef]
  52. Vera Candioti, L.; De Zan, M.M.; Cámara, M.S.; Goicoechea, H.C. Experimental Design and Multiple Response Optimization. Using the Desirability Function in Analytical Methods Development. Talanta 2014, 124, 123–138. [Google Scholar] [CrossRef] [PubMed]
  53. Callejon, R.M.; Clavijo, A.; Ortigueira, P.; Troncoso, A.M.; Paneque, P.; Morales, M.L. Volatile and Sensory Profile of Organic Red Wines Produced by Different Selected Autochthonous and Commercial Saccharomyces Cerevisiae Strains. Anal. Chim. Acta 2010, 660, 68–75. [Google Scholar] [CrossRef]
  54. Çelik, Z.D.; Erten, H.; Cabaroglu, T. The Influence of Selected Autochthonous Saccharomyces Cerevisiae Strains on the Physicochemical and Sensory Properties of Narince Wines. Fermentation 2019, 5, 70. [Google Scholar] [CrossRef]
  55. Liu, N.; Qin, Y.; Song, Y.Y.; Tao, Y.S.; Sun, Y.; Liu, Y.L. Aroma Composition and Sensory Quality of Cabernet Sauvignon Wines Fermented by Indigenous Saccharomyces Cerevisiae Strains in the Eastern Base of the Helan Mountain, China. Int. J. Food Prop. 2016, 19, 2417–2431. [Google Scholar] [CrossRef]
  56. Torrens, J.; Urpí, P.; Riu-Aumatell, M.; Vichi, S.; López-Tamames, E.; Buxaderas, S. Different Commercial Yeast Strains Affecting the Volatile and Sensory Profile of Cava Base Wine. Int. J. Food Microbiol. 2008, 124, 48–57. [Google Scholar] [CrossRef] [PubMed]
  57. Swiegers, J.H.; Bartowsky, E.J.; Henschke, P.A.; Pretorius, I.S. Yeast and Bacterial Modulation of Wine Aroma and Flavour. Aust. J. Grape Wine Res. 2005, 11, 139–173. [Google Scholar] [CrossRef]
Figure 1. Effect of extraction solvent (C: chloroform, D: dichloromethane) on the relative response (peak area relative to that of tetradecane) of (a) EtE: ethyl esters, (b) AcE: acetate esters, (c) Alc: alcohols, (d) Acd: acids, and (e) Trp: terpenes extracted by the USAEME method.
Separations 10 00525 g001
Figure 2. Pareto charts revealing the significant effects for the extraction of (a) ethyl esters, (b) acetate esters, (c) alcohols, (d) acids, (e) terpenes, (f) ethyl lactate, and (g) acetic acid. The vertical axis shows the t-value of the absolute effects. The highest limit (horizontal red line) is based on the Bonferroni t-value, whereas the lowest limit (black horizontal line) is based on standard t-critical values for individual effect tests. The horizontal axis indicates the rank order of the model terms. The letters above the bars denote the factors (A: volume of extraction solvent; C: salt content). The color of the bar indicates the sign of the effect (orange: positive; blue: negative) of the transformed variable. Thus, for variables with inverse transformation, the sign of the effect is the opposite in the original variable.
Separations 10 00525 g002aSeparations 10 00525 g002b
Figure 3. Response surface and contour plots obtained for the interactions between salt content and volume of extraction solvent for (a) ethyl esters, (b) acetates, (c) alcohols, (d) acids, (e) terpenes, (f) 3-methyl-1-butanol, (g) ethyl lactate, and (h) acetic acid. The graduated color shading represents the variation of the relative content of each response variable (blue: low content; red: high content) as a function of the two factors.
Separations 10 00525 g003aSeparations 10 00525 g003b
Figure 4. Response surface and contour plots for desirability as a function of the volume of extraction solvent and the salt content. The graduated color shading represents the desirability values which range from 0 (blue) to 1 (red).
Separations 10 00525 g004
Table 1. Design matrix and experimental responses of the factorial (24) design.
Model Factors 1Response (× 1000) 2
BlockRun No.ABCDEtEAcEAlcAcdTrpEthyl LactateAcetic Acid
111505031345791928047221576414150
12450020490686307803204381129
134500043632066377187649035158
14150020342629616,8804289803723233
154505032751594448131033324269
161500037734926099315792727542
1745052041027867841246262400168
18150520435222111,7392449634487227
29450520398826497828240389174
2104500032361464340103830823423
211150520323818210,4192112558451192
2121500204146788091147333437475
213450020366605531760179340109
214450504200109400186225920822
2151500046343715663253480124017
2161505046463715417251578723983
1 A: Volume of extraction solvent (μL); B: Sonication time (min); C: Salt content (% m/v); D: pH. 2 Sum of peak areas relative to tetradecane (IS): EtE: ethyl esters; AcE: acetate esters; Alc: alcohols; Acd: acids; Trp: terpenes.
Table 2. Analysis of variance (ANOVA) for the selected response surface model.
ResponseModelF-Valuep-Value 1Adjusted R2Predicted R2CV%
ModelLack of FitModelLack of Fit
Ethyl estersQuadratic133.660.6095<0.00010.76220.95930.92927.14
Acetate estersLinear166.421.07<0.00010.47320.94300.91837.67
AlcoholsQuadratic169.351.47<0.00010.31280.96370.95032.71
Acids2FI89.980.6174<0.00010.75650.93030.87263.71
TerpenesLinear241.951.46<0.00010.30370.96020.94225.88
3-Methyl-1-butanol 2Quadratic123.810.7940<0.00010.63300.94850.92507.45
Ethyl lactate 2Linear131.711.35<0.00010.34290.92890.90057.43
Acetic acid 2Linear156.220.7268<0.00010.68780.93950.91037.14
1 Considered significant when p < 0.05; 2 3-methyl-1- butanol, ethyl lactate, and acetic acid were examined individually. The former compound, due to its high concentration, would mask the effects on the other alcohols. The latter two compounds presented a very different behavior from their respective chemical classes during extraction.
Table 3. Analytical parameters of the optimized USAEME method for the determination of volatile compounds in white wines.
CompoundsHL aR2LOD (μg L−1)LOQ (μg L−1)RSD% bRecovery % c
Ethyl esters
Ethyl butanoate9600.99989.7295.382.9
Ethyl hexanoate10200.99945.4167.092.8
Ethyl octanoate9900.99971.13.28.4107.8
Ethyl decanoate9900.99972.37.06.293.2
Diethyl succinate9200.99993.7114.369.0
Acetate esters
Isobutyl acetate9800.999516.3495.686.5
Butyl acetate10100.99997.9243.187.1
3-Methylbutyl acetate10,5500.999931936.488.5
Hexyl acetate10300.99989.8307.888.1
2-Phenylethyl acetate11800.99998.3256.782.2
Alcohols
1-Propanol221,9500.999383725374.386.8
2-Methyl-1-propanol220,8500.9992962923.286.6
1-Butanol11500.999618543.788.3
3-Methyl-1-butanol408,3500.99982648002.096.3
3-Methyl-1-pentanol9500.99995.2162.399.1
1-Hexanol10600.99993.19.30.593.2
(E)-3-Hexen-1-ol9300.99995.2161.8101.4
(Z)-3-Hexen-1-ol9900.99989.8301.299.3
1-Octanol14500.999911344.494.9
2-Phenylethanol84500.9999461382.395.3
Acids
Acetic acid500,0000.9951247575005.171.5
Butanoic acid49500.99871354113.572.8
Hexanoic acid54000.9997662011.588.9
Octanoic acid35500.999910313.870.5
Decanoic acid56000.999919574.772.3
γ-Butyrolactone12400.999917537.296.1
Terpenes
d-Limonene9500.99996.52012.034.7
γ-Terpinene10200.99995.7177.733.9
p-Cymene9000.99988.62610.138.9
Linalool10200.99992.98.64.790.0
α-Terpineol10400.99989.6292.889.1
a HL: higher limit (μg L−1) of linear range. b Mean repeatability of spiked and unspiked wine samples (n = 12) expressed as relative standard deviation (RSD%). c Recovery (%) = ((Cf − Co)/Cadd) × 100, where Cf: average concentration found in spiked white wine, Co: average concentration in white wine, Cadd: concentration added to white wine.
Table 4. Volatile compounds identified by USAEME method in wines produced by laboratory-scale fermentation. Data are means of two replicate fermentations (±standard deviation). Values within each row with different superscript letters are significantly different according to Tukey’s HSD test (p < 0.05).
CompoundsSc1Sc2Sc3Sc4
Concentration (μg L−1)
Ethyl esters
Ethyl butanoate81 (10) b68 (4) b142 (15) a87 (4) b
Ethyl hexanoate48 (13) b20 (5) b195 (7) a31 (9) b
Ethyl octanoate22 (3) b11 (3) b47 (6) a19 (7) b
Ethyl decanoate3.6 (0.4) a (<LOQ)nd 23.6 (1.5) a (<LOQ)nd 2
Diethyl succinatend 210 (0) a (<LOQ)7.6 (2.1) a (<LOQ)7.6 (0.6) a (<LOQ)
Total155109395145
Acetate esters
Isobutyl acetatend 2nd 222 (1) (<LOQ)nd 2
3-Methylbutyl acetate80 (14) b (<LOQ)86 (0) b (<LOQ)546 (55) a115 (5) b
2-Phenylethyl acetate81 (4) b79 (7) b260 (24) a83 (5) b
Total161165828198
Alcohols
1-Propanol64,815 (1508) a19,096 (170) b22,506 (689) b23,878 (3108) b
2-Methyl-1-propanol13,943 (434) b19,946 (204) a20,693 (33) a19,613 (2135) a
1-Butanol739 (7) a217 (9) d268 (3) c507 (12) b
3-Methyl-1-butanol71,388 (2152) b87,859 (1274) a90,862 (1229) a96,345 (5676) a
1-Hexanol329 (17) a322 (1) a299 (9) a308 (6) a
(E)-3-Hexen-1-ol5.5 (0.4) a (<LOQ)5.7 (0.1) a (<LOQ)nd6.5 (0.7) a (<LOQ)
(Z)-3-Hexen-1-ol141 (1) a140 (1) a143 (1) a142 (1) a
2-Phenylethanol13,346 (491) b15,888 (363) a12,721 (10) b13,665 (199) b
Total164,707143,474147,492154,465
Carboxylic acids
Acetic acid516,147 (7071) b593,867 (7366)a415,929 (11,986) c417,221 (8066) c
Butanoic acid737 (31) a595 (23) a582 (73) a614 (24) a
Hexanoic acid2724 (35) a1444 (78) b1565 (14) b1454 (112) b
Octanoic acid1425 (25) a738 (24) b1400 (98) a841 (35) b
Decanoic acid244 (11) b102 (16) c738 (32) a135 (4) c
Total 15130287942853044
Terpenes
Linalool20 (0) b20 (1) b43 (10) a19 (1) b
α-Terpineol49 (2) b57 (4) b76 (7) a55 (4) b
Total697711974
Lactones
γ-Butyrolactone1967 (38) c3119 (47) a3021 (57) a2434 (36) b
1 Total concentration of carboxylic acids, excluding acetic acid. 2 nd: compound not detected (<LOD).
Disclaimer/Publisher’s Note: The statements, opinions and data contained in all publications are solely those of the individual author(s) and contributor(s) and not of MDPI and/or the editor(s). MDPI and/or the editor(s) disclaim responsibility for any injury to people or property resulting from any ideas, methods, instructions or products referred to in the content.

