1. Introduction
Inflammatory bowel disease (IBD), encompassing Crohn’s disease and ulcerative colitis, is a chronic, life-long, and relapsing disease of the gastrointestinal tract. Although its incidence is increasing globally, the precise etiology is currently unclear. The most popular hypothesis of IBD pathogenesis is that complex interactions between genetics, environmental factors, and the host immune system lead to aberrant immune responses and consequently chronic intestinal inflammation. According to epidemiological investigations, its prevalence has continually increased over the past 50 years with the highest incidence being reported in North America, the United Kingdom, and Northern Europe. However, in recent years incidence and prevalence may have stabilized in these high-incidence areas while the number of patients with IBD is rising in developing countries. This epidemiological shift likely relates to the westernization of lifestyle, changes in diet, and improved hygiene as part of socioeconomic development in those countries. Currently nearly 7 million people are estimated to be living with IBD worldwide [
1,
2,
3,
4].
Since IBD is a chronic and progressive disease, optimal treatment early in the disease course to prevent complications is of greatest importance [
5]. The use of alternative and complementary medicine for gastrointestinal disorders, particularly in the form of herbal therapies, is traditionally widespread in many Asian countries including China and India. In Western countries, such as the United States, Australia, Canada, and members of the European Union, the use of herbal medicine among patients with IBD has been adopted in recent years. It is mostly related to dissatisfaction with the results from conventional medicine, patients’ belief that their physicians have not properly identified the problem, the preference of consumers for herbal therapies, and a greater interest in alternative medicines. It is estimated that up to half of all patients with IBD use herbal medicine at some point in their disease course [
6]. In addition to all these above-mentioned factors, the improvements in the quality, efficacy, and safety of herbal medicines with the development of science and technology have projected these products into the greater limelight [
7,
8,
9].
Andrographis paniculata (Burm.f.) Nees (A. paniculata), creat or green chiretta, is an herbaceous plant, which is commonly known as the “King of Bitters” in Acanthaceae family. Andrographis has been widely used in Asian countries such as China, India, and Sri Lanka, where its extracts are used as anti-inflammatory remedies. The phytochemical analyses reveal that the main known components are diterpene lactones, principally andrographolide (AND) and its derivatives neoandrograholide (NAND) and 14-deoxy-11,12-didehydroandrographolide (DAND) (
Figure 1). Although the target of andrographolides’ direct mechanism of action in the treatment of IBD has not been fully elucidated, recent research has shown that it can exert anti-inflammatory effects via multiple pathways and multiple targets [
10].
A. paniculata extract, at either 1200 [
11] or 1800 mg [
12] daily, has been shown effective in treating IBD. Although andrographolide and its derivatives have fast intestinal absorption, their bioavailability is restricted due to their high lipophilicity and low water solubility [
13]. Additionally, several studies have shown the binding of andrographolides to plasma proteins human serum albumin and α1-acid glycoprotein protein, favoring their pharmacokinetics [
13,
14]. Furthermore, andrographolides can be released via p-glycoprotein, while biliary excretion has been shown to be a minor contributor to their low bioavailability. To improve the clinical application of this natural therapeutic solution for IBD patients two main approaches are prerequisites. Several studies have explored new delivery systems for andrographolides, which are applied to increase their dissolution or dispersibility and, accordingly, enhance their oral bioavailability. On the other hand, advanced analytical techniques have the potential to define a relationship between dose and plasma concentration, and between concentration and therapeutic effects of biologically active ingredients of
A. paniculata extract.
Through technological advancements in the last decade, the liquid chromatography (LC) has become the go-to technique for high throughput analysis of endobiotic and xenobiotics in biological samples [
15]. However, this advanced technique needs to be supported by efficient sample preparation techniques [
16]. Recently, a few papers have reported methods to quantitatively determine andrographolides in animal and human samples, in which the most sensitive assays were obtained using liquid chromatography with tandem mass spectrometric detection (LC/MS/MS) [
17,
18,
19,
20,
21,
22,
23,
24,
25]. The development of bioanalytical sample preparation procedures has become challenging over the last decade because of the need to constantly accomplish superior sensitivity, higher accuracy, and speed of analysis in complex biological samples. A closer look at the above-mentioned methods, however, reveals that most of the methods [
17,
18,
19,
20,
21,
22] used the protein precipitation procedure that does not require very extensive method development and can be implemented as a simple generic method to prepare samples from discovery pharmacokinetic studies. Still, it has relatively poor sample clean-up which can lead to compromised sensitivity of the method due to suppressing or enhancing ion production in the ionization source of the mass spectrometer. Labor-intensive liquid–liquid extraction was also used in the targeted sample preparation of andrographolides [
23]. The advantages of the procedure such as simple operation, cost-effectiveness, quick processing, and no necessity for any appliance are shadowed by the exercise of harmful solvents and the lack of amenability to automatization and thus limited throughput. Only two methods used advanced sample preparation procedures. Chen and co-workers [
24] used online solid phase extraction to achieve superior extraction efficiency of andrographolides and high sensitivity of the method although an affordable diode-array detector (DAD) was used. Moreover, this column-switching technique enabled greater automatization potential and reduced sample manipulation and the risk of its contamination. Notwithstanding these superiorities, online solid phase extraction has also several drawbacks, including the use of expensive instruments and limitations in the portability of the equipment. Furthermore, several factors should be considered in the optimization of extraction conditions. A high flow rate can be advantageous for the analyte’s enrichment factors because it can cause a shortened contact time between the analyte and the recognition site on the extraction sorbent. The high pressure of the chromatographic system is expected when the additional column is attached so the commonly used strategy is to lower the mobile phase flow rate. These concerns may influence the analysis’s time. Zhao and co-workers [
25] applied the cloud point extraction of andrographolides from human plasma. It is based on surfactant solutions that become cloudy and separate into two isotropic phases. It has several merits over other sample preparation procedures as it does not require the utilization of organic solvents; still matrix effects should be evaluated when combined with LC-MS.
One of the growing trends in the bioanalytical community is the implementation of green chemistry and the emphasis on the ecological impact of clinical laboratories. To that end, one of the largest challenges is developing green, sustainable, and efficient sample preparation procedures. A recent development in the field of solid phase extraction (SPE) known as microextraction has taken great steps forward in achieving extraction methods with low environmental impact.
Considering the increasing demand for appropriate and eco-friendly sample preparation techniques, our research aimed to evaluate the capabilities of the traditional SPE approach, as well as novel microextraction techniques such as in-tip solid-phase microextraction (in-tip SPME) and microextraction by packed sorbent (MEPS) for extraction of marker compounds of A. paniculata AND, NAND, and DAND from human plasma. Therefore, a highly sensitive reversed-phase ultrahigh-performance liquid chromatography (UHPLC) method has been developed and validated. The established method enables analytes’ detection using two detection modes convenient DAD detection as well as highly selective and sensitive mass spectrometric detection with electrospray ionization (ESI) and triple quadrupole (QqQ) analyzer.
2. Materials and Methods
2.1. Chemicals, Materials, and Equipment
The standard AND was purchased from TCI (Tokyo, Japan), while NAND and DAND were obtained by Sigma-Aldrich (St. Louis, MO, USA). Methanol and acetonitrile (HPLC gradient grade) were supplied from J. T. Baker (Griesheim, Germany). Formic acid (LC-MS grade) was acquired from Merck (Darmstadt, Germany). Buffer solutions were prepared using di-sodium hydrogen phosphate dihydrate (buffer substance for chromatography) and sodium dihydrogen phosphate dihydrate (EMSURE® reagent Ph. Eur.) both by Merck, Darmstadt, Germany. Lyophilized human serum was used as a matrix (SERODOS®, Human, Wiesbaden, Germany). Ultra-pure water obtained by the WaterPro water system Labconco (Kansas, MI, USA) with a resistivity of 18.2 MΩ cm (25 °C) was used in all experiments. The SPE procedure was performed using the Visiprep™ vacuum manifold that allows processing up to 12-port SPE samples, simultaneously (Supelco, Sigma Aldrich, St. Louis, MO, USA) and mini diaphragm vacuum pump (Laboport® N816, KNF Neuberger GmbH, Freiburg, Germany). Single channel pipettes by Rainin, Mettler Toledo (Columbus, OH, USA) were used as liquid handling solutions for the in-tip SPME procedure. MEPS procedure was carried out on Trajan Scientific and Medical apparatus (Victoria, Australia) consisting of a 100-µL eVol® XR hand-held automated analytical syringe. Additional equipment used for sample preparation includes a rotary evaporator under vacuum (Concentrator Plus, Eppendorf, Hamburg, Germany), a centrifuge with temperature control Z 326K (Hermle, Gosheim, Germany), and Vortex 2 by IKA®-Werke GmbH & Co. KG (Staufen, Germany). In the analysis of the samples, Agilent 1260 series UHPLC system was used with a DAD detector and Ultivo Triple Quadrupole with ESI source all by Agilent Technologies (Santa Clara, CA, USA). Data acquisition and processing were carried out using OpenLab ChemStation and MassHunter software.
2.2. Sample Preparation
2.2.1. Preparation of Calibrators and Quality Controls
The stock solutions of AND, NAND, and DAND (100 µg/mL) were prepared by dissolving appropriate amounts of each analytical standard in methanol. Further dilutions of the stock solution with methanol/water (50:50, v/v) mixture produced a series of standard working solutions in the concentration range of 4–12 µg/mL which were used to spike blank human plasma. Lyophilized human serum was stored at 4 °C before use. It was thawed at room temperature for 1 h and vortexed mixed for 10 s before the addition of working solutions. Optimization of all sample preparation procedures was performed using mixed standard solution (8 µg/mL) spiked to blank human plasma. Quality control (QC) samples for method validation were independently prepared in the same matrix at low (4 µg/mL), two middle (6 µg/mL and 8 µg/mL), and high (12 µg/mL) concentrations representative of the range of calibration curves. All the solutions were kept in dark at 4 °C until they were used.
2.2.2. SPE Procedure
In this study, ten different SPE sorbents (
Table 1) were used to extract AND, NAND, and DAND from plasma samples. Based on sorbent chemistry and extraction mechanism different extraction procedures were applied using the vacuum manifold.
The procedure for octadecyl (C18) and octyl (C8) silane-bonded silica as well as polymeric sorbents included precipitation of the proteins before the extraction of analytes. Organic solvent-based protein precipitation was found to be useful for efficient protein elimination in a single step. The plasma samples were mixed with four times their volume of methanol. The mixtures were placed on a vortex mixer for approximately 30 s and centrifuged at 3000 rpm to afford a clear supernatant. Before the sample loading on the sorbent, it was conditioned with 2 mL of methanol followed by 2 mL of ultra-pure water. Protein-free supernatants were loaded onto suitably conditioned columns. The washing of columns was performed with 1 mL of ultra-pure water and analytes were eluted with 1 mL of methanol. Samples were evaporated using Concentrator plus to dryness at 60 °C, re-dissolved with 200 µL of ultra-pure water and aliquots of 25 µL were injected into the chromatographic system.
The procedure for mixed-mode nonpolar polymeric anion exchanger sorbent was comparable with the above-described procedure for modified silica and polymers except solvents were adjusted to the chemistry of sorbent and anion-exchange loadings. The conditioning of sorbent was performed with 2 mL of methanol followed by 2 mL of phosphate buffer (10 mM, pH = 7.4), washing of columns with 1 mL of water/methanol mixture (50:50, v/v), and analyte elution with 1% (v/v) formic acid in methanol.
The procedure for sorbents that selectively remove plasma proteins and phospholipids omits protein removal pretreatment as it is included in the extraction step (
Figure 2). An amount of 800 µL of crashing solvent methanol was dispensed on columns followed by the addition of 200 µL of plasma samples. After sample loading, tubes were placed on a vortex mixer for approximately 30 s and centrifuged at 11,000 rpm for 10 min. Collected supernatants were evaporated to dryness at 60 °C and then re-dissolved with 100 µL of ultra-pure water. Afterward, the samples (25 µL) were injected into the chromatographic system.
2.2.3. In-Tip SPME Procedure
Extraction of analytes was carried out using HybridSPE DPX Tips (50 mg, 1 mL) from Merck Millipore (Burlington, MA, USA) (
Figure 3). Before the extraction process proteins were removed by mixing plasma samples with four times their volume of methanol. The mixtures were placed on a vortex mixer for approximately 30 s and centrifuged at 3000 rpm for 10 min. For analytes’ extraction, the tip-packed sorbent was conditioned by aspiring and dispensing 800 µL of methanol. Protein-free supernatants were collected and aspirated/dispensed three times with tip-packed sorbent. In the final step, collected phospholipid-free samples were evaporated to dryness at 60 °C and then re-dissolved with 200 µL of ultra-pure water. Aliquots of the 25 µL were injected into the chromatographic system.
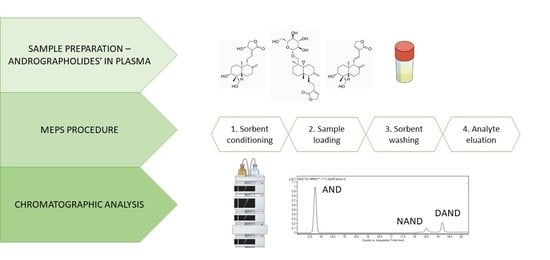
2.2.4. MEPS Procedure
MEPS procedure was carried out using 100-µL hand-held automated analytical syringe with a removable needle fitted with a Barrel Insert and Needle (BIN) assembly containing hydrophobic C8, C18, cross-linked polystyrene divinylbenzene copolymer (HDVB) and polystyrene-divinylbenzene copolymer (SDVB) sorbents (
Figure 4). Before being used for the first time, the sorbent was conditioned with four draw–eject cycles of 300 µL of methanol followed by four draw–eject cycles of 300 µL of ultra-pure water. After that, 100 µL of spiked plasma samples were manually drawn through the sorbent and discharged back six times. Afterward, the MEPS cartridge then washed with 100 µL of ultra-pure water and 200 µL of a water/methanol mixture (90:10,
v/
v). The analytes were eluted with 700 µL of methanol, evaporated to dryness at 60 °C, redissolved with 100 µL of ultra-pure water and 25 µL of the sample was injected into the chromatographic system. In this study, the extraction was repeated multiple times using the same MEPS sorbent. To avoid carryover effect, the sorbent was washed with ten draw–eject cycles of 300 µL of methanol and ten draw–eject cycles of 100 µL of ultra-pure water.
2.3. Chromatographic Analysis
The simultaneous determination of three major active diterpenoids of A. paniculata in human plasma was performed using chromatographic column XSelect HSS Cyano (3.0 × 150 mm, 3.5 µm particle size; Waters, Milford, MA, USA) with an operating temperature of 34.0 ± 0.1 °C. The mobile phase consisted of two eluents, ultra-pure water (eluent A) and acetonitrile (eluent B) both acidified with formic acid (0.1%) and delivered at a flow rate of 0.8 mL/min with a gradient system (0–6 min 7–15% B; 6–16.5 min 15–30% B; 16.5–21 min 30–53% B). After each run, the column was equilibrated with 7% of eluent B for 3 min. Both eluents were filtrated throughout a 0.45 µm membrane filter with a 47-mm diameter (Sartorius, Goettingen, Germany). The injection volume of each sample was 25 µL. To avoid carryover, the syringe and injection valve of the autosampler were set to be washed after each injection with wash solution (methanol). The DAD quantitation was performed at 206, 230, and 256 nm with a slit of 4 nm. The absorbance of the analytes during a chromatographic run was collected in the spectral range of 200–400 nm. The detection wavelength for each analyte was the one providing the maximum peak high. The MS settings were optimized to obtain the maximal signal. Results were generated in the positive mode obtained from an ESI source, operating with the capillary voltages of 3500 V and nebulizer pressure of 30 psi. The gas temperature was set at 350 °C with a gas flow of 11 L/min. An ESI-L tuning mix (Agilent Technologies, Santa Clara, CA, USA) was used daily as a calibrant delivery system. The full scan mass spectra were acquired over a range of m/z 100–700. Highly pure N2 (>99.9995) was used as the collision gas with the collision energy of 100 eV for AND, 76 eV for NAND, and 56 eV for DAND. For dynamic multiple reaction monitoring (dMRM) mode the precursor-to-product ion transitions at m/z 351 → 297, 481 → 319, and 333 → 297 were used for AND, NAND, and DAND, respectively.
2.4. Method Validation
The optimized method was validated according to the International Council for Harmonization of Technical Requirements for Pharmaceuticals for Human Use (ICH (M10)) and US Food and Drug Administration (FDA) guidelines on bioanalytical method validation [
26,
27].
2.5. Analytical Method Greenness Score Evaluation
The platform Analytical GREEnness metric approach software (AGREE) was used for the analytical method greenness score evaluation [
28].
3. Results
3.1. Optimization of Sample Preparation
The sample preparation is the first and crucial step in the bioanalysis of xenobiotics in complex biological matrices. Carbohydrates, proteins, lipids, salts, and other endogenous components present in large amounts can hamper the preferred trace analytes via matrix effects. Thus, elimination of these interferences is the primary purpose of sample preparation before analysis. However, more than that, the increasing demand for convenient and eco-friendly sample preparation techniques in clinical laboratories is indisputable. To properly address these requirements, we explored the possibilities of three sample preparation techniques for the simultaneous extraction of marker compounds of A. paniculata.
Initially, the SPE procedure, as the most widespread sample preparation in bioanalysis, was used to identify the most suitable extraction mechanism for the target compounds. One of its main advantages is its versatility since a wide range of sorbents that have different properties and types of interaction with the analytes have become available. For the current work, we have used reversed-phase silica-based sorbents that were the first to be applied to SPE. The investigated sorbents showed thwarted extraction efficiencies from 17% to 81%. Due to outstanding morphological properties that promote capacity and retention with tuned chemical properties that allow interactions with various compounds and enhanced stability under extreme conditions polymeric sorbents were subsequently included in the evaluation. Contrary to the anticipated similar extraction efficiency was achieved using different polymeric sorbents (from 3% to 79%). It was observed that the lowest extraction recovery (up to 6%) was obtained using Bond Elut Plexa cartridges. It indicates strong interaction of hydrophobic andrographolides with polymeric sorbent which entails larger consumption of elution solvent and lowers the greenness of the method. Furthermore, the mixed-mode anion-exchange polymer material for achieving selectivity for negatively charged andrographolides was explored. The anion exchange functionalities of sorbent slightly improved the extraction efficiency (up to 14%) compared to the corresponding polymer. In recent years, development in sorbent technology involving innovative extraction mechanism has also taken place. These novel materials are tailored to selectively remove plasma proteins and phospholipids. A comparison of two protein and phospholipid removal sorbents for the analysis of andrographolides in plasma samples has been investigated to appraise the effect that these approaches have on the removal of endogenous material. Both sorbents provided superior cleanliness of the extracted samples, also acceptable extraction efficiencies (Isolute® PLD+: 91.6% with RSD 1.50% for AND, 92.4% with RSD 1.40% for NAND, and 84.8% with RSD 4.15% for DAND; Free Phospholipid Removal: 98.5% with RSD 1.67% for AND, 95.7% with RSD 3.12% for NAND, and 94.59% with RSD 0.96% for DAND, n = 3).
The results of SPE optimization support the use of protein and phospholipid removal sorbents. However, our work was extended toward microextraction techniques as a useful tool for green sample preparation procedures. The phospholipid retention mechanism, based on a highly selective Lewis acid–base interaction between the proprietary zirconia ions, functionally bonded to sorbent and the phosphate moiety consistent within all phospholipids is available as dispersive pipette extraction technology that introduces the benefits of solid phase extraction into an easy-to-use pipette tip. This device is unique because sorbent material is loosely contained within a tip and such that sorbent was mixed with plasma samples during aspirate and dispense steps and enabled a highly efficient interaction of the sorbent and andrographolides. The obtained extraction efficiencies (96.0% with RSD 1.21% for AND, 96.5% with RSD 3.80% for NAND, and 83.0% with RSD 1.07% for DAND, n = 3) tie well with SPE data obtained using protein and phospholipid removal sorbents. The primary advantages of in-tip SPME over conventional SPE are the minimalization of the analyst intervention and the accuracy of the automatic pipette which provided customizable and precise sample flow allowing for repeatable extraction of andrographolides. It is worthwhile to note the capability of the in-tip SPME procedure for small sample volumes processing which makes this technique suitable for the bioanalytical method development of low-volume assays for pediatric studies according to international agencies’ guidelines.
Advanced characteristics of mass spectrometry such as sensitivity, specificity, and fastness lead to elect this technique as the golden standard in bioanalysis. Consequently, we wanted our sample preparation technique to be suitable for MS detection. Since we are aware that SPE and in-tip SPME can contribute to inducing ion suppression/enhancement effects during LC/MS analysis through extractables endogenous to the SPE and SPME hardware (polypropylene cartridges and tips) we focused our further research on MEPS technology. For method optimization, the semi-automatic MEPS version using the digitally controlled and programmable electronic device eVol
® XR was used since it is more reliable than the manual MEPS. The procedure includes the sample loading from the bottom of the device which allows the sample to pass through sorbent packed inside the barrel between frits twice for each syringe cycle. Thus, a critical parameter in MEPS extraction is the choice of sorbent. From the commercially available MEPS sorbent portfolio the extraction phase based on silica particles (C8 and C18) and polymeric phases (HDVB and SDVB) were investigated to select the appropriate sorbent for andrographolides’ extraction. Both MEPS silica sorbents showed more preferable extraction efficiencies than coherent SPE sorbents (C8: 64.6% with RSD 0.83% for AND, 94.1% with RSD 2.96% for NAND, and 84.4% with RSD 1.29% for DAND; C18: 80.7% with RSD 1.89% for AND, 97.2% with RSD 2.55% for NAND, and 87.9% with RSD 0.63% for DAND,
n = 3). We presume that these improvements may be related to the high retention capabilities of MEPS sorbent consisting of a spherical silica particle with a high pore size and a surface area (typically 120 Å), which is larger than the conventional SPE pore size of up to 80 Å. Superior extraction efficiencies are seen for both polymeric sorbents based on the poly (styrene-divinylbenzene) (
Figure 5).
HDVB MEPS sorbent as a cross-linked copolymer offered 100% reversed-phase interaction with hydrophobic andrographolides. Still, based on the lower extraction efficiency achieved for NAND (14.8% lower) we might conclude that this modified, highly hydrophobic polymer is less suitable for investigated labdane glucoside containing multiple hydroxyl groups than unmodified SDVB sorbent. The retention of analytes on the MEPS sorbents is affected by the number of extraction cycles during the sample loading process. A larger number of cycles on HDVB sorbent might lead to higher extraction efficiency for NAND. However, increasing the number of extraction cycles might shorten the lifetime of the MEPS sorbent, as the complex matrix could saturate the stationary phase with interferences.
Among investigated sample preparation procedures MEPS was shown to be the most appropriate for andrographolides bioanalysis. Optimized MEPS procedure allowed miniaturization of sample volume, diminishing the consumption of organic solvents, excellent sample concentration, and clean-up, as well as high recovery. The pre-treatment steps such as dilution of the sample and removal of proteins were not required. We developed a new, straightforward methodology, performed in four consecutive steps that took only a few minutes from sample loading to andrographolides elution allowing their high throughput analysis. Moreover, the novel sample preparation procedure can be smoothly transferred to the fully automatic platform as the sorbent configuration is compatible with both systems. SDVB sorbent was chosen for further research as the most adequate sorbent for the concomitant analysis of andrographolides in human plasma samples and used for about 100 extractions without compromising efficiency.
3.2. Chromatographic Analysis
Chromatographic conditions were optimized to obtain high sensitivity and reproducibility of the method. Our previous investigation on andrographolides [
9] has shown that the propyl cyano-bonded phase provides a superior peak shape for andrographolides and an extremely long column lifetime at low pH. Firstly, the dependable and easy-to-operate DAD detector was used to find out the appropriate sample preparation procedure. To confirm the system performance, system suitability parameters were measured by injecting a standard solution (8 µg/mL) in six replicates. The parameters, including retention time, peak area, resolution, retention factor, US Pharmacopeia (USP) plate count, and symmetry were evaluated (
Table 2).
The values of RSD were found to be less than 2.42%, thus leading to a high degree of accuracy of the chromatographic instrument.
3.3. Method Validation
The validation of the developed bioanalytical method with MEPS sample preparation was performed as per approved guidelines of the ICH (M10) and FDA recommended condition [
26,
27].
The selectivity of the developed method was determined by comparing the blank plasma sample (
Figure 6A) with the spiked plasma sample (
Figure 6B). The results showed no interference of chromatographic peaks of analytes with the plasma. Responses attributable to interfering components were lower than the acceptable limit (lower than 20% of the andrographolides’ response at the lowest calibration standard (LLOQ) level of 4 µg/mL). In addition, the andrographolides’ peak purity in the spiked plasma samples at a QC level of 8 µg/mL expressed with ChemStation software was higher than 999. Furthermore, the selectivity of the method was assessed for interference by concomitant medication: nonsteroidal anti-inflammatory drugs (ketoprofen, acetylsalicylic acid, and ibuprofen), benzodiazepine tranquilizer (diazepam), and aminosalicylates (sulfasalazine and olsalazine). Hence, the developed method can be considered to be highly selective for the quantification of andrographolides in human plasma.
The calibration curve was prepared to demonstrate the relationship between the nominal analyte concentration and the response of the analytical platform to the analyte. Each calibration standard was prepared in triplicate by spiking blank plasma samples with aliquots of 25 µL of a known quantity of AND, NAND, and DAND. Afterward, the spiked plasma samples were pre-treated with MEPS, as described previously. Calibration curves were created using five concentration levels of plasma matrix spiked with standards encompassing the range from 4 µg/mL (LLOQ level) to 12 µg/mL (the highest calibration standard (ULOQ) level) for AND, NAND, and DAND to assess the method’s linearity. The calibration curve was found to be linear with a good regression coefficient value (r > 0.999) for analytes. Linearity results have been summarized in
Table 3. Furthermore, the accuracy of the back-calculated concentrations of each calibration standard was evaluated and it was found to be within ±3.1% of the nominal concentration at all investigated levels. The values were within the ICH and FDA acceptable limit (±20% of the nominal concentration at the LLOQ and within ±15% at all the other levels) supporting the good linearity of the bioanalytical method. Finally, the residual analysis was performed to check the assumption of linearity and homoscedasticity. The residuals appeared to be randomly scattered about zero in residual plots versus fits and versus order, revealing that the errors had constant variance and each error was independent of all other errors (
Figure 7). The Limit of Detection (LOD) was defined as the concentration providing a signal-to-noise ratio of three and it was found between 0.02 and 0.10 µg/mL while the Limit of Quantification (LOQ) was found to be between 0.06 and 0.32 µg/mL (a signal-to-noise ratio of ten) (
Table 3).
The precision of the bioanalytical method explained the closeness of the data between multiple individual samples of the same concentration prepared by the MEPS procedure and analyzed on the same day and separate days. The intra-day precision was performed at four different quality control samples at LLOQ level (4 µg/mL), ULOQ level (12 µg/mL), and two middle points (6 and 8 µg/mL) in six replicates. The inter-day precision was performed at the same concentration levels on three consecutive days in three replicates. The data expressed as RSDs are presented in
Table 4. RSD values for an intra-day precision range from 0.51 to 3.10% and for inter-day from 1.67 to 7.11%, showing that results were reproducible. As per ICH and FDA guidelines, the RSD should be lower than 15% for all QC levels except the LLOQ level where it should be lower than 20%.
The accuracy of the bioanalytical method explained the closeness of the experimental results to the actual value. Method accuracy was evaluated by recovery assays at the same concentration levels as precision samples in three replicates. The recovery was found to be between 91.04 and 100.34%, indicating that the developed method was accurate. According to ICH and FDA guidelines, the accuracy at each QC level should be within ±15% of the nominal concentration, except at the LLOQ, where it should be within ±20%.
Carry-over was tested in three analytical runs, where blank samples were injected after the ULOQ samples. The response obtained at the retention time of AND, NAND, and DAND in the blanks was compared to the LLOQ response of each analyte. The responses of interfering peaks were less than 20% of the responses for spiked samples, therefore there was no carry-over for the established concentration ranges.
Stability experiments were conducted using one QC level (8 µg/mL). Benchtop, autosampler, and long-term stability were checked at different time intervals and storage conditions. The spiked QC samples were stored at room temperature for a period of 4 h and analyzed thereafter for determining the benchtop stability of andrographolides. The processed QC samples were stored for 12 h inside the autosampler and analyzed for autosampler stability. The QC samples were stored at −80 °C for 7 days to check the long-term stability of andrographolides in human plasma. Freshly spiked QC samples were used for comparison of the concentration of andrographolides with stored stability samples. The acceptance criteria for all the stability studies were set to ensure that QC samples should be within 85–115% of the nominal concentration. All stability tests showed no significant difference in concentrations (the decrease in content was up to 14.75%).
3.4. MS Analysis
The response of analytes to ESI was evaluated by recording the full-scan mass spectra in both positive and negative ionization modes, and the higher signal intensity was obtained in the case of positive ionization mode for all andrographolides. The total-ion chromatogram obtained by dMRM mode and full-scan product ion spectra of investigated andrographolides are presented in
Figure 8.
AND was detected as the pseudomolecular ion [M + H]+ at m/z 351.2 and gave adductor ions with sodium [M + Na]+ and potassium [M + K]+ at m/z 373.1 and 389.1, respectively. Considering the formation of notable three fragment ions at m/z 333.1, 315.1, and 297.1, it is possible to assume that the consecutive loss of water molecules is favored for AND. A fragment ion at m/z 285.1 was formed from a fragment ion at m/z 315.1 due to the loss of HCHO group, while a fragment ion at m/z at 257.1 was furthermore formed due to the loss of CO group. Analysis of spectral data of AND, reveals that the presence of the ion at m/z 257.1 may be also due to the cleavage of C3H4 group from 297.1. Finally, the fragment ion at m/z 205.0 was assigned to the cleavage of the central linkage between C9-C11 from the fragment ion at m/z 315.1.
The protonated molecular ion [M + H]+ at m/z 481.2 next to adductor ions with sodium [M + Na]+ and potassium [M + K]+ at m/z 503.2 and 519.2 was observed for NAND. The cleavage of the O-glycosidic group attached to the bicyclic decahydronaphthalene ring allowed the formation of the characteristic fragment ion [M − C6H10O5 + H]+ at m/z 319.2. Further fragmentation steps were focused on aglycone, giving information on its structure. Fragments at m/z 301.2 and 289.1, corresponding to the loss of H2O and HCHO group, were created after O-glycosidic bond cleavage. An additional neutral loss of CO group from fragment ion at m/z 289.1 resulted in the formation of low abundance fragment ion at m/z 261.2. Like the fragmentation of AND, this fragment ion may also correspond to the loss of C3H4 group from fragment ion at m/z 301.1. Analysis of spectral data of NAND also reveals the presence of the ion at m/z 205.1 assigned to the central bridge cleavage.
Comparing the fragmentation of AND and DAND, it can be observed that both molecules underwent similar fragmentation pathways. The product ion spectrum showed the progressive loss of water molecules from the positive pseudomolecular ion observed at m/z 333.3. In addition, the fragment ion at m/z 257.1 after the neutral loss of CO group form the fragment ion at m/z 285.1 and C3H4 group from the fragment ion at m/z 297.1, respectively, was identical to the one observed for AND.
The proposed fragmentation patterns for andrographolides were confirmed using CFM-ID v4.0 software for competitive fragmentation modelling [
29]. Furthermore, the proposed fragmentation patterns of andrographolides bear a close resemblance to the ones published by Song and co-workers [
30] and Zhao and co-workers [
31]. Though, owing to careful MS optimization our procedure reveled new fragments and fragmentation pathways.
The compound-depended MS parameters (precursor, qualifier, quantifier ions, fragmentator, as well as collision energy) were carefully optimized for each andrographolide by flow injection analysis using MassHunter Optimizer software. MRM parameters were optimized to achieve the most abundant, specific, and stable MRM transition for each compound (
Table 5). AND and DAND during ionization in the ion source formed fragments with the same
m/z. The same phenomenon was also found during the investigation of Xu and co-workers [
22] for negative ionization mode. To avoid the ˝cross-talk˝ effect the method optimization was directed toward the complete separation of analytes. Furthermore, the dMRM mode that executes an MRM transition around the elution time of a compound supported accurate and reliable quantification of AND and DAND (
Table 6). Finally, superior selectivity of the method was observed using an advanced MS detector confirming the suitability of the developed chromatographic method with the MEPS sample preparation procedure for the determination of andrographolides in human plasma samples.
3.5. Analytical Method Greenness Score Evaluation
Several approaches to analytical green method score evaluation have been developed so far. The greenness of analytical procedures is a multivariate and complex parameter that is not easily quantifiable. These approaches should be used during method development to quantify the technical aspects of the proposed analytical procedure and identify points for improvement. Thus, the selection of approach was based on availability, suitability for the developed analytical procedure, and simplicity of output to obtain meaningful data for the development of a green bioanalytical method for andrographolides.
We have used the newest greenness assessment software AGREE calculator based on the conversion of 12 principles of green analytical chemistry into variables: sampling procedure, sample size, in situ measurement, steps in the process, miniaturization, derivatization, waste, number of analytes, energy, type of reagents, the toxicity of reagents, and operator safety. After completion of the developed method evaluation, the score of each criterion is weighted and combined to yield the overall score that ranges from 0 to 1, with 1 and dark green color representing optimum performance. The result for the proposed chromatographic method with MEPS sample preparation is presented as a round pictogram with a circle in the center that shows the overall score of 0.8, colored in green, indicating that the developed method is obeying the eco-friendly conditions (
Figure 9). The surrounding bars corresponding to the 12 criteria provided an easy way to identify the weak and strong points of our procedure and their contribution to the final score. A closer look at the 12 criteria used for the greenness assessment, shows that the most critical points of our analytical procedure include sample preparation (criteria 1 and 3 highlighted in orange) followed by consumption of organic solvents highlighted in yellow. Criteria 1 and 3 promote in situ measurements and the avoidance of sample preparation, both unrealizable for biological samples. Thus, the obtained results identify the sample collection and preparation as weak points of the bioanalytical methods and the importance of microextraction techniques in bioanalytical method development as an indispensable step in the development of eco-friendly methods.
Taken together, these findings highlight the role of microextraction in bioanalytical studies. The current work was aimed at considering the possibilities of solid-phase microextraction in the bioanalysis of andrographolides. However, our investigations into this area are still ongoing. Further studies, which take the liquid–liquid microextraction into account, will need to be undertaken. This green sample preparation procedure has been advanced over the two last decades and several variations of the technique have been developed. Moreover, the development of new green solvents provides encouragement for a new way of sample preparation optimization.
4. Conclusions
This research describes the usefulness of the MEPS sample preparation procedure for the eco-friendly extraction of major pharmacologically active ingredients present in the extract of A. paniculata used as an anti-inflammatory remedy. Optimized MEPS procedure using SDVB sorbent allowed miniaturization of sample volume, diminishing the consumption of organic solvents, excellent analytes’ concentration, and sample clean-up as well as high recovery.
To support the optimization of the microextraction procedure chromatographic analysis was developed and validated according to internationally relevant guidelines. The present findings confirm the high reliability of sample preparation and analysis procedures.
The newest greenness assessment software AGREE calculator based on the conversion of 12 principles of green analytical chemistry to the variable that cover all aspects of preanalytical and analytical procedures was used for the evaluation of the environmental performance of the developed UHPLC-DAD-QqQ-MS/MS method. This aspect of research suggests that our advanced method is obeying eco-friendly conditions. Moreover, the sample collection and preparation were identified as weak points of the bioanalytical methods and the importance of microextraction techniques in bioanalytical method development is an indispensable step in the development of eco-friendly methods.
To sum up, we have found innovative and sustainable analytical solution for further pharmacokinetic studies of biologically active andrographolides present in green chiretta extracts.


