

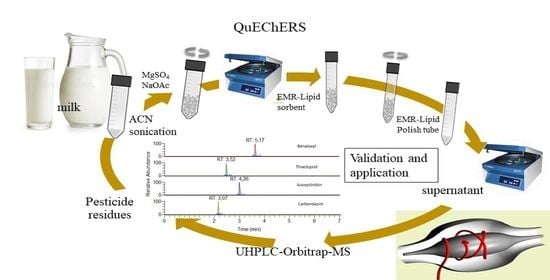
Accurate Determination of Pesticide Residues in Milk by Sonication-QuEChERS Extraction and LC-LTQ/Orbitrap Mass Spectrometry

Abstract
:
1. Introduction
2. Materials and Methods
2.1. Chemicals and Reagents and Samples
2.2. QuEChERS Extraction Procedure
2.3. UHPLC-Orbitrap MS Analysis
2.4. Method Validation
3. Results and Discussion
3.1. Optimization of QuEChERS Extraction
3.2. Validation of the Proposed Method
3.3. Application to Real Milk Samples
4. Conclusions
Author Contributions
Funding
Data Availability Statement
Acknowledgments
Conflicts of Interest
References
- Food and Agriculture Organization (FAO). Dairy Market Review—Emerging Trends and Outlook. 2021. Available online: https://www.fao.org/3/cb7982en/cb7982en.pdf (accessed on 21 December 2021).
- Food and Agriculture Organization (FAO). Gateway to Dairy Production and Products: Dairy Animals. 2021. Available online: https://www.fao.org/dairy-production-products/production/dairy-animals/en/ (accessed on 21 December 2021).
- LeDoux, M. Analytical Methods Applied to the Determination of Pesticide Residues in Foods of Animal Origin. A Review of the Past Two Decades. J. Chromatogr. A 2011, 1218, 1021–1036. [Google Scholar] [CrossRef]
- Leeman, W.R.; Van Den Berg, K.J.; Houben, G.F. Transfer of Chemicals from Feed to Animal Products: The Use of Transfer Factors in Risk Assessment. Food Addit. Contam. 2007, 24, 1–13. [Google Scholar] [CrossRef] [Green Version]
- Kan, C.A.; Meijer, G.A.L. The Risk of Contamination of Food with Toxic Substances Present in Animal Feed. Anim. Feed. Sci. Technol. 2007, 133, 84–108. [Google Scholar] [CrossRef]
- Commission Regulation (EU) No 37/2010 of 22 December 2009 on Pharmacologically Active Substances and Their Classification Regarding Maximum Residue Limits in Foodstuffs of Animal Origin. Available online: https://eur-lex.europa.eu/legal-content/EN/TXT/?uri=CELEX:32010R0037 (accessed on 21 December 2021).
- Aguilera-Luiz, M.M.; Plaza-Bolaños, P.; Romero-González, R.; Martínez Vidal, J.L.; Frenich, A.G. Comparison of the Efficiency of Different Extraction Methods for the Simultaneous Determination of Mycotoxins and Pesticides in Milk Samples by Ultra High-Performance Liquid Chromatography-Tandem Mass Spectrometry. Anal. Bioanal. Chem. 2011, 399, 2863–2875. [Google Scholar] [CrossRef] [PubMed]
- Fagnani, R.; Beloti, V.; Battaglini, A.P.P.; Dunga, K.D.S.; Tamanini, R. Organophosphorus and Carbamates Residues in Milk and Feedstuff Supplied to Dairy Cattle. Pesq. Vet. Bras. 2011, 31, 598–602. [Google Scholar] [CrossRef] [Green Version]
- Liu, S.-Y.; Jin, Q.; Huang, X.-H.; Zhu, G.-N. Determination of Residues of Seven Carbamate Pesticides in Milk Using Ultra-Performance Liquid Chromatography/Tandem Mass Spectrometry and QuEChERS Methods. J. AOAC Int. 2013, 96, 657–662. [Google Scholar] [CrossRef]
- University “Bijeljina” Bijeljina, Faculty of Agriculture; Ćosić, M. Pesticide Residues in Cow’s Milk. Mljekarstvo 2021, 71, 165–174. [Google Scholar] [CrossRef]
- Ramezani, S.; Mahdavi, V.; Gordan, H.; Rezadoost, H.; Oliver Conti, G.; Mousavi Khaneghah, A. Determination of Multi-Class Pesticides Residues of Cow and Human Milk Samples from Iran Using UHPLC-MS/MS and GC-ECD: A Probabilistic Health Risk Assessment. Environ. Res. 2022, 208, 112730. [Google Scholar] [CrossRef]
- Gosetti, F.; Mazzucco, E.; Zampieri, D.; Gennaro, M.C. Signal Suppression/Enhancement in High-Performance Liquid Chromatography Tandem Mass Spectrometry. J. Chromatogr. A 2010, 1217, 3929–3937. [Google Scholar] [CrossRef]
- Pagliuca, G.; Gazzotti, T.; Zironi, E.; Sticca, P. Residue Analysis of Organophosphorus Pesticides in Animal Matrices by Dual Column Capillary Gas Chromatography with Nitrogen–Phosphorus Detection. J. Chromatogr. A 2005, 1071, 67–70. [Google Scholar] [CrossRef]
- Goulart, S.; Dequeiroz, M.; Neves, A.; Dequeiroz, J. Low-Temperature Clean-up Method for the Determination of Pyrethroids in Milk Using Gas Chromatography with Electron Capture Detection. Talanta 2008, 75, 1320–1323. [Google Scholar] [CrossRef]
- Zheng, G.; Han, C.; Liu, Y.; Wang, J.; Zhu, M.; Wang, C.; Shen, Y. Multiresidue Analysis of 30 Organochlorine Pesticides in Milk and Milk Powder by Gel Permeation Chromatography-Solid Phase Extraction-Gas Chromatography-Tandem Mass Spectrometry. J. Dairy Sci. 2014, 97, 6016–6026. [Google Scholar] [CrossRef] [PubMed] [Green Version]
- Tan, S.; Yu, H.; He, Y.; Wang, M.; Liu, G.; Hong, S.; Yan, F.; Wang, Y.; Wang, M.; Li, T.; et al. A Dummy Molecularly Imprinted Solid-Phase Extraction Coupled with Liquid Chromatography-Tandem Mass Spectrometry for Selective Determination of Four Pyridine Carboxylic Acid Herbicides in Milk. J. Chromatogr. B 2019, 1108, 65–72. [Google Scholar] [CrossRef] [PubMed]
- Fernandez-Alvarez, M.; Llompart, M.; Lamas, J.P.; Lores, M.; Garcia-Jares, C.; Cela, R.; Dagnac, T. Development of a Solid-Phase Microextraction Gas Chromatography with Microelectron-Capture Detection Method for a Multiresidue Analysis of Pesticides in Bovine Milk. Anal. Chim. Acta 2008, 617, 37–50. [Google Scholar] [CrossRef] [PubMed]
- González-Rodríguez, M.J.; Arrebola Liébanas, F.J.; Garrido Frenich, A.; Martínez Vidal, J.L.; Sánchez López, F.J. Determination of Pesticides and Some Metabolites in Different Kinds of Milk by Solid-Phase Microextraction and Low-Pressure Gas Chromatography-Tandem Mass Spectrometry. Anal. Bioanal. Chem. 2005, 382, 164–172. [Google Scholar] [CrossRef]
- Rodrigues, F.D.M.; Mesquita, P.R.R.; de Oliveira, L.S.; de Oliveira, F.S.; Menezes Filho, A.; de P. Pereira, P.A.; de Andrade, J.B. Development of a Headspace Solid-Phase Microextraction/Gas Chromatography–Mass Spectrometry Method for Determination of Organophosphorus Pesticide Residues in Cow Milk. Microchem. J. 2011, 98, 56–61. [Google Scholar] [CrossRef]
- Dagnac, T.; Garcia-Chao, M.; Pulleiro, P.; Garcia-Jares, C.; Llompart, M. Dispersive Solid-Phase Extraction Followed by Liquid Chromatography–Tandem Mass Spectrometry for the Multi-Residue Analysis of Pesticides in Raw Bovine Milk. J. Chromatogr. A 2009, 1216, 3702–3709. [Google Scholar] [CrossRef]
- Shamsipur, M.; Yazdanfar, N.; Ghambarian, M. Combination of Solid-Phase Extraction with Dispersive Liquid–Liquid Microextraction Followed by GC–MS for Determination of Pesticide Residues from Water, Milk, Honey and Fruit Juice. Food Chem. 2016, 204, 289–297. [Google Scholar] [CrossRef]
- Yagüe, C.; Bayarri, S.; Lázaro, R.; Conchello, P.; Ariño, A.; Herrera, A. Multiresidue Determination of Organochlorine Pesticides and Polychlorinated Biphenyls in Milk by Gas Chromatography with Electron-Capture Detection after Extraction by Matrix Solid-Phase Dispersion. J. AOAC Int. 2001, 84, 1561–1568. [Google Scholar] [CrossRef] [Green Version]
- Lambropoulou, D.A.; Albanis, T.A. Methods of Sample Preparation for Determination of Pesticide Residues in Food Matrices by Chromatography–Mass Spectrometry-Based Techniques: A Review. Anal. Bioanal. Chem. 2007, 389, 1663–1683. [Google Scholar] [CrossRef]
- Wilkowska, A.; Biziuk, M. Determination of Pesticide Residues in Food Matrices Using the QuEChERS Methodology. Food Chem. 2011, 125, 803–812. [Google Scholar] [CrossRef]
- Zhang, L.; Liu, S.; Cui, X.; Pan, C.; Zhang, A.; Chen, F. A Review of Sample Preparation Methods for the Pesticide Residue Analysis in Foods. Open Chem. 2012, 10, 900–925. [Google Scholar] [CrossRef]
- Tripathy, V.; Sharma, K.K.; Yadav, R.; Devi, S.; Tayade, A.; Sharma, K.; Pandey, P.; Singh, G.; Patel, A.N.; Gautam, R.; et al. Development, Validation of QuEChERS-Based Method for Simultaneous Determination of Multiclass Pesticide Residue in Milk, and Evaluation of the Matrix Effect. J. Environ. Sci. Health Part B 2019, 54, 394–406. [Google Scholar] [CrossRef] [PubMed]
- Zheng, W.; Choi, J.; Abd El-Aty, A.M.; Yoo, K.; Park, D.; Kim, S.; Kang, Y.; Hacımüftüoğlu, A.; Wang, J.; Shim, J.; et al. Simultaneous Determination of Spinosad, Temephos, and Piperonyl Butoxide in Animal-derived Foods Using LC–MS/MS. Biomed. Chromatogr. 2019, 33, e4493. [Google Scholar] [CrossRef] [PubMed]
- Imamoglu, H.; Oktem Olgun, E. Analysis of Veterinary Drug and Pesticide Residues Using the Ethyl Acetate Multiclass/Multiresidue Method in Milk by Liquid Chromatography-Tandem Mass Spectrometry. J. Anal. Methods Chem. 2016, 2016, 1–17. [Google Scholar] [CrossRef] [Green Version]
- Golge, O.; Koluman, A.; Kabak, B. Validation of a Modified QuEChERS Method for the Determination of 167 Pesticides in Milk and Milk Products by LC-MS/MS. Food Anal. Methods 2018, 11, 1122–1148. [Google Scholar] [CrossRef]
- Qin, X.; Zhao, L.; Huang, Q.; Liu, Y.; Xu, Y.; Qin, D.; Liu, Y. Rapid Multi-Residue Determination of Pesticides in Animal-Derived Food via Modified QuEChERS Sample Preparation and GC/MS. Food Anal. Methods 2018, 11, 1493–1500. [Google Scholar] [CrossRef]
- Neely, S.; Martin, J.; da Cruz, N.F.; Piester, G.; Robinson, M.; Okoniewski, R.; Tran, B.N. Application of Dispersive Solid Phase Extraction for Trace Analysis of Toxic Chemicals in Foods. J. Chromatogr. B 2018, 1092, 65–71. [Google Scholar] [CrossRef]
- Anand, N.; Kundu, A.; Ray, S. A Validated Method for the Determination of Neonicotinoid, Pyrethroid and Organochlorine Residues in Human Milk. Chromatographia 2018, 81, 315–325. [Google Scholar] [CrossRef]
- Wu, X.; Tong, K.; Yu, C.; Hou, S.; Xie, Y.; Fan, C.; Chen, H.; Lu, M.; Wang, W. Development of a High-Throughput Screening Analysis for 195 Pesticides in Raw Milk by Modified QuEChERS Sample Preparation and Liquid Chromatography Quadrupole Time-of-Flight Mass Spectrometry. Separations 2022, 9, 98. [Google Scholar] [CrossRef]
- López-Blanco, R.; Nortes-Méndez, R.; Robles-Molina, J.; Moreno-González, D.; Gilbert-López, B.; García-Reyes, J.F.; Molina-Díaz, A. Evaluation of Different Cleanup Sorbents for Multiresidue Pesticide Analysis in Fatty Vegetable Matrices by Liquid Chromatography Tandem Mass Spectrometry. J. Chromatogr. A 2016, 1456, 89–104. [Google Scholar] [CrossRef]
- Han, L.; Matarrita, J.; Sapozhnikova, Y.; Lehotay, S.J. Evaluation of a Recent Product to Remove Lipids and Other Matrix Co-Extractives in the Analysis of Pesticide Residues and Environmental Contaminants in Foods. J. Chromatogr. A 2016, 1449, 17–29. [Google Scholar] [CrossRef] [PubMed]
- Anumol, T.; Lehotay, S.J.; Stevens, J.; Zweigenbaum, J. Comparison of Veterinary Drug Residue Results in Animal Tissues by Ultrahigh-Performance Liquid Chromatography Coupled to Triple Quadrupole or Quadrupole–Time-of-Flight Tandem Mass Spectrometry after Different Sample Preparation Methods, Including Use of a Commercial Lipid Removal Product. Anal. Bioanal. Chem. 2017, 409, 2639–2653. [Google Scholar] [CrossRef] [PubMed]
- Castilla-Fernández, D.; Moreno-González, D.; Beneito-Cambra, M.; Molina-Díaz, A. Critical Assessment of Two Sample Treatment Methods for Multiresidue Determination of Veterinary Drugs in Milk by UHPLC-MS/MS. Anal. Bioanal. Chem. 2019, 411, 1433–1442. [Google Scholar] [CrossRef] [PubMed]
- Abesinghe, A.M.N.L.; Vidanarachchi, J.K.; Islam, N.; Prakash, S.; Silva, K.F.S.T.; Bhandari, B.; Karim, M.A. Effects of Ultrasonication on the Physicochemical Properties of Milk Fat Globules of Bubalus Bubalis (Water Buffalo) under Processing Conditions: A Comparison with Shear-Homogenization. Innov. Food Sci. Emerg. Technol. 2020, 59, 102237. [Google Scholar] [CrossRef]
- Chandrapala, J.; Ong, L.; Zisu, B.; Gras, S.L.; Ashokkumar, M.; Kentish, S.E. The Effect of Sonication and High Pressure Homogenisation on the Properties of Pure Cream. Innov. Food Sci. Emerg. Technol. 2016, 33, 298–307. [Google Scholar] [CrossRef]
- Nguyen, N.H.A.; Anema, S.G. Ultrasonication of Reconstituted Whole Milk and Its Effect on Acid Gelation. Food Chem. 2017, 217, 593–601. [Google Scholar] [CrossRef]
- Gregersen, S.B.; Wiking, L.; Hammershøj, M. Acceleration of Acid Gel Formation by High Intensity Ultrasound Is Linked to Whey Protein Denaturation and Formation of Functional Milk Fat Globule-Protein Complexes. J. Food Eng. 2019, 254, 17–24. [Google Scholar] [CrossRef]
- Carrillo-Lopez, L.M.; Garcia-Galicia, I.A.; Tirado-Gallegos, J.M.; Sanchez-Vega, R.; Huerta-Jimenez, M.; Ashokkumar, M.; Alarcon-Rojo, A.D. Recent Advances in the Application of Ultrasound in Dairy Products: Effect on Functional, Physical, Chemical, Microbiological and Sensory Properties. Ultrason. Sonochemistry 2021, 73, 105467. [Google Scholar] [CrossRef]
- Qin, Y.; Jatamunua, F.; Zhang, J.; Li, Y.; Han, Y.; Zou, N.; Shan, J.; Jiang, Y.; Pan, C. Analysis of Sulfonamides, Tilmicosin and Avermectins Residues in Typical Animal Matrices with Multi-Plug Filtration Cleanup by Liquid Chromatography–Tandem Mass Spectrometry Detection. J. Chromatogr. B 2017, 1053, 27–33. [Google Scholar] [CrossRef]
- Balsini, P.; Parastar, H. Development of Multi-response Optimization and Quadratic Calibration Curve for Determination of Ten Pesticides in Complex Sample Matrices Using QuEChERS Dispersive Liquid–Liquid Microextraction Followed by Gas Chromatography. J. Sep. Sci. 2019, 42, 3553–3562. [Google Scholar] [CrossRef]
- Chen, X.; Panuwet, P.; Hunter, R.E.; Riederer, A.M.; Bernoudy, G.C.; Barr, D.B.; Ryan, P.B. Method for the Quantification of Current Use and Persistent Pesticides in Cow Milk, Human Milk and Baby Formula Using Gas Chromatography Tandem Mass Spectrometry. J. Chromatogr. B 2014, 970, 121–130. [Google Scholar] [CrossRef]
- Desmarchelier, A.; Fan, K.; Minh Tien, M.; Savoy, M.-C.; Tarres, A.; Fuger, D.; Goyon, A.; Bessaire, T.; Mottier, P. Determination of 105 Antibiotic, Anti-Inflammatory, Antiparasitic Agents and Tranquilizers by LC-MS/MS Based on an Acidic QuEChERS-like Extraction. Food Addit. Contam. Part A 2018, 35, 647–661. [Google Scholar] [CrossRef]
- Manav, Ö.G.; Dinç-Zor, Ş.; Alpdoğan, G. Optimization of a Modified QuEChERS Method by Means of Experimental Design for Multiresidue Determination of Pesticides in Milk and Dairy Products by GC–MS. Microchem. J. 2019, 144, 124–129. [Google Scholar] [CrossRef]
- Kang, H.S.; Kim, M.; Kim, E.J.; Choe, W.-J. Determination of 66 Pesticide Residues in Livestock Products Using QuEChERS and GC–MS/MS. Food Sci. Biotechnol. 2020, 29, 1573–1586. [Google Scholar] [CrossRef]
- del Mar Gómez-Ramos, M.; Rajski, Ł.; Heinzen, H.; Fernández-Alba, A.R. Liquid Chromatography Orbitrap Mass Spectrometry with Simultaneous Full Scan and Tandem MS/MS for Highly Selective Pesticide Residue Analysis. Anal. Bioanal. Chem. 2015, 407, 6317–6326. [Google Scholar] [CrossRef] [PubMed]
- Nannou, C.I.; Boti, V.I.; Albanis, T.A. Trace Analysis of Pesticide Residues in Sediments Using Liquid Chromatography–High-Resolution Orbitrap Mass Spectrometry. Anal. Bioanal. Chem. 2018, 410, 1977–1989. [Google Scholar] [CrossRef]
- European Commission. Analytical Quality Control and Method Validation for Pesticide Residues Analysis in Food and Feed (SANTE/12682/2019). Sante/12682/2019, 1–48. 2019. Available online: https://www.eurl-pesticides.eu/userfiles/file/EurlALL/AqcGuidance_SANTE_2019_12682.pdf (accessed on 10 December 2021).
- European Commission. Analytical Quality Control and Method Validation Procedures for Pesticides Residues Analysis in Food and Feed. SANTE/11813/2017. European Commission Directorate-General for Health and Food Safety, 1–46. 2017. Available online: https://www.eurl-pesticides.eu/userfiles/file/EurlALL/SANTE_11813_2017-fin.pdf (accessed on 10 December 2021).
- Horwitz, W.; Albert, R. The Horwitz Ratio (HorRat): A Useful Index of Method Performance with Respect to Precision. J. AOAC Int. 2006, 89, 1095–1109. [Google Scholar] [CrossRef]
- Rizzetti, T.M.; Kemmerich, M.; Martins, M.L.; Prestes, O.D.; Adaime, M.B.; Zanella, R. Optimization of a QuEChERS Based Method by Means of Central Composite Design for Pesticide Multiresidue Determination in Orange Juice by UHPLC–MS/MS. Food Chem. 2016, 196, 25–33. [Google Scholar] [CrossRef] [PubMed] [Green Version]
- Ferreira, J.A.; Talamine, V.; Facco, J.F.; Rizzetti, T.M.; Ferreira, J.M.S.; Oliveira, F.A.; Prestes, O.D.; Zanella, R.; Martins, M.L.; Adaime, M.B.; et al. Determination of Pesticide Residues in Coconut Tree Trunks by Modified QuEChERS Method and Ultra-High-Performance Liquid Chromatography Coupled to Triple Quadrupole Tandem Mass Spectrometry. Anal. Methods 2015, 7, 4237–4245. [Google Scholar] [CrossRef] [Green Version]
- Kosma, C.I.; Koloka, O.L.; Albanis, T.A.; Konstantinou, I.K. Accurate Mass Screening of Pesticide Residues in Wine by Modified QuEChERS and LC-Hybrid LTQ/Orbitrap-MS. Food Chem. 2021, 360, 130008. [Google Scholar] [CrossRef]
- Jadhav, M.R.; Pudale, A.; Raut, P.; Utture, S.; Ahammed Shabeer, T.P.; Banerjee, K. A Unified Approach for High-Throughput Quantitative Analysis of the Residues of Multi-Class Veterinary Drugs and Pesticides in Bovine Milk Using LC-MS/MS and GC–MS/MS. Food Chem. 2019, 272, 292–305. [Google Scholar] [CrossRef]
- Rejczak, T.; Tuzimski, T. QuEChERS-Based Extraction with Dispersive Solid Phase Extraction Clean-up Using PSA and ZrO2-Based Sorbents for Determination of Pesticides in Bovine Milk Samples by HPLC-DAD. Food Chem. 2017, 217, 225–233. [Google Scholar] [CrossRef]
- Li, N.; Lei, L.; Nian, L.; Zhang, R.; Wu, S.; Ren, R.; Wang, Y.; Zhang, H.; Yu, A. A Modified QuEChERS Method for the Determination of Some Herbicides in Yogurt and Milk by High Performance Liquid Chromatography. Talanta 2013, 105, 219–228. [Google Scholar] [CrossRef]
- Zhang, X.; Li, T.; Zhang, L.; Hu, T.; Fu, Y.; Guo, Z. Simultaneous Determination of Sulfoxaflor in 14 Daily Foods Using LC-MS/MS. Int. J. Environ. Anal. Chem. 2019, 99, 557–567. [Google Scholar] [CrossRef]
- Jia, Q.; Qiu, J.; Zhang, L.; Liao, G.; Jia, Y.; Qian, Y. Multiclass Comparative Analysis of Veterinary Drugs, Mycotoxins, and Pesticides in Bovine Milk by Ultrahigh-Performance Liquid Chromatography–Hybrid Quadrupole–Linear Ion Trap Mass Spectrometry. Foods 2022, 11, 331. [Google Scholar] [CrossRef]
- Danezis, G.P.; Anagnostopoulos, C.J.; Liapis, K.; Koupparis, M.A. Multi-Residue Analysis of Pesticides, Plant Hormones, Veterinary Drugs and Mycotoxins Using HILIC Chromatography—MS/MS in Various Food Matrices. Anal. Chim. Acta 2016, 942, 121–138. [Google Scholar] [CrossRef]
- European Commission. Guidance Document on Approving Carbendazim as an Existing Active Substance for Use in Biocidal Products of Product-Types 7 and 10. Regulation (EU) 2021/348. European Commission, Directorate-General for Health and Food Safety, L 68/174. 2021. Available online: http://data.europa.eu/eli/reg_impl/2021/348/oj (accessed on 10 June 2022).
- Fang, H.; Wang, Y.; Gao, C.; Yan, H.; Dong, B.; Yu, Y. Isolation and Characterization of Pseudomonas Sp. CBW Capable of Degrading Carbendazim. Biodegradation 2010, 21, 939–946. [Google Scholar] [CrossRef]
- Quaranta, L. Benzimidazole Fungicides. In Bioactive Heterocyclic Compound Classes, 1st ed.; Lamberth, C., Dinges, J., Eds.; Wiley: Weinheim, Germany, 2012; Volume 9, pp. 105–107. ISBN 978-3-527-33396-7. [Google Scholar]
- Iyer, P.; Makris, S. Developmental and Reproductive Toxicology of Pesticides. In Handbook of Pesticide Toxicology, 3rd ed.; Krieger, R., Ed.; Academic Press: San Diego, CA, USA, 2010; pp. 381–440. ISBN 978-0-12-374367. [Google Scholar]


| Pesticides | Use * | tR (min) | Pseudo-Molecular Ion [M+H]+ | Theoretical Mass (m/z) | Experimental Mass (m/z) | Mass Accuracy (ppm) | Ring Double Bond Equivalent (RDBΕ) | Fragment Ion 35% NCE |
|---|---|---|---|---|---|---|---|---|
| Acetamiprid | In | 3.44 | C10H13ClN4 | 230.7450 | 230.7430 | −0.90 | 6.5 | 126.0102/187.0972/196.0627 |
| Azinphos-methyl | In | 4.28 | C10H14N3O3PS2 | 318.0130 | 318.0135 | 1.429 | 6.5 | 261.1.306 |
| Azoxystrobin | Fu | 4.26 | C22H19N3O5 | 404.1240 | 404.1245 | 0.997 | 15.5 | 372.0974 |
| Benalaxyl | Fu | 5.17 | C20H25NO3 | 326.1751 | 326.1751 | 0.092 | 9.5 | 148.1119/208.1331 |
| Boscalid | Fu | 4.42 | C18H14Cl2N2O | 343.0399 | 343.0401 | 0.452 | 12.5 | 307.0626/139.9898 |
| Bupirimate | Fu | 4.57 | C13H26N4O3S | 317.1642 | 317.644 | 0.669 | 3.5 | 166.0973/237.2070 |
| Carbaryl | In | 3.90 | C12H12NO2 | 202.0862 | 202.0861 | −0.273 | 7.5 | 147.0647 |
| Carbendazim | Fu | 3.07 | C9H11N3O2 | 192.0767 | 192.0768 | 0.244 | 6.5 | 160.0505/132.0556 |
| Cymoxanil | Fu | 3.49 | C7H12N4O3 | 199.0826 | 199.0827 | 0.669 | 4.5 | 128.0462 |
| Cyprodinil | Fu | 4.88 | C14H17N3 | 226.1339 | 226.1342 | 1.441 | 8.5 | 210.1024/185.1074/144.0806 |
| Dichlorvos | In | 3.83 | C4H9Cl2O4P | 220.9532 | 220.9533 | 0.556 | 0.5 | 144.9813/127.0151/109.0045 |
| Dimethoate | In | 3.41 | C5H14NO3PS2 | 230.0069 | 230.0067 | −0.859 | 0.5 | 170.9697 |
| Fenthion sulfoxide | In | 3.86 | C10H17O4PS2 | 295.0222 | 295.0223 | 0.294 | 3.5 | 264.0033/201.0400/279.9983 |
| Imidacloprid | In | 3.33 | C9H12ClN5O2 | 256.0595 | 256.0596 | 0.083 | 6.5 | 175.0976/209.0587 |
| Iprovalicarb | Fu | 4.64 | C18H30N2O3 | 321.2172 | 321.2174 | 0.407 | 5.5 | 119.0851 |
| Metalaxyl | Fu | 4.15 | C15H29NO4 | 280.1543 | 280.1544 | 0.233 | 5.5 | 248.1281/220.1332 |
| Myclobutanil | Fu | 4.58 | C15H19ClN4 | 289.1215 | 289.1217 | 0.862 | 8.5 | 220.0882/125.0148 |
| Tebuconazole | Fu | 5.08 | C16H24ClN3O | 308.1524 | 308.1523 | −0.378 | 6.5 | 151.0306/290.1402 |
| Thiacloprid | In | 3.52 | C10H11ClN4S | 253.0309 | 253.0309 | −0.084 | 7.5 | 126.0102 |
| Thiamethoxam | In | 3.20 | C8H12ClN5O3S | 292.0266 | 292.0265 | −0.220 | 5.5 | 180.9578/139.0325 |
| Pesticides | Linearity (r2) | LOD (μg kg−1) | LOQ (μg kg−1) | MRL (μg kg−1) | Relative Recoveries and RSDs (n = 6) | |||||||||||||||
|---|---|---|---|---|---|---|---|---|---|---|---|---|---|---|---|---|---|---|---|---|
| Intra-Day | Inter-Day | |||||||||||||||||||
| 10 μg kg−1 | 25 μg kg−1 | 100 μg kg−1 | 200 μg kg−1 | 10 μg kg−1 | 25 μg kg−1 | 100 μg kg−1 | 200 μg kg−1 | |||||||||||||
| Rec% | RSDr% | Rec% | RSDr% | Rec% | RSDr% | Rec% | RSDr% | Rec% | RSDwR% | Rec% | RSDwR% | Rec% | RSDwR% | Rec% | RSDwR% | |||||
| Acetamiprid | 0.9950 | 5.8 | 17.8 | 50 | - | - | 80.2 | 7.8 | 111.6 | 6.1 | 116.3 | 6.3 | - | - | 93.4 | 7.7 | 105 | 6.2 | 119.2 | 3.6 |
| Azoxystrobin | 0.9918 | 1.56 | 4.7 | 5 | 79.6 | 6.8 | 80.4 | 9.6 | 81 | 6.1 | 82.0 | 3.6 | 83.9 | 1.4 | 86.7 | 2.8 | 87.4 | 3.0 | 90.3 | 4.7 |
| Azinphos-meth | 0.9948 | 2.1 | 6.4 | 10 | 79.6 | 2.8 | 80.4 | 2.5 | 89 | 5.7 | 91.2 | 5.6 | 84.1 | 2.6 | 86.3 | 1.1 | 87.0 | 7.0 | 95.3 | 6.8 |
| Benalaxyl | 0.9936 | 4.69 | 14.2 | 50 | - | - | 60.0 | 6.4 | 99 | 4.1 | 113.8 | 10.3 | - | - | 60.9 | 8.8 | 110.0 | 4.6 | 115.1 | 7.4 |
| Bupirimate | 0.9940 | 1.05 | 3.2 | 50 | 84.9 | 7.7 | 85.0 | 8.7 | 102.5 | 4.8 | 103 | 11.6 | 90.2 | 6.2 | 90.5 | 6.8 | 98.3 | 7.5 | 102.6 | 10.4 |
| Boscalid | 0.9959 | 3.3 | 10 | 20 | 79.5 | 2.3 | 80.3 | 6.4 | 105.5 | 6.4 | 112.3 | 9.4 | 84.1 | 2.6 | 87.1 | 3.5 | 100.0 | 9.1 | 107.4 | 5.6 |
| Carbaryl | 0.9942 | 2.29 | 6.9 | 50 | 84.3 | 8.0 | 85.0 | 6.2 | 98.6 | 6.8 | 100.3 | 7.1 | 88.8 | 5.5 | 89.0 | 6.1 | 101.3 | 6.4 | 102.0 | 4.1 |
| Carbendazim | 0.9933 | 6.8 | 20.5 | 50 | - | - | 79.9 | 2.8 | 103.5 | 6.0 | 109.8 | 9.9 | - | - | 86.5 | 7.1 | 92.5 | 6.4 | 103.2 | 6.9 |
| Cyprodinil | 0.9922 | 2.79 | 8.46 | 20 | 81.7 | 9.3 | 84.2 | 6.7 | 85.6 | 6.9 | 95.5 | 11.5 | 82.4 | 1.1 | 86.0 | 1.7 | 86.9 | 2.1 | 91.6 | 3.6 |
| Cymoxanil | 0.9968 | 2.3 | 7.0 | 10 | 86.1 | 8.6 | 86.0 | 5.5 | 95.7 | 7.1 | 96 | 3.9 | 85.0 | 3.8 | 86.6 | 3.2 | 91.4 | 4.8 | 92.3 | 2.5 |
| Dimethoate | 0.9958 | 3.3 | 9.8 | 10 | 80.4 | 6.2 | 80.5 | 8.5 | 97.0 | 7.6 | 98.1 | 10.2 | 85.9 | 5.9 | 88.6 | 5.4 | 100.4 | 4.4 | 101.0 | 2.0 |
| Dichlorvos | 0.9954 | 1.4 | 4.3 | 10 | 81.6 | 2.4 | 82.5 | 5.8 | 94.85 | 6.0 | 99.2 | 7.6 | 85 | 0.6 | 86.7 | 3.1 | 87.4 | 6.2 | 100.8 | 7.0 |
| Fenthion sulfoxide | 0.9975 | 3.3 | 8.7 | 10 | 81.2 | 3.1 | 81.7 | 2.2 | 95.5 | 10.5 | 107.8 | 10.6 | 86.1 | 7.5 | 86.6 | 1.8 | 93.2 | 6.8 | 119.2 | 6.1 |
| Imidacloprid | 0.9935 | 5.3 | 16.1 | 100 | 81.8 | 3.6 | 100.0 | 5.5 | 100.2 | 5.2 | 102.5 | 6.6 | 87.4 | 4.9 | 93.8 | 5.1 | 94.0 | 7.5 | 96.7 | 4.6 |
| Iprovalicarb | 0.9950 | 1.3 | 4.0 | 10 | 60 | 4.4 | 62.2 | 7.0 | 87.1 | 5.9 | 88.4 | 2.4 | 66.1 | 8.94 | 71.1 | 2.8 | 83.2 | 4.2 | 88.9 | 6.7 |
| Metalaxyl | 0.9961 | 0.2 | 0.61 | 10 | 84.5 | 9.8 | 84.9 | 4.9 | 102.0 | 6.0 | 103.0 | 5.1 | 87.4 | 5.7 | 87.7 | 5.1 | 95.4 | 8.7 | 98.5 | 5.6 |
| Myclobutanil | 0.9941 | 3.3 | 10.0 | 10 | 50.0 | 7.2 | 60.9 | 11.3 | 74.10 | 7.5 | 112.0 | 7.2 | 50.0 | 7.04 | 59.4 | 8.4 | 80.5 | 5.0 | 107.1 | 11.7 |
| Thiacloprid | 0.9935 | 5.4 | 16.3 | 50 | - | - | 82.6 | 4.1 | 105.1 | 8.2 | 107.3 | 2.7 | - | - | 90.1 | 5.8 | 100.6 | 5.2 | 110.2 | 5.4 |
| Thiamethoxam | 0.9964 | 8.1 | 24.8 | 50 | - | - | 80.2 | 2.9 | 97.02 | 9.8 | 98.0 | 5.5 | - | - | 85.5 | 6.9 | 90.2 | 7.9 | 95.6 | 5.6 |
| Tebuconazole | 0.9963 | 4.0 | 12.1 | 20 | - | - | 80.2 | 1.0 | 98.0 | 11.7 | 119.5 | 5.2 | - | - | 86.0 | 1.7 | 100.5 | 6.4 | 110.5 | 8.0 |
| Milk | Compounds | Amount | QuEChERS | LC-MS Technique | Recovery (%) | LODs | LOQs | Linearity | Reference | |
|---|---|---|---|---|---|---|---|---|---|---|
| Extraction | Clean-Up | |||||||||
| milk | 20 pesticides | 5 g | 6 g MgSO4/1.7 g NaOAC | EMR-lipid | UHPLC-LTQ/Orbitrap MS | 79.5–119.5% | 0.2–8.1 μg kg−1 | 0.61–24.8 μg kg−1 | 0.9918 | This study |
| yogurt/milk | 8 herbicides | 5 mL | NaCl | PSA | HPLC–DAD | 78.9–99.9%, | 0.15–0.35 ng mL−1 | 0.51–1.16 ng mL−1 | 0.9999 | [59] |
| milk | 7 carbamates | 10 g | 5 g NaCl | SPE Bond Elut amino propyl (NH2) cartridges | UPLC-MS/MS | 85.4–110.9% | 0.010–0.068 μg kg−1 | 0.033–0.23 μg kg−1 | 0.990 | [9] |
| milk | 30 pesticides | 20 mL | 2 g NaCl/8 g MgSO4 | PSA / Z-Sep/Z-Sep Plus | HPLC–DAD | 35–131% | 5–50 ng mL−1 | 0.9994 | [58] | |
| milk | Organophosphorus- Organochlorine pesticides | 1 g | 100 mg NaCl/400 mg MgSO4 | MgSO4/PSA/ C18/ CarbonX Plus | LC-ESI/MS/MS | 74.0–137 | 0.20–2.2 mg kg−1 | 0.990 | [31] | |
| milk/dairy products | 167 pesticides | 15 mL | 6 g MgSO4/1.5 g NaCl | MgSO4/PSA/C18 | LC-MS/MS | 80.4–117.3% | 0.3–3.9 μg kg−1 | 1.1–13.1 μg kg−1 | 0.990 | [29] |
| eggs/ milk | pesticides/Spinosad, temephos and piperonyl butoxide | 2 mL | 4 g MgSO4, 1 g NaCl, 1 g sodium citrate tribasic dihydrate and 0.5 g sodium citrate dibasic sesquihydrate | C18/MgSO4 | LC–MS/MS | 71–105% | 0.1–1.6 μg kg−1 | 0.3–4.4 μg kg−1 | 0.980 | [27] |
| milk | sulfoxaflor | 2 g | 1 g NaCl/2 g MgSO4 | C18/PSA/GC /MgSO4 | UPLC-MS/MS | 86.6–91.7% | 1.8 μg kg−1 | 5 μg kg−1 | 0.999 | [60] |
| bovine milk | 238 pesticides | 5 g | 2 MgSO4/ 0.5 g NaCl | C18 | UFLC-MS/MS | 70–120% | 0.1–10 ng g−1 | 0.990 | [57] | |
| milk | 195 pesticides | 2 g | 4 g MgSO4, 1 g NaCl, 0.5 g disodium citrate, and 1 g trisodium citrate | MgSO4/C18 | LC-Q-TOF/MS | 70–120% | 0.1–50 µg kg−1 | 0.99 | [33] | |
| bovine milk | 209 Veterinary Drugs, Mycotoxins, and Pesticides | 5 g | NaCl | C18 | UHPLC-MS-MS | 51.20–129.76% | 0.05–5 µg kg−1 | 0.99 | [61] | |
| Pesticide | Concentration Levels (μg kg−1) in Milk | ||||
|---|---|---|---|---|---|
| 10 μg kg−1 | 25 μg kg−1 | 100 μg kg−1 | |||
| MU (%) | HorRat | MU (%) | HorRat | MU (%) | |
| Acetamiprid | _ | _ | 21.38 | 0.52 | 16.85 |
| Azinphos-methyl | 32.00 | 0.14 | 27.47 | 0.07 | 30.70 |
| Azoxystrobin | 32.00 | 0.08 | 27.24 | 0.18 | 26.02 |
| Benalaxyl | _ | _ | 48.07 | 0.40 | 22.39 |
| Boscalid | 32.00 | 0.14 | 26.77 | 0.21 | 19.79 |
| Bupirimate | 23.71 | 0.35 | 24.03 | 0.44 | 16.63 |
| Carbaryl | 24.90 | 0.41 | 25.66 | 0.39 | 14.19 |
| Carbendazim | _ | _ | 26.18 | 0.34 | 20.43 |
| Cymoxanil | 30.96 | 0.20 | 27.59 | 0.19 | 20.09 |
| Cyprodinil | 32.00 | 0.03 | 27.73 | 0.10 | 26.08 |
| Dichlorvos | 30.00 | 0.03 | 27.34 | 0.19 | 28.46 |
| Dimethoate | 30.93 | 0.31 | 25.50 | 0.34 | 9.67 |
| Fenthion sulfoxide | 32.00 | 0.40 | 26.93 | 0.11 | 19.94 |
| Imidacloprid | 27.30 | 0.27 | 16.64 | 0.34 | 20.36 |
| Iprovalicarb | 47.57 | 0.14 | 46.28 | 0.23 | 34.80 |
| Metalaxyl | 28.01 | 0.31 | 27.00 | 0.32 | 21.03 |
| Myclobutanil | 50.00 | 0.33 | 47.40 | 0.44 | 37.21 |
| Tebuconazole | _ | _ | 27.86 | 0.09 | 14.03 |
| Thiacloprid | _ | _ | 23.36 | 0.37 | 11.30 |
| Thiamethoxam | _ | _ | 26.51 | 0.37 | 25.98 |
Disclaimer/Publisher’s Note: The statements, opinions and data contained in all publications are solely those of the individual author(s) and contributor(s) and not of MDPI and/or the editor(s). MDPI and/or the editor(s) disclaim responsibility for any injury to people or property resulting from any ideas, methods, instructions or products referred to in the content. |
© 2023 by the authors. Licensee MDPI, Basel, Switzerland. This article is an open access article distributed under the terms and conditions of the Creative Commons Attribution (CC BY) license (https://creativecommons.org/licenses/by/4.0/).
Share and Cite
Koloka, O.; Boti, V.; Albanis, T.; Konstantinou, I. Accurate Determination of Pesticide Residues in Milk by Sonication-QuEChERS Extraction and LC-LTQ/Orbitrap Mass Spectrometry. Separations 2023, 10, 146. https://0-doi-org.brum.beds.ac.uk/10.3390/separations10030146
Koloka O, Boti V, Albanis T, Konstantinou I. Accurate Determination of Pesticide Residues in Milk by Sonication-QuEChERS Extraction and LC-LTQ/Orbitrap Mass Spectrometry. Separations. 2023; 10(3):146. https://0-doi-org.brum.beds.ac.uk/10.3390/separations10030146
Chicago/Turabian StyleKoloka, Ourania, Vasiliki Boti, Triantafyllos Albanis, and Ioannis Konstantinou. 2023. "Accurate Determination of Pesticide Residues in Milk by Sonication-QuEChERS Extraction and LC-LTQ/Orbitrap Mass Spectrometry" Separations 10, no. 3: 146. https://0-doi-org.brum.beds.ac.uk/10.3390/separations10030146