Article

A Rapid and Sensitive UPLC-MS/MS Method for Quantifying Capmatinib in Human Liver Microsomes: Evaluation of Metabolic Stability by In Silico and In Vitro Analysis

Department of Pharmaceutical Chemistry, College of Pharmacy, King Saud University, Riyadh 11451, Saudi Arabia
*
Author to whom correspondence should be addressed.
Submission received: 28 March 2023 / Revised: 2 April 2023 / Accepted: 6 April 2023 / Published: 10 April 2023
(This article belongs to the Section Analysis of Natural Products and Pharmaceuticals)

Abstract

:
Capmatinib (CMB) is an orally bioavailable mesenchymal–epithelial transition (MET) inhibitor approved by the US-FDA to treat metastatic non-small cell lung cancer (NSCLC) patients, with MET exon 14 skipping mutation. The current study aimed to establish a specific, rapid, and sensitive ultra-performance liquid chromatography tandem mass spectrometry (UPLC-MS/MS) analytical method for quantifying CMB in human liver microsomes (HLMs), with therapeutic implications for assessing metabolic stability. Validation of the UPLC-MS/MS analytical method in the HLMs was performed using selectivity, sensitivity, linearity, accuracy, precision, extraction recovery, stability, and matrix effects according to the guidelines for bio-analytical method validation of the US-FDA. CMB was ionized by positive electrospray ionization (ESI) as the ionization source and analysed using multiple reaction monitoring (MRM) as the mass analyser mode. CMB and pemigatinib (PMT) were resolved on the C18 column, with an isocratic mobile phase. The CMB calibration curve showed linearity in the concentration range of 1–3000 ng/mL. The intra- and inter-day accuracy and precision were −7.67–4.48% and 0.46–6.99%, respectively. The lower limit of quantification (LLOQ) of 0.94 ng/mL confirmed the sensitivity of the UPLC-MS/MS analytical method. The intrinsic clearance (Clint) and in vitro half-life (t1/2) of CMB were 61.85 mL/min/kg and 13.11 min, respectively. CMB showed a high extraction ratio. The present study is the first to develop, establish, and standardize UPLC-MS/MS for the purpose of quantifying and evaluating the metabolic stability of CMB.

Graphical Abstract

1. Introduction

Cancer results from uncontrolled cell division, and can either be nonmetastatic (benign), being localized to a specific organ, or metastatic, if disseminated to tissues and organs beyond the site of tumour origin. It is the leading cause of mortality, and is responsible for one-fourth of the overall deaths occurring worldwide. Cancer is caused by the mutation of genes regulating diverse cellular functions, which transforms a normal cell into an abnormal cancerous/malignant cell [1,2]. Among the different types of cancer, lung cancer is the second-most frequent type. Approximately two million patients diagnosed positive each year, accounting for 20% of all cancer-related deaths; it is the leading cause of death in cancer patients worldwide [3]. The two main histopathological subtypes of lung cancer include non-small cell lung cancer (NSCLC) and small-cell lung cancer (SCLC). NSCLC represents 90% of all lung cancers, with various subtypes initiated by a range of activated oncogenes [4,5]. The therapeutic approaches currently used in cancer management are based on molecular targeting of oncogenes and tumour suppressor genes that contribute to disease progression in humans [6]. Although progress related to the development of novel drug classes for cancer therapy has been slow, recent advances in molecular targeting strategies have resulted in significant improvements in patients’ prognoses [7].
Personalized targeted therapies significantly improve the clinical outcome in NSCLC patients [8,9]. Aberrant mesenchymal–epithelial transition (MET) factor signalling is associated with poor clinical prognosis and elevated tumour aggressiveness in 3–5% of NSCLC cases [10,11]. MET factor receptor plays an important role in regulating diverse biological functions, including cellular development, migration, and proliferation. Since mutations in MET can lead to uncontrolled cell proliferation and metastasis, it is a promising target for the establishment of novel therapeutic cancer drugs. Accordingly, numerous MET tyrosine kinase inhibitors (TKIs) harbouring specific MET mutations have been approved for treatment in NSCLC patients [12].
Capmatinib (CMB, brand name Tabrecta), a TKI, was approved in 2020 by the US-FDA for the treatment of metastatic NSCLC patients with a confirmed MET exon 14 skipping mutation [13]. CMB (Figure 1) is not only a highly selective MET inhibitor in vitro [14], but also a therapeutically efficient treatment option in vivo with promising clinical outcomes. It is well-tolerated in patients suffering from MET mutations [12,15]. It is primarily metabolized in the liver by aldehyde oxidase and cytochrome P450 (CYP) 3A4, with subsequent elimination via biliary and renal excretion [15,16].
Despite the promising therapeutic outcomes of CMB in NSCLC, limited research have aimed to quantify it in different biological matrices for application in pharmacokinetics studies. Pharmacokinetics studies targeting the estimation of CMB in different biological fluids using the LC-MS/MS method are limited to published data from two research groups [17,18]. The established UPLC method showed a wider linearity range (1–3000 ng/mL; weighing 1/x) compared to the previously reported method (1–2000 ng/mL; weighing 1/x2) [17]. Estimation of CMB in the human liver microsome (HLM) matrix by HPLC-UV has two drawbacks compared to the current UPLC-MS/MS chromatographic method [19]. Firstly, a significantly higher lower limit of quantification (LLOQ) (206 ng/mL) has been detected for the HPLC-UV method compared to the UPLC-MS/MS chromatographic method (1 ng/mL). The second major drawback is the use of 7.5 µM for incubation in the HLM mixture, which is above the approved level permitted for metabolic stability experiments (1 µM/mL); its level should be lower than the Michaelis–Menten constant for constructing linearity between the metabolic incubation time and metabolic rate of CMB. Until our study, quantification of the metabolic stability of CMB in the HLMs matrix using UPLC-MS/MS chromatographic method had not been investigated. Thus, the present study intended to establish a specific, rapid, and sensitive UPLC-MS/MS chromatographic method for quantifying the metabolic stability of CMB in an HLM matrix, and to validate it using in silico software and in vitro metabolic incubation with HLMs.
The established UPLC-MS/MS analytical method used mobile phase running in an isocratic system with an elution time of 3 min (rapid method) and a flow rate of 0.15 mL (less solvent), indicating the environmental friendliness of the established method. The UPLC-MS/MS method revealed linearity in the concentration range of 1–3000 ng/mL. The significance of the developed UPLC-MS/MS method was verified by analysing the metabolic lability of CMB prior to metabolic incubation with HLMs in vitro, utilizing the in silico P450 model software (StarDrop’s software package) [20] to save time and resources. The UPLC-MS/MS chromatographic method was used to assess the intrinsic clearance (Clint) and in vitro half-life (t1/2) of CMB [21], which could then be used to calculate the in vivo rate of metabolism employing three different models, namely, dispersion, venous equilibrium, and a parallel tube [22,23]. The t1/2 and Clint of CMB were computed by an ‘in vitro t1/2’ approach using the ‘well-stirred’ model [22,23], a model frequently used in drug metabolism experiments because of its simplicity. The rapid metabolic rate of CMB indicated a short action duration and low in vivo bioavailability [24,25,26,27].

2. Materials and Methods

2.1. Materials

Pemigatinib (PMB) (INCB054828; HY-109099; 99.88%) and CMB (INC280, INCB28060; HY-13404; 99.92%) were procured from MedChem Express (Princeton, NJ, USA). All solvents used in developing the UPLC-MS/MS analytical method were of HPLC grade, and all solid chemicals and reference powders were of analytical (AR) grade. HLMs (20 mg/mL), acetonitrile (ACN), ammonium formate, and formic acid were procured from Sigma-Aldrich (St. Louis, MO, USA). HLMs were transported on dry ice and stored at −78 °C until further use.

2.2. Instruments

A Milli-Q plus water filtration system (Millipore company; Billerica, MA, USA) was utilized as a source of HPLC-grade water. A UPLC-MS/MS instrument harbouring Acquity UPLC (H10UPH) and Acquity TQD MS (QBB1203) was utilized for mass analysis and for the estimation of target peaks of chromatographically separated CMB and PMT extracted from the HLMs matrix. The UPLC-MS/MS instrument was controlled using MassLynx 4.1 software (Version 4.1, SCN 805). The required vacuum for the TQD mass analyser was generated using a vacuum pump (Sogevac®; Murrysville, PA, USA). Data were processed and interpreted with QuanLynx software. Tuning of MS parameters was achieved with IntelliStart® software. For the evaporation of droplets in the mobile phase, nitrogen (generated using a nitrogen generator (Peak Scientific; Scotland, UK)) was utilized as a drying gas inside the ESI source. For the fragmentation of analyte ions into relative fragments, argon (99.999% in cylinders) was used as a collision gas in the TQD mass analyser.

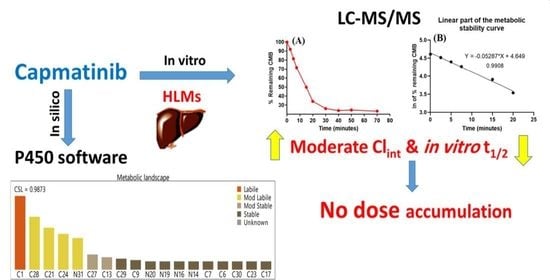
2.3. In Silico Analysis of the Metabolic Lability of CMB

The metabolic stability of CMB was analysed using P450 model of the StarDrop’s software package in addition to metabolic incubation with HLMs in vitro. Results from the StarDrop software analysis were used as proof of initial confirmation for the conduct of the following practical experiments. The outcome of the analysis is exhibited as composite site lability (CSL) signifying the metabolic lability of CMB [24,25,26]. CSL serves as an important factor for determining the metabolic lability of CMB prior to the conduct of metabolic incubation in vitro and to authenticate the need to develop a predicted UPLC-MS/MS chromatographic method for the purpose of evaluating metabolic stability. For calculating CSL, the CMB SMILES format (CNC(=O)c1ccc(cc1F)c2cnc3ncc(n3n2)Cc4ccc5c(c4)cccn5) was uploaded to the software. To evaluate the metabolic lability of CMB, the labilities of individual atoms were computed to express the CSL, which revealed the metabolic lability of CMB, [28,29,30] using the following Equation (1):
C S L = k t o t a l ( k t o t a l + k w )
where kw is the rate constant for water formation.

2.4. Optimization of UPLC-MS/MS Parameters

The UPLC-MS/MS instrumental parameters were optimized to attain the optimum separation and the highest sensitivity for the CMB and PMT peaks (Table 1). UPLC chromatographic parameters involving the type of stationary phase, composition of the mobile phase, and pH of the mobile phase were adjusted to attain the optimal possible resolution and sensitivity of the chromatographic peaks (Table 1). Accordingly, the mobile phase was composed of an aqueous part (55%; 0.1% HCOOH in H2O, pH: 3.2) and an organic part (45%; ACN) at a 0.15 mL/min flow rate. A pH greater than 3.2 (using 10 mM NH4COOH) resulted in CMB peak tailing and longer running times. A higher percentage of ACN (greater than 45%) resulted in overlap of the CMB and PMT peaks, while a lower percentage led to longer running times. ESI ran in the positive because of the presence of basic nitrogen in the chemical structure of the analytes, which could be protonated to generate positively charged ions.
The tuning of CMB by MS (molecular formula: C23H17FN6O) and PMT (molecular formula: C24H27F2N5O4) was achieved using IntelliStart® software combined with direct infusion of CMB and PMT (10 µg/mL from the stock) into the mobile phase. MRM was used as the mass analyser mode for quantifying CMB and PMT in order to elevate the selectivity and sensitivity of the established UPLC-MS/MS chromatographic method. Argon (collision gas) was used for fragmenting the parent molecular ions (CMB and PMT) into product ions inside the collision cell. The dwell time for the CMB and PMT mass transitions was 0.025 s. All mass transition and multiple reaction monitoring (MRM) parameters of CMB and PMT (IS) are listed in Table 2.

2.5. Preparation of Working Dilutions of CMB and PMT

CMB and PMT exhibited optimal solubility in DMSO at 25 mg/mL (60.62 mM with ultrasonication) and 25 mg/mL (51.28 mM with ultrasonication and heating to 60 °C), respectively. Hence, CMB and PMT stock solutions (1 mg/mL) were made in DMSO. CMB working solutions (WKs) at 100 µg/mL, 10 µg/mL, and 1 µg/mL, as well as PMT at 10 µg/mL, were made by multistep dilution of the stock CMB and PMT solutions (1 mg/mL), using the mobile phase to avoid chromatographic peak tailing.

2.6. Construction of CMB Calibration Curve

Prior to their preparation as incubation matrix for use in the validation process, HLMs were deactivated using DMSO (2%, at 50 °C for 5 min.) to inhibit the influence of metabolic reactions/enzymes [31,32,33] on the concentration of CMB and PMT. For use in assessing metabolic stability, an HLM matrix was made by diluting 30 µL of deactivated HLMs (1 mg microsomal protein/mL) to 1 mL with 0.1 M sodium phosphate buffer (pH 7.4), containing 1 mM NADPH and 3.3 mM MgCl2, to simulate metabolic incubation in vitro. To calibrate CMB, CMB working solution (WK2) and WK3 were diluted sequentially with the deactivated HLM matrix to obtain nine calibration levels (1, 15, 50, 100, 200, 400, 500, 1500, and 3000 ng/mL) and four quality controls (QCs) (1 ng/mL (LLOQ), 3 ng/mL (lower quality control: LQC), 900 ng/mL (medium quality control: MQC) and 2400 ng/mL (higher quality control: HQC)) while maintaining more than 90% of the HLM matrix to reduce the effect of dilution simulating real incubation samples. QCs were utilized as unknowns, and the respective concentrations were estimated using the regression equation of the freshly injected CMB calibration curve. A working solution of PMT (100 µL; 1000 ng/mL) was added to 1 mL of all calibration standards and QCs as an IS.

2.7. Extraction of CMB and PMT from the HLM Matrix

CMB and PMT were extracted using the protein precipitation method. ACN was used as a precipitating and quenching agent for enzymatic proteins present in the HLMs matrix. Accordingly, 2 mL of ACN was added to all the CMB calibration standards and QCs, then incubated with constant agitation for 5 min to help extract the analytes from the precipitated matrix. The spiked samples were centrifuged at 14,000 rpm for 12 min using thermostated centrifuge at 4 °C for precipitation, and the supernatant containing the proteins (1 mL) were filtered using a 0.22 µm syringe filter into HPLC vials for further purification and loading into the UPLC-MS/MS instrument. Positive (HLM matrix containing PMT) and negative controls (HLM matrix) were prepared using the aforementioned procedure to confirm the absence of intervention from the components of the HLM matrix at the retention times of CMB and PMT. A CMB calibration curve was established by establishing the peak area ratio of CMB to PMT (y-axis) vs. the proposed CMB values (x-axis). A linear regression equation (y = ax + b; r2) and validation steps were used to confirm the linearity concentration range of the developed CMB calibration curve.

2.8. Validation of the UPLC-MS/MS Method

Validation of the established UPLC-MS/MS analytical method was achieved by estimating the sensitivity, precision, linearity, specificity, accuracy, stability, extraction recovery, and matrix effect, following the US-FDA and European Medicines Agency (EMA) validation guidelines for new bioanalytical method development [34,35].

2.8.1. Specificity

The specificity validation parameter was evaluated by injecting six blank HLM matrix batches following extraction. The extracts were injected into a UPLC-MS/MS instrument and examined for any interference peaks from the HLM matrix at CMB or PMT retention times, followed by comparison with HLM matrix samples spiked with CMB and PMT. The MRM mode was utilized to reduce the carryover influence of CMB and PMT in the TQD mass analyser, as confirmed by the injected negative control HLMs (without CMB and PMT).

2.8.2. Sensitivity and Linearity

Linearity and sensitivity validation parameters were assessed by loading twelve freshly created calibration curves (nine calibration standards) of CMB in the HLM matrix on the same day, and then back-computing as unknowns utilizing the linear regression equation of each calibration curve. The limit of quantitation (LOQ) and the limit of detection (LOD) were computed as specified in the Pharmacopeia, using the standard deviation (SD) of the intercept and the slope of the established calibration curve, by Equations (2) and (3), respectively:
L O Q = 10 × I n t e r c e p t   S D S l o p e
L O D = 3.3 × I n t e r c e p t   S D S l o p e
The linearity of the developed UPLC-MS/MS analytical method was verified using the coefficient of variation (R2) and the regression line (y = ax + b) of the least squared statistical method.

2.8.3. Accuracy and Precision

The inter- and intra-day precision and accuracy validation parameters were verified by injecting 6 repeats of CMB QCs over 3 subsequent days and 12 repeats on the same day, respectively. The accuracy (% error; %E) and precision (% relative standard deviation; RSD) of the established UPLC-MS/MS chromatographic method were calculated using Equations (4) and (5), respectively.
%   R S D = S D A v e r a g e
%   E r r o r = ( M e a n   c a l c u l a t e d   c o n c .   p r e d i c t e d   c o n c . ) p r e d i c t e d   c o n c . × 100

2.8.4. Extraction Recovery and Matrix Effect

The absence of an effect of the HLM matrix components on the degree of CMB or PMT ionization was confirmed by preparing two sets of samples. The HLM matrix (set 1) was spiked with the CMB LQC (3 ng/mL) and PMT, while set 2 was prepared using the mobile phase instead of the HLM matrix. The internal standard (IS) normalized matrix effects (ME) were computed using Equation (6), and ME for CMB and PMT were assessed using Equation (7).
I S   n o r m a l i z e d   M E = M E   o f   C M B M E   o f   P M T   ( I S )
M E   o f   C M B   o r   P M T = a v e r a g e   p e a k   a r e a   r a t i o   S e t   1 S e t   2 × 100
The percent of CMB extraction recovery from the HLM matrix and the influence of HLMs on the extent of CMB ionization were assessed by loading four QCs into the UPLC-MS/MS instrument. The efficacy of the protein precipitation methodology (using ACN) in extracting of CMB and PMT was confirmed by loading six replicates of the QCs in HLMs matrix (B), followed by comparison with the QCs that were made in mobile phase (A). The percent of extraction recoveries of CMB and PMT were computed as the ratio of B/A × 100.

2.8.5. Stability

The stability of CMB in the HLM matrix and stock preparations was evaluated using varied laboratory conditions (exposed prior to analysis), including auto sampler storage, three freeze–thaw cycles, short-term storage, and long-term storage.

2.9. In Vitro Evaluation of CMB Metabolic Stability

Clint and in vitro t1/2 of CMB were computed by determining the concentration of the remaining CMB following metabolic incubation with the active HLM matrix containing MgCl2 and NADPH (cofactor). For conditioning, 1 µL of CMB (4.12 mg/mL) was pre-incubated with an incubation matrix (without NADPH) at 37 °C for 10 min. Metabolic pathways for in vitro incubation were started using 1 mM NADPH and terminated with 2 mL of ACN at the chosen time points: 0, 2.5, 7.5, 15, 20, 30, 40, 50, 60, and 70 min. PMT (100 µL, 1000 ng/mL) was added prior to ACN to maintain a constant IS concentration so as to avoid the metabolizing effect of the HLMs matrix. The procedure detailed in Section 2.7 was used for the extraction of CMB and PMT from the incubation mixture. Negative control incubation of CMB with HLMs (without NADPH) was established using the same steps explained above to verify the absence of the influence of the HLM matrix or metabolic incubation conditions on the conc. of CMB during in vitro metabolic studies.
The concentration of CMB used in the in vitro metabolic incubation mixture was calculated using the regression equation of concurrent injected CMB standards. The CMB metabolic stability curve was constructed by plotting the chosen specific time points (x-axis) from 0–70 min against the percentage of CMB concentration remaining compared to the zero-time concentration (100%) (y-axis). Further, the linear portion of the established curve (0–30 min) was chosen to construct a natural logarithmic curve by plotting the logarithm (ln) of CMB concentrations against the selected incubation time points (0–30 min). The slope of the constructed curve represented the rate constant of CMB metabolic stability, and was used to compute the in vitro t1/2 using the following formula in vitro: t1/2 = ln2/slope. The CMB Clint (mL/min/Kg) was calculated [36] using 26 g of liver tissue per kilogram of body weight and 45 mg of HLM matrix per gram of liver tissue (Equation (8) [37].
C l i n t , = 0693 × 1 t ½ ( m i n . ) × m L   i n c u b a t i o n m g   p r o t e i n × m g   m i c r o s o m a l   p r o t e i n s g   o f   l i v e r   w e i g h t × g   l i v e r K g   b . w .

3. Results and Discussions

3.1. In Silico Analysis of the Metabolic Stability of CMB

The metabolic landscape of CMB aids in the prediction of the metabolic lability of metabolically active sites in its chemical structure that are prone to CYP3A4 enzyme-associated metabolism, as indicated by the pie chart [38,39,40]. CMB showed significantly high metabolic lability, as indicated by the CSL score (0.9873) (Figure 2). The UPLC-MS/MS analytical method was used to estimate its metabolic stability upon metabolic incubation with HLMs. The ratio of lability to metabolism was high at the C1 of the N-methyl group and moderate at the C21, C24, C28, and N31 of the quinolinyl methyl groups. CSL indicated the quinolinyl methyl group as the primary group associated with the metabolic lability of CMB, as was revealed by the results of in silico analysis, which were in synchrony with the in vitro results of metabolic incubation experiments (discussed later).

3.2. Establishment of the UPLC-MS/MS Analytical Method

Different stationary phase columns were examined, including normal phase (polar hydrophilic interaction liquid chromatography (HILIC) columns). Neither CMB nor PMT was chromatographically retained or resolved. However, the optimum results were attained with the C18 column. Although the use of the C8 column in the current UPLC-MS/MS quantitative method for separating CMB and PMT was able to retain the analytes, the analytes exhibited peak tailing, poor base peak separation, and longer running times. The optimal results with regard to peak shape and retention time were obtained using an Eclipse plus-C18 column (i.d. 2.1 mm, particle size 1.8 μm, and 50 mm length). For the UPLC-MS/MS chromatographic method, the analytes (CMB and PMT) were separated using an isocratic mobile phase at a flow rate of 0.15 mL/min and an elution time of 3 min. The constructed CMB calibration curve exhibited linearity in the concentration range of 1 ng/mL to 3000 ng/mL. A summary of various trials aimed at standardizing the conditions for the extraction, separation, and detection of CMB and PMT analyte peaks with regard to peak shape and rapid running time are represented in Table 3.
To increase the sensitivity of the UPLC-MS/MS chromatographic method, the MRM mode was utilized for mass analysis in order to estimate CMB and PMT, so as to avoid interference from the HLM matrix (Figure 3).
The use of PMT as an IS for quantifying CMB in the HLMs matrix using the developed UPLC-MS/MS method is justified by three reasons. Firstly, it was possible to use the same method for the extraction (protein precipitation) of CMB and PMT from the HLM matrix with an efficient recovery of 99.76 ± 2.71% and 101.7 ± 4.48%, respectively. Secondly, the analyte peaks of PMT (1.98 min) and CMB (0.97 min) were obtained in a 3 min run time with good resolution, signifying UPLC-MS/MS as a rapid analytical time-saving (fast) method utilizing less ACN (green chemistry). Thirdly, there exists no prescription for the simultaneous use of both CMB and PMT in a single medical case. Thus, the established UPLC-MS/MS method can be applied for monitoring therapeutic drugs and pharmacokinetic studies of CMB. Significant carry-over was not detected for CMB in the MRM chromatograms of the negative (Figure 4A) and positive HLM controls (Figure 4B). The overlaid MRM chromatograms of CMB and PMT calibration standards (1 ng/mL to 3000 ng/mL and 1000 ng/mL, respectively) are represented in Figure 4C.

3.3. Validation of the Established LC-MS/MS Method

3.3.1. Specificity

The specificity of the UPLC-MS/MS chromatographic method was confirmed from the distinctly resolved analyte peaks of CMB and PMT, as exhibited in Figure 4. In addition, there was no intervention between the constituents of the HLM incubation matrix and the analyte peaks of CMB and PMT. No carry-over effect of CMB was seen in the control MRM chromatograms.

3.3.2. Sensitivity and Linearity

The linearity of the UPLC-MS/MS chromatographic method was statistically verified in the range of 1 ng/mL to 3000 ng/mL (y = 1.301x + 2.091 and R2: 0.9992), as analysed by injecting eight CMB calibration levels into the HLM matrix followed by back-calculation as an unknown. The regression line was weighted (1/x) owing to the wide range of the calibration curve. The RSD of the six replicates (calibration levels and QCs) was <3.92% (Table 4). Those of LOD and LOQ were 0.31 ng/mL and 0.94 ng/mL, respectively.

3.3.3. Precision and Accuracy

The intra- and inter-day precision and accuracy of the developed UPLC-MS/MS analytical method was verified by injecting 12 replicates (QCs) on the same day and 6 replicates (QCs) on three subsequent days. The generated data were within the acceptable range determined by the FDA validation guidelines [30]. The inter- and intra-day accuracy and precision of the established UPLC-MS/MS method were −7.67–4.48% and 0.46–6.99%, respectively (Table 5).

3.3.4. HLM Matrix Does Not Influence the Extraction or Recovery of CMB with the UPLC-MS/MS Chromatographic Method

The efficiency of the chosen UPLC-MS/MS analytical methodology for the extraction (protein precipitation) of CMB and PMT was verified by analysing six replicates (four QCs) injected into the HLM matrix, followed by a comparison with the QCs performed in the mobile phase. The outcomes indicated a high extraction recovery rate for CMB (99.28 ± 4.27 and RSD < 4.30%) and PMT (101.7 ± 4.48% and (RSD < 4.40%). Analysis of two injected samples of the HLM matrix confirmed its lack of influence on the degree of parent (CMB or PMT) ionization. Sample set 1 was spiked with CMB (LQC, 3 ng/mL) and PMT (LQC, 1000 ng/mL), while sample set 2 was prepared by substituting the HLM matrix with the mobile phase. HLMs containing CMB and PMT showed matrix effects of 99.22 ± 5.23% and 103.58 ± 4.23%, respectively. The IS normalized matrix effect (ME) was calculated as 0.96, which was within the acceptable limit of the FDA guidelines. Taken together, these results confirm that the HLM matrix did not influence the ionization of PMT or CMB.

3.3.5. CMB was Stable in the Stock Solution and HLMs Matrix

Evaluation of the stability of CMB in the HLM matrix and stock solution (DMSO) revealed optimal stability upon storage in DMSO for 28 days at −80 °C. Under diverse conditions, the precision levels (RSD %) of all of the CMB samples were <3.6% (Table 6). There was no significant decrease in the concentration of CMB after short-term storage, auto-sampler storage, long-term storage, or three freeze–thaw cycles. The outcomes confirmed the attainment of optimum stability by CMB.

3.4. In Vitro Metabolic Stability of CMB

In negative control incubation, no observed loss of the conc. of CMB was seen. For the purpose of estimating the in vitro metabolic stability of CMB, 1 µM/mL was utilized for metabolic incubation with HLMs so as to be lower than the Michaelis–Menten constant in order to maintain linearity between the metabolic rate of CMB and the time of metabolic incubation. To eliminate nonspecific protein binding, 1 mg/mL of HLMs protein was utilized. The first CMB metabolic curve was established by plotting specific time points from 0–70 min (x-axis) against the percentage of remaining CMB (y-axis) (Figure 5A). For the linear portion of the constructed curve, 0–20 min was selected to establish an additional curve with incubation time points (0–20 min) against the logarithm of the percentage of remaining CMB (Figure 5B). The slope of the CMB metabolic rate was found to be 0.0529 (y = −0.05287x + 4.649, r2 = 0.9908) (Table 7). The in vitro t1/2 was ln2/slope; accordingly, in vitro, the t1/2 was 13.11 min and the CMB Clint was 61.85 mL/min/kg. Following the scoring of McNaney et al. [36], CMB is considered a high-clearance drug, and is predicted to be administered without dose accumulation. The in vivo pharmacokinetics of CMB can be predicted using several software types (the simulation and Cloe PK software) [41].

4. Conclusions

In the current study, a new UPLC-MS/MS analytical methodology was established and validated for the purpose of estimating CMB in the HLMs matrix, and was used to estimate the metabolic stability of CMB. The developed UPLC-MS/MS analytical method exhibited optimal selectivity and sensitivity, as well as significant recovery of PMT and CMB from the HLMs using CAN as a protein precipitating agent. The use of a lower percentage of ACN (45%), a low flow rate (0.15 mL/min), and a short run time (3 min) renders the established UPLC-MS/MS analytical method eco-friendly. The results of the in silico WhichP450 model of StarDrop software was verified by in vitro metabolic incubations (HLMs). The metabolic stability outcomes (moderate CLint (61.85 mL/min/kg) and in vitro t1/2 values (13.11 min)) revealed CMB as a high-clearance drug. Accordingly, we propose the administration of CMB to patients without the risk of drug accumulation in the body. Future research applying in vitro metabolic incubations and in silico software tools are warranted for developing novel drugs with increased metabolic stability. Comparable results of the in silico software analysis and the in vitro incubation assays of CMB confirmed the importance of in silico metabolic lability experiments in saving resources and effort.

Author Contributions

Established the experimental steps: M.W.A., A.S.A. and A.A.K.; performed the in vitro laboratory practical experiments and wrote the first draft of the manuscript: M.W.A. and A.M.A.; helped in software application and designed the methodology: A.S.A. and A.A.K. All authors have read and agreed to the published version of the manuscript.

Funding

This research was funded by the Deputyship for Research & Innovation, Ministry of Education in Saudi Arabia through project no. (IFKSURG-2-547).

Data Availability Statement

All data are available within the manuscript. Ethical approval and review were exempted for the current study due to the use of commercially available human liver microsomes (Sigma) for in vitro experiments.

Acknowledgments

The authors extend their appreciation to the Deputyship for Research & Innovation, Ministry of Education in Saudi Arabia for funding this research work through project no. (IFKSURG-2-547).

Conflicts of Interest

The authors declare no conflict of interest.

References

  1. Mattiuzzi, C.; Lippi, G. Current Cancer Epidemiology. J. Epidemiol. Glob. Health 2019, 9, 217–222. [Google Scholar] [CrossRef] [PubMed] [Green Version]
  2. Jemal, A.; Siegel, R.; Ward, E.; Hao, Y.; Xu, J.; Murray, T.; Thun, M.J. Cancer statistics, 2008. CA A Cancer J. Clin. 2008, 58, 71–96. [Google Scholar] [CrossRef] [PubMed]
  3. Torre, L.A.; Siegel, R.L.; Jemal, A. Lung cancer statistics. In Lung Cancer and Personalized Medicine; Springer: Berlin/Heidelberg, Germany, 2016; pp. 1–19. [Google Scholar]
  4. Chmielecki, J.; Foo, J.; Oxnard, G.R.; Hutchinson, K.; Ohashi, K.; Somwar, R.; Wang, L.; Amato, K.R.; Arcila, M.; Sos, M.L. Optimization of dosing for EGFR-mutant non–small cell lung cancer with evolutionary cancer modeling. Sci. Transl. Med. 2011, 3, 90ra59. [Google Scholar] [CrossRef] [PubMed] [Green Version]
  5. Katayama, R.; Khan, T.M.; Benes, C.; Lifshits, E.; Ebi, H.; Rivera, V.M.; Shakespeare, W.C.; Iafrate, A.J.; Engelman, J.A.; Shaw, A.T. Therapeutic strategies to overcome crizotinib resistance in non-small cell lung cancers harboring the fusion oncogene EML4-ALK. Proc. Natl. Acad. Sci. USA 2011, 108, 7535–7540. [Google Scholar] [CrossRef] [PubMed] [Green Version]
  6. Barinaga, M. From Bench Top to Bedside. Science 1997, 278, 1036–1039. [Google Scholar] [CrossRef] [PubMed]
  7. Shenouda, S.K.; Alahari, S.K. MicroRNA function in cancer: Oncogene or a tumor suppressor? Cancer Metastasis Rev. 2009, 28, 369. [Google Scholar] [CrossRef]
  8. Sechler, M.; Cizmic, A.D.; Avasarala, S.; Van Scoyk, M.; Brzezinski, C.; Kelley, N.; Bikkavilli, R.K.; Winn, R.A. Non-small-cell lung cancer: Molecular targeted therapy and personalized medicine–drug resistance, mechanisms, and strategies. Pharm. Pers. Med. 2013, 6, 25. [Google Scholar]
  9. Cheng, L.; Alexander, R.E.; MacLennan, G.T.; Cummings, O.W.; Montironi, R.; Lopez-Beltran, A.; Cramer, H.M.; Davidson, D.D.; Zhang, S. Molecular pathology of lung cancer: Key to personalized medicine. Mod. Pathol. 2012, 25, 347–369. [Google Scholar] [CrossRef] [Green Version]
  10. Reungwetwattana, T.; Liang, Y.; Zhu, V.; Ou, S.-H.I. The race to target MET exon 14 skipping alterations in non-small cell lung cancer: The why, the how, the who, the unknown, and the inevitable. Lung Cancer 2017, 103, 27–37. [Google Scholar] [CrossRef] [Green Version]
  11. Kunii, K.; Davis, L.; Gorenstein, J.; Hatch, H.; Yashiro, M.; Di Bacco, A.; Elbi, C.; Lutterbach, B. FGFR2-amplified gastric cancer cell lines require FGFR2 and Erbb3 signaling for growth and survival. Cancer Res. 2008, 68, 2340–2348. [Google Scholar] [CrossRef] [Green Version]
  12. Garon, E.B.; Brodrick, P. Targeted Therapy Approaches for MET Abnormalities in Non-Small Cell Lung Cancer. Drugs 2021, 81, 547–554. [Google Scholar] [CrossRef] [PubMed]
  13. Dhillon, S. Capmatinib: First approval. Drugs 2020, 80, 1125–1131. [Google Scholar] [CrossRef] [PubMed]
  14. Vansteenkiste, J.F.; Van De Kerkhove, C.; Wauters, E.; Van Mol, P. Capmatinib for the treatment of non-small cell lung cancer. Expert Rev. Anticancer Ther. 2019, 19, 659–671. [Google Scholar] [CrossRef] [PubMed] [Green Version]
  15. Glaenzel, U.; Jin, Y.; Hansen, R.; Schroer, K.; Rahmanzadeh, G.; Pfaar, U.; van Lier, J.J.; Borell, H.; Meissner, A.; Camenisch, G. Absorption, distribution, metabolism, and excretion of capmatinib (INC280) in healthy male volunteers and in vitro aldehyde oxidase phenotyping of the major metabolite. Drug Metab. Dispos. 2020, 48, 873–885. [Google Scholar] [CrossRef] [PubMed]
  16. Chen, X.; Cui, X.; Pognan, N.; Quinlan, M.; Kapoor, S.; Rahmanzadeh, G.; Giovannini, M.; Marbury, T.C. Pharmacokinetics of capmatinib in participants with hepatic impairment: A phase 1, open-label, single-dose, parallel-group study. Br. J. Clin. Pharmacol. 2022, 88, 91–102. [Google Scholar] [CrossRef]
  17. Fan, X.; Yang, G.; Cui, W.; Liu, Q.; Zhang, Z.; Zhang, Z. Development and full validation of an LC–MS/MS methodology to quantify capmatinib (INC280) following intragastric administration to rats. Biomed. Chromatogr. 2020, 34, e4768. [Google Scholar] [CrossRef]
  18. Zhou, C.; Tian, J.; Lin, P.; Liu, T.; He, A.; Fang, L.; Sun, L. Quantitation of capmatinib, a mesenchymal-epithelial transition factor inhibitor by UPLC-MS/MS in rat plasma and its application to a pharmacokinetic study. Bioanalysis 2020, 12, 285–293. [Google Scholar] [CrossRef]
  19. Zayed, A.; Jaber, S.A.A.; Al Hroot, J.; Hawamdeh, S.; Ayoub, N.M.; Qinna, N.A. HPLC with Fluorescence and Photodiode Array Detection for Quantifying Capmatinib in Biological Samples: Application to In Vivo and In Vitro Studies. Molecules 2022, 27, 8582. [Google Scholar] [CrossRef]
  20. Tyzack, J.D.; Kirchmair, J. Computational methods and tools to predict cytochrome P450 metabolism for drug discovery. Chem. Biol. Drug Des. 2019, 93, 377–386. [Google Scholar] [CrossRef]
  21. Marothu Vamsi, K.; Kantamaneni, P.; Gorrepati, M. In vitro Metabolic Stability of Drugs and Applications of LC-MS in Metabolite Profiling. In Drug Metabolism; Katherine, D., Ed.; IntechOpen: Rijeka, Croatia, 2021; p. 77. [Google Scholar]
  22. Houston, J.B. Utility of in vitro drug metabolism data in predicting in vivo metabolic clearance. Biochem. Pharm. 1994, 47, 1469–1479. [Google Scholar] [CrossRef]
  23. Obach, R.S.; Baxter, J.G.; Liston, T.E.; Silber, B.M.; Jones, B.C.; MacIntyre, F.; Rance, D.J.; Wastall, P. The prediction of human pharmacokinetic parameters from preclinical and in vitro metabolism data. J. Pharm. Exp. 1997, 283, 46–58. [Google Scholar]
  24. Attwa, M.W.; Kadi, A.A.; Darwish, H.W.; Amer, S.M.; Alrabiah, H. A reliable and stable method for the determination of foretinib in human plasma by LC-MS/MS: Application to metabolic stability investigation and excretion rate. Eur. J. Mass Spectrom. 2018, 24, 344–351. [Google Scholar] [CrossRef] [PubMed]
  25. Darwish, H.W.; Kadi, A.A.; Attwa, M.W.; Almutairi, H.S. Investigation of metabolic stability of the novel ALK inhibitor brigatinib by liquid chromatography tandem mass spectrometry. Clin. Chim. Acta 2018, 480, 180–185. [Google Scholar] [CrossRef] [PubMed]
  26. Attwa, M.W.; Darwish, H.W.; Alhazmi, H.A.; Kadi, A.A. Investigation of metabolic degradation of new ALK inhibitor: Entrectinib by LC-MS/MS. Clin. Chim. Acta 2018, 485, 298–304. [Google Scholar] [CrossRef]
  27. Amer, S.M.; Kadi, A.A.; Darwish, H.W.; Attwa, M.W. LC–MS/MS method for the quantification of masitinib in RLMs matrix and rat urine: Application to metabolic stability and excretion rate. Chem. Cent. J. 2017, 11, 136. [Google Scholar] [CrossRef] [Green Version]
  28. Alrabiah, H.; Kadi, A.A.; Attwa, M.W.; Abdelhameed, A.S. A simple liquid chromatography-tandem mass spectrometry method to accurately determine the novel third-generation EGFR-TKI naquotinib with its applicability to metabolic stability assessment. RSC Adv. 2019, 9, 4862–4869. [Google Scholar] [CrossRef] [Green Version]
  29. Kadi, A.A.; Darwish, H.W.; Abuelizz, H.A.; Alsubi, T.A.; Attwa, M.W. Identification of reactive intermediate formation and bioactivation pathways in Abemaciclib metabolism by LC-MS/MS: In vitro metabolic investigation. R. Soc. Open Sci. 2019, 6, 181714. [Google Scholar] [CrossRef] [Green Version]
  30. Attwa, M.W.; Kadi, A.A.; Abdelhameed, A.S.; Alhazmi, H.A. Metabolic stability assessment of new parp inhibitor talazoparib using validated lc–ms/ms methodology: In silico metabolic vulnerability and toxicity studies. Drug Des. Dev. Ther. 2020, 14, 783–793. [Google Scholar] [CrossRef]
  31. Busby, W.F.; Ackermann, J.M.; Crespi, C.L. Effect of methanol, ethanol, dimethyl sulfoxide, and acetonitrile on in vitro activities of cDNA-expressed human cytochromes P-450. Drug Metab. Dispos. 1999, 27, 246–249. [Google Scholar]
  32. Störmer, E.; Roots, I.; Brockmöller, J. Benzydamine N-oxidation as an index reaction reflecting FMO activity in human liver microsomes and impact of FMO3 polymorphisms on enzyme activity. Br. J. Clin. Pharmacol. 2000, 50, 553–561. [Google Scholar] [CrossRef] [Green Version]
  33. Fouin-Fortunet, H.; Tinel, M.; Descatoire, V.; Letteron, P.; Larrey, D.; Geneve, J.; Pessayre, D. Inactivation of cytochrome P-450 by the drug methoxsalen. J. Pharmacol. Exp. Ther. 1986, 236, 237–247. [Google Scholar] [PubMed]
  34. United State of America–Food and Drug Administration. Bioanalytical Method Validation Guidance for Industry. 2018. Available online: https://www.fda.gov/ucm/groups/fdagov-public/@fdagov-drugsgen/documents/document/ucm070107.pdf (accessed on 2 February 2022).
  35. Smith, G. European Medicines Agency guideline on bioanalytical method validation: What more is there to say? Bioanalysis 2012, 4, 865–868. [Google Scholar] [CrossRef] [PubMed]
  36. McNaney, C.A.; Drexler, D.M.; Hnatyshyn, S.Y.; Zvyaga, T.A.; Knipe, J.O.; Belcastro, J.V.; Sanders, M. An automated liquid chromatography-mass spectrometry process to determine metabolic stability half-life and intrinsic clearance of drug candidates by substrate depletion. Assay Drug Dev. Technol. 2008, 6, 121–129. [Google Scholar] [CrossRef] [PubMed]
  37. Słoczyńska, K.; Gunia-Krzyżak, A.; Koczurkiewicz, P.; Wójcik-Pszczoła, K.; Żelaszczyk, D.; Popiół, J.; Pękala, E. Metabolic stability and its role in the discovery of new chemical entities. Acta Pharm. 2019, 69, 345–361. [Google Scholar] [CrossRef] [PubMed] [Green Version]
  38. Kirchmair, J.; Williamson, M.J.; Tyzack, J.D.; Tan, L.; Bond, P.J.; Bender, A.; Glen, R.C. Computational prediction of metabolism: Sites, products, SAR, P450 enzyme dynamics, and mechanisms. J. Chem. Inf. Model 2012, 52, 617–648. [Google Scholar] [CrossRef] [PubMed]
  39. Hunt, P.A.; Segall, M.D.; Tyzack, J.D. WhichP450: A multi-class categorical model to predict the major metabolising CYP450 isoform for a compound. J. Comput.—Aided Mol. Des. 2018, 32, 537–546. [Google Scholar] [CrossRef] [PubMed]
  40. Shin, Y.G.; Le, H.; Khojasteh, C.; ECA Hop, C. Comparison of metabolic soft spot predictions of CYP3A4, CYP2C9 and CYP2D6 substrates using MetaSite and StarDrop. Comb. Chem. High Throughput Screen. 2011, 14, 811–823. [Google Scholar] [CrossRef]
  41. Leahy, D.E. Integrating invitro ADMET data through generic physiologically based pharmacokinetic models. Expert Opin. Drug Metab. Toxicol. 2006, 2, 619–628. [Google Scholar] [CrossRef]
Figure 1. Chemical structure of capmatinib and pemigatinib (IS).
Separations 10 00247 g001
Figure 2. CSL (0.9873) representing the metabolic lability of capmatinib. The results were analysed using the P450 model of the in silico StarDrop software.
Separations 10 00247 g002
Figure 3. (A) MRM mass spectrum of capmatinib (CMB; [M + H]+); (B) MRM mass spectrum of pemigatinib (PMT; [M + H]+). The predicted fragmentation patterns are represented.
Separations 10 00247 g003
Figure 4. (A) Blank human liver microsome (HLM) matrix showing no endogenous chromatographic peaks at the time of elution of capmatinib (CMB) and pemigatinib (PMT); (B) multiple reaction monitoring (MRM) chromatogram of blank HLMs plus PMT (1000 ng/mL); (C) overlaid MRM chromatograms of the nine CMB calibration standards (1, 15, 50, 100, 200, 400, 500, 1500, and 3000 ng/mL) and the three QCs (3, 900, and 2400 ng/mL) showing the CMB peaks (0.97 min) and PMT peak (1000 ng/mL; 1.98 min).
Separations 10 00247 g004
Figure 5. (A) The capmatinib (CMB) metabolic stability curve in HLMs; (B) linear part of the logarithm (ln) calibration curve, revealing the regression equation.
Separations 10 00247 g005
Table 1. Analytical parameters of liquid chromatography and mass detection.
Acquity UPLC (H10UPH)Acquity TQD MS (QBB1203)
Isocratic mobile phase45% ACNESIPositive ESI
0.1% HCOOH in H2O (55%; pH: 3.2)Nitrogen (drying gas; 350 °C) at 100 L/H flow rate
Flow rate: 0.15 mL/minCone gas: 100 L/H flow rate
Injection volume: 5.0 μLVoltage of extractor: 3.0 (V)
ZORBAX Eclipse plus-C18 column50.0 mm longVoltage of RF lens: 0.1 (V)
2.1 mm i.d.Capillary voltage: 4 KV
1.8 μm particle sizeCollision cellArgon gas (collision gas) at 0.14 mL/min flow rate
T: 22.0 ± 2.0 °CModeMRM
Table 2. MRM-tuned mass spectrometric parameters for the estimation of CMB and PMT (IS).
TimeRetention TimeMRM Transitions
Mass spectra segment0.0 to 1.5 minCMB (0.97 min)Qualification traces (m/z)413→354
CE a: 6 and CV b: 26
Quantification traces (m/z)413→ 82
CE: 6 and CV: 32
1.5 to 3.0 minPMT (IS; 1.98 min)Quantification traces (m/z)488→401
CE: 26 and CV: 36
Qualification traces (m/z)488→186
CE: 16 and CV: 26
a Collision energy (eV), b cone voltage (V).
Table 3. Summary of different experiments aimed at standardizing the chromatographic separation of CMB and PMT peaks.
AnalytesMobile PhaseExtraction MethodStationary Phase
ACN (45%)MethanolProtein precipitation
using ACN
Solid phase
extraction
C18 columnC8 column
CMB0.97 min1.35 minHigh recovery (99.28%)Low recovery (75.87%)0.97 min1.68 min
Good peak shapeTailed peaksPrecise results (RSD < 4.30%) Not precisePerfect shapeTailed peaks
PMT1.97 min1.57 minHigh recovery (101.7%)Low recovery (82.49 %)1.97 min1.24 min
Good peak shapeOverlappedPrecise results (RSD < 4.40%)Not precisePerfect shapePerfect shape
CMB, capmatinib; PMT, pemigatinib (PMT); ACN, acetonitrile.
Table 4. Summary of back-calculation data of six calibration curve repeats (calibration levels) of capmatinib (CMB).
CMB (ng/mL)MeanSDRSD (%)Accuracy (%)Recovery
1.00.940.011.29−6.3993.61
15.015.140.181.170.92100.92
50.050.931.993.921.85101.85
200.0199.163.451.73−0.4299.58
400.0405.841.980.491.46101.46
500.0503.705.131.020.74100.74
1500.01520.0218.311.201.33101.33
3000.02958.6326.240.89−1.3898.62
% Recovery 99.76 ± 2.71
RSD, relative standard deviation; SD, standard deviation.
Table 5. Accuracy and precision of the developed UPLC-MS/MS chromatographic method.
CMB (ng/mL)Intra-Day Assay
(Twelve Repeats on the Same Day)
Inter-Day Assay
(Six Repeats on Three Following Days)
QCs1.0
(LLOQ)
3.0
(LQC)
900.0
(MQC)
2400.0 (HQC)1.0
(LLOQ)
3.0
(LQC)
900.0
(MQC)
2400.0
(HQC)
Average0.943.07911.072407.670.923.13915.482359.96
SD0.010.114.1822.390.020.225.1522.37
Precision (%RSD)1.293.600.460.931.656.990.560.95
% Accuracy−6.392.241.230.32−7.674.481.72−1.67
Recovery (%)93.61102.24101.23100.3292.33104.48101.7298.33
CMB, capmatinib; HLMs, human liver microsomes; RSD, relative standard deviation; SD, standard deviation; LQC, lower-quality control; LLQC, lower limit of quantification; HQC, higher-quality control; MQC, medium-quality control.
Table 6. Summary of the stability analysis of CMB.
Stability ParameterLQC (3.0)HQC (2400.0)LQC (3.0)HQC (2400.0)LQC (3.0)HQC (2400.0)LQC (3.0)HQC (2400.0)
MeanSDRSD (%)Accuracy (%)
Freeze–thaw stability (three cycles at −80 °C)2.972457.600.0980.162.873.26−0.872.40
Auto-sampler stability
(24 h at 15 °C)
2.972405.520.1145.973.601.91−1.060.23
Long-term stability (−80 ˚C for 28 d)2.992484.240.0969.093.162.78−0.243.51
Short-term stability (4 h at room temperature)2.962441.760.0974.313.043.04−1.371.74
CMB, capmatinib; HQC, higher-quality control; LQC, lower-quality control.
Table 7. Metabolic stability of capmatinib (CMB).
Time in Min.Average a (ng/mL)X bln XLinearity Parameters
0.0638.34100.004.61Regression equation:
y = −0.05287x + 4.649
2.5587.3492.014.52
5.0521.2781.664.36R2 = 0.9908
7.5457.2471.634.14
15.0318.1549.843.97Slope: −0.05287
20.0219.1434.333.60
30.0168.0726.333.47t1/2: 13.11 min
40.0154.1024.143.34Clint: 61.85 mL/min/kg
50.0158.0524.763.30
70.0150.0723.513.27
a Average of three replicates, b X: average of the % of remaining CMB in three replicates.
Disclaimer/Publisher’s Note: The statements, opinions and data contained in all publications are solely those of the individual author(s) and contributor(s) and not of MDPI and/or the editor(s). MDPI and/or the editor(s) disclaim responsibility for any injury to people or property resulting from any ideas, methods, instructions or products referred to in the content.

