Article

Method Development and Validation for the Simultaneous Quantitation of Pentoxifylline, Its Pharmacologically Active Metabolites, and Donepezil Using LC-MS/MS in Rat Plasma: Its Application to a Pharmacokinetic Study

1
Department of Biomedical and Pharmaceutical Sciences, Graduate School, Kyung Hee University, Seoul 02447, Republic of Korea
2
Kyung Hee Drug Analysis Center, College of Pharmacy, Kyung Hee University, Seoul 02447, Republic of Korea
3
Department of Pharmacy, College of Pharmacy, Kyung Hee University, Seoul 02447, Republic of Korea
4
College of Pharmacy, Sunchon National University, Suncheon 57922, Republic of Korea
5
Department of Pharmaceutical Biochemistry, College of Pharmacy, Kyung Hee University, Seoul 02447, Republic of Korea
*
Authors to whom correspondence should be addressed.
Submission received: 6 April 2023 / Revised: 21 April 2023 / Accepted: 21 April 2023 / Published: 24 April 2023
(This article belongs to the Section Bioanalysis/Clinical Analysis)

Abstract

:
This study developed a simple, rapid, reproducible, and analytical method using liquid chromatography and electrospray ionization (ESI) with tandem mass spectrometry (LC-MS/MS) to simultaneously quantify pentoxifylline (PTX), its pharmacological active metabolites, lisofylline (PTX-M1) and 1-(3-carboxypropyl)-3,7-dimethylxanthine (PTX-M5), and donepezil (DNP) in rat plasma, using PTX-d6 and DNP-d7 as the internal standards. The LC-MS/MS procedure was performed at the ESI interface, operating in positive ionization and multiple reaction monitoring (MRM) modes; the monitoring of transitions comprised m/z 279.3 > 181.1 for PTX, m/z 281.1 > 263.1 > 160.90 for PTX-M1, m/z 267.1 > 249.0 > 220.9 for PTX-M5, m/z 380.3 > 90.9 for DNP, m/z 285.3 > 187.1 for PTX-d6 (IS1), and m/z 387.3 > 98.3 for DNP-d7 (IS2). After plasma protein precipitation (PP) with methanol, chromatographic separation was performed with an Imtakt Cadenza® CD-C18 (100 × 3 mm, 3 µm) column, using an isocratic mobile phase consisting of 0.1% formic acid in water and methanol (20:80, v/v) at a flow rate of 0.2 mL/min. The retention times of DNP, PTX-M5, PTX, and PTX-M1 were 2.24, 2.50, 2.68, and 2.72 min, respectively, with a total run time of 5 min. This method was validated over a linear concentration range of 5–8000, 10–5000, 20–15,000, and 2–500 ng mL−1 for PTX, PTX-M1, PTX-M5, and DNP, respectively, with a high correlation coefficient (r2 ≥ 0.99). The established method was fully validated in terms of selectivity, the lower limit of quantitation, precision, accuracy, recovery, matrix effect, stability, and dilution integrity according to the regulatory guidelines from the U.S. Food and Drug Administration and the Korea Ministry of Food and Drug Safety. The validated method was successfully applied to a pharmacokinetic study on the concurrent administration of DNP and PTX in rats.

1. Introduction

Despite the fact that vascular dementia, which is mostly caused by cerebrovascular diseases such as stroke, is the second most common type of dementia after Alzheimer’s disease, no drugs have been approved for the treatment of vascular dementia itself [1,2,3]. The current treatment guidelines highly recommend pharmacotherapy geared toward risk factor management, including hypertension, diabetes, and dyslipidemia, to prevent further vascular cognitive impairment from secondary cerebrovascular events [4]. However, recent studies have demonstrated cholinergic transfer dysfunction in vascular dementia patients similar to that seen in patients with Alzheimer’s disease, implying the potential benefits of acetylcholinesterase inhibitors in vascular dementia patients [5]. The studies did indeed provide supporting evidence on improved cognitive function with donepezil (DNP), a selective reversible acetylcholinesterase inhibitor primarily prescribed for managing mild to moderate Alzheimer’s disease, in patients with vascular dementia [5,6,7].
Pentoxifylline (1-(5-oxohexyl)-3,7-dimethylxanthine, PTX), a synthetic methylxanthine derivative with nonspecific phosphodiesterase inhibitory activity, is a hemorheological agent for the treatment of intermittent claudication, peripheral vascular disease, cerebrovascular disease, and defective regional microcirculation. Although PTX is classified as a vasodilator, its primary activity appears to increase erythrocyte deformability and decrease blood viscosity, consequently improving blood circulation [8,9,10,11]. PTX also inhibits platelet aggregation and thrombus formation, suggesting potential benefits in the prevention of atherosclerosis, cardiovascular disease, stroke, and transient ischemic attacks [12,13]. Moreover, the potential therapeutic role of PTX on the improvement of cognitive function in vascular dementia has been recently proposed since hemodynamic changes are considered the most significant contributing factor for vascular cognitive dysfunction [10,14,15,16].
As cholinergic transfer dysfunction and hemodynamic disturbances are important pathophysiological features of vascular dementia, a combined treatment with PTX and DNP may be a valid therapeutic option for cognitive dysfunction induced by vascular dementia [6,7,14]. However, possible pharmacokinetics between PTX and DNP may be portrayed as a major concern for combination treatment as both medications undergo substantial hepatic first-pass metabolism [5,6,8,10,11,17,18,19,20,21,22]. Although PTX has low bioavailability of 20–30%, at least seven metabolites are produced from phase-I metabolism [8,10,11,17,18,19], while major metabolites, including hydroxy metabolites, 1-(5-hydroxyhexyl)-3,7-dimethylxanthine (Lisofylline or PTX-M1), and the carboxy metabolites, 1-(3′-carboxypropyl)-3,7-dimethylxanthine (PTX-M5) exhibit biological effects from the drugs [8,17,23]. In general, PTX-M1, PTX-M4, and PTX-M5 are present at levels detected in plasma [17,24]. Hence, pharmacokinetic investigation into DNP and PTX combination treatments is profoundly warranted to reveal any drug-related problems in vascular dementia treatment.
To comprehensively investigate the pharmacokinetic profiles of DNP and PTX combination treatment, which has not yet been reported for new drug development, the establishment of an assay that simultaneously determines the concentrations of both drugs in a biological sample is essential. However, to the best of our knowledge, there is no report on simultaneous quantification methods for PTX and DNP, and numerous quantitative assays to determine PTX or DNP in biological matrices by high-performance liquid chromatography (HPLC) and liquid chromatography-tandem mass spectrometry (LC-MS/MS) [25,26,27,28,29,30,31,32,33,34,35,36,37,38,39,40,41,42] possess several limitations. For example, PTX quantification methods performed via HPLC with UV detection and LC-MS/MS for humans [25,27,29,30,31,32,33] and rats [25,28] require large volumes of plasma samples (i.e., 0.2–1 mL plasma), with limited ranges of quantification concentrations of between 1 and 50 ng mL−1 [25,26,27,28,29,30,31,33]. These methods also require numerous sample preparation procedures, including liquid–liquid extraction (LLE) [25,27,28], solid-phase extraction (SPE) [29], and protein precipitation (PP) [30,31,32,33]. Furthermore, some methods analyzed only PTX [27] and/or its metabolites together [25,26,28,29,30,31,32,33], in spite of the presence of the various PTX metabolites including PTX-M1, PTX-M4, and PTX-M5 at detectable levels in plasma [17,24]. Likewise, analytical methods for DNP determination performed via HPLC with UV detection and LC-MS/MS in humans [33,34,34,35,36,37,38,39,40,41] and rats [35,42] require large sample volumes (i.e., 0.1–1 mL plasma) [34,35,36,37,38,39,40,41]; however, these assays have been reported to have low recovery rates [34,37,38]. Along with various extraction techniques, such as LLE [36,37,40,42], SPE [34,38,39,41], and PP [35], not only DNP [34,35,36,37,41] but also both DNP and its metabolites [38,39,40] were analyzed. Moreover, the currently available assays for DNP and PTX quantification not only require long periods for overall analysis (i.e., a run-time greater than 8 min) [25,26,27,28,34,35,36] and sample preparation, especially with the SPE method, which requires long pretreatment consumption time, they also have large sample-to-sample variability at a high cost [29,34,37,39,41]. Therefore, our study team developed the first simultaneous quantitation LC-MS/MS method for PTX, PTX-M1, PTX-M5, and DNP, using a one-step simple PP with a small rat plasma volume (30 µL); it is fully validated per the regulatory guidelines published by the U.S. Food and Drug Administration (USFDA) and the Korea Ministry of Food and Drug Safety (MFDS) [43,44]. The validated method was then successfully applied to pharmacokinetic studies of the concomitant oral administration of PTX and DNP in rats.

2. Materials and Methods

2.1. Chemicals and Reagents

PTX (1-(5-oxohexyl)-3,7-dimethylxanthine; purity 100.0%), PTX-M1 (lisofylline, 1-(5-hydroxyhexyl)-3,7-dimethylxanthine, purity 98.0%), PTX-M5 (1-(3-carboxypropyl)-3,7-dimethylxanthine, purity 97.0%), DNP (purity 99.9%), pentoxifylline-d6 (PTX-d6, internal standard [IS1], purity 98.0%, isotopic 99.2%), and donepezil-d7 (DNP-d6, internal standard [IS2], purity 99.25.0%, isotopic 99.1%) were purchased from Toronto Research Chemicals (TRC, Toronto, ON, Canada). High-performance liquid chromatography (HPLC)-grade methanol was purchased from J.T. Baker (Phillipsburg, NJ, USA), and formic acid was purchased from Sigma-Aldrich (St. Louis, MO, USA). Purified water for analysis was obtained via a Milli-Q® water purification system (Millipore Co., Billerica, MA, USA). All other chemicals and solvents used were of the highest analytical grades available.

2.2. Instrumentation and Chromatographic Conditions

A Shimadzu Nexera X2 (Shimadzu, Kyoto, Japan) was utilized for liquid chromatography and chromatographic separation was carried out using a Cadenza® CD-C18 (100 × 3 mm, 3 µm, Imtakt, Portland, OR, USA). The mobile phase, consisting of 0.1% formic acid in deionized water and 100% methanol (20:80, v/v), was pumped at a flow rate of 0.2 mL/min. The detection and quantification of analytes and ISs were carried out using an API 4000 triple-quadrupole mass spectrometer (AB SCIEX, Framingham, MA, USA) equipped with electrospray ionization (ESI) and operating in positive ionization mode. Through FIA tuning, the optimized source parameters and multiple reaction monitoring (MRM) transitions for analytes and ISs were derived and are listed in Table 1. The analytical data were obtained using Analyst® 1.6.2. software (AB SCIEX, Framingham, MA, USA).

2.3. Preparation of Calibration Standards and Quality Control Samples

The standard stock solutions, containing 1 mg/mL of PTX, PTX-M1, PTX-M5, DNP, PTX-d6, and DNP-d7, were prepared in 100% methanol and were continuously diluted with 50:50 methanol (v/v) to obtain the prespecified concentrations for working solutions. All solutions were then stored in a freezer at −20 °C. Calibration samples containing all four analytes were prepared by spiking the blank rat plasma to reach the final concentrations of PTX (5, 10, 50, 200, 1000, 2000, 4000, and 8000 ng mL−1), PTX-M1 (10, 50, 200, 500, 1000, 2000, 3000, and 5000 ng mL−1), PTX-M5 (20, 100, 500, 1000, 2000, 5000, 10,000, and 15,000 ng mL−1), and DNP (2, 5, 10, 20, 50, 100, 200, and 500 ng mL−1). Similarly, quality control (QC) samples containing all four analytes were prepared to achieve low, medium, and high QC concentrations of PTX (15, 3000, and 6400 ng mL−1), PTX-M1 (30, 2500, and 4000 ng mL−1), PTX-M5 (60, 7000, and 12,000 ng mL−1), and DNP (6, 75, and 400 ng mL−1). Solutions containing 500 ng mL−1 of IS1 and IS2 were also prepared with 50:50 methanol. All samples for calibration and QC were freshly prepared on each day of the analysis.

2.4. Rat Plasma Sample Preparation

All rat plasma samples were stored in a deep freezer (−70 °C) until analysis and were always thawed at room temperature prior to sample preparation. The preparation method used a simple protein precipitation (PP) method. Once the plasma sample (30 μL) was transferred to microtubes, IS1 (20 μL, 500 ng mL−1), IS2 (20 μL, 500 ng mL−1), and 0.5 mL of cold methanol were added, followed by vortexing for 5 min. The supernatant of the sample was transferred to clean microtubes after centrifugation at 20,800× g for 10 min, and 7 μL of the samples were injected into the analytical column of the LC-MS/MS system.

2.5. Method Validation

The co-quantitative assay developed herein was fully validated for selectivity, a lower limit of quantification (LLOQ), linearity, precision, accuracy, recovery, matrix effects, stability, carry-over, and dilution integrity. All validation procedures were verified in accordance with the guidelines for biological sample analysis laid down by the Ministry of Food and Drug Safety in Korea (MFDS) and the U.S. Food and Drug Administration (USFDA) [43,44].

2.5.1. Selectivity and Sensitivity

To evaluate the potential interference among endogenous compounds (four analyses and two ISs) being eluted simultaneously in retention times, we analyzed six individual rat plasma samples of different origins and one pooled rat plasma sample. Selectivity and sensitivity were evaluated by comparing the chromatograms of blank plasma, blank plasma spiked with IS1 (500 ng mL−1) or IS2 (500 ng mL−1), blank plasma spiked with PTX (8000 ng mL−1), PTX-M1(5000 ng mL−1), PTX-M5 (15,000 ng mL−1) or DNP (500 ng mL−1), and blank plasma spiked with PTX (5 ng mL-1), PTX-M1(10 ng mL−1), PTX-M5 (20 ng mL−1), DNP (2 ng mL−1), IS1(500 ng mL−1), and IS2 (500 ng mL−1); the evaluation was repeated 7 times for each sample. LLOQ was defined as the lowest concentration of the calibration curve and was considered acceptable if the signal-to-noise ratio (S/N) was at least more than 10. The acceptance criteria for the calculated LLOQ area ratio is within the coefficient of variation (CV) range of 20%. The limit of detection (LOD) was defined as the lowest mass detection concentration at which the signal-to-noise ratio (S/N) was greater than 3.

2.5.2. Linearity and Carry-Over

A standard calibration curve was constructed at eight concentrations of PTX (5–8000 ng mL−1), PTX-M1 (10–5000 ng mL−1), PTX-M5 (20–15,000 ng mL−1), and DNP (2–500 ng mL−1). Linearity was determined by using a linear least squares regression calculation (y = ax + b) with plasma concentration weighted (1/x2) to determine the concentration of the standard (y) versus the calculated peak area ratio (x) of the standard to the IS. In the linear least squares regression equation, a is the slope of the calibration curve and b is the y-intercept of the calibration curve. The calibration curve must have a correlation coefficient (r2) of ≥ 0.99. The carry-over injects the highest and lowest concentrations of the calibration curve, respectively, and then injects an empty plasma sample to determine if it affects the quantification of the flowing sample. The upper quantitative limit (ULOQ) is defined as the highest concentration of the calibration curve. Carry-over was evaluated in the order of injecting first empty plasma, then the ULOQ sample, then injecting empty plasma, then injecting the LLOQ sample, and finally injecting empty plasma. At this point, the analytical substance of the LLOQ and the internal standard should be less than 20% and 5%, respectively.

2.5.3. Precision and Accuracy

Intra-day precision and accuracy were examined by the repeated analysis (n = 5) of blank rat plasma, LLOQ, and low, medium, and high concentrations of quality control (QC) samples on the same day, then inter-day precision and accuracy tests were performed on three consecutive days with blank plasma, LLOQ, low, medium, and high concentrations of QC samples (n = 15). The concentrations of the low, medium, and high QC were PTX (5, 15, 3000, and 6400 ng mL−1), PTX-M1 (10, 30, 2500, and 4000 ng mL−1), PTX-M5 (20, 60, 7000, and 12,000 ng mL−1), and DNP (2, 6, 75, and 400 ng mL−1). The mean and standard deviation (SD) were calculated to evaluate precision and accuracy, with accuracy allowed to be within ± 15% and precision allowed to be less than 15% of the nominal concentration. However, the LLOQ was to be within ± 20%.

2.5.4. Recovery and Matrix Effect

The recovery study of the analyte is to ensure that the extraction method is efficient and reproducible. Matrix effects were examined by assessing ion suppression or the enhancement induced by the plasma matrix during the analysis. Recovery and the matrix effect were evaluated by preparing the solution in three ways: pre (A) (an analyte spiked before the extraction matrix), post (B) (spiked analytes after the post-extraction matrix), and pure (C) (pure analyte solutions prepared in 100% methanol). The recovery and matrix effect of PTX, PTX-M1, PTX-M5, DNP, IS1, and IS2 at three QC concentrations with six replicates were analyzed. The recovery and matrix effect were evaluated by comparing the peak areas of (A) to those of (B) and the peak areas of (B) to (C), respectively.

2.5.5. Stability

The stability of the solutions of PTX, PTX-M1, PTX-M5, and DNP was evaluated via three replicates of low and high QC concentrations, stock solutions stored at room temperature for 3 h, and working solutions stored at room temperature for 7 h. It was compared to their peak areas with a freshly prepared stock solution and a working solution. The stability of PTX, PTX-M1, PTX-M5, and DNP in rat plasma was evaluated by analyzing QC samples three times at each concentration (low, medium, and high). Plasma stability was investigated at different storage periods and different temperatures. The minimum stability required during the experiment was prespecified as follows: short-term stability at room temperature, refrigerated temperature (4 °C), and frozen temperature (−70 °C) for 7 h, respectively; freeze-thaw stability after 4 cycles was set at −70 °C for as many cycles as needed to analyze the sample; autosampler stability was set for 30 h in an autosampler at 10 °C after PP preparation; long-term stability was set at −70 °C for 54 days.

2.5.6. Dilution Integrity

Dilution integrity evaluates whether dilution with the same biological sample does not affect the analysis if the sample concentration exceeds the maximum quantitative limit or if the amount of the sample used for the analysis is insufficient. The dilution method was validated by analyzing 5-fold-diluted QC samples 5 times. Diluted QC concentrations (5, 3000, and 5000 ng mL−1 for PTX; 30, 2500, and 4000 ng mL−1 for PTX-M1; 60, 1000, and 5000 ng mL−1 for PTX-M5; 6, 75, and 400 ng mL−1 for DNP) were prepared as described in Section 2.3 and pretreated as described in Section 2.4. Both precision and accuracy were calculated as the percentage deviation from the theoretical concentration, with the acceptable range within 15% and the CV acceptable range within 15%, respectively.

2.6. Pharmacokinetic Study in Rats

The validated method was applied to the pharmacokinetic analysis of the plasma samples, which were collected after the concurrent oral administration of PTX and DNP to six healthy male Sprague-Dawley (SD) rats (ORIENT BIO Inc., Gapyeong-gun, South of Korea). SD rats were selected because they are widely used in toxicity tests, have abundant basic test data available, and it is easy to interpret and evaluate test results using these data. SD rats were kept under standardized conditions. Animals were fasted overnight and allowed free access to water. DPZ powder and PTX powder in aqueous solutions were orally administered to SD rats using an oral zoned needle at an equivalent DPZ dose of 10 mg/kg and a PTX dose of 300 mg/kg. Blood samples (0.5 mL) were collected in heparin-treated (5 IU/mL) tubes from a jugular vein at the following time points of 0.5, 1, 2, 4, 8, and 24 h after oral administration, and cross-blood sampling was performed three times for each point. The blood samples were centrifuged immediately for plasma separation, then the plasma samples were stored at −70 °C until LC-MS/MS analysis. This test was conducted in compliance with the Animal Experimental Ethics Regulations of Notus Co., Ltd. (Guri, South of Korea, KNOTUS IACUC, protocol code: 21-KE-693; date of approval: 7 September 2021). A non-compartmental method for extravascular input, provided in the BA Calc® 2007 software (MFDS version 1.0.0; KFDA, Cheongju-si, Chungcheongbuk-do) [45], was used to calculate the pharmacokinetic parameters, including Cmax (maximum plasma drug concentration), Tmax (time taken to reach Cmax), t1/2 (terminal half-life), AUCinf (the area under the plasma concentration-time curve from time zero to infinity), and AUClast (the area under the plasma concentration-time curve from time zero to the time of the last measurable concentration).
An incurred sample reanalysis (ISR) procedure was also conducted by random computerized selection (sampling without replacement) near the Cmax and at the elimination phase of the pharmacokinetic profile. The results were compared with the data obtained earlier for the same samples using the same procedure. The percentage change in the value defined below should not be more than ± 20% (Repeat value—Initial value)/(Mean of repeat and initial values) 100 = Change (%)) [43,44].

3. Results and Discussion

3.1. Method Development

To optimize the mass parameters, 100 ng mL−1 of PTX, PTX-M1, PTX-M5, DNP, IS1, and IS2 were individually injected into the syringe pump of a mass spectrometer operating at a continuous flow rate of 10 μL/min. Turbo-ion spray-positive ESI interface modes were used for the fragment ions of analytes and ISs; detection was performed in MRM. The Q1 full-scan spectrum was ionized with a precursor ion of the protonated molecule [M + H]+ at m/z 279.3 for PTX, m/z 281.1 for PTX-M1, m/z 267.1 for PTX-M5, m/z 380.3 for DNP, m/z 285.3 for IS1, and m/z 387.3 for IS2. The main product ions that exhibited high signal sensitivity were m/z 181.1 for PTX and m/z 90.9 for DNP. Because of water loss [M-H2O + H]+ ions during ESI, m/z 263.1 for PTX-M1 and m/z 249.0 for PTX-M5 were protonated [46]. Fragmentation due to this water loss generally resulted in a high baseline, reducing the signal and specificity of the analytes [30]. Thus, the [M–H2O + H]+ ions were further fragmented for more selective analysis, with m/z 181.1 for PTX-M1 and m/z 220.9 for PTX-M5. This fragmentation is consistent with previously reported LC-MS/MS methods [30,31,32,33,37,38,39,40,41,42]. In addition, the main product ions of ISs were m/z 187.1 for IS1 and 98.3 for IS2. The ion transition that was finally selected is shown in Figure 1.
Optimization of the chromatographic conditions was conducted to achieve adequate peak shape, separation, sensitivity, decreased ion suppression, and shortened run time. In our extensive preliminary experiments, we used various chromatographic reverse columns, including the Phenomenex Kinetex® C8 column (100 × 4.6 mm, 2.6 µm), Phenomenex Kinetex® PS C18 column (100 × 4.6 mm, 2.6 µm), Phenomenex Luna® C8 column (50 × 2.0 mm, 3 µm), Phenomenex Kinetex® C18 column (100 × 4.6 mm, 2.6 µm), and Halo® Phenyl-Hexyl column (100 × 2.1 mm, 2.7 µm). Among these columns, the Imtakt Cadenza® CD-C18 column (100 × 3.0 mm, 3 µm) showed the most optimal results in terms of peak shape, separation, sensitivity, and retention time. We also evaluated mobile phases containing an organic solvent (e.g. methanol and acetonitrile) and various buffers (e.g. formic acid, acetic acid, and ammonium acetate) to optimize peak intensity, peak shape, stable response, and separation. Based on optimization trials, chromatographic separation with Cadenza® CD-C18 column (100 × 3.0 mm, 3 mm) at 40 °C (column temperature) and the isocratic elution of a mobile phase composed of 0.1% formic acid and 100% methanol provided the most optimal peak appearance, separability, high sensitivity, and reproducibility of the four analytes.

3.2. Method Validation

3.2.1. Selectivity and Sensitivity

The selectivity of the developed analytical method was demonstrated in six samples of blank rat plasma and one pooled blank rat plasma of different origins to assess the interference in the retention time of the analytes and ISs. Figure 2 shows a representative selectivity chromatogram of PTX, PTX-M1, PTX-M5, and DNP in rat plasma. No interference peaks were observed on all PTX, PTX-M1, PTX-M5, DNP, IS1, and IS2 chromatograms, the selectivity of the method was considered acceptable, and all four analytes were quantifiable without affecting one another at ULOQ. The LLOQ of all analytes showed an S/N ratio of > 10, and the LLOQ concentrations of PTX, PTX-M1, PTX-M5, and DNP were 5 ng mL−1, 10 ng mL−1, 20 ng mL−1, and 2 ng mL ng mL−1, respectively. The CV values of the LLOQ area ratio for all analytes were within 20%. The LODs for PTX, PTX-M1, PTX-M5, and DNP in rat plasma were 1 ng mL−1, 1 ng mL−1, 5 ng mL−1, and 0.5 ng mL−1, respectively.

3.2.2. Linearity and Carry-Over

All the calibration curves of PTX, PTX-M1, PTX-M5, and DNP were plotted for eight concentrations via linear regression, using a 1/x2 weighting at the ranges of 5–8000 ng mL−1, 10–5000 ng mL−1, 20–15,000 ng mL−1, and 2–500 ng mL−1, respectively. The linear regression equations of the calibration curves (n = 6) were expressed in mean ± SD for slopes and intercepts: y = 0.0048 (±0.0002) x − 0.0040 (±0.0013) for PTX, y = 0.0019 (±0.0001) x − 0.0013 (±0.0014) for PTX-M1, y = 0.00074 (±0.00006) x − 0.00015 (±0.0020) for PTX-M5, and y = 0.013 (±0.0003) x − 0.0072 (±0.0029) for DNP. The correlation coefficients (r2) were greater than 0.99 for all curves, and the CV (%) of the slope between the runs of the response factor was within 15% in the analyzed calibration curve ranges. The results of all calibration curves for PTX, PTX-M1, PTX-M5, and DNP are depicted in Table 2. No significant carry-over was observed at ULOQ and LLOQ concentrations in PTX, PTX-M1, PTX-M5, and DNP.

3.2.3. Precision and Accuracy

The intra- and inter-day assay precision and accuracy for PTX, PTX-M1, PTX-M5, and DNP are summarized in Table 3. The intra-day precision (CV (%)) of the developed method to determine concentrations ranged from 0.69% to 5.65%, with an accuracy ranging from 93.52% to 107.12% for all compounds. The inter-day precision (CV (%)) of the method ranged from 1.68% to 12.48%, with an accuracy ranging from 94.36% to 108.51% for all compounds. All results satisfied the precision and accuracy criteria ranges (%) specified in the guidance of the USFDA and MFDS for bioanalytical applications [43,44].

3.2.4. Recovery and Matrix Effect

The extraction recovery and matrix effects of the developed PP methods in rat plasma were evaluated, and the results are summarized in Table 4. The ratio of the peak area of IS-to-analyte extracted from the plasma samples was measured six times for three QC concentrations (15, 3000, and 6400 for PTX; 30, 2500, and 4000 for PTX-M1; 60, 7000, and 12,000 for PTX-M5; 6, 75, and 400 for DNP) compared with the spiked post-extraction samples. The mean extraction recovery was 85.44% for PTX, 86.55% for PTX-M1, 87.50% for PTX-M5, and 86.23% for DNP. The mean extraction recovery of the IS1 (500 ng mL−1, n = 6) and IS2 (500 ng mL−1, n = 6) were 86.29% and 86.69%, respectively. The CV (%) values of the recovery were within ± 15%. This simultaneous quantification method provided a higher recovery than other methods for the single quantification of DNP or PTX [28,31,34,35]. Moreover, these results established a highly reproducible sample preparation procedure.
The mean matrix effect was 60.38% for PTX, 56.58% for PTX-M1, 30.37% for PTX-M5, and 25.82% for DNP. The mean matrix effect of the IS1 (500 ng mL−1, n = 6) and IS2 (500 ng mL−1, n = 6) were 52.35% and 24.20%, respectively. The CV (%) values of the matrix effects were within ± 15%. When methylene chloride (MC), ethyl acetate (EtOAc), and methyl tertiary-butyl ether (MTBE) were used in the LLE method for optimal DNP extraction, the matrix effect was more than 90%, which is almost unaffected by the matrix. However, in the case of PTX-M5, LLOQ was not quantified because of the low extraction efficiency in the LLE extraction method. Therefore, PP with methanol was evaluated for the simultaneous quantification of PTX, PTX-M1, PTX-M5, and DNP. PTX-M5 and DNP were found to be heavily affected by the matrix, with a mean matrix effect of 30.37% and 25.82%, respectively. However, the LLOQ and LOD of PTX-M5 were 20 ng mL−1 and 5 ng mL−1, and those of DNP were 2 ng mL−1 and 0.5 ng mL−1, respectively. Ultimately, no problem with the concentration quantification required for the pharmacokinetic study was identified.

3.2.5. Stability

The results concerning stability are summarized in Table 5. The stabilities of the stock and working solutions of PTX, PTX-M1, PTX-M5, and DNP were 94.24–99.31% and 97.75–101.49%, respectively. Analytes including PTX, PTX-M1, PTX-M5, and DNP in rat plasma were also stable at different conditions: room temperature for 7 h (92.31–108.80%), 4 °C for 7 h (90.84–111.40%), −70 °C for 7 h (86.40–114.63%), and in long-term storage at −70 °C for 54 days (94.56–109.17%). The plasma samples were also stable (97.34–108.58%) after four freeze-thaw cycles. In addition, the extracted samples from PP were stable (96.46–108.75%) in the autosampler (10 °C) for 30 h. Insignificant changes in stability under all experimental conditions ensured the stability of PTX, PTX-M1, PTX-M5, and DNP.

3.2.6. Dilution Integrity

Rat plasma samples with measured concentrations exceeding ULOQ (8000 ng mL−1 for PTX, 5000 ng mL−1 for PTX-M1, and 15,000 ng mL−1 for PTX-M5) were further diluted five times to detect the concentration within the calibration curve concentration range. Five samples of each concentration were prepared; the results of the 5-fold dilution validation experiment of PTX, PTX-M1, PTX-M5, and DNP in rat plasma are shown in Table 6. The accuracy and precision of the diluted sample concentrations met the validation criteria, which were defined as deviations from nominal concentrations within the acceptable range of 15%, indicating that this method is capable of analyzing samples above the ULOQ.

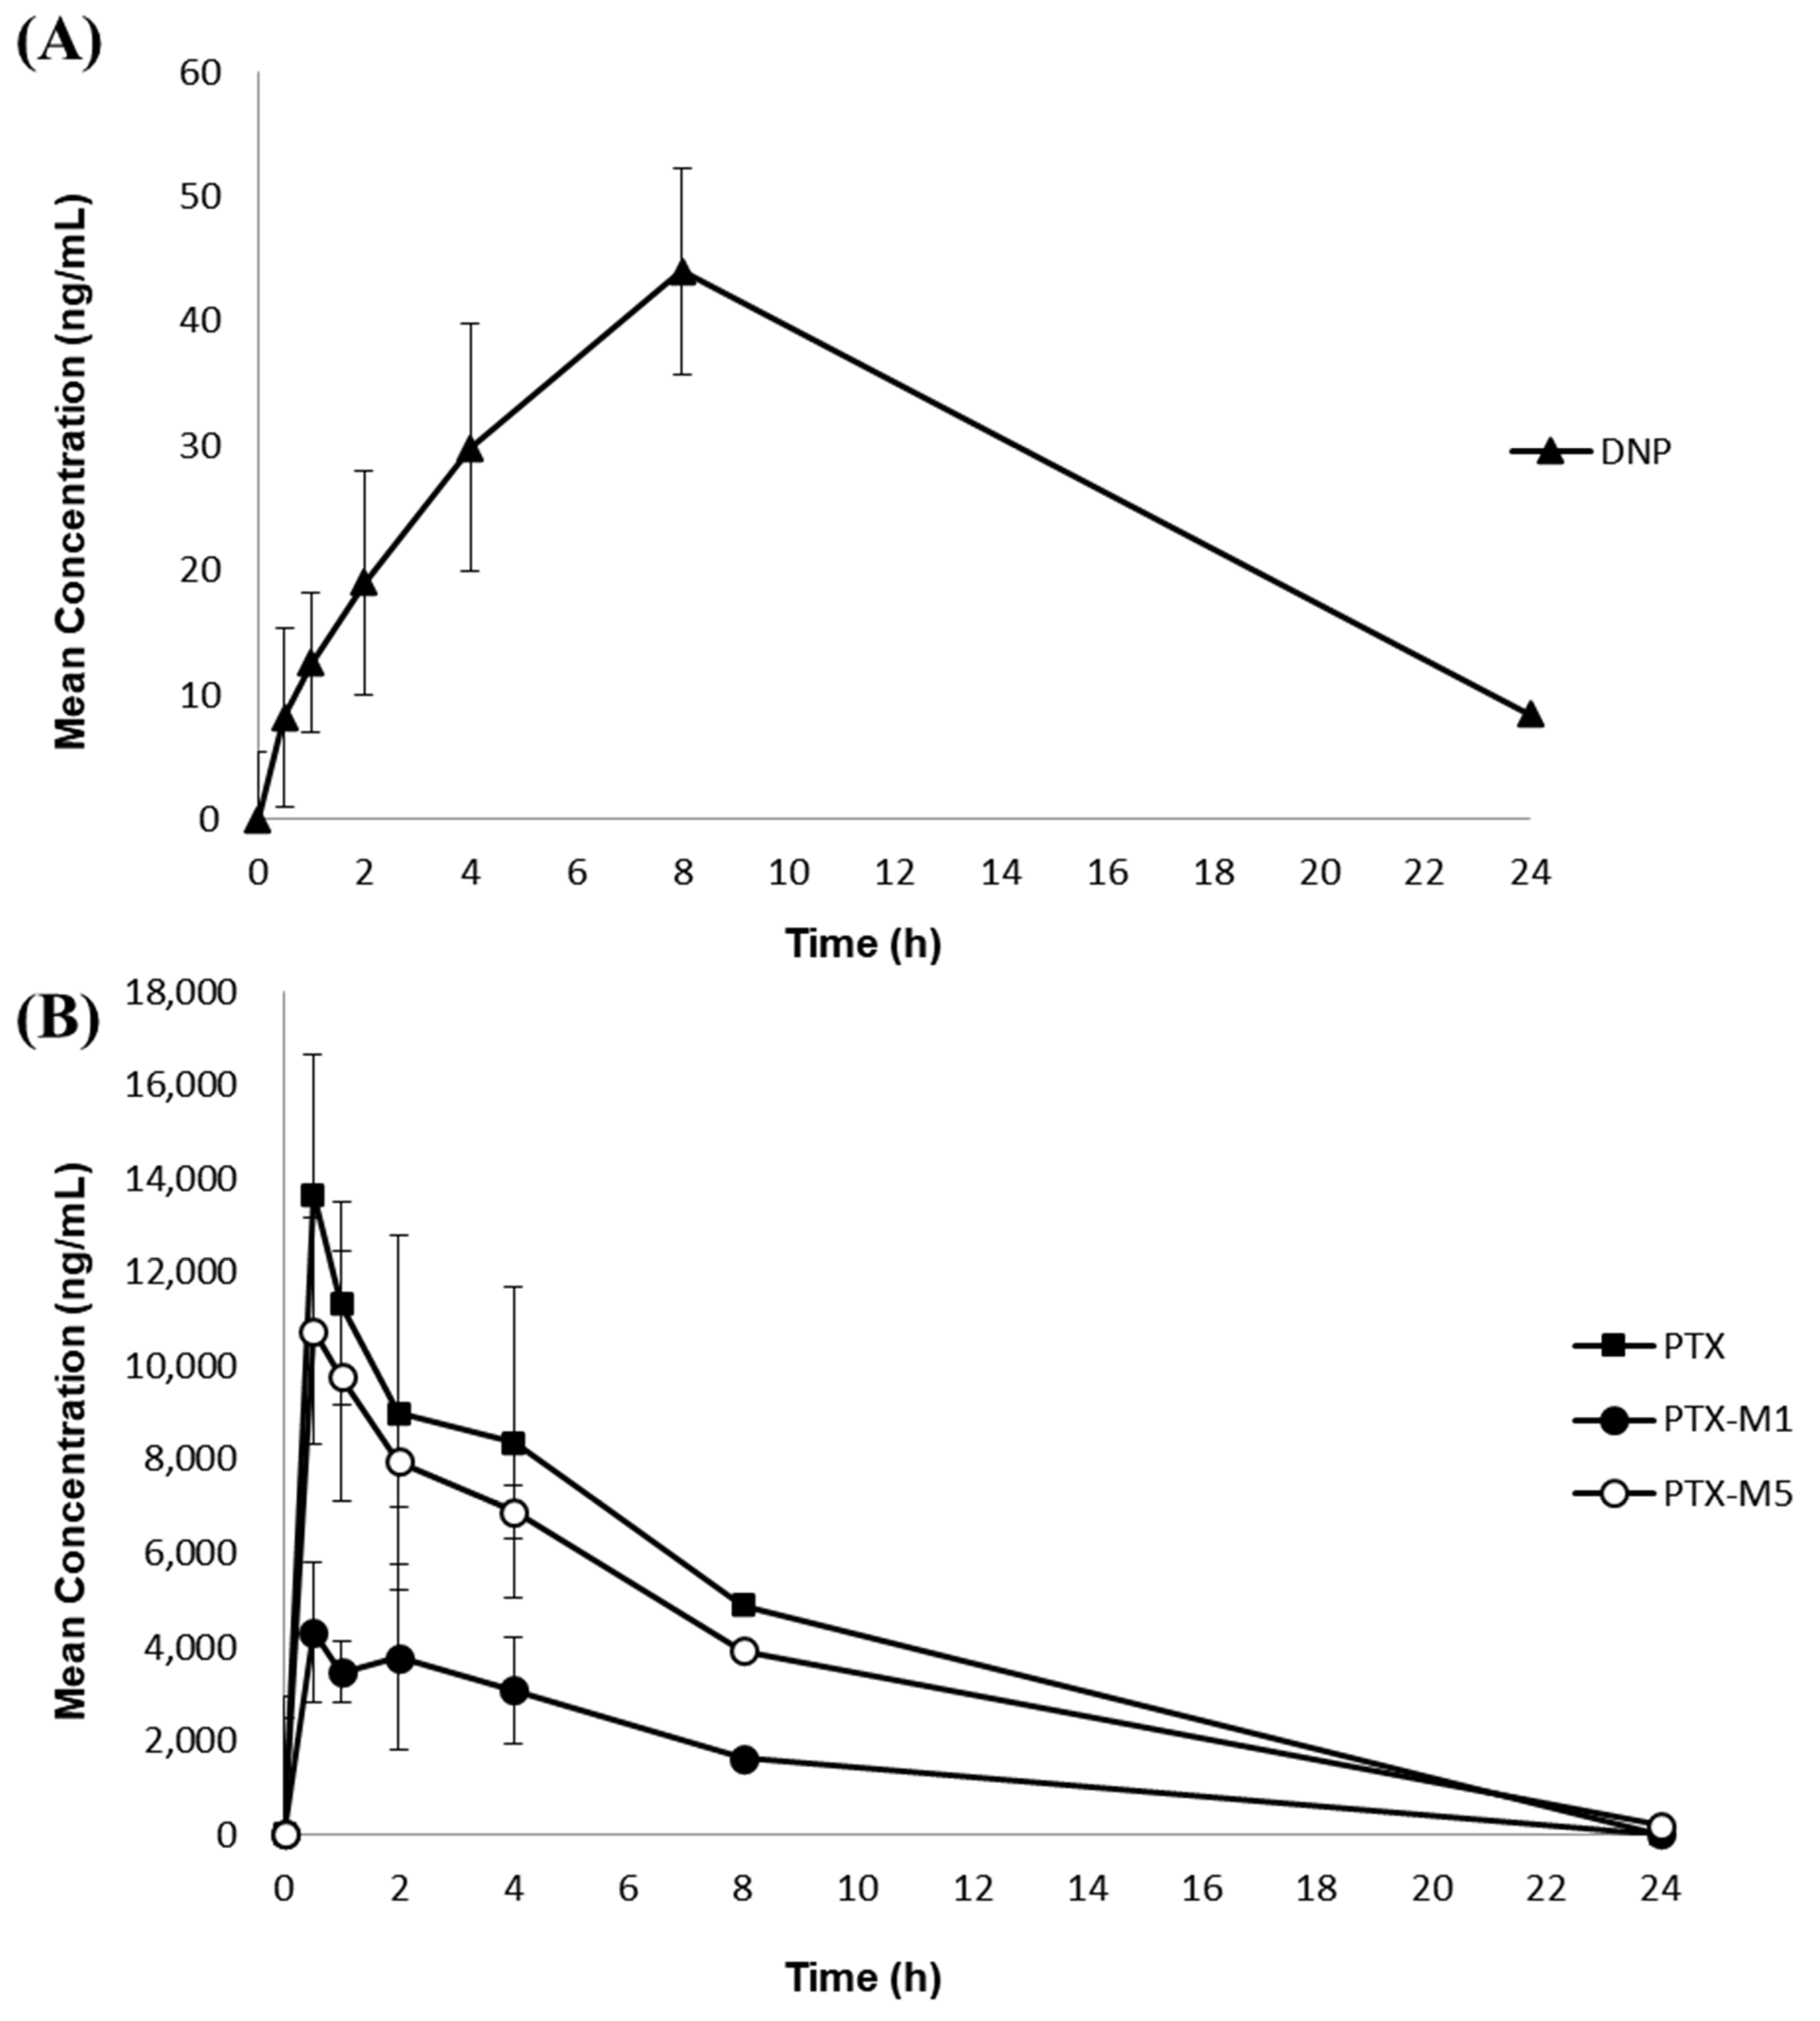
3.3. Application to a Pharmacokinetic Study in Rats

The fully validated simultaneous quantification method was then applied to a nonclinical pharmacokinetic study on the concurrent oral administration of 10 mg/kg DNP and 300 mg/kg PTX in rats. This method was sensitive enough to monitor the concentrations of DNP and PTX simultaneously for 24 h after administration. As the measured concentrations of rat plasma samples were higher than ULOQ, these samples were diluted and reanalyzed, as described in Section 2.5.6. Figure 3A, B shows the mean ± SD plasma concentration-time curves of DNP, PTX, and its metabolites. Table 7 shows the pharmacokinetic parameters of the 10 mg/kg DNP and the 300 mg/kg PTX orally co-administered to rats and calculated using the non-compartmentalization method. DNP absorption in the gastrointestinal tract occurred very slowly and Tmax was reached within 3–5 h [5]. As shown in Figure 3 and Table 7, the Cmax of DNP was 44.1 ± 9.9 ng mL−1 and was achieved at 7.3 ± 1.6 h. The reason why the average Tmax of DNP was slower than the previously known Tmax can be associated with the high DNP dose (10 mg/kg) since DNP has linear pharmacokinetic profiles at a dosage of between 1 and 10 mg/day [5]. Another possible reason for the slow Tmax may be due to changes in DNP absorption influenced by a drug interaction with PTX. For PTX and its metabolites, the Cmax was 14,798.5 ± 2038.1 ng mL−1 for PTX, 5016.2 ± 1040.5 ng mL−1 for PTX-M1, and 11,573.8 ± 2796.3 ng mL−1 for PTX-M5. The mean Tmax in humans with 100, 200, and 400 mg of PTX oral administration in healthy individuals was 0.29–0.41 h [24]. However, in this study, the median Tmax was delayed: PTX (0.75 h), PTX-M1 0.75 h), and PTX-M5 (0.75 h); this may be associated with variability in drug absorption among rats because the Tmax of one rat was 4 h, whereas all other rats had a Tmax of 0.5 h−1 h. The terminal removal half-life was longer for PTX metabolites: PTX (1.8 ± 0.3 h), PTX-M1 (2.1 ± 0.4 h), and PTX-M5 (3.7 ± 0.9 h). The PTX metabolites, including PTX-M1 and PTX-M5, were observed at high concentrations in plasma immediately after PTX administration, due to fast metabolism [10]. In general, the AUClast and Cmax of the PTX metabolites, PTX-M5 and PTX-M1, are greater than PTX in humans after oral PTX administration (M5 > M1 > PTX) [17]. However, these in vivo pharmacokinetic study results revealed greater AUClast and Cmax for PTX than the metabolites (PTX > M5 > M1). Nonetheless, similar results from a pharmacokinetic study on intravenous PTX administration in rats, demonstrating greater Cmax (15,835.204 ± 711.96 ng mL−1) and AUClast (17,092.707 ± 1008.34 ng·h/mL) for PTX than PTX-M1 [22], indicate the successful application of the established method.

3.4. Incurred Sample Reanalysis (ISR)

ISR was performed to evaluate the reproducibility of the quantitative analytical method, which was developed according to the biological validation guidelines [43,44]. The method was considered reproducible if at least 67% of the reanalyzed samples had a deviation within ±20% of the original measurement. ISR samples that exceeded the ULOQ concentration were further diluted and reanalyzed, as described in Section 2.5.6. The simultaneous quantitative analytical method satisfied the regulatory ISR acceptance criteria: 96.97% for PTX, 100.00% for PTX-M1, 94.59% for PTX-M5, and 100.00% for DNP in the rat samples.

4. Conclusions

This is the first study establishing a novel, simple, reliable, and reproducible LC-MS/MS analytical assay for the simultaneous quantitation of PTX, PTX-M1, PTX-M5, and DNP in rat plasma. The newly developed method was fully validated regarding selectivity, linearity, accuracy, precision, stability, dilution integrity, and reproducibility, according to the MFDS and USFDA guidelines [43,44]. The simultaneous quantification method was successfully applied to pharmacokinetic research on the concurrent oral administration of 10 mg/kg DNP and 300 mg/kg PTX in rats. The distinctive features of this method include a fast and simple procedure with one-step PP extraction, the detection of various PTX metabolites, high sensitivity and recovery, and the requirement of a small plasma volume (30 µL) for the analyses. Furthermore, high-throughput sample analysis with high reproducibility implies the reasonable application of the established method to clinical pharmacokinetic studies of PTX and DNP.

Author Contributions

Conceptualization, S.-H.P. and K.-T.L.; data curation, S.C., W.-S.S. and Y.J.C.; formal analysis, S.C., W.-S.S., J.Y., D.C. and E.S.; investigation, S.C. and W.-S.S.; methodology, S.C. and W.-S.S.; project administration, K.-T.L.; supervision, S.-H.P. and K.-T.L.; validation, S.C. and W.-S.S.; writing—original draft, S.C.; writing—review and editing, S.C., W.-S.S., Y.J.C., S.-H.P. and K.-T.L. All authors have read and agreed to the published version of the manuscript.

Funding

This study was supported by a grant from the Ministry of SMEs and Startups and Neurorive Inc., Republic of Korea (grant number: J2005659).

Institutional Review Board Statement

This test was conducted in compliance with the Animal Experimental Ethics Regulations of the Notus Co., Ltd. (Guri, Korea, KNOTUS IACUC) (protocol code: 21-KE-693; date of approval: 7 September 2021).

Informed Consent Statement

Not applicable.

Data Availability Statement

The data presented in this study are available upon request.

Conflicts of Interest

The authors declare no conflict of interest. The funders had no role in the design of the study; in the collection, analyses, or interpretation of data; in the writing of the manuscript, or in the decision to publish the results.

References

  1. Khan, A.; Kalaria, R.N.; Corbett, A.; Ballard, C. Update on Vascular Dementia. J. Geriatr. Psychiatry Neurol. 2016, 29, 281–301. [Google Scholar] [CrossRef] [PubMed]
  2. Lobo, A.; Launer, L.J.; Fratiglioni, L.; Andersen, K.; Di Carlo, A.; Breteler, M.; Copeland, J.; Dartigues, J.F.; Jagger, C.; Martinez-Lage, J. Prevalence of Dementia and Major Subtypes in Europe: A Collaborative Study of Population-Based Cohorts. Neurology 2000, 54, S4. [Google Scholar] [PubMed]
  3. Ott, A.; Breteler, M.M.; Van Harskamp, F.; Claus, J.J.; Van Der Cammen, T.J.; Grobbee, D.E.; Hofman, A. Prevalence of Alzheimer’s Disease and Vascular Dementia: Association with Education. the Rotterdam Study. BMJ 1995, 310, 970–973. [Google Scholar] [CrossRef] [PubMed]
  4. Smith, E.E.; Barber, P.; Field, T.S.; Ganesh, A.; Hachinski, V.; Hogan, D.B.; Lanctôt, K.L.; Lindsay, M.P.; Sharma, M.; Swartz, R.H. Canadian Consensus Conference on Diagnosis and Treatment of Dementia (CCCDTD) 5: Guidelines for Management of Vascular Cognitive Impairment. Alzheimer’s Dement. Transl. Res. Clin. Interv. 2020, 6, e12056. [Google Scholar] [CrossRef] [PubMed]
  5. Seltzer, B. Donepezil: An Update. Expert Opin. Pharmacother. 2007, 8, 1011–1023. [Google Scholar] [CrossRef]
  6. Wilkinson, D.; Doody, R.; Helme, R.; Taubman, K.; Mintzer, J.; Kertesz, A.; Pratt, R.D. Donepezil in Vascular Dementia: A Randomized, Placebo-Controlled Study. Neurology 2003, 61, 479–486. [Google Scholar] [CrossRef]
  7. Black, S.; Román, G.C.; Geldmacher, D.S.; Salloway, S.; Hecker, J.; Burns, A.; Perdomo, C.; Kumar, D.; Pratt, R. Efficacy and Tolerability of Donepezil in Vascular Dementia: Positive Results of a 24-Week, Multicenter, International, Randomized, Placebo-Controlled Clinical Trial. Stroke 2003, 34, 2323–2330. [Google Scholar] [CrossRef]
  8. Ward, A.; Clissold, S.P. Pentoxifylline. Drugs 1987, 34, 50–97. [Google Scholar] [CrossRef]
  9. George, J.; Abel, P. Pentoxifylline. In xPharm: The Comprehensive Pharmacology Reference; Elsevier Inc.: Amsterdam, The Netherlands, 2008; pp. 1–18. [Google Scholar]
  10. Frampton, J.E.; Brogden, R.N. Pentoxifylline (Oxpentifylline). Drugs Aging 1995, 7, 480–503. [Google Scholar] [CrossRef]
  11. Ernst, E. Pentoxifylline for Intermittent Claudication: A Critical Review. Angiology 1994, 45, 339–345. [Google Scholar] [CrossRef]
  12. McCarty, M.F.; O’Keefe, J.H.; DiNicolantonio, J.J. Pentoxifylline for Vascular Health: A Brief Review of the Literature. Open Heart 2016, 3, e000365. [Google Scholar] [CrossRef] [PubMed]
  13. Schröer, R.H. Antithrombotic Potential of Pentoxifylline a Hemorheologically Active Drug. Angiology 1985, 36, 387–398. [Google Scholar] [CrossRef] [PubMed]
  14. Michael, C.S.; Callahan, C.M. The Efficacy of Pentoxifylline in the Treatment of Vascular Dementia: A Systematic Review. Alzheimer Dis. Assoc. Disord. 2003, 17, 46–54. [Google Scholar]
  15. Müller, R.; Lehrach, F. Haemorheology and Cerebrovascular Disease: Multifunctional Approach with Pentoxifylline. Curr. Med. Res. Opin. 1981, 7, 253–263. [Google Scholar] [CrossRef]
  16. Sabayan, B.; Jansen, S.; Oleksik, A.M.; van Osch, M.J.; van Buchem, M.A.; van Vliet, P.; de Craen, A.J.; Westendorp, R.G. Cerebrovascular Hemodynamics in Alzheimer’s Disease and Vascular Dementia: A Meta-Analysis of Transcranial Doppler Studies. Ageing Res. Rev. 2012, 11, 271–277. [Google Scholar] [CrossRef] [PubMed]
  17. Magnusson, M.V. Pharmacokinetics and Pharmacodynamics of Pentoxifylline and Metabolites. Ph.D. Thesis, Lund University, Faculty of Medicine, Lund, Sweden, 2009; p. 29. [Google Scholar]
  18. Aviado, D.M.; Dettelbach, H.R. Pharmacology of Pentoxifylline a Hemorheologic Agent for the Treatment of Intermittent Claudication. Angiology 1984, 35, 407–417. [Google Scholar] [CrossRef]
  19. Beermann, B.; Ings, R.; Månsby, J.; Chamberlain, J.; McDonald, A. Kinetics of Intravenous and Oral Pentoxifylline in Healthy Subjects. Clin. Pharmacol. Ther. 1985, 37, 25–28. [Google Scholar] [CrossRef]
  20. Seltzer, B. Donepezil: A Review. Expert Opin. Drug Metab. Toxicol. 2005, 1, 527–536. [Google Scholar] [CrossRef]
  21. Tiseo, P.J.; Perdomo, C.A.; Friedhoff, L.T. Metabolism and Elimination of 14C-Donepezil in Healthy Volunteers: A Single-Dose Study. Br. J. Clin. Pharmacol. 1998, 46, 19. [Google Scholar] [CrossRef]
  22. Matsui, K.; Mishima, M.; Nagai, Y.; Yuzuriha, T.; Yoshimura, T. Absorption, Distribution, Metabolism, and Excretion of Donepezil (Aricept) After a Single Oral Administration to Rat. Drug Metab. Dispos. 1999, 27, 1406–1414. [Google Scholar]
  23. Ambrus, J.L.; Stadler, S.; Kulaylat, M. Hemorrheologic Effects of Metabolites of Pentoxifylline (Trental). J. Med. 1995, 26, 65–75. [Google Scholar]
  24. Smith, R.V.; Waller, E.S.; Doluisio, J.T.; Bauza, M.T.; Puri, S.K.; Ho, I.; Lassman, H.B. Pharmacokinetics of Orally Administered Pentoxifylline in Humans. J. Pharm. Sci. 1986, 75, 47–52. [Google Scholar] [CrossRef] [PubMed]
  25. Italiya, K.S.; Sharma, S.; Kothari, I.; Chitkara, D.; Mittal, A. Simultaneous Estimation of Lisofylline and Pentoxifylline in Rat Plasma by High Performance Liquid Chromatography-Photodiode Array Detector and its Application to Pharmacokinetics in Rat. J. Chromatogr. B 2017, 1061, 49–56. [Google Scholar] [CrossRef] [PubMed]
  26. Nicklasson, M.; Björkman, S.; Roth, B.; Jönsson, M.; Höglund, P. Stereoselective Metabolism of Pentoxifylline in Vitro and in Vivo in Humans. Chirality Pharmacol. Biol. Chem. Conseq. Mol. Asymmetry 2002, 14, 643–652. [Google Scholar] [CrossRef]
  27. Chmielewska, A.; Konieczna, L.; Plenis, A.; Lamparczyk, H. Quantitative Determination of Pentoxifylline in Human Plasma. Acta Chromatogr. 2006, 16, 70. [Google Scholar]
  28. Walczak, M.; Szymura-Oleksiak, J.; Pękala, E. Validation of a High-Performance Liquid Chromatography Method for Pharmacokinetic Evaluation of Pentoxifylline and Lisofylline in Rat Serum and Tissues. Acta Pol. Pharmaceutica. Drug Res. 2009, 66, 215–224. [Google Scholar]
  29. Mancinelli, A.; Pace, S.; Marzo, A.; Martelli, E.A.; Passetti, G. Determination of Pentoxifylline and its Metabolites in Human Plasma by High-Performance Liquid Chromatography with Solid-Phase Extraction. J. Chromatogr. B Biomed. Sci. Appl. 1992, 575, 101–107. [Google Scholar] [CrossRef]
  30. Vlase, L.; Kiss, B.; Muntean, D.; Leucuţa, S.E. Rapid High-Performance Liquid Chromatography–tandem Mass Spectrometry Method for Determination of Pentoxifylline and its Active Metabolites M1 and M5 in Human Plasma and its Application in Bioavailability Study. Talanta 2010, 82, 945–951. [Google Scholar] [CrossRef]
  31. Sora, D.I.; Cristea, E.; Albu, F.; David, V.; Medvedovici, A. Bioanalysis of Pentoxifylline and Related Metabolites in Plasma Samples through LC-MS/MS. Biomed. Chromatogr. 2010, 24, 663–674. [Google Scholar] [CrossRef]
  32. Page-Sharp, M.; Strunk, T.; Salman, S.; Hibbert, J.; Patole, S.K.; Manning, L.; Batty, K.T. Simultaneous Determination of Pentoxifylline, Metabolites M1 (Lisofylline), M4 and M5, and Caffeine in Plasma and Dried Blood Spots for Pharmacokinetic Studies in Preterm Infants and Neonates. J. Pharm. Biomed. Anal. 2017, 146, 302–313. [Google Scholar] [CrossRef]
  33. Kyle, P.B.; Adcock, K.G.; Kramer, R.E.; Baker, R.C. Use of Liquid Chromatography–tandem Mass Spectrometry for the Analysis of Pentoxifylline and Lisofylline in Plasma. Biomed. Chromatogr. 2005, 19, 231–236. [Google Scholar] [CrossRef] [PubMed]
  34. Koeber, R.; Kluenemann, H.; Waimer, R.; Koestlbacher, A.; Wittmann, M.; Brandl, R.; Doerfelt, A.; Jahner, T.; Melchner, D.; Haen, E. Implementation of a Cost-Effective HPLC/UV-Approach for Medical Routine Quantification of Donepezil in Human Serum. J. Chromatogr. B 2012, 881, 1–11. [Google Scholar] [CrossRef] [PubMed]
  35. Radwan, M.A.; Abdine, H.H.; Al-Quadeb, B.T.; Aboul-Enein, H.Y.; Nakashima, K. Stereoselective HPLC Assay of Donepezil Enantiomers with UV Detection and its Application to Pharmacokinetics in Rats. J. Chromatogr. B 2006, 830, 114–119. [Google Scholar] [CrossRef]
  36. Yasui-Furukori, N.; Furuya, R.; Takahata, T.; Tateishi, T. Determination of Donepezil, an Acetylcholinesterase Inhibitor, in Human Plasma by High-Performance Liquid Chromatography with Ultraviolet Absorbance Detection. J. Chromatogr. B 2002, 768, 261–265. [Google Scholar] [CrossRef] [PubMed]
  37. Katakam, P.; Kalakuntla, R.R.; Adiki, S.K.; Chandu, B.R. Development and Validation of a Liquid Chromatography Mass Spectrometry Method for the Determination of Donepezil in Human Plasma. J. Pharm. Res. 2013, 7, 720–726. [Google Scholar] [CrossRef]
  38. Khuroo, A.H.; Gurule, S.J.; Monif, T.; Goswami, D.; Saha, A.; Singh, S.K. ESI-MS/MS Stability-indicating Bioanalytical Method Development and Validation for Simultaneous Estimation of Donepezil, 5-desmethyl Donepezil and 6-desmethyl Donepezil in Human Plasma. Biomed. Chromatogr. 2012, 26, 636–649. [Google Scholar] [CrossRef]
  39. Mano, Y.; Hotta, K.; Kusano, K. Simultaneous Determination of Donepezil and its Three Metabolites in Human Plasma using LC–MS-MS. J. Chromatogr. Sci. 2016, 54, 1328–1335. [Google Scholar] [CrossRef]
  40. Pilli, N.R.; Inamadugu, J.K.; Kondreddy, N.; Karra, V.K.; Damaramadugu, R.; Rao, J.N.S. A Rapid and Sensitive LC-MS/MS Method for Quantification of Donepezil and its Active Metabolite, 6-o-desmethyl Donepezil in Human Plasma and its Pharmacokinetic Application. Biomed. Chromatogr. 2011, 25, 943–951. [Google Scholar] [CrossRef]
  41. Shah, H.J.; Kundlik, M.L.; Pandya, A.; Prajapati, S.; Subbaiah, G.; Patel, C.N.; Patel, D.M.; Suhagiya, B.N. A Rapid and Specific Approach for Direct Measurement of Donepezil Concentration in Human Plasma by LC-MS/MS Employing Solid-phase Extraction. Biomed. Chromatogr. 2009, 23, 141–151. [Google Scholar] [CrossRef]
  42. Bhateria, M.; Ramakrishna, R.; Pakala, D.B.; Bhatta, R.S. Development of an LC–MS/MS Method for Simultaneous Determination of Memantine and Donepezil in Rat Plasma and its Application to Pharmacokinetic Study. J. Chromatogr. B 2015, 1001, 131–139. [Google Scholar] [CrossRef]
  43. Food and Drug Administration. Bioanalytical Method Validation Guidance for Industry. US Department of Health and Human Services. 2018. Available online: https://www.fda.gov/media/70858/download (accessed on 3 November 2022).
  44. Ministry of Food and Drug Safety. Guideline on Bioanalytical Method Validation. 2013. Available online: https://www.mfds.go.kr/brd/m_1060/view.do?seq=13054&srchFr=&srchTo=&srchWord=&srchTp=&itm_seq_1=0&itm_seq_2=0&multi_itm_seq=0&company_cd=&company_nm=&page=1 (accessed on 3 November 2022).
  45. Lee, Y.J.; Chung, S.J.; Shim, C.K. BA Calc 2007® for Windows®; Version 1.0.0; 2007. [Google Scholar]
  46. Reid, G.E.; Simpson, R.J.; O’Hair, R.A. Leaving Group and Gas Phase Neighboring Group Effects in the Side Chain Losses from Protonated Serine and its Derivatives. J. Am. Soc. Mass Spectrom. 2000, 11, 1047–1060. [Google Scholar] [CrossRef] [PubMed]
Figure 1. Product ion mass spectra and the fragmentation of (A) PTX, (B) PTX-M1, (C) PTX-M5, (D) DNP, (E) PTX-d6 (internal standard, IS1), and (F) DNP-d7 (internal standard, IS2).
Separations 10 00276 g001
Figure 2. Chromatograms of (A) blank rat plasma; (B) blank plasma spiked with IS1 (500 ng mL−1); (C) blank plasma spiked with IS2 (500 ng mL−1); (D) blank plasma spiked with PTX only (8000 ng mL−1, ULOQ); (E) blank plasma spiked with PTX-M1 only (5000 ng mL−1, ULOQ); (F) blank plasma spiked with PTX-M5 only (15,000 ng mL−1, ULOQ); (G) blank plasma spiked with DNP only (500 ng mL−1, ULOQ); (H) blank plasma spiked with PTX (5 ng mL−1), PTX-M1 (10 ng mL−1), PTX-M5 (20 ng mL−1), DNP (2 ng mL−1), IS1 (500 ng mL−1), and IS2 (500 ng mL−1); (I) rat plasma sample at 0.5 h after the concurrent oral administration of 10 mg/kg DNP and 300 mg/kg PTX (PTX measured concentration 13,016.99 ng mL−1, PTX-M1 measured concentration 5062.63 ng mL−1, PTX-M5 measured concentration 11,459.57 ng mL−1, and DNP measured concentration 12.32 ng mL−1).
Separations 10 00276 g002
Figure 3. Mean (±SD) plasma concentration–time profile of in the rat plasma samples of (A) DNP, (B) PTX, and its metabolites M1 and M5 after the concurrent oral administration of 10 mg/kg DNP and 300 mg/kg PTX in rats (n = 6).
Separations 10 00276 g003
Table 1. Ion transitions for mass spectrometric detection, mass parameters, and the retention times of PTX, PTX-M1, PTX-M5, DNP, PTX-d6, and DNP-d7.
CompoundsIon Transition
(m/z)
DP
(V)
EP
(V)
CE
(V)
CXP
(V)
RT
(min)
PTX279.3 → 181.176.08.023.010.02.68
PTX-M1281.1 → 263.1 → 181.190.08.023.010.02.72
PTX-M5267.1 → 249.0 → 220.985.08.020.010.02.50
DNP380.3 → 90.9116.010.061.014.02.24
PTX-d6285.3 → 187.190.08.026.010.02.67
DNP-d7387.3 → 98.3111.010.039.08.02.23
DP, declustering potential; EP, entrance potential; CE, collision energy; CXP, cell exit potential; RT, retention time.
Table 2. Linearity, as obtained after a regression analysis of the method for determining PTX, PTX-M1, PTX-M5, and DNP in rat plasma samples.
CompoundsNumberSlopeInterceptrr2
PTX10.004510.005460 0.9989 0.9978
20.004720.003680 0.9985 0.9970
30.004700.004280 0.9985 0.9970
40.005040.001550 0.9957 0.9914
50.004890.004730 0.9989 0.9978
60.005040.004350 0.9989 0.9978
PTX-M110.00195−0.001410 0.9984 0.9968
20.00191−0.002130 0.9998 0.9996
30.001900.001080 0.9996 0.9992
40.00208−0.003080 0.9991 0.9982
50.00192−0.001670 0.9994 0.9988
60.00180−0.0004850.9993 0.9986
PTX-M510.000791−0.000926 0.9983 0.9966
20.000742−0.003280 0.9978 0.9956
30.0006950.002090 0.9963 0.9926
40.000833−0.003300 0.9983 0.9966
50.000698−0.001810 0.9986 0.9972
60.000683−0.001510 0.9980 0.9960
DNP10.0127−0.004650 0.9991 0.9982
20.0125−0.003830 0.9980 0.9960
30.0128−0.006190 0.9996 0.9992
40.0135−0.008970 0.9995 0.9990
50.0129−0.007780 0.9999 0.9998
60.0127−0.011600 0.9997 0.9994
Table 3. Intra- and inter-day precision and accuracy of PTX, PTX-M1, PTX-M5, and DNP.
Compounds Nominal
Concentration (ng mL−1)
Intra-Day (n = 5)Inter-Day (n = 15)
Mean ± SD
(ng mL−1)
Precision (CV (%)) aAccuracy (%) bMean ± SD
(ng mL−1)
Precision (CV (%)) aAccuracy (%) b
PTX55.16±0.295.58103.185.01±0.254.89100.26
1515.70±0.110.69104.6616.28±0.523.19108.51
30003028.26±59.591.97100.942971.13±73.362.4799.04
64005985.27±153.482.5693.526038.95±155.822.5894.36
PTX-M11010.56±0.413.88105.6410.13±0.757.37101.33
3030.80±0.551.78102.6831.49±1.193.78104.98
25002556.16±36.851.44102.252541.35±64.632.54101.65
40004129.27±40.620.98103.234229.06±119.792.83105.73
PTX-M52019.85±0.824.1199.2619.33±2.4112.4896.66
6057.40±1.512.6495.6762.51±4.777.62104.19
70006792.50±214.913.1697.047168.79±370.715.17102.41
12,00012,298.99±87.260.71102.4912,780.86±513.324.02106.51
DNP22.14±0.125.65107.121.93±0.2211.2496.70
66.25±0.254.08104.155.92±0.335.5098.69
7577.09±1.521.98102.7977.30±1.301.68103.06
400414.79±16.794.05103.70427.23±15.313.58106.81
a CV (%) = (standard deviation of calculated concentration/mean concentration) × 100. b Accuracy (%) = (predicted concentration/nominal concentration) × 100.
Table 4. Extraction recovery and matrix effect of PTX, PTX-M1, PTX-M5, DNP, IS1, and IS2 (n = 6).
CompoundsNominal
Concentration
(ng mL−1)
Recovery (%)Matrix Effect (%)
Mean ± SD (%)CV (%)Mean ± SD (%)CV (%)
PTX1581.34±10.2012.5459.94±7.6312.72
300090.19±2.242.4856.76±0.851.49
640084.80±1.651.9564.45±1.181.83
Mean85.44±4.465.2260.38±3.866.40
PTX-M13085.08±3.414.0153.47±0.931.74
250089.44±2.072.3254.21±0.771.42
400085.12±1.942.2862.05±1.051.70
Mean86.55±2.512.9056.58±4.758.40
PTX-M56086.16±4.895.6827.74±0.913.27
700089.78±1.751.9529.66±0.732.47
12,00086.57±1.752.0233.72±0.471.39
Mean87.50±1.982.2730.37±3.0510.05
DNP680.00±7.118.8923.17±0.484.28
7592.19±1.051.1425.45±0.342.20
40086.49±2.613.0228.84±0.653.29
Mean86.23±6.107.0725.82±2.8511.05
IS150086.29±1.451.6852.35±0.440.83
IS250086.69±5.826.7124.20±2.0414.36
Table 5. Stability data for PTX, PTX-M1, PTX-M5, and DNP in methanol and rat plasma samples (n = 3).
CompoundsNominal
Concentration
(ng mL−1)
Solution Stability (Mean %)Plasma Stability (Mean %)
Stock, Room
Temperature (3 h)
Working, Room
Temperature (7 h)
Room
Temperature (7 h)
4 °C (7 h)−70 °C (7 h)Freeze-Thaw
Stability
(4 Cycles)
Autosampler, 10 °C
(7 h)
Long-Term, −70 °C
(54 Days)
PTX1594.2497.75108.80111.40114.63106.63104.49107.25
3000--97.1999.0197.83103.94102.3799.85
640096.8599.2692.3196.4192.7397.3498.2297.64
PTX-M13098.98100.88100.50106.06104.40105.68101.54103.22
2500--101.53105.33103.10105.56105.36102.68
400098.03101.11108.02110.16105.73107.20107.37109.17
PTX-M56097.89101.06104.60106.18101.23104.83100.94101.39
7000--108.2290.8486.40107.05106.4994.56
12,00099.31101.4996.6595.9494.17108.58108.75102.41
DNP696.8498.22101.35100.97100.0597.4996.4698.34
75--103.02104.73102.56105.44104.84105.08
40097.91100.64106.02102.64105.82106.84105.82104.45
Table 6. Results of the 5-fold dilute validation experiment of PTX, PTX-M1, PTX-M5, and DNP in rat plasma (n = 5).
Compounds Nominal
Concentration (ng mL−1)
Dilution Factor of 5
Mean ± SD (ng mL−1)CV (%)Accuracy (%)
PTX1513.75±0.332.3991.65
30003019.20±16.830.56100.64
50005075.99±30.700.60101.52
PTX-M13031.55±0.712.26105.16
25002569.14±47.621.85102.77
40004149.45±36.470.88103.74
PTX-M56061.12±4.266.97101.86
10001047.13±16.131.54104.71
50005385.26±121.742.26107.71
DNP66.43±0.253.91107.09
7569.42±1.422.0592.57
400395.52±6.051.5398.88
Table 7. Pharmacokinetic parameter estimates of PTX, PTX-M1, PTX-M5, and DNP after the concurrent oral administration of 10 mg/kg DNP and 300 mg/kg PTX in rats (n = 6).
Parameters (a)PTXPTX-M1PTX-M5DNP
Cmax
(ng mL−1)
14,798.5±20.15016.2±10.511,573.8±27.344.1±9.9
AUClast
(µ·h mL−1)
102,862.6±42.135,994.9±19.486,076.2±67.8639.5±16.2
AUCinf
(µg·h mL−1)
102,885.8±42.335,994.9±17.487,247.7±70.5 -
Median Tmax (h)0.75 0.75 0.75 8.0
t1/2 (h)1.8±0.32.1±0.43.7±0.9 -
(a) All results are expressed as a mean ± SD, except for Tmax.
Disclaimer/Publisher’s Note: The statements, opinions and data contained in all publications are solely those of the individual author(s) and contributor(s) and not of MDPI and/or the editor(s). MDPI and/or the editor(s) disclaim responsibility for any injury to people or property resulting from any ideas, methods, instructions or products referred to in the content.

