1. Introduction
According to GLOBOCAN 2020, a database developed by the International Agency for Research on Cancer (IARC) [
1], breast cancer (BC) is the most frequently diagnosed heterogeneous tumor among women worldwide, followed by lung (11.4%), colorectal (10.0%), prostate (7.3%), and stomach (5.6%) cancers, since nearly 2.3 million women (11.7% of all cancer cases) were affected in 2020 [
2]. In this sense, to avoid unnecessary complications as well as to increase the survival rates, it is crucial to invest in improving detection and treatment and create more targeted cancer control interventions.
Several diagnostic and screening procedures are used, including clinical and self-breast exams, mammography, genetic screening, ultrasound, and magnetic resonance imaging [
3]. However, the key drawback of most of the current approaches is their limited sensitivity and specificity [
4,
5]. In addition, improving diagnosis will need a multi-faceted method to optimize the use of presently offered imaging modalities and research novel approaches of detection, since most BCs are detected in advanced stages. Women’s negligence regarding self-inspection and clinical examination of the breast [
6] is the main factor for that.
Therefore, several studies have focused on discovering biomarkers, which through proteomic/peptidomic data may help to improve the recognition of different molecular mechanisms involved in important metabolomic pathways [
7,
8]. In the last few years, the search for non-invasive procedures that can enhance the sensitivity and specificity of BC diagnosis has been carried out. In this sense, low molecular weight urinary peptides can be applied as biomarkers for the diagnosis, prognosis, and therapy monitoring of several diseases. Thus, the identification and quantification of these peptides is a crucial step in the clinical field. Nevertheless, the low concentration and the small molecular weight of peptides represent a drawback in their detection and identification using conventional protein detection technology [
9].
Nowadays, attractive approaches toward the separation of complex mixtures comprise the application of electro- (both in-gel and in-solution procedures) and liquid-phase methodologies [
10]. The capability of electrophoretic procedures in the proteomics field has spread quite widely, becoming essential in several research laboratories over the world. Together with the development of mass spectrometry (MS) methods, the 1D or 2D gel-based proteomics with sample pre-treatment followed by sensitive analytical mass spectrometry tools (e.g., matrix-assisted laser desorption/ionization time of flight mass spectrometry (MALDI-TOF MS)) has been largely used to discover potential disease biomarkers [
11,
12,
13]. MALDI-TOF MS has become a powerful and versatile analytical technique for large-scale protein/peptide analysis to establish the urinary proteomics pattern and therefore a useful analytical approach to discrimination among cancer and healthy individuals [
14]. This advanced technological approach, which allows detecting and characterizing mixtures of organic molecules, consists of a soft ionization process employing a laser that reaches the analyte mixed with a solution of a matrix (e.g., α-cyano-4-hydroxycinnamic acid (CHCA), 2,5-dihydroxybenzoic acid (DHB) and 3,5-dimethoxy-4-hydroxycinnamic acid (SA)) in an organic solvent, which is able to absorb energy in the form of UV light [
15].
There are many urine proteomic/peptidomic profiling studies using different separation approaches coupled with MALDI in diverse diseases as well as in BC. For instance, Gajbhiye et al. [
16] used a variety of techniques, such as two-dimensional fluorescent differential gel electrophoresis (2D-DIGE) and MALDI-TOF MS, to identify 183 potential protein biomarkers in urine obtained from 43 healthy control groups (HCs) and 43 patients with a BC subtype (HER2—enriched). For the first time, regarding this specific subtype of cancer, a non-invasive procedure was used to identify urinary biomarkers. On the other hand, Dong et al. [
17] used bead-based MALDI-TOF MS to discover 160 potential protein biomarkers in urines from 10 HCs and 11 newly diagnosed patients with renal clear cell carcinoma. Similarly, Wang et al. [
18] identified 76 different urinary polypeptides, using MALDI-TOF MS to establish the peptide expression biosignatures of 34 patients with lung adenocarcinoma and 36 HCs to serve as potential biomarkers to non-invasively detect lung adenocarcinoma. Different research groups performed other studies concerning the detection of diagnostic and prognostic molecular biomarkers using serum as a biological sample. Such biomarkers can have an important clinical utility for the early diagnosis and treatment of various diseases, in particular cancer, as well as in the improvement of the management and advancement of oncological medical care. Among them, Zografos et al. [
14] identified 42 proteomic male breast cancer biomarkers, through 2-DE separation and MALDI-TOF MS methods, between 8 HCs and 11 patients with MBC. by Ding et al. [
9] reported a five-peptide with high sensitivity and specificity for the diagnosis of bladder cancer through the MALDI-TOF MS technique, which was applied in serum peptide signatures of 67 hematuria patients and 64 HCs.
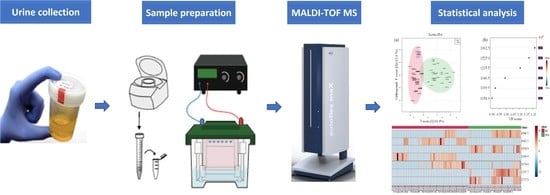
To the best of our knowledge, there is limited information related to peptidomic BC potential biomarkers in urine, which represents an attractive and easily available source for biomarkers discovery. The aim of the present work was to establish a urinary peptidomic biosignature from BC patients and HCs using a non-invasive approach in addition to an easy-to-perform, quick, and high-throughput technology, MALDI-TOF MS. Moreover, this alternative strategy offers numerous benefits, including the ability to improve the detection sensitivity of small abundance peptides, consequently enlarging the investigating range for peptide identification, previously separated by 1D SDS-PAGE, through peptide mass mapping.
2. Materials and Methods
2.1. Chemicals
All chemicals utilized in this trial were of analytical grade. Bovine serum albumin (BSA, ≥98%) was supplied from Acros Organics (Geel, Belgium). Thiourea (CH4N2S, ≥99%), DL-1,4-dithiothreitol (DTT, 99%), trichloroacetic acid (TCA, 99%), trifluoroacetic acid (TFA, 99.5%) and acrylamide (C3H5NO, ≥99%) were obtained from Acros Organics (Morris Plains, NJ, USA). Urea (CH4N2O, >99%) was supplied from MERCK Schuchardt (Hohenbrunn, Germany). Trisodium citrate dihydrate (C6H5Na3O7·2H2O, 99%), copper(II) sulfate (CuSO4, 99%), bromophenol blue (pH 3.0–4.6), formic acid (CH2O2, 98%), N,N,N′,N′-tetramethylethylenediamine (TEMED, C6H16N2, 99.5%) and ammonium persulfate (APS, (NH4)2S2O8, 98%) were from Merck (Darmstadt, Germany). Sodium carbonate (Na2CO3, ≥99.5%), N,N′-methylenebis(acrylamide), sodium dodecyl sulfate (NaC12H25SO4, 99%) and acetic acid (C2H4O2, ≥99.8%) were obtained from Sigma-Aldrich (St. Louis, MO, USA). Sodium hydroxide (NaOH, 98.9%) was supplied from Fisher Scientific (Loughborough, UK). Glycerol (C3H8O3, > 99.5%) and ammonium hydrogen carbonate (NH4HCO3, >99%) were obtained from Fluka (Buchs, Switzerland). Methanol (CH3OH, ≥99.8%) was obtained from Chem-Lab NV (Zedelgem, Belgium). Acetonitrile (CH3CN, ACN, 99.5%) was from Riedel-deHaën (Seelze, Germany). Trypsin (≤100%) for protein digestion was provided by Sigma-Aldrich (St. Louis, MO, USA). Potassium sodium tartrate (KNaC4H4O6·4H2O, 99%) was from PanReac Quimica SA (Barcelona, Spain). Tris Base (C4H11NO3, 99%) was supplied from Fisher Scientific (Geel, Belgium). Protein ladder was from Bio-Rad (San Jose, CA, USA). Tris hydrochloride for molecular biology (C4H11NO3·HCl, ≥99%) was supplied from PanReac AppliChem (Darmstadt, Germany). Glycine (C2H5NO2, ≥98.5%) was provided by Fisher BioReagents (Geel, Belgium). Ethylenediaminetetra-acetic acid (EDTA, C10H16N2O8, 99.3%) was from VWR Chemicals BDH (Leuven, Belgium). Chloroform (CHCl3, 99.2%) was from VWR International (Fontenay-sous-Bois, France). The water used was obtained from a Milli-Q water purification system (Millipore, Bedford, MA, USA).
2.2. Subjects’ Selection and Urine Collection
To investigate the BC peptidomic biosignature, 50 urine sample from BC patients (age range 40–78 years, average 59 ± 1) were compared with a group of 50 HCs (age range 44–68 years, average 56 ± 1). In total, a set of 100 urine samples were collected, processed, and kept under the same procedural conditions to prevent technical and analytical variation caused by handling. Thus, these samples were frozen at −80 °C, thawed for 3 h at room temperature (25 ± 1 °C), and then supernatants were divided into 2 mL aliquots and lyophilized. To attain a typical urinary peptidome that reveals the group pattern sample variability, the frozen aliquots were entirely thawed, and after that, the same volumes (2 mL) of each donor supernatant were pooled into the BC or HCs. In this study, no protease inhibitors were utilized, as some research has demonstrated that they are difficult to identify and may interfere with the following digestion process in untargeted urine proteomics [
11].
The urines were obtained at the Unit of Hematology-Oncology of Hospital Dr. Nélio Mendonça (HNM) at Funchal, Portugal, according to
Table S1 (Supplementary Material). All subjects of the current study were knowledgeable about the research, in which they signed a consent form to participate in the study prior to sample collection. In addition, all the women enrolled in the study were non-smokers. Using the TNM (tumor, node, and metastasis) staging method, the researched BC cases included fifteen of stage IA, nine of stage IIA, seven of stage IIIA, ten of stage IIB, nine of stage IIIB and six of stage IIIC.
2.3. Urine Sample Precipitation
Four extraction procedures were analyzed on urines from BC patients and HCs. The chloroform/methanol-based method (method A) [
19], ACN/TFA-based method (method B) [
20], TCA/acetone-based method (method C) [
21], and TCA-based method (method D) [
22] with some modifications were evaluated to determine the greatest fitting extraction procedure for the 1D SDS-PAGE analysis of the urines. All extraction procedures were performed in triplicate.
2.4. Total Protein Concentration in Urine (Lowry’s Test)
The total protein concentration in urine, before and after precipitation, was determined using the Lowry method. Briefly, 2.5 mL of Lowry’s reagent solution was added into Eppendorfs containing 30 μL of urine and 470 μL of H2O. This mixed solution was rested for 10 min, and then 250 μL of Folin’s reagent (1:1 v/v Folin-Ciocalteu:H2O) was added to the homogenate, mixed, and rested for 30 min in the absence of light. After that, the sample’s absorbance was measured at 750 nm in a UV-Vis spectrophotometer. For the calibration curve, the same procedure was applied to several BSA concentrations in urine, ranging from 9 to 277 µg/mL.
2.5. One-Dimensional Gel Electrophoresis
The protein content of the precipitated sample was analyzed by 1D SDS-PAGE. First, 10 µL of urines from HCs and BC patients, concentration range from 0.0319 to 0.0417 µg/mL, were separated under denaturing conditions using a 1 mm thickness resolving gel containing 12% (w/v) acrylamide/bis-acrylamide and a staking gel with 4% acrylamide/bis-acrylamide as well as 7 µL of protein ladder (Bio-Rad), containing fragments of a known size, 10–250 kDa range, which served as a standard for estimating the size of the fragments of the respective samples. Gels were stained using Coomassie brilliant blue R-250 solution (0.5% Coomassie Brilliant Blue G-250 in 30% methanol, 10% acetic acid and 59.5% H2O) and then washed at least two to three times with a destaining solution (30% v/v methanol, 10% v/v acetic acid, 60% H2O) until the background staining reduced. Additionally, the gels were analyzed with the software Gel-Analyzer 19.1.
2.6. Protein Digestion
Three different digestion approaches (methods I [
23], II [
24] and III [
25]) with some modifications have been compared to determine the optimal procedure, combined with the methods described above, for the subsequent MALDI-TOF MS analysis. In this way, protein spots were manually excised from the Coomassie-stained gels in the MW range of 50–75 kDa and transferred into 1.5 mL Eppendorfs.
2.7. MALDI-TOF MS Analysis
The digested samples were premixed with MALDI matrix solution (10 mg/mL SA in methanol) at the ratio of 1:1. Then, 1 µL of each mixture was applied in triplicate onto an MTP 384 ground steel target plate (Bruker Daltonics, Billerica, MA, USA), and then, they were allowed to dry at 25 ± 1 °C. Mass spectra were obtained on the Autoflex maX MALDI-TOF/TOF MS (Bruker Daltonics) in the reflector and linear positive-ion modes across the m/z ranges of 600–2000 and 5000–20,000, respectively. Each mass spectrum was acquired by 500 laser shots, with an intensity of 75%, collected across the whole sample. The subsequent ion source settings were employed: ion source 1, 19.22 kV; ion source 2, 17.00 kV. Other parameters for MALDI-TOF MS analysis were as follows: pulsed ion extraction, 170 ns and lens, 8.53 kV. FlexControl 3.4 software (Bruker Daltonics, Bremen, Germany) was acquired for the acquisition and processing of the spectra. A standard BSA calibration mixture in the ranges of m/z 600 to 2000 and 5 to 20 kDa was used for mass calibration. The calibration curve was constructed by the same procedure applied to several BSA concentrations in urine (5, 10, 15, 20, 25 and 50 mg/mL).
2.8. Statistical Analysis
The background signals were subtracted, and the mass spectra components (
m/
z list, peak area, SNR (signal-to-noise ratio), peak relative intensity) were analyzed by Mass-Up software, which is accessible from the project homepage on
http://sing.ei.uvigo.es/mass-up, accessed on15 February 2023. Each sample was spotted on the MALDI plate three times, resulting in a total of 330 MALDI mass spectra; therefore, the spectra grouping function was applied to combine all analyzed sample replicates into one biological replicate. According to standard procedures in the field [
26], the main workflow involves baseline correction, intensity calibration, transforming, smoothing, spectra alignment, peak detection and finally transformation to a data set containing aligned
m/
z and intensity prior to additional analysis. Therefore, the analogous raw spectra of each sample acquired from the MALDI experiments were preprocessed by Mass-Up v1.0.14 open-source software [
27], using the subsequent parameters: (I) intensity transformation: square root; (II) smoothing: Savitzky–Golay; (III) baseline correction: snip; (IV) standardization: total ion current (TIC); (V) peak detection: MALDIquant with a signal-to-noise ratio (SNR) of 3 and a Half Window Size of 50. After that, the peak matching was performed with the subsequent settings: (I) intra-sample matching using MALDIquant with a tolerance of 0.05 without consensus spectrum generation; (II) inter-sample matching using MALDIquant with a tolerance of 0.05. Lastly, peak lists containing
m/
z and peak areas from Mass-Up Software were transferred to Microsoft Excel (data format CSV). Data statistical analysis was also carried out by applying the MetaboAnalyst 5.0 (University of McGill, Montreal, QC, Canada) [
28]. A
p-value < 0.05 was recognized as statistically significant. The principal component analysis (PCA) was applied to obtain a representation from the data projection. The orthogonal projection to latent structures discriminant analysis (OPLS-DA) was used on the urine peptidomic biosignature data set to verify the distribution of the variables for the groups under study and to provide insights for biomarkers research. ROC curve was generated to evaluate the diagnostic value of the potential BC biomarkers.
3. Results and Discussion
3.1. Optimization Step
In a preliminary investigation, different protein extraction and digestion methods were assayed using 2 mL of urine from an HC and a BC patient, and the final experiment, using the MALDI-TOF MS, was conducted in triplicate. The only difference between the methods is the nature of the organic solvent that is added, which promotes protein precipitation in the urine, and after centrifugation, the proteins form a pellet at the bottom of the tube. Thus, before precipitation, the concentration of urinary proteins is usually low (100–200 mg/L) [
29], but after precipitation, the concentration of urines, including all the proteins as well as other compounds, such as urea and cell debris, increases. The optimal spectra based on the reproducibility, number and abundance of detected ions were achieved using chloroform/methanol precipitation method for reflector and linear positive-ion mode over the mass range of
m/
z 600–2000 and 5000–20,000, respectively, in comparison to the other methods (
Figure 1).
Hence, amongst the evaluated protein extraction procedures, chloroform/methanol precipitation in combination with digestion method II consistently contributes to the greatest yield based on the total extracted protein as determined by Lowry´s assay. In addition, the largest number of peptides was identified with high confidence as well as being the most reproducible of all methods evaluated (
Figure 2).
3.2. Lowry’s Assay
After the optimization step, the total proteins concentration in the set of samples considered in this study was determined using a calibration curve of BSA in a concentration range from 9 to 277 µg/mL with a reproducibility less than 10% (expressed percentage of relative standard deviation, % RSD) and a correlation coefficient (R2) of 0.995.
Since earlier research has demonstrated inter-individual variability in urinary proteins of 20–60% in HCs [
30], it is crucial to emphasize that the concentration and composition of proteins in urines are related to intra- and inter-individual variations. However, through the results, the urine showed minimal inter-individual variation between the BC patients and HCs in the total protein concentration. Therefore, most urinary proteins are highly stable between individuals and, hence, constitute a source for the identification of potential biomarkers. The obtained results showed that BC patients have a smaller total protein concentration compared with HCs. In addition, in the HCs, the content of total proteins ranges from 160 to 318 µg/mL, on average 142 ± 1.60 × 10
−3 µg/mL, while in BC patients, the determined ranges are from 140 to 311 µg/mL, with an average value of 115 ± 1.60 × 10
−3 µg/mL. As a result, the highest concentration value obtained in urine from HCs is slightly higher than any protein concentration compared to the BC patients. According to Waterborg [
31], Lowry’s method, based on both the Biuret and the Folin–Ciocalteau reactions, is preferably used in low protein concentration ranges (10 to 1000 µg/mL of protein), and it has high sensibility until 10 µg of protein/mL. Under those conditions, the obtained values (
Table 1) for the total protein concentration of non-precipitated urine are between the expected values defined by Lowry’s optimal concentration range.
After precipitation, both HCs and BC patients’ urines had a total protein concentration above the limit of quantification (LOQ), which is exactly what would be expected considering that precipitation should increase the protein concentration by eliminating impurities from the biological sample (
Table 1).
To sum up, after precipitation, on average, 31,900 µg of protein was collected from 100 mL and about 638 µg was collected from 2 mL for BC patients, whereas HCs obtained an average of 41,700 µg of protein from 100 mL and approximately 833 µg from 2 mL.
However, it is necessary to consider that UV methods are not accurate and, therefore, the higher protein content, after precipitation, could be linked to the quantification not only of proteins but also of other compounds (e.g., urea, cell debris and other substances). For this reason, it would be necessary to perform several other protein dosing assays with a considerably larger number of controls as well as BC patients or, simply, remove the interfering substances to obtain more robust results.
3.3. Proteomic/Peptidomic Biosignature
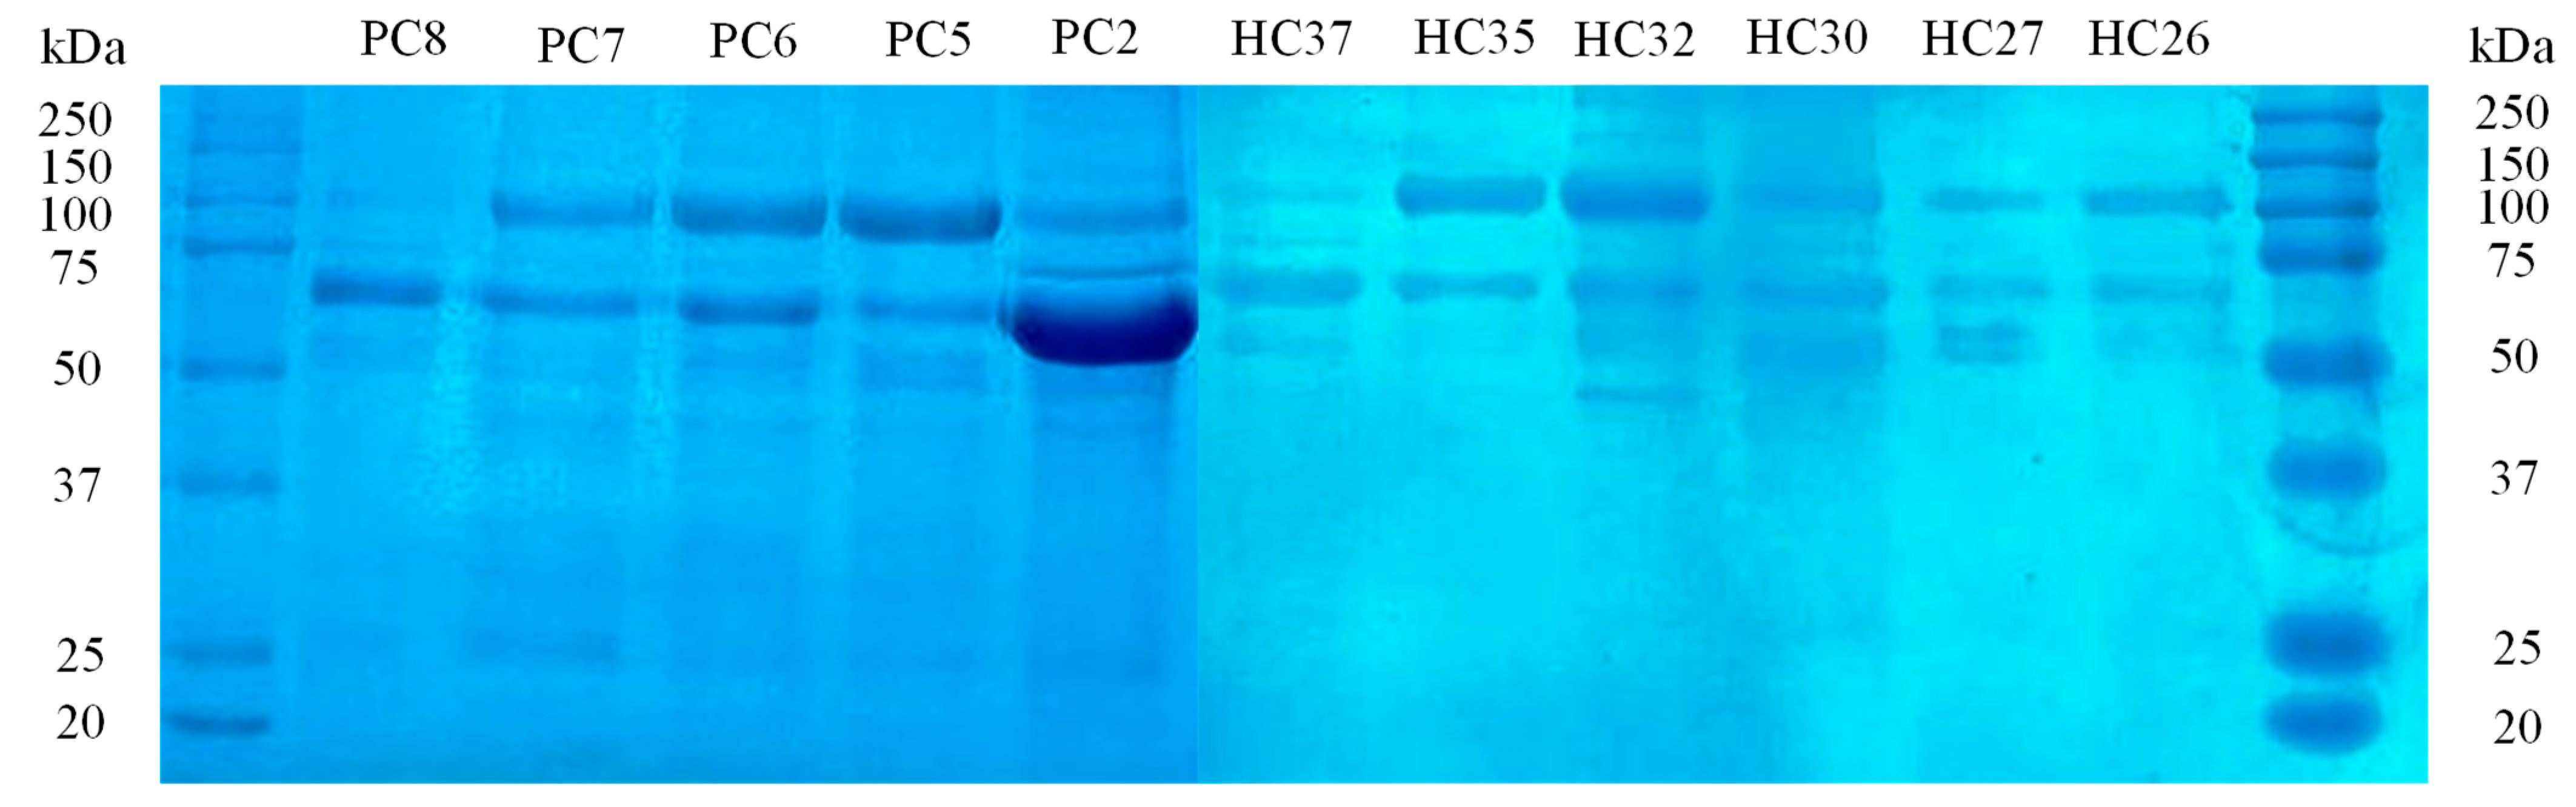
Following the 1D SDS-PAGE analysis, the SDS-PAGE patterns of urinary proteins from BC patients and HCs are shown in
Figure 3, suggesting potential differences in each proteome. The major differences between BC and HCs urine were observed in the range 50–75 kDa, where clear bands of high-concentration proteins with higher intensity in BC patients than in HC urines were found. In addition, the HCs group showed less or no protein between 60 and 75 kDa compared to BC urines. The software Gel-Analyzer 19.1 was used to identify 536 proteins and evaluate their molecular weights, relative migration distance (Rf) and band intensities. Although SDS-PAGE could not exhibit the main differences between sample preparations due to restricted separation in one dimension, it allowed separate spots that represent the differentially expressed proteins.
Thus, for protein biosignature analysis, these spots were removed from stained gels for subsequent in-gel trypsin digestion and MALDI-TOF MS analysis, which identified the differentially significant proteins in each group.
The MALDI-TOF MS limit of detection (LOD) was achieved by calibration curves ranging from 5000 to 50,000 µg/mL using the SA matrix both in linear and reflector positive-ion modes over a mass range of
m/
z 5000–200,000 and 600–2000, respectively. The linear mode was able to achieve a good logarithmic correlation with the coefficient of determination (R
2) of 0.955 and 0.946 within the analyzed BSA concentration range for
m/
z 66,400 (BSA single charge) and
m/
z 33,200 (BSA double charge), respectively. Complementary, to prove the ability of MALDI-TOF MS for the detection of peptides in urine, using the methods outlined in the current study, the BSA samples were submitted to the same procedure and afterward analyzed in the low mass range (
m/
z 600–2000) in reflector mode. According to Stensballe et al. [
32] and Shevchenko et al. [
33], the two peaks with
m/
z 847 and 927 values are considered peptide precursors of BSA. As a result, a linear correction with an R
2 value of 0.981 and 0.983 for the
m/
z 847 and 927 was attained, respectively.
In addition, considering the MALDI-MS assessment of small molecular weight peptides admits some restrictions due to the abundance of matrix clusters. Salum et al. [
34] showed that
cis-sinapic acid (
Z-SA) is a suitable matrix for small peptide investigation since it provides spectra with greater intensity, peptide signal and fewer matrix clusters but specifically in positive ionization mode. This is because SA belongs to the cinnamic acid derivatives class, and those currently used are
E-cinnamics. Additionally, Choi et al. [
35] proved that SA is the most suitable MALDI matrix since it gives only a few background peaks while providing high sensitivity detection for the analysis of proteins and peptides. This research used the bottom–up MS-based approach to identify candidate proteins/peptides from MALDI mass spectra between the two groups. The spectra were explored in the mass range of
m/
z 600–2000 in the reflector mode. That is, resolved spectra and great sensitivity are achieved because the analytes are stable enough to withstand the energetic stress which is inherent to passing the reflector. It enables proper baseline separation of the investigated peaks and greatly accurate determination of their mass [
36]. The objective of the present study was to combine data sets of urines from BC patients and HCs to discover potential urinary protein/peptide biomarkers through commonly applied standard MALDI-TOF MS techniques. MALDI MS software was used by FlexControl and FlexAnalysis version 3.4 to analyze the urinary peptidome of 100 samples, and the mass spectra of samples from BC patients were compared with those from HCs.
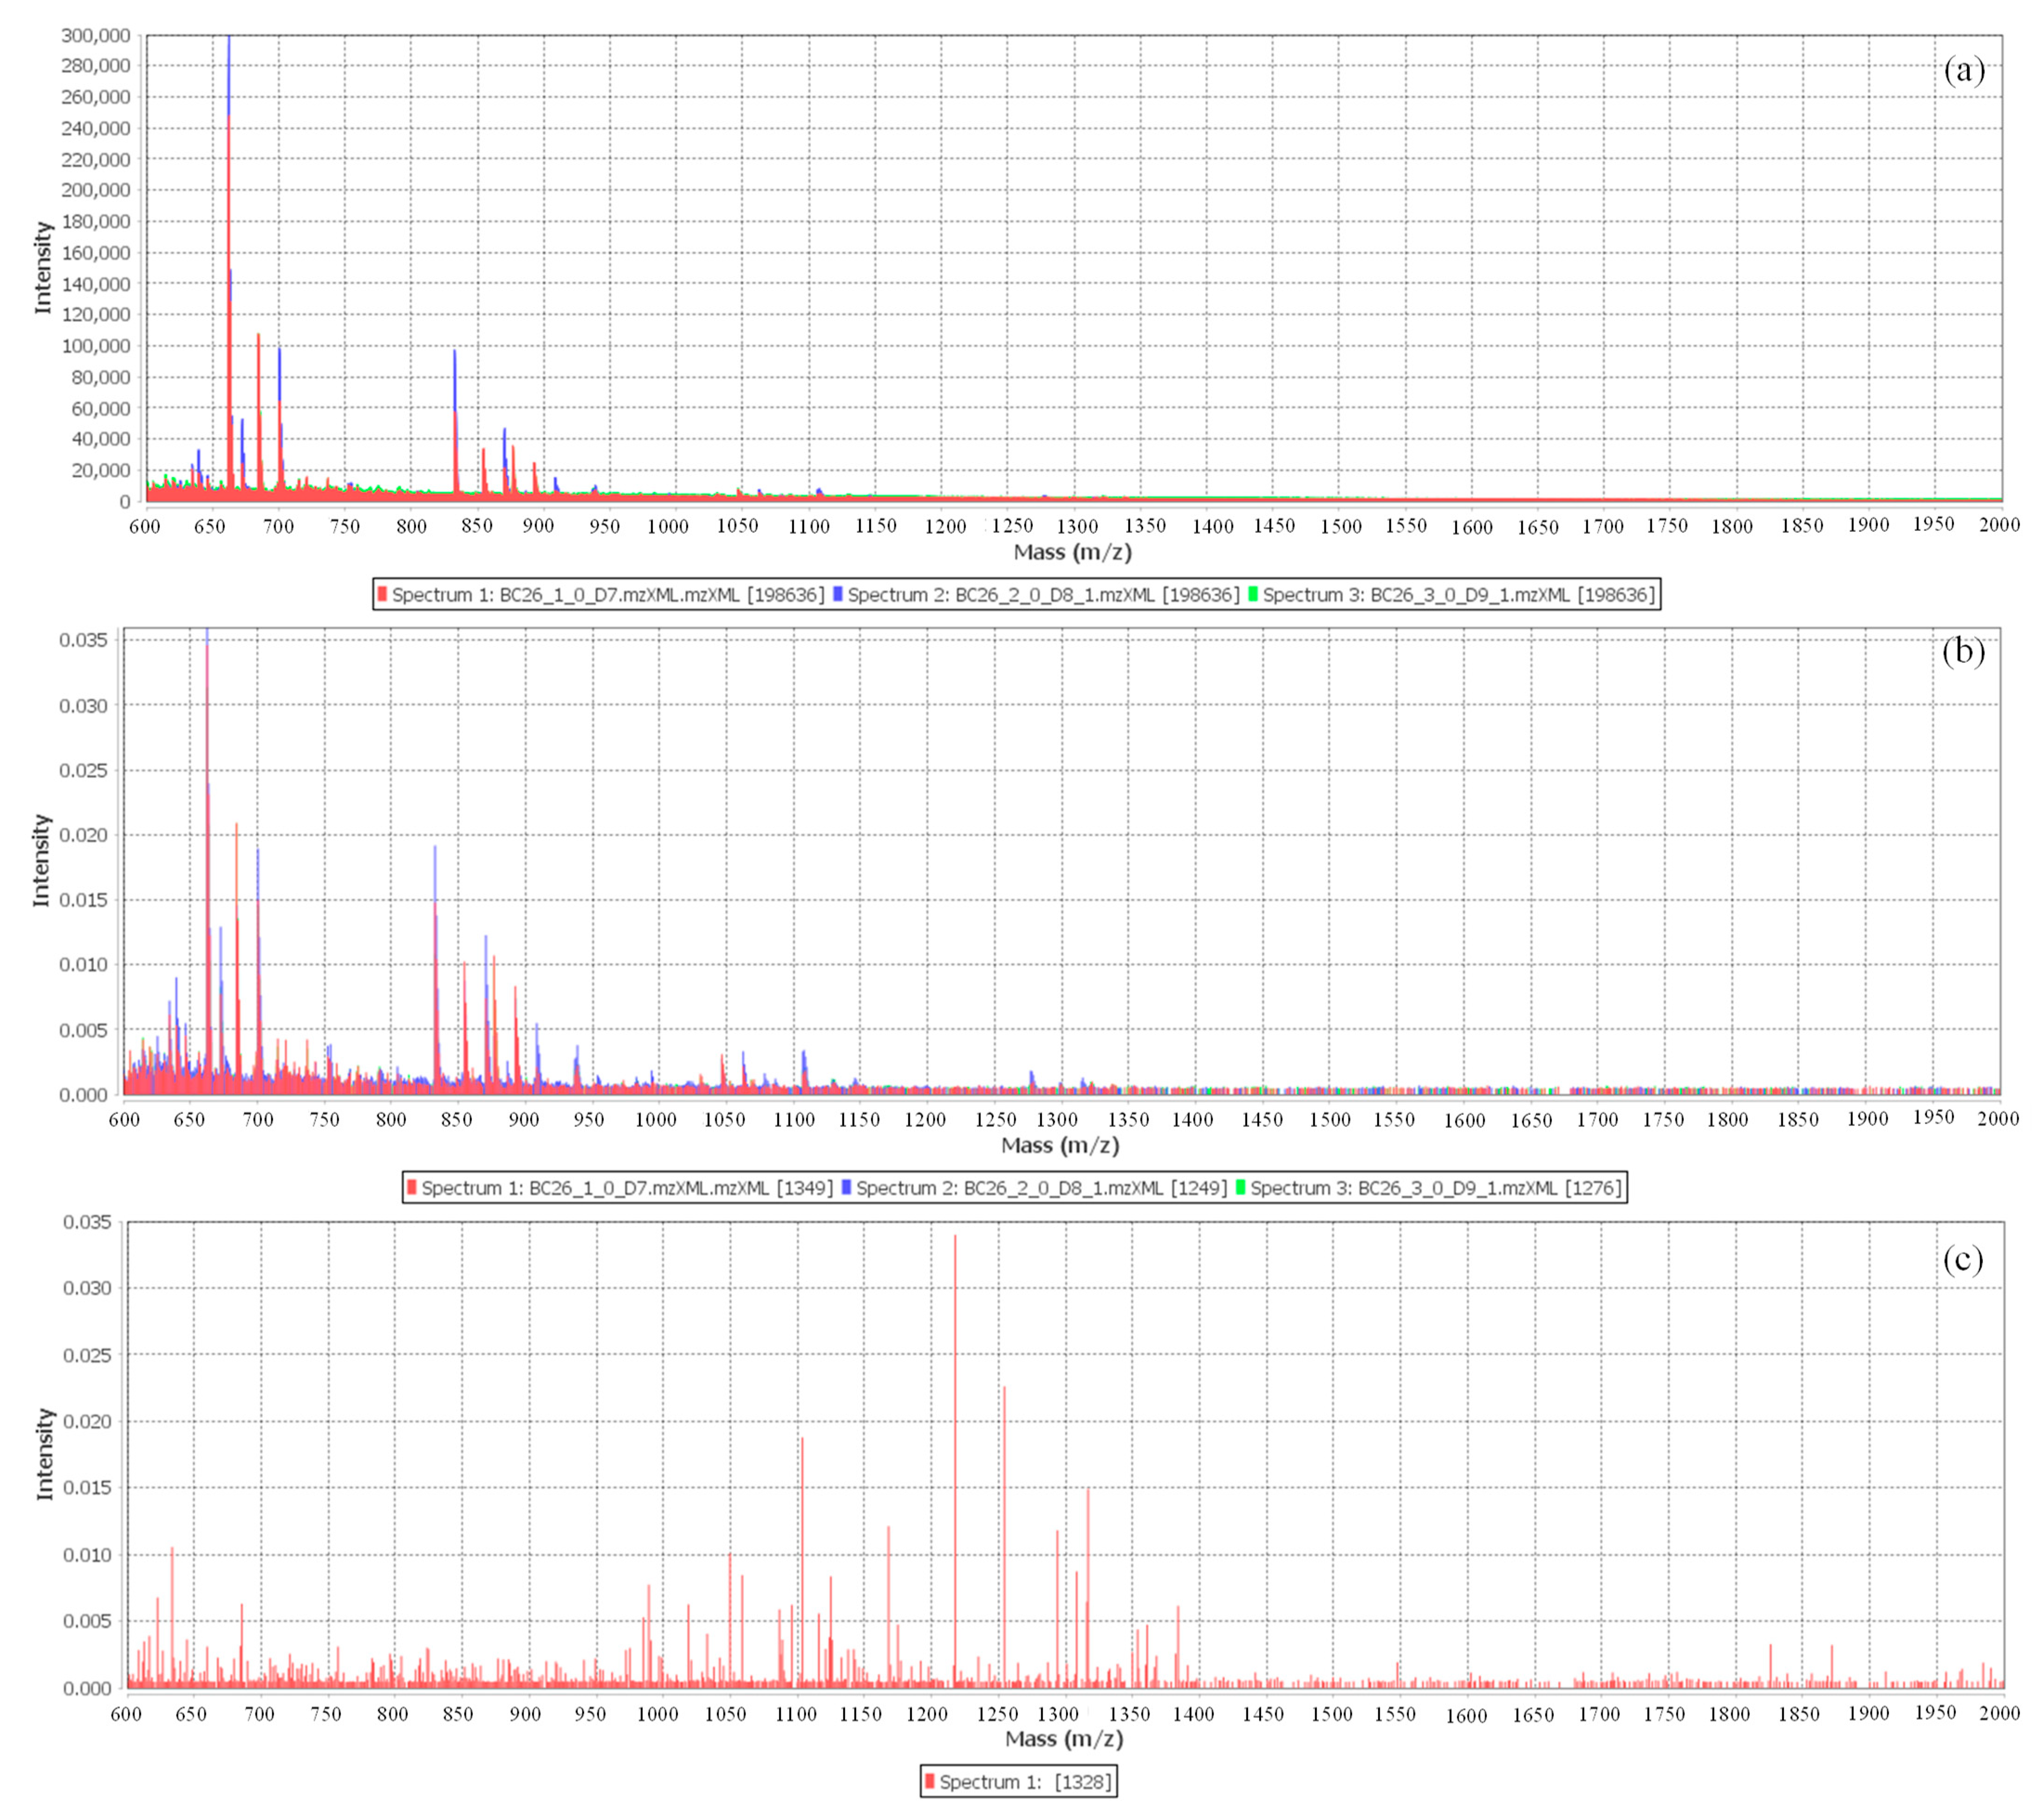
Visual analysis of the raw data, as can be seen in
Figure 4, shows that there are not many differences in peak intensity between the urine mass spectra from BC patients and those from HCs. Additionally, by comparing the spectra of the different groups, it is possible to verify that a cluster of peaks identified in the range from
m/
z 1000 to 2000 is only present in the urines of the HCs. However, not all HCs provided these peaks, indicating that there was significant inter-individual variance in the HCs urines. On the other hand, although the resolution is significantly higher than that of linear MALDI-TOF MS profiles, it is not high enough to resolve the signal intensity from overlapping peptides. The resulting raw data spectrum comprises the signal distinctive to the samples as well as signals with varying levels of noise, making the recognition/detection of the peak’s indicators of the samples a difficult and, inevitably, a multistep procedure. For this reason, the immense inter-individual variability in urinary biosignature and their enormous complexity make any effort at the visual contrast of these spectra an ineffective task. Furthermore, these peaks have similar
m/z values compared to BSA; however, since the cross-contamination of samples was avoided, there is another possible compound abundantly found in urine that could provide such signals, which is human serum albumin (HSA). Through the hierarchical cluster analysis (HCA), it was possible to screen the peaks considered statistically significant, with a value of
p < 0.05, to establish an objective comparison among the proteomic/peptidomic pattern found in the urine of BC patients and HCs in terms of qualitative identification. This allowed for a better analysis and interpretation of the peaks detected in the different groups (
Figure S1).
3.4. Pre-Treatment of the MALDI-TOF Spectra
The primary objectives of preprocessing are the selection of the
m/
z along with properly accurate intensity, and the designation of peaks with normalized intensities below a threshold as noise with consideration of the
m/
z values of interest [
37]. A model of the spectra achieved from the BC patients after pre-treatment and peak alignment techniques following the Mass-UP options is exhibited in
Figure 5. To establish consistently detectable peaks, a combination of setting values was applied to clean the enormous data set from signal noise and recognize true signals, monitoring the software workflow [
27]. With this pre-treatment, the
m/
z range was reduced; consequently, the number of peaks was decreased to be evaluated from 200,000 in the raw spectra to 1000–1500 in the pre-processed data. Therefore, based on this obtained biosignature, a cluster of signals in the
m/
z 600–2000 regions were chosen as the specific biosignature capable of differentiating BC patients from the HCs out of the MS features with the highest discriminatory value, statistical rank, and relative
m/z peak intensity.
With a view to minimizing systematic variance and to increasing the performance for downstream statistical analysis, normalization and transformation of the intensity were performed. According to Meuleman et al. [
38], the spectra normalization is a crucial step in preprocessing and, despite its simplicity, the total ion current (TIC) is the best option in biosignature assays, with the hypothesis that the number of proteins/peptides with variable expression is significantly less than the number of total proteins/peptides in the sample [
39]. Since the raw data are counts of ionized molecules with intensity values roughly following a Poisson distribution [
40], a square root transformation can be used to transform the Poisson distributed data to nearly normal data with constant variance independent of mean, which is an essential constraint for numerous statistical tests. Subsequently, the transformed spectral data were smoothed by the Savitzky–Golay algorithm, which is based on polynomial regressions in a moving window [
41]. Moreover, the statistics-sensitive non-linear iterative peak-clipping algorithm (SNIP), an interactive algorithm that calculates the baseline by counting the local minima and local mean intensities in windows of rising size, was used to eliminate the background influence to decrease their influence in the quantification of the peak intensities. In addition, the impact of half window size (HWS) values should be selected to be smaller than twice the full width at half-maximum (FWHM) of the peaks. However, as the protein/peptide composition in urine is complex, which is significantly changed by diet and exercise, the statistical results were performed with 80 samples, suggesting that the remainder consists of are putative outliers. After filtering the noise and clustering of the 80 spectra obtained by combining the list of peaks of the spectra in triplicate of each sample, a total of 74,391 peaks were identified, with an average of 1033 peaks per sample.
3.5. Multivariate Analysis
Urine proteomic/peptide biosignature analysis was evaluated to discover potential biomarkers that allow discrimination between BC patients and HCs. Therefore, PCA was applied to evaluate the main sources of disparity among results. Additionally, to detect sample clustering and possible outliers, and to establish a possible distinction between BC patients and HCs, only the potential BC biomarkers with confidence regions higher than 95% were considered for the statistical analysis, where peaks with a similar m/z value across all spectra (within 0.025%) were recognized as the same.
In a univariate statistical analysis, a total of six distinct peaks were identified between the two sets of samples ranked by
p-values from the
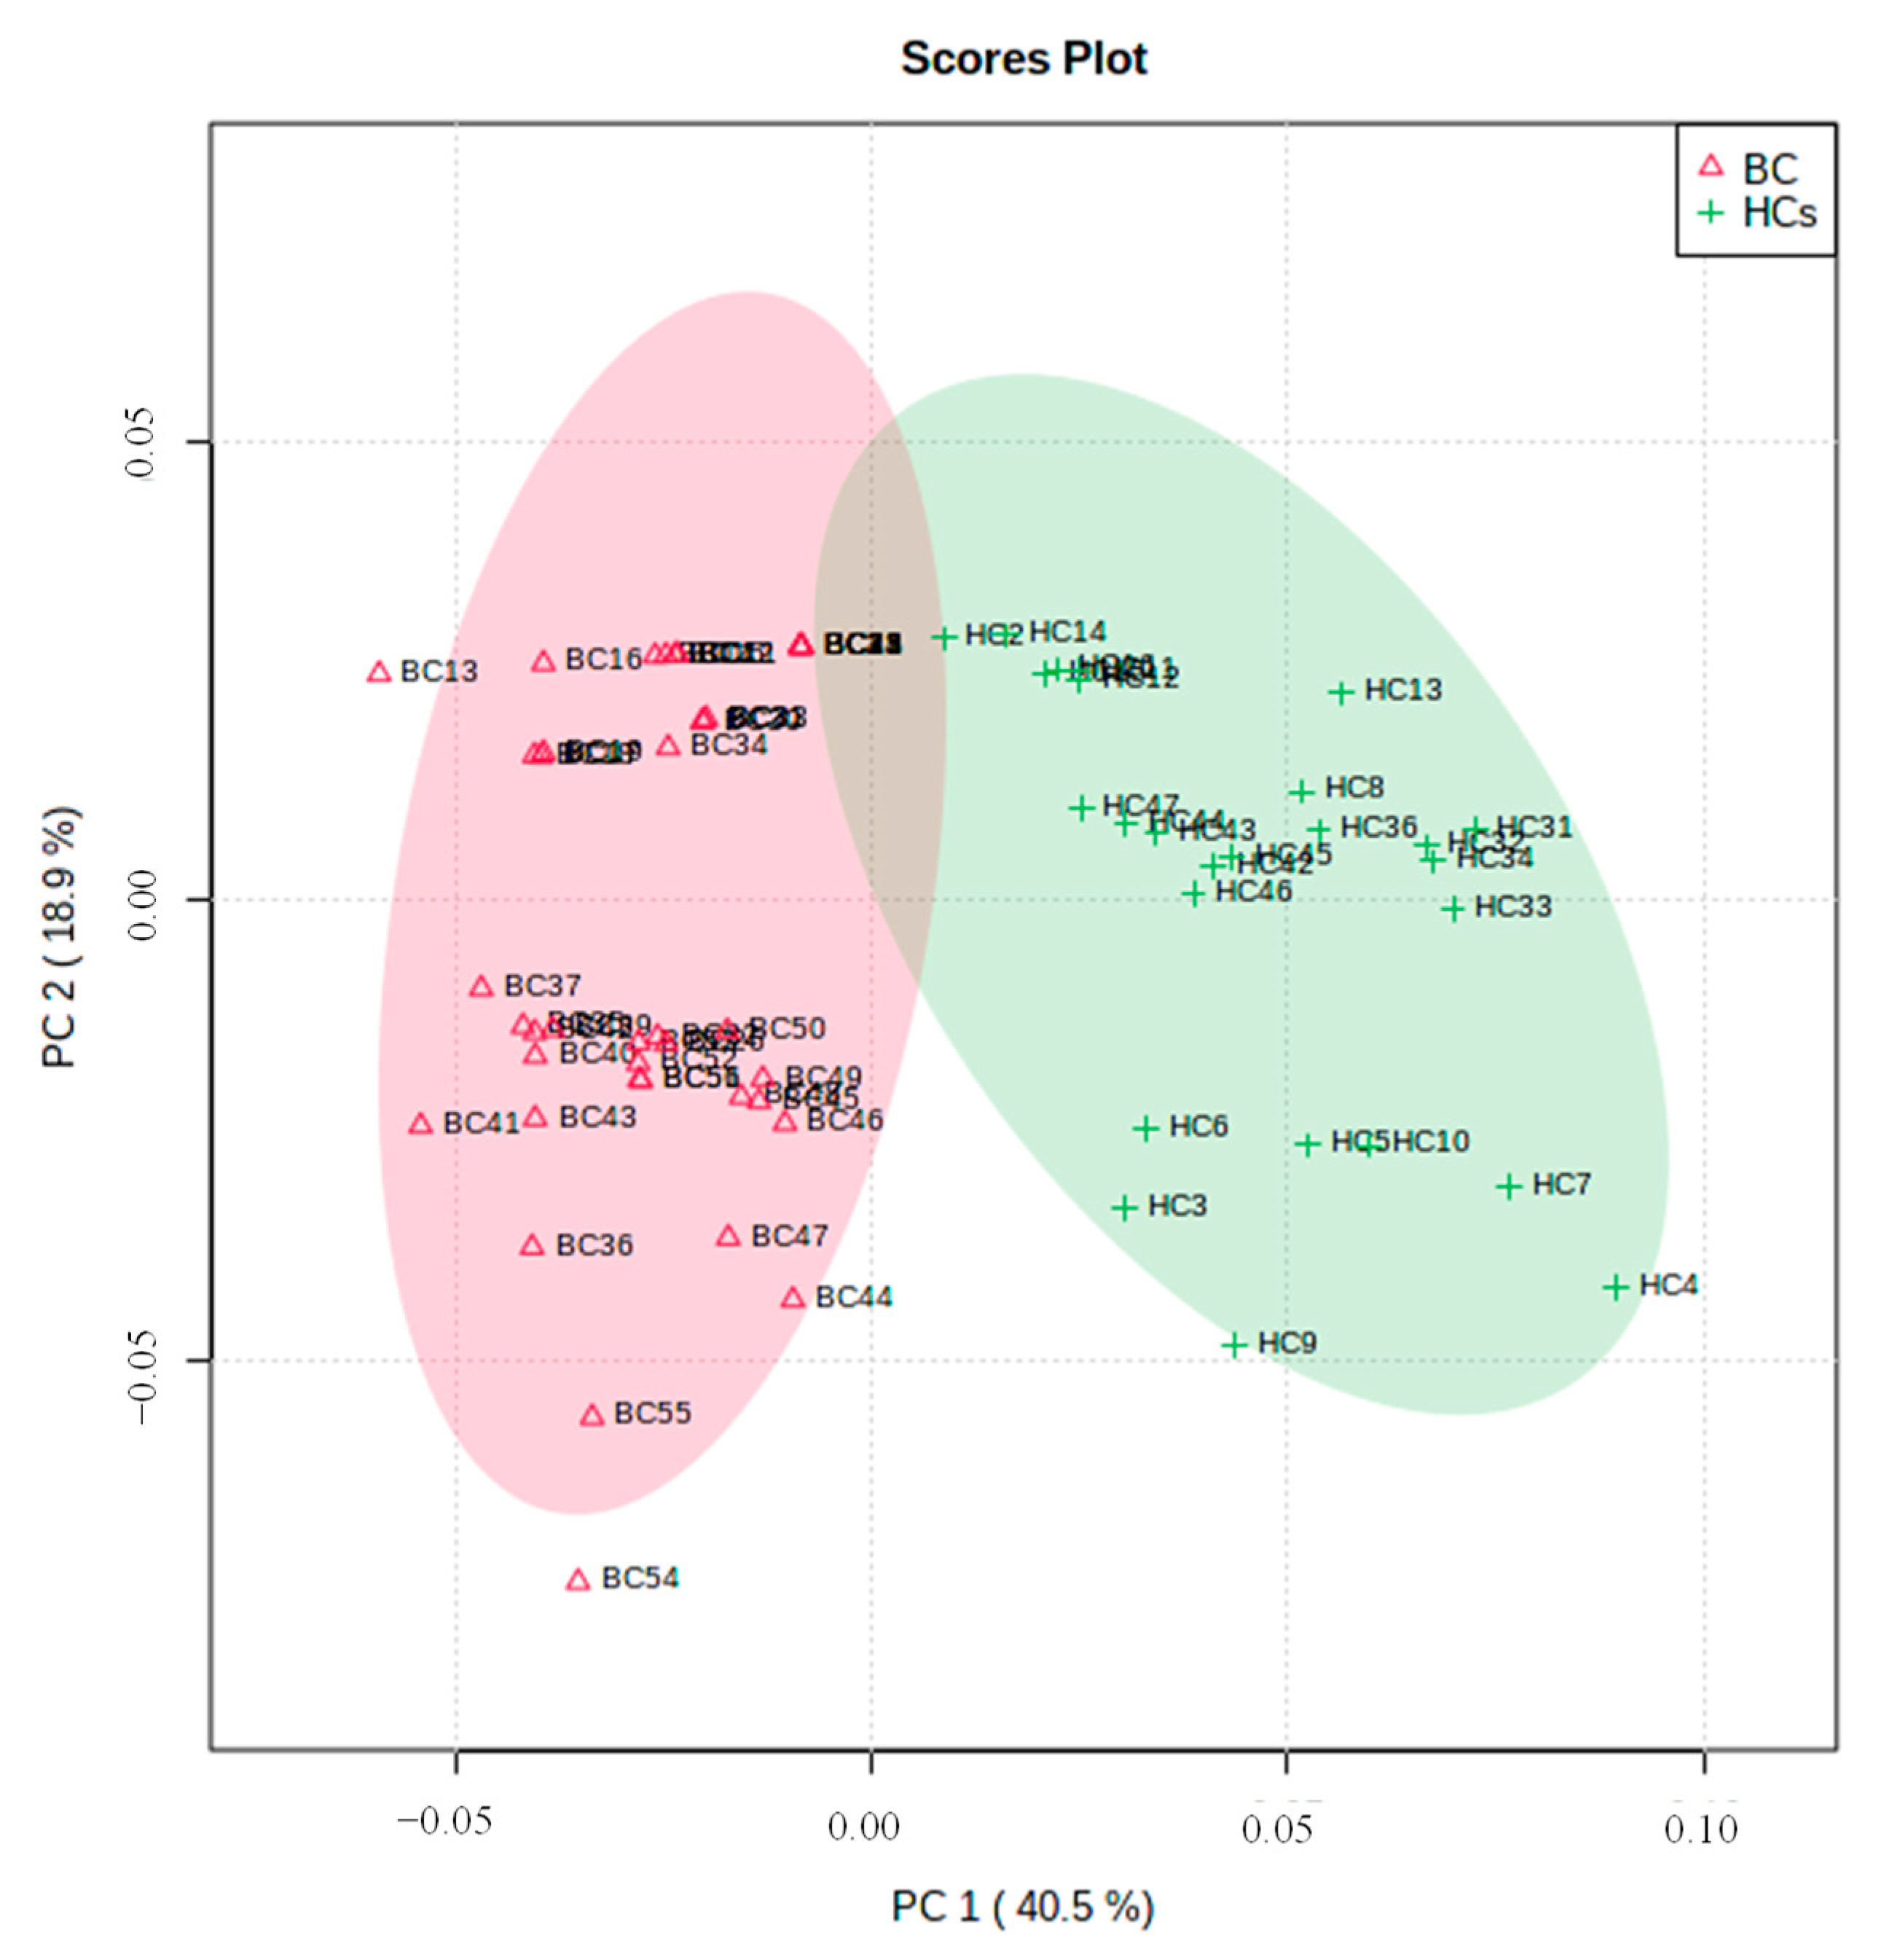
t-test, and four of them were significantly expressed. Of those, four peaks were up-regulated, while two peaks were down-regulated in BC patients compared with the HCs. To attain an enhanced observation between the differences and similarities among the groups, an unsupervised multivariate approach PCA was applied. The first (PC1) and second (PC2) principal components account for 59.4% of the total variability (
Figure 6). For both groups, the projection of the sample arises from separate clusters. The group positioned in PC1 positive includes the BC patients, while the group placed in PC1 negative corresponds to the HCs. These results showed that general similarities and differences of the samples under study can be visualized and, therefore, the group of cases can be organized into two different sets based on the clinical condition of the subjects.
Moreover, the orthogonal projection to latent structures discriminant analysis (OPLS-DA) was used in the urine peptidomic biosignature dataset to maximize the separation of BC and HC. Furthermore, this kind of statistical analysis allows for verifying the existence of possible outliers through the discrimination between the two groups. Thus, analyzing the OPLS-DA score plot was possible to observe a significant separation between BC patients and HCs, revealing intrinsic proteomic changes in each group (
Figure 7a).
The VIP value obtained by OPLS-DA is an important measure of each independent variable. Higher VIP values are considered more relevant in the ranking. Hence, the top four features (
m/
z 1046.5, 1062.5, 1237.7 and 1727.9) with the greatest contribution to group discrimination were selected with variable importance in projection (VIP > 1), as shown in
Figure 7b. To prove the robustness of the model, a random permutation test with 1000 permutations was completed with OPLS-DA (
Figure 7c). The permutation test yielded
(denotes goodness of fit) as 0.821 and
(denotes predictive ability) as 0.777, suggesting that the model is not over-fitted and has a moderately predictive ability to distinguish the study groups.
To further assess the predictive value of the peaks to distinguish the groups under study (BC patients and HCs), a ROC analysis was produced using the top four features established by VIP values (
Figure 8). This analysis allowed the identification of true positives and false positives, and the predictive ability is determined utilizing the area under the curve (AUC) [
42]. Agreeing with Xia et al. [
43], an AUC between 0.9 and 1.0 is excellent and between 0.8 and 0.9 is good. So, based on this, the results achieved were very good (AUC = 0.997), with a 95% confidence interval (95% CI) of 0.958–1, representing good accuracy in the discrimination of the two groups. For 95% confidence intervals, the sensitivity, specificity, and positive and negative predictive values for
m/
z 1046.5, 1062.5, 1237.7 and 1727.9 were 88, 98, 96 and 94%, respectively.
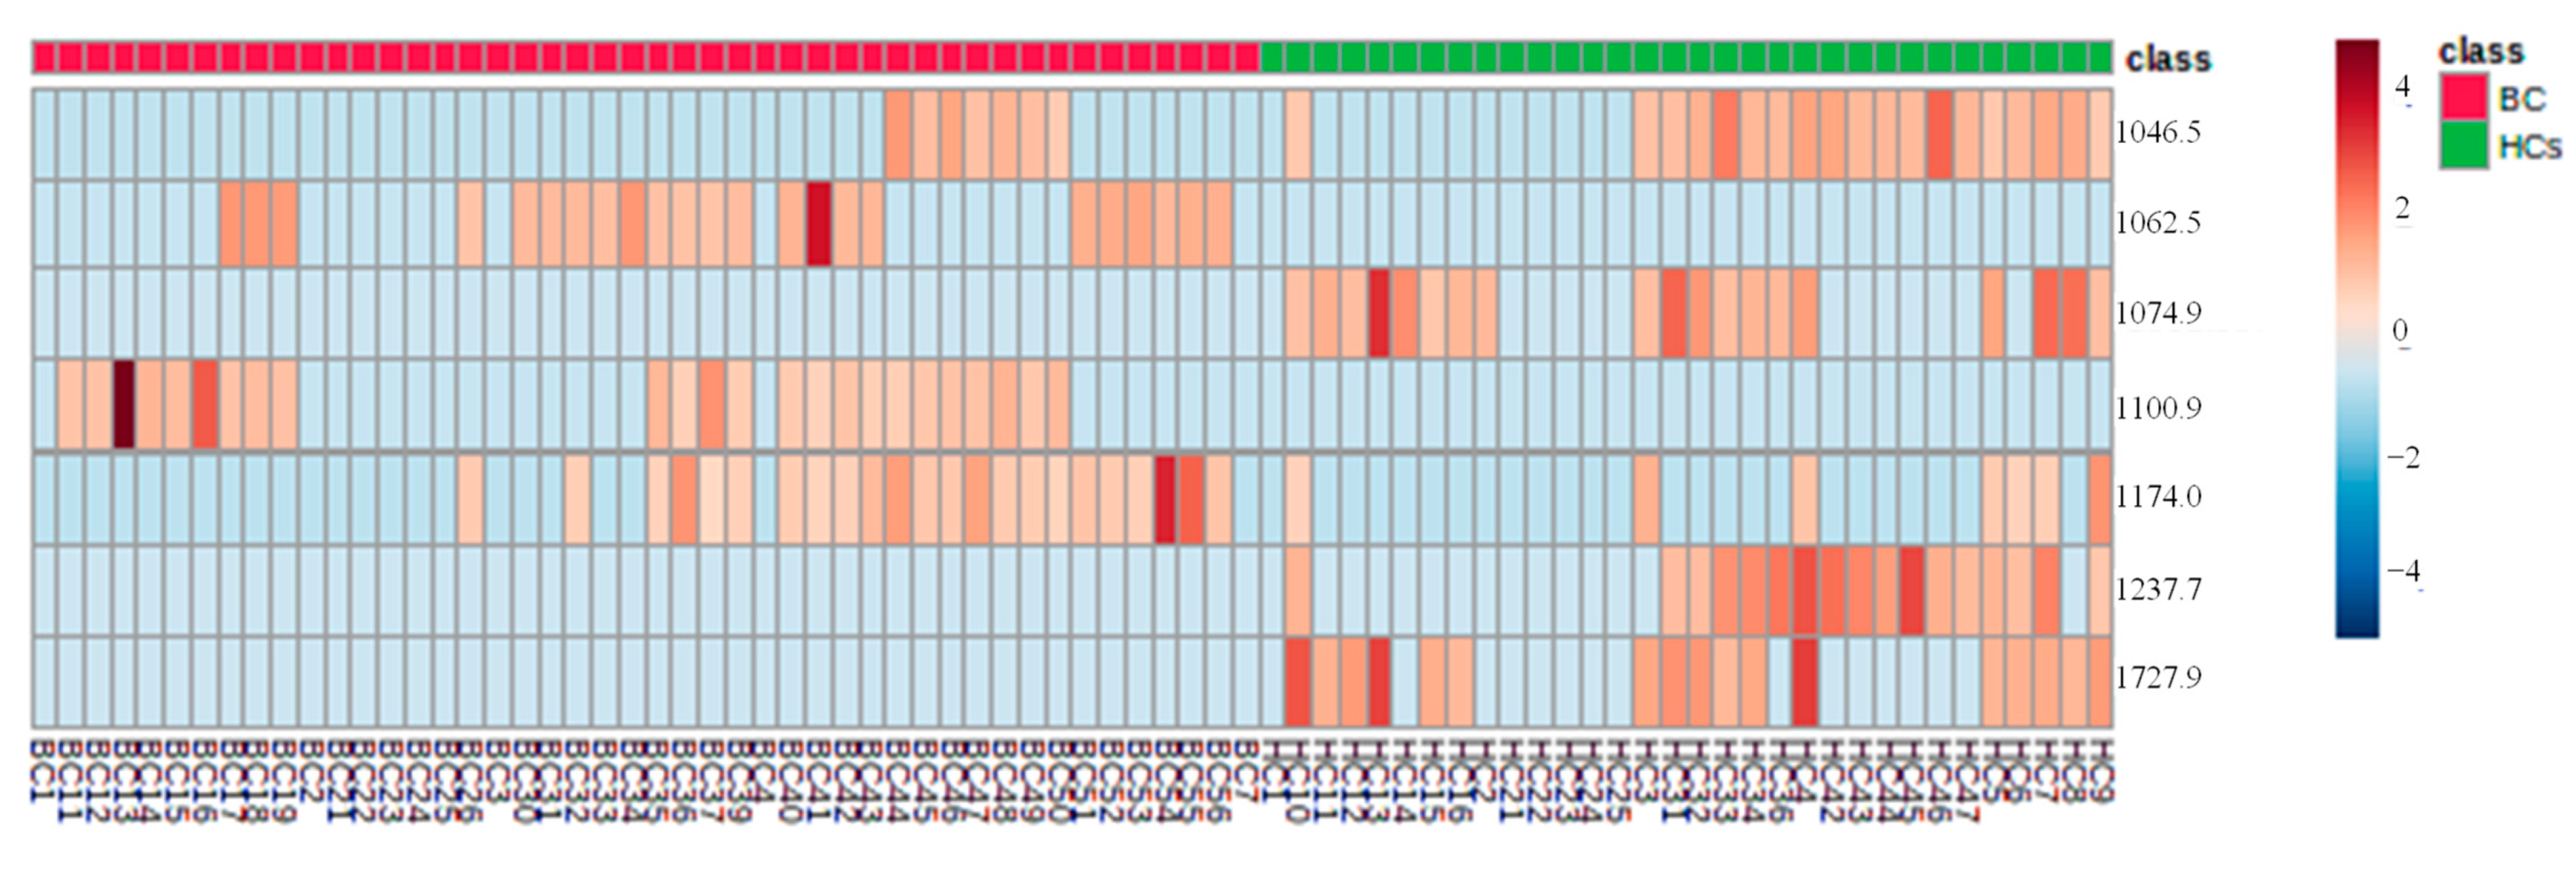
The heat map was built with chosen proteins/peptides by VIP > 1, using Euclidean’s correlation, to provide an instinctive visualization of the data set and the correlations between samples of the two groups (
Figure 9). Similar samples are clustered hierarchically. It is possible to see that for both groups, the features
m/
z 1046.5, 1062.5, 1237.7, and 1727.9, form clusters with an accurate correlation between them, verifying that they were significant peaks for the HCA distinction. Nonetheless, the verification of such associations needs a larger data set for pattern confirmation.
Therefore, based on the results obtained, the final set of discriminative peaks of urines was successful, using MALDI-TOF MS, showing that the urine peptidomic biosignature of BC can be a suitable strategy to identify potential BC biomarkers. Evidently, future experiments on a higher cohort of HCs and BC patients will be required to prove our preliminary outcomes and evaluate the clinical relevance of our method.
4. Conclusions
Although in recently published studies, there is very promising diagnostic potential, the innovative approach based on urinary peptidomic biosignature for the development of a new diagnostic tool for BC is crucial to avoid progressive complications. The identification of the urinary peptidome through 1D SDS-PAGE combined with MALDI-TOF MS and statistical analysis is therefore thought to be an ideal method for establishing the biosignature of potential BC biomarkers, which could provide a critical aid to clinicians for an early BC diagnosis and treatment. This study showed that Lowry’s assay was suitable for the total protein dosage in urine. However, additional research is required to optimize the yield of the precipitated samples, after the protein extraction procedure, to produce reliable results and, consequently, better validate this conclusion. Here, 1D SDS-PAGE allowed identifying the different protein patterns between the two groups, which in combination with analysis of MALDI-TOF MS demonstrated to be suitable for the distinction between BC patients and HCs. As a result, according to multivariate statistical analysis, there were four features out of a total of six identified signals that were shown to be statistically different between the BC patients and the HCs. Of the features identified, m/z 1046.5, 1062.5, 1237.7, and 1727.9 showed the highest sensitivity (88%) and specificity (98%) to discriminate BC patients from the HCs. The obtained results show the potential of the used methodology to establish BC urinary proteomic patterns as a promising strategy for the screening, detection, and treatment follow-up of the disease, which may make up for the lack of BC biomarkers.


