Article

Comparative Kinetic Analysis of Triclosan Degradation under UV-C and Simulated Solar Irradiation

by
Lázaro Adrián González-Fernández
1,2,
Myriam Chems
3,
Nahum Andrés Medellín-Castillo
1,4,*,
Ventura Castillo-Ramos
2,*,
Manuel Sánchez-Polo
2,
Javier E. Vilasó-Cadre
5 and
Raúl Ocampo-Pérez
6
1
Multidisciplinary Graduate Program in Environmental Sciences, Av. Manuel Nava 201, 2nd. Floor, University Zone, San Luis Potosí 78000, Mexico
2
Department of Inorganic Chemistry, Faculty of Science, University of Granada, 18071 Granada, Spain
3
Faculty of Science and Techniques, Hassan First University of Settat, Settat 26002, Morocco
4
Center for Research and Postgraduate Studies, Faculty of Engineering, Universidad Autónoma de San Luis Potosí, Dr. Manuel Nava No. 8, West University Zone, San Luis Potosí 78290, Mexico
5
Institute of Metallurgy, Autonomous University of San Luis Potosí, Sierra Leona Av. 550, San Luis Potosí 78210, Mexico
6
Faculty of Chemical Sciences, Universidad Autónoma de San Luis Potosí, Dr. Manuel Nava No. 6, University Zone, San Luis Potosí 78210, Mexico
*
Authors to whom correspondence should be addressed.
Submission received: 1 April 2024 / Revised: 18 April 2024 / Accepted: 23 April 2024 / Published: 25 April 2024
(This article belongs to the Special Issue Application of Biosorbents in Environmental Purification)

Abstract

:
This research delves deeply into the intricate degradation kinetics of triclosan, employing two distinct methodologies: UV and simulated solar irradiation. Through a comprehensive comparative analysis, the study endeavors to elucidate the efficacy of these techniques, aiming to shed light on their respective methodological strengths and limitations. The study compares the efficacy of UV and simulated solar irradiation techniques for triclosan degradation, revealing that both methods exhibit effectiveness in degrading triclosan, with variations observed in degradation rates and byproduct formation. Through a detailed examination of the kinetics of triclosan degradation, the study reveals the intricate pathways and mechanisms involved in the photodegradation process. Results highlight the influence of irradiance levels and residence times on degradation efficiency. The research identifies optimal conditions for triclosan degradation, emphasizing the importance of residence time and irradiance levels. Results show that a residence time of 4 h and an irradiance level of 450 W m−2 maximize degradation efficiency. Analysis of degradation byproducts provides insights into the transformation pathways of triclosan under UV and simulated solar irradiation, indicating the formation of 2,4-dichlorophenol, quinone, and hydroquinone as primary byproducts.

1. Introduction

The pollution of water bodies with organic compounds presents a significant environmental issue; one that is driven by industries such as mining, metal smelting, and energy production. Inadequate handling or disposal of waste from these sectors results in the release of organic chemical substances into aquatic ecosystems [1].
Excessive concentrations of organic compounds in various ecosystems pose significant threats to cells, human health, and the environment. These pollutants can bioaccumulate and biomagnify along the food chain, leading to severe consequences for marine ecosystems and human wellbeing [2].
Emerging pollutants, including microplastics, fertilizers, personal hygiene products, illegal drugs, and antibiotics, have garnered increased scientific interest recently. Despite their long-standing presence, these pollutants have only recently gained international attention, and many countries lack regulations governing their presence [3,4].
Triclosan (TCS), an antimicrobial compound commonly found in consumer products such as cleaning items, cosmetics, and plastics, has raised concerns due to its persistence in the environment. TCS not only resists degradation but also accumulates in water bodies, potentially affecting aquatic ecosystems and wildlife. Furthermore, TCS’s association with antibiotic resistance raises concerns about its implications for medical and environmental contexts [5].
TCS, as a potential endocrine disruptor, poses risks to the homeostasis of thyroid hormones and estrogenic-dependent responses, as evidenced by studies conducted by Guo et al., 2023; Srnovršnik et al., 2023; and Yoon and Kwack, 2021 [6,7,8]. Although human exposure to TCS has been confirmed through its detection in blood, urine, and breast milk, the comprehensive understanding of its health effects is still under investigation, as noted in research by González-Fernández et al., 2021 and Medellín-Castillo et al., 2024 [9,10].
While adsorption is widely used for pollutant removal, especially for organic compounds [10], photo-oxidation techniques have become preferable for pollutants with aromatic rings and photosensitivity [9]. In our research, we propose the use of photolysis with ultraviolet light, simulated solar light and radicals to evaluate its feasibility for TCS treatment. Previous reports have highlighted the efficiency of integrated photosensitizing/adsorbent materials for TCS removal [11].
Photodegradation, or photolysis, represents a promising advance in the purification of TCS-contaminated wastewater. However, significant concerns arising from the potential generation of toxic byproducts must be addressed. During the photolysis process, the molecular structure of TCS bears similarities to dioxin precursors, the toxicity of which is well documented, indicating the feasibility of the formation of harmful dioxin-like intermediates as well as phenolic compounds. These byproducts represent a considerable risk to aquatic ecology and human health because of their bioaccumulative potential and their persistence in the environment [12,13].
Given the severity of these potential impacts, implementation of rigorous monitoring and thorough analysis of post-photolysis effluents is imperative. This includes characterization of TCS decomposition profiles and quantification of the byproducts generated. This is suggested as part of an environmental risk management strategy, along with the development of advanced analytical technologies that allow the accurate identification and quantification of byproducts at trace concentrations. In addition, it would be prudent to investigate alternative or complementary treatment methods that minimize the formation of these hazardous compounds or facilitate their subsequent degradation to harmless forms.
While pursuing optimization of the photolysis process, the environmental impact assessment of these byproducts should also be deepened through long-term ecotoxicological studies. This is crucial in order to establish safe limits on the levels of these compounds and to design treatment systems that effectively protect both human health and aquatic ecosystems.
Solar degradation, an eco-friendly method, shows promise for mitigating the persistence of TCS in aquatic environments. By harnessing sunlight energy, this approach initiates the breakdown of TCS molecules into less harmful byproducts through photolysis, as outlined by Kaur et al., 2020 [14]. This method is cost-effective and suitable for decentralized applications like water treatment in remote areas, as it does not rely on external energy sources. However, its effectiveness may vary based on factors such as sunlight intensity, water composition, and the presence of other contaminants. Research aimed at optimizing solar degradation processes for TCS can contribute to sustainable water treatment strategies, but challenges related to the formation of potentially toxic intermediate products must be addressed [12,15].
Solar irradiation and UV irradiation, though related processes, exhibit distinct characteristics that can influence their efficacy in degrading TCS. UV irradiation generally has a higher intensity, especially in the UVC range, making it more effective for inducing direct photolysis by breaking chemical bonds. In contrast, solar irradiation, while capable of initiating photolysis, may require longer exposure times due to its lower intensity. Both solar and UV irradiation can generate reactive oxygen species (ROS) during the degradation process, contributing to the breakdown of contaminants like TCS [16,17].
UV irradiation, particularly in the presence of catalysts or persulfate radicals, can enhance ROS formation. Solar irradiation is dependent on environmental factors such as weather conditions and time of day, making it suitable for decentralized and outdoor applications, while UV irradiation is often employed in centralized facilities or controlled settings where specific conditions can be maintained. The choice between these methods depends on factors such as resource availability, environmental context, and the level of control required for the degradation process [18].
This study aims to evaluate the efficiency of solar and UV irradiation methods, with and without persulfate radicals, in removing TCS from water. Additionally, a comprehensive kinetic analysis will be conducted in order to assess the degradation rate and kinetics of TCS under these conditions. The research seeks to identify key factors influencing method effectiveness, including catalyst presence and byproduct formation. By gaining insights into degradation kinetics, the study aims to optimize the practical application of these methods in TCS removal, contributing to effective and sustainable water quality improvement strategies. This integrated approach not only assesses method efficacy but also enhances understanding of underlying mechanisms, enriching knowledge on TCS degradation and its potential environmental and human health impacts.

2. Materials and Methods

2.1. Chemicals and TCS Concentration Determination

The preparation of the TCS stock solution followed the methodology outlined by González-Fernández et al., 2021 [9]. Quantification of TCS in aqueous solution involved constructing a calibration curve using UV–Vis spectroscopy at 280 nm with a Genesys 10S UV–Vis Spectrometer. The concentration of TCS after photodegradation in aqueous solution was determined employing a reverse-phase high-performance liquid chromatography (RP-HPLC) method, akin to the approach detailed by Medellin-Castillo et al., 2013 [19], with detection at a wavelength of 280 nm. The chromatographic column utilized was Agilent Technologies® (Santa Clara, CA, USA) C18 (4.6 × 100 mm particle size, 3.5 μm). The mobile phase for the experiment consisted of a mixture with a volume ratio of 90% acetonitrile to 10% filtered Milli-Q water, and the applied flow rate was set at 0.5 mL min−1.

2.2. UV-C and Solar Photodegradation of the TCS Molecule

The degradation of TCS through UV-C exposure was carried out using a photoreactor consisting of two concentric tubes. The outer tube, crafted from stainless steel, possessed an inner diameter of 13 cm and a height of 30 cm. The inner tube, constructed from quartz, had an inner diameter of 5.5 cm, and stood at a height of 45 cm. Housed within the quartz inner tube was a low-pressure mercury lamp (TNN 15/32 Heraeus 15 W) emitting UV-C light at a wavelength of 254 nm. Atrazine (ATZ) served as an actinometric substance to assess the intensity of lamp irradiation [20].
To gather UV-C photodegradation rate data, a 50 mL TCS solution (1:5 acetonitrile-H2O mixture) was introduced into the reaction tube and continually stirred using a magnetic stirrer. The initial TCS concentration in the solution ranged from 10 to 60 mg L−1, with a constant temperature of 25 °C. Samples were extracted from the reactor solution at intervals of 1, 5, 10, 15, 20, and 30 min, with a sample volume of 1 mL.
The solar simulator employed was the 1500 Solarbox model, with a Xenon lamp capable of emitting radiant energy within the spectral range of 290 to 800 nm, with an irradiance range spanning from 250 to 1100 W m−2. Photodegradation experiments were carried out within an irradiance range of 300 to 600 W m−2, without the use of a UV filter. The time of irradiance was evaluated between 2 and 6 h. The photoreactor accommodated up to three semi-horizontally arranged quartz tubes, each with a capacity of 35 mL, featuring continuous agitation and ventilation.
For radical photodegradation experiments, potassium persulfate solutions were added to the reaction tube along with the TCS solution. The concentration of potassium persulfate varied between 0.5 and 5.0 mmol L−1, while the remaining experimental conditions continued to be constant in both systems. The data obtained from all the experiments were analyzed using the first- and pseudo-second-order models, represented by the following equations, respectively:
d C T C S d t = k T C S 1 C T C S
d C T C S d t = k T C S 2 C T C S 2
where k T C S 1   (s−1) and k T C S 2   (L mg−1 s−1) represent the pseudo-first-order and pseudo-second-order kinetic constants, respectively. The estimation of both constants was carried out utilizing the Statistica Software® v10.
The effectiveness of UV-C and simulated solar light in photodegradation depends on quantum efficiency. Hence, the quantum yield of TCS (ΦTCS) was assessed using the subsequent equation [21]:
Φ T C S = k T C S 2.303 · E T C S · ε T C S
where kTCS is the photodegradation kinetic constant (s−1), E T C S is the energy of the lamps (E s−1 m−2) and ε T C S is the molar absorptivity of TCS (m2 mol−1).
The energy of the lamps was calculated using atrazine as an actinometric substance [19] with the following equation:
Φ A T R Z = k A T R Z 2.303 · E λ · ε A T R Z
where ΦATRZ is 0.046 mol Einstein−1, ɛATRZ is 386 m2 mol−1 for λ = 254 nm [19], and kATRZ is 1.91 × 10⁻³ s−1 (experimental value).
Throughout each of the degradation experiments, the initial pH was established at 7 and was meticulously regulated throughout the duration of the experiments using 0.01 and 0.01 mol L−1 NaOH and HCl solutions as needed.

2.3. Photodegradation Byproducts Detection

The determination of the concentration of 2,4-dichlorophenol (2,4-DCP) concentration after the UV-C irradiation took place at the identical wavelength as TCS, employing the previously outlined experimental conditions. Briefly, varying concentrations of the compound (ranging from 10 to 100 mg L−1) were injected into the chromatographic column, and a calibration curve was established for quantification. Additionally, gas chromatography coupled to a mass spectrometer (GC/MS) was employed to identify any other potential byproducts. No additional extraction steps were employed during sample preparation.
The identification of byproducts resulting from TCS solar degradation was performed using a high-performance liquid chromatograph (HPLC) manufactured by Waters (Acquity H Class model, Milford, CT, USA) in order to improve sensitivity, resolution, and efficiency when analyzing certain compounds, such as some of the intermediate products of TCS photolysis with solar irradiation. This chromatograph was equipped with a C-18 analytical column (2.1 × 75 mm, 2.7 μm) and was coupled with a high-resolution mass spectrometer (Waters Xevo TQ-S, Milford, CT, USA). The mass spectrometer was equipped with a positive electrospray ionization system (HPLC/Q-TOF MS ESI). Spectra were acquired over a mass range (m/z) spanning from 50 to 1200 uma.

3. Results and Discussions

3.1. Effect of Irradiance Intensity and Time in the Solar Photodegradation

The percentage degradation (%Deg) of TCS using simulated solar radiation between 300 and 650 W m−2 and residence times between 2 and 6 h with an initial concentration of 10 mg L−1 were calculated based on the ratio presented in the equation below where Co and C are the initial and final concentration of TCS in the degradation experiments:
% D e g = C o C C o
Table 1 describes the experimental setup using a response surface methodology (RSM) along with the %Deg calculated in each experiment.
The %Deg results, once calculated, underwent a single-entry analysis of variance (ANOVA) to assess the impact of the considered variables (time, T, and irradiance, I) on the experimental design’s response. Following this analysis, it was determined that the data conformed to a second-order model (Supplementary Table S1) described by the following non-coded equation:
% D e g = 162.23 + 34.52 T + 0.68 I 3.85 T 2 0.00070 I 2
The response surface, depicted in Figure 1, indicates that the linear terms T and I, as well as the quadratic terms T2 and I2, significantly influence %Deg. Notably, when residence times and irradiances approach the center of the analyzed ranges, the highest %Deg values are observed. To pinpoint the optimum time and irradiance within the range studied, a response optimization was conducted using Microsoft Excel 2024’s Solver tool. This optimization confirmed that 4 h and 450 W m−2 represent the parameters that maximize %Deg. The percentage deviation of the model from the experimental data was 5.6% (Table 2). The adjusted and predicted R2 (%) for this model are 93.7 and 90.0, respectively.
Similar results have been reported by Polo et al., 2016 [22]; Mar-Ortiz et al., 2020 [23]; and Fernández-Perales et al., 2020 [24], who each studied the behavior of different emerging pollutants under simulated solar radiation and found similar results to those reported in this work. With the results found after these experiments, the residence time for the solar degradation experiments was selected as 4 h and the radiation intensity as 450 W m−2.

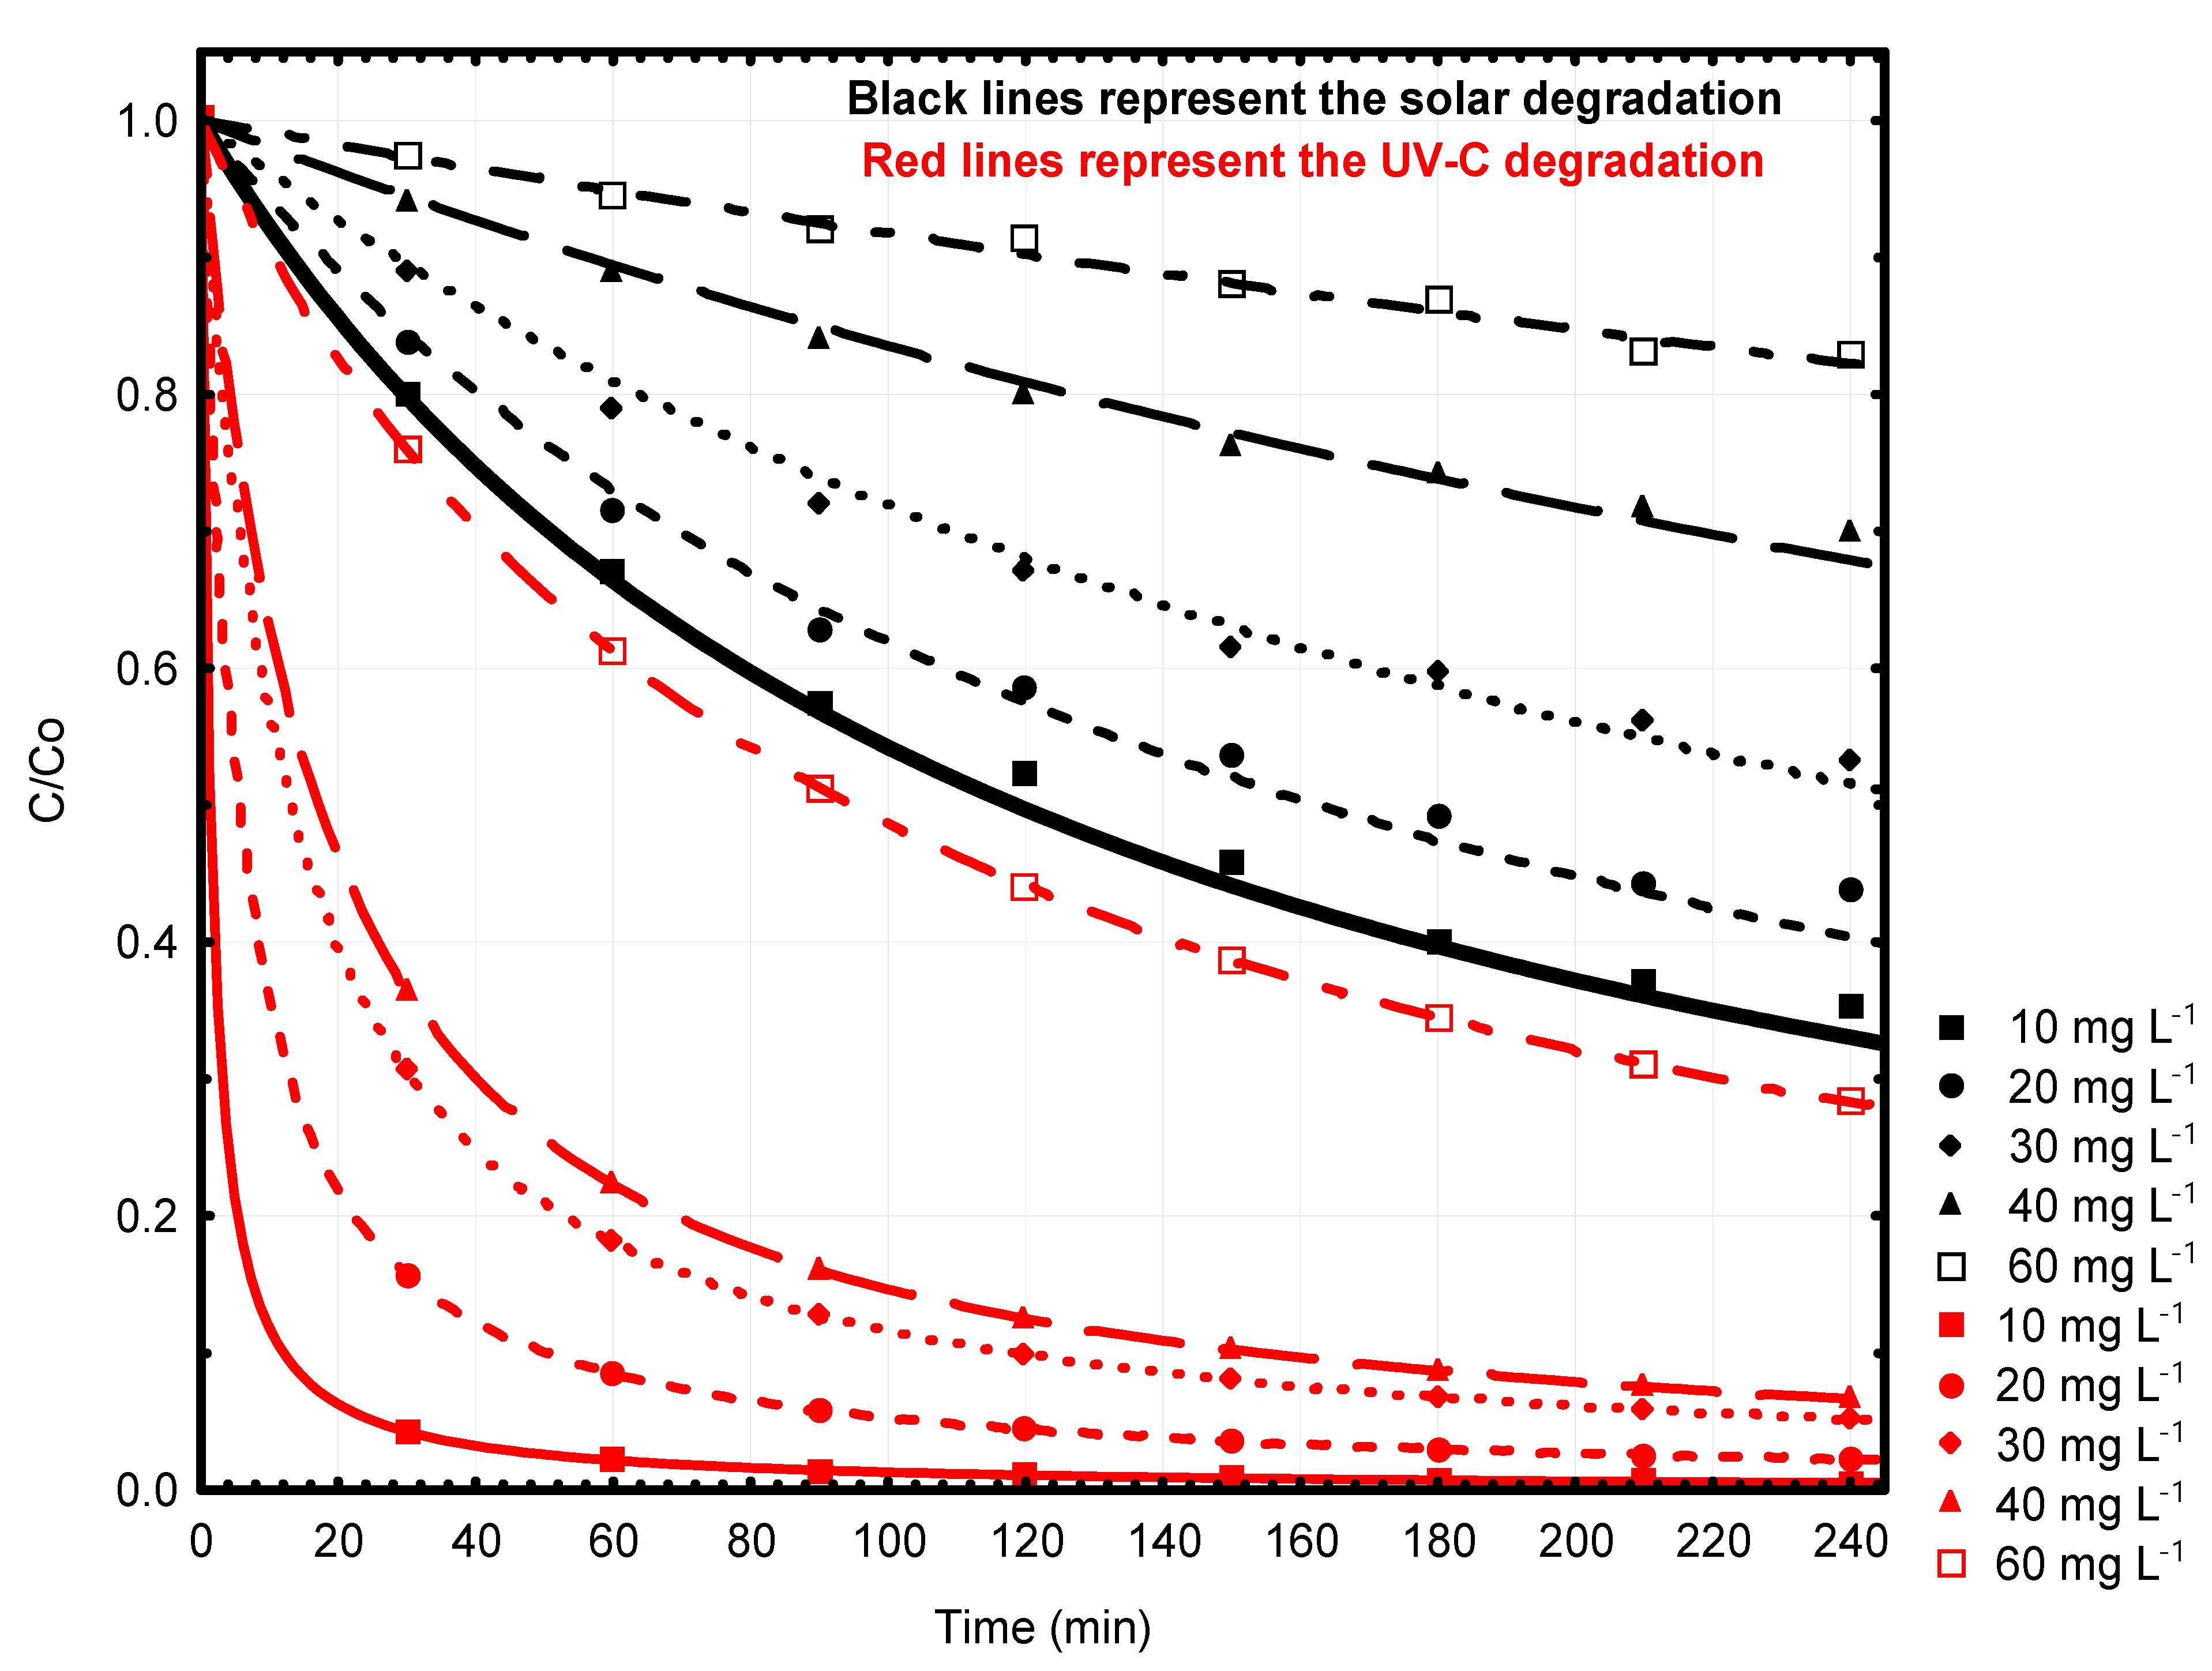
3.2. Triclosan UV-C and Solar Photodegradation

Figure 2 illustrates the decay curves of TCS concentration at 25 °C in an aqueous solution, employing both UV-C and solar degradation. The decay curves correspond with different initial concentration values and are represented by the second-order kinetic model. Supplementary Figure S1 shows the logarithmic photodegradation curves.
Table 3 presents the values of the kinetic constants for both degradation technologies, along with the determination coefficients. The results indicate that the pseudo-second-order kinetic model effectively describes the decay process (with R2 > 0.95). Furthermore, it is notable that both kinetic constants decrease as the initial concentration increases, a trend previously observed by Yi Liu et al., 2020 [25].
Figure 2 also shows that the degradation using UV-C light achieves higher percentages of pollutant degradation when compared with the simulated solar radiation. This behavior can be corroborated by the values of the rate constants of both processes, whose proportions vary between 10 and 30 times.
The estimated values of ΦTCS varied from 7·10−3 to 3952·10−3 mol Einstein−1 for UV-C light degradation and from 0.6·10−3 to 341·10−3 mol Einstein−1 for simulated solar radiation degradation. These findings suggest that direct photodegradation using these radiation sources is relatively ineffective, and that the efficiency of the photodegradation process diminishes as the TCS concentration increases. Additionally, it can be corroborated that the degradation process with simulated sunlight is less efficient than degradation with UV-C light. To enhance the process efficiency, small amounts of radicals, like potassium persulphate, can be added to the photoreaction solution [26].
The UV-C/S2O82− and solar radiation/S2O82− systems employ potassium peroxodisulphate (K2S2O8) as a precursor for radicals. Peroxodisulphate (S2O82−) itself possesses strong oxidizing properties (E0 = 2.05 V), but exhibits low reaction rates at room temperature [22,27]. For instance, only 25% of the initial TCS concentration was degraded after 240 min of treatment, using an initial concentration of 10 000 μmol L−1 of S2O82−. Previous studies [28,29,30,31] have demonstrated that UV-C and solar radiation light can photochemically decompose S2O82−, resulting in the formation of sulphate radicals. These radicals are highly oxidative species capable of degrading organic compounds through subsequent reactions:
S 2 O 8 2 + h ν = 2 S O 4 ·
S O 4 · + R H 2 = S O 4 2 + R H ·
R H · + S 2 O 8 2 = R + S O 4 2 + H + + S O 4 ·
S O 4 · + R H = R · + S O 4 2 + H +
Figure 3 depicts the photodegradation kinetic curves of TCS in both the UV-C/S2O82− and sunlight/S2O82− systems, with TCS concentrations near 60 mg L−1 and pH set at 7. The initial concentrations of potassium persulphate vary between 500, 1000, 2000, 5000, and 10,000 mmol L−1. Supplementary Figure S2 shows the logarithmic photodegradation curves.
The results presented in Figure 3 illustrate that the photodegradation rate of TCS significantly increases when potassium persulphate is introduced into the photooxidation system, regardless of the radiation source. For instance, the value of kTCS2 is 70·10−5 L mg−1 s−1 with an initial potassium persulphate concentration of 0.5 mmol L−1, whereas kTCS2 for direct UV-C photodegradation was 4 times slower.
In the case of solar degradation, the value of kTCS2 is 45·10−5 L mg−1 s−1 with the same initial potassium persulphate concentration, whereas kTCS2 for direct solar photodegradation was 3 times slower This enhancement can be attributed to the presence of sulphate and hydroxyl radicals, which accelerate the decomposition of TCS molecules into lower molecular weight byproducts. The sulphate and hydroxyl radicals are produced through the UV-induced decomposition of potassium persulphate [32].

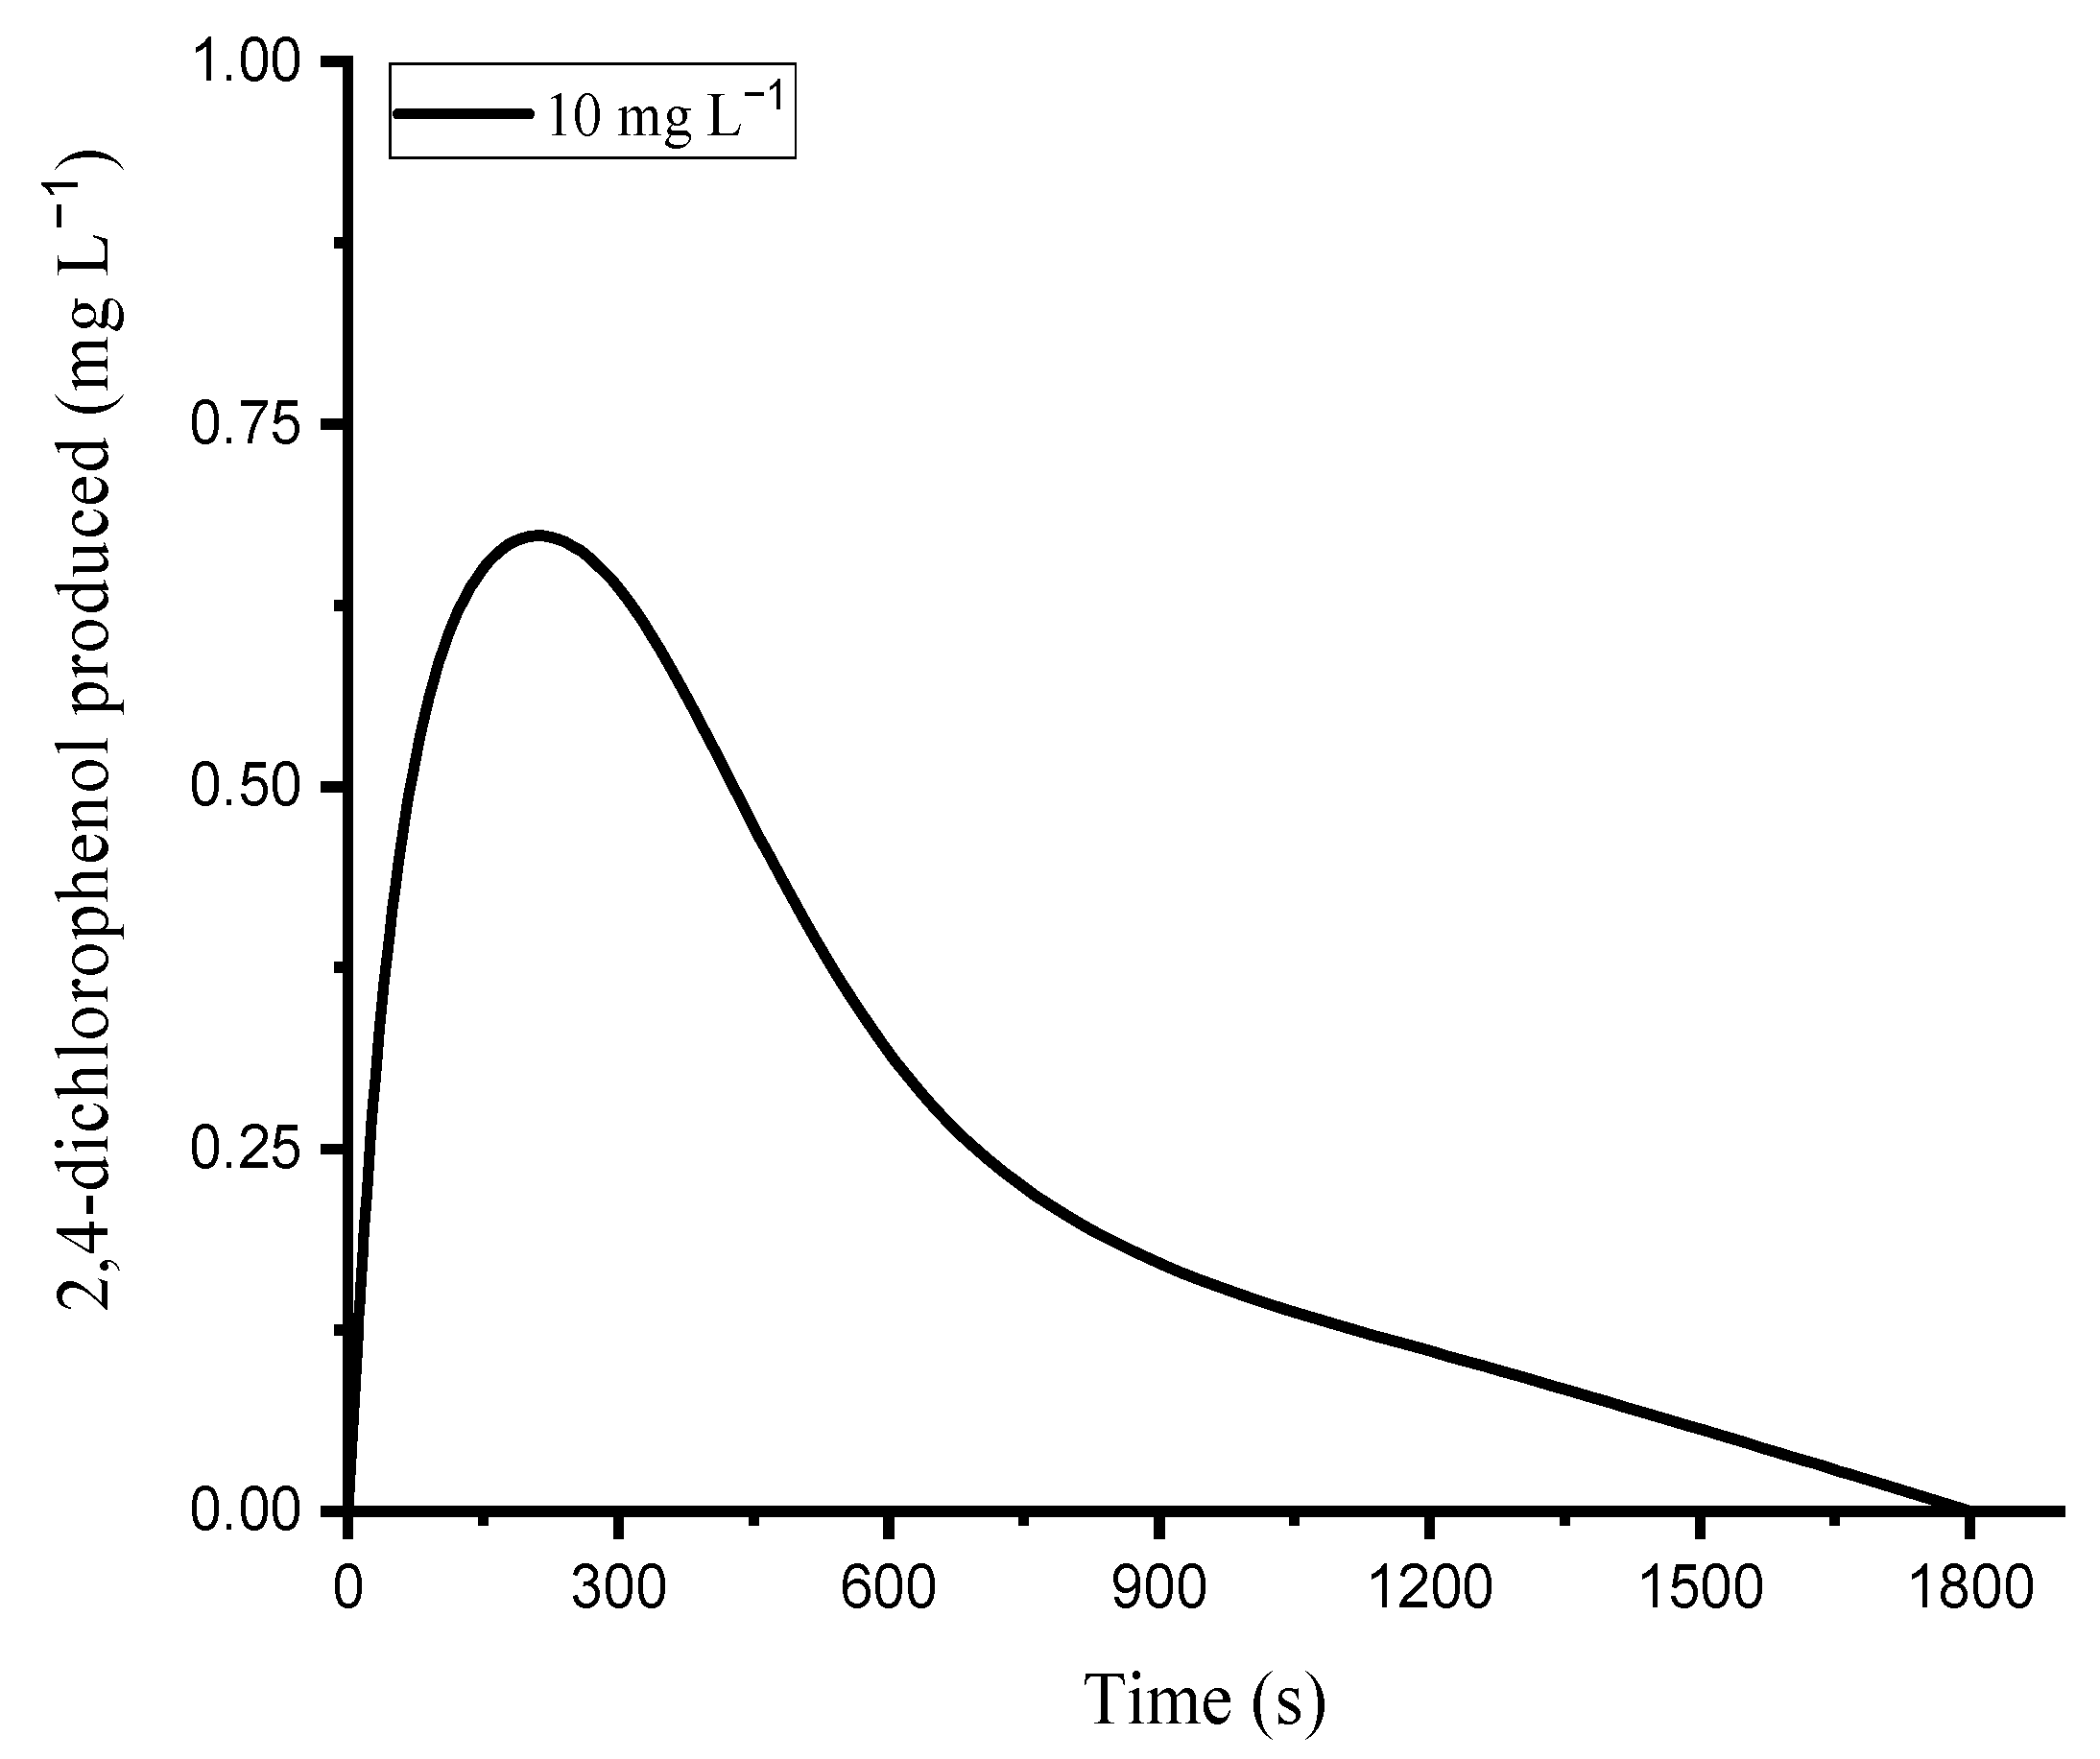
3.3. Determination of Photodegradation Secondary Compounds

The exposure of TCS to UV-C and solar light induces its photodegradation, resulting in the formation of various degradation byproducts. Several studies have indicated that, under an UV-C irradiation wavelength of 254 nm, three primary byproducts are typically generated: 2,4-DCP, a quinone, and a hydroquinone [33,34].
Throughout the photodegradation process of TCS, three distinct peaks were observed. The three peaks exhibited proximity in retention time, falling between 1.8 and 2.5 min. To identify 2,4-DCP, a persistent and environmentally harmful compound, two methods were employed. Initially, its chromatogram and retention time on the column were obtained under consistent experimental conditions.
To achieve this, the UV absorption spectrum of 2,4-DCP was first acquired (Figure 4), revealing an absorption maximum at approximately 280 nm. Consequently, detection of 2,4-DCP could be conducted at the same wavelength used for TCS. Subsequently, an HPLC analysis of a 2,4-DCP solution was performed, yielding a retention time of 2.5 min. This result conclusively established that the peak observed at 2.5 min during the decomposition of TCS corresponds with 2,4-DCP. Additionally, quantification of the degradation byproduct was feasible based on this finding.
To detect and quantify the degradation byproducts of TCS under UV-C light exposure, an initial contaminant concentration of 10 mg L−1 was utilized, as depicted in Figure 5. Notably, it becomes evident that, at early time points, 2,4-DCP begins to accumulate before subsequently dropping in concentration. This observed pattern arises due to the relatively slower formation rate of this byproduct compared with its decomposition rate induced by UV-C light, particularly evident at lower initial concentrations of TCS [35]. Nonetheless, studies indicate that, as the concentration of TCS increases, the rate of byproduct formation surpasses that of decomposition [10].
As can be seen in the figure itself, the concentration of created 2,4-DCP never exceeds 0.75 mg L−1, and after 30 min the concentration is no longer detectable and approaches zero. This shows that the production of this harmful intermediate is easily achieved using this technology and that it can be recommended for the removal of TCS if its concentration in water does not exceed 10 mg L−1. Additionally, it is important to note that in wastewater, the concentration of TCS typically remains within the range of nanograms per liter of solution as a rule. Consequently, the quantity of byproducts formed would be minimal in comparison with the quantity of TCS being removed.
An aliquot of the same sample, which underwent UV light degradation for 5 min, was subjected to analysis using a gas chromatograph coupled with a mass spectrometry detector. The analysis revealed the presence of TCS and 2,4-DCP as degradation byproducts, along with additional peaks possibly corresponding to quinone and hydroquinone byproducts of TCS, as reported by Son et al., 2010 [36]. The resulting chromatogram is depicted in Figure 6.
For the case of solar degradation, due to the heterogeneity of the radiation source and the large variety of reactions that can be triggered, the degradation byproducts were analyzed by HPLC. From the sample with a TCS concentration of 10 mg L−1 an aliquot was taken after the first 30 min of irradiation and its composition was analyzed; its respective chromatogram is shown in Figure 7a.
As can be seen, after 30 min of solar-irradiation-only deprotonated TCS, its dechlorinated species and TCS quinone/hydroquinone are formed, but the presence of 2,4-DCP is not detectable. The analysis was repeated after 4 h of irradiation and a similar chromatogram was obtained (Figure 7b), showing a similar pattern without the presence of the undesirable 2,4-DCP.
The absence or minimal detection of 2,4-DCP in the degradation products under simulated solar radiation is advantageous for several reasons. Firstly, it indicates reduced environmental risks associated with its presence in aquatic ecosystems, as 2,4-DCP is known to be persistent and harmful [37]. Secondly, achieving low or undetectable levels of 2,4-DCP ensures compliance with regulatory standards, contributing to environmental protection. Additionally, the absence of 2,4-DCP suggests the efficiency of the treatment method in breaking down TCS into less harmful byproducts, reducing the need for additional treatment steps. Lastly, it may lead to cost savings in wastewater treatment operations by eliminating the need for additional measures to remove or neutralize 2,4-DCP.

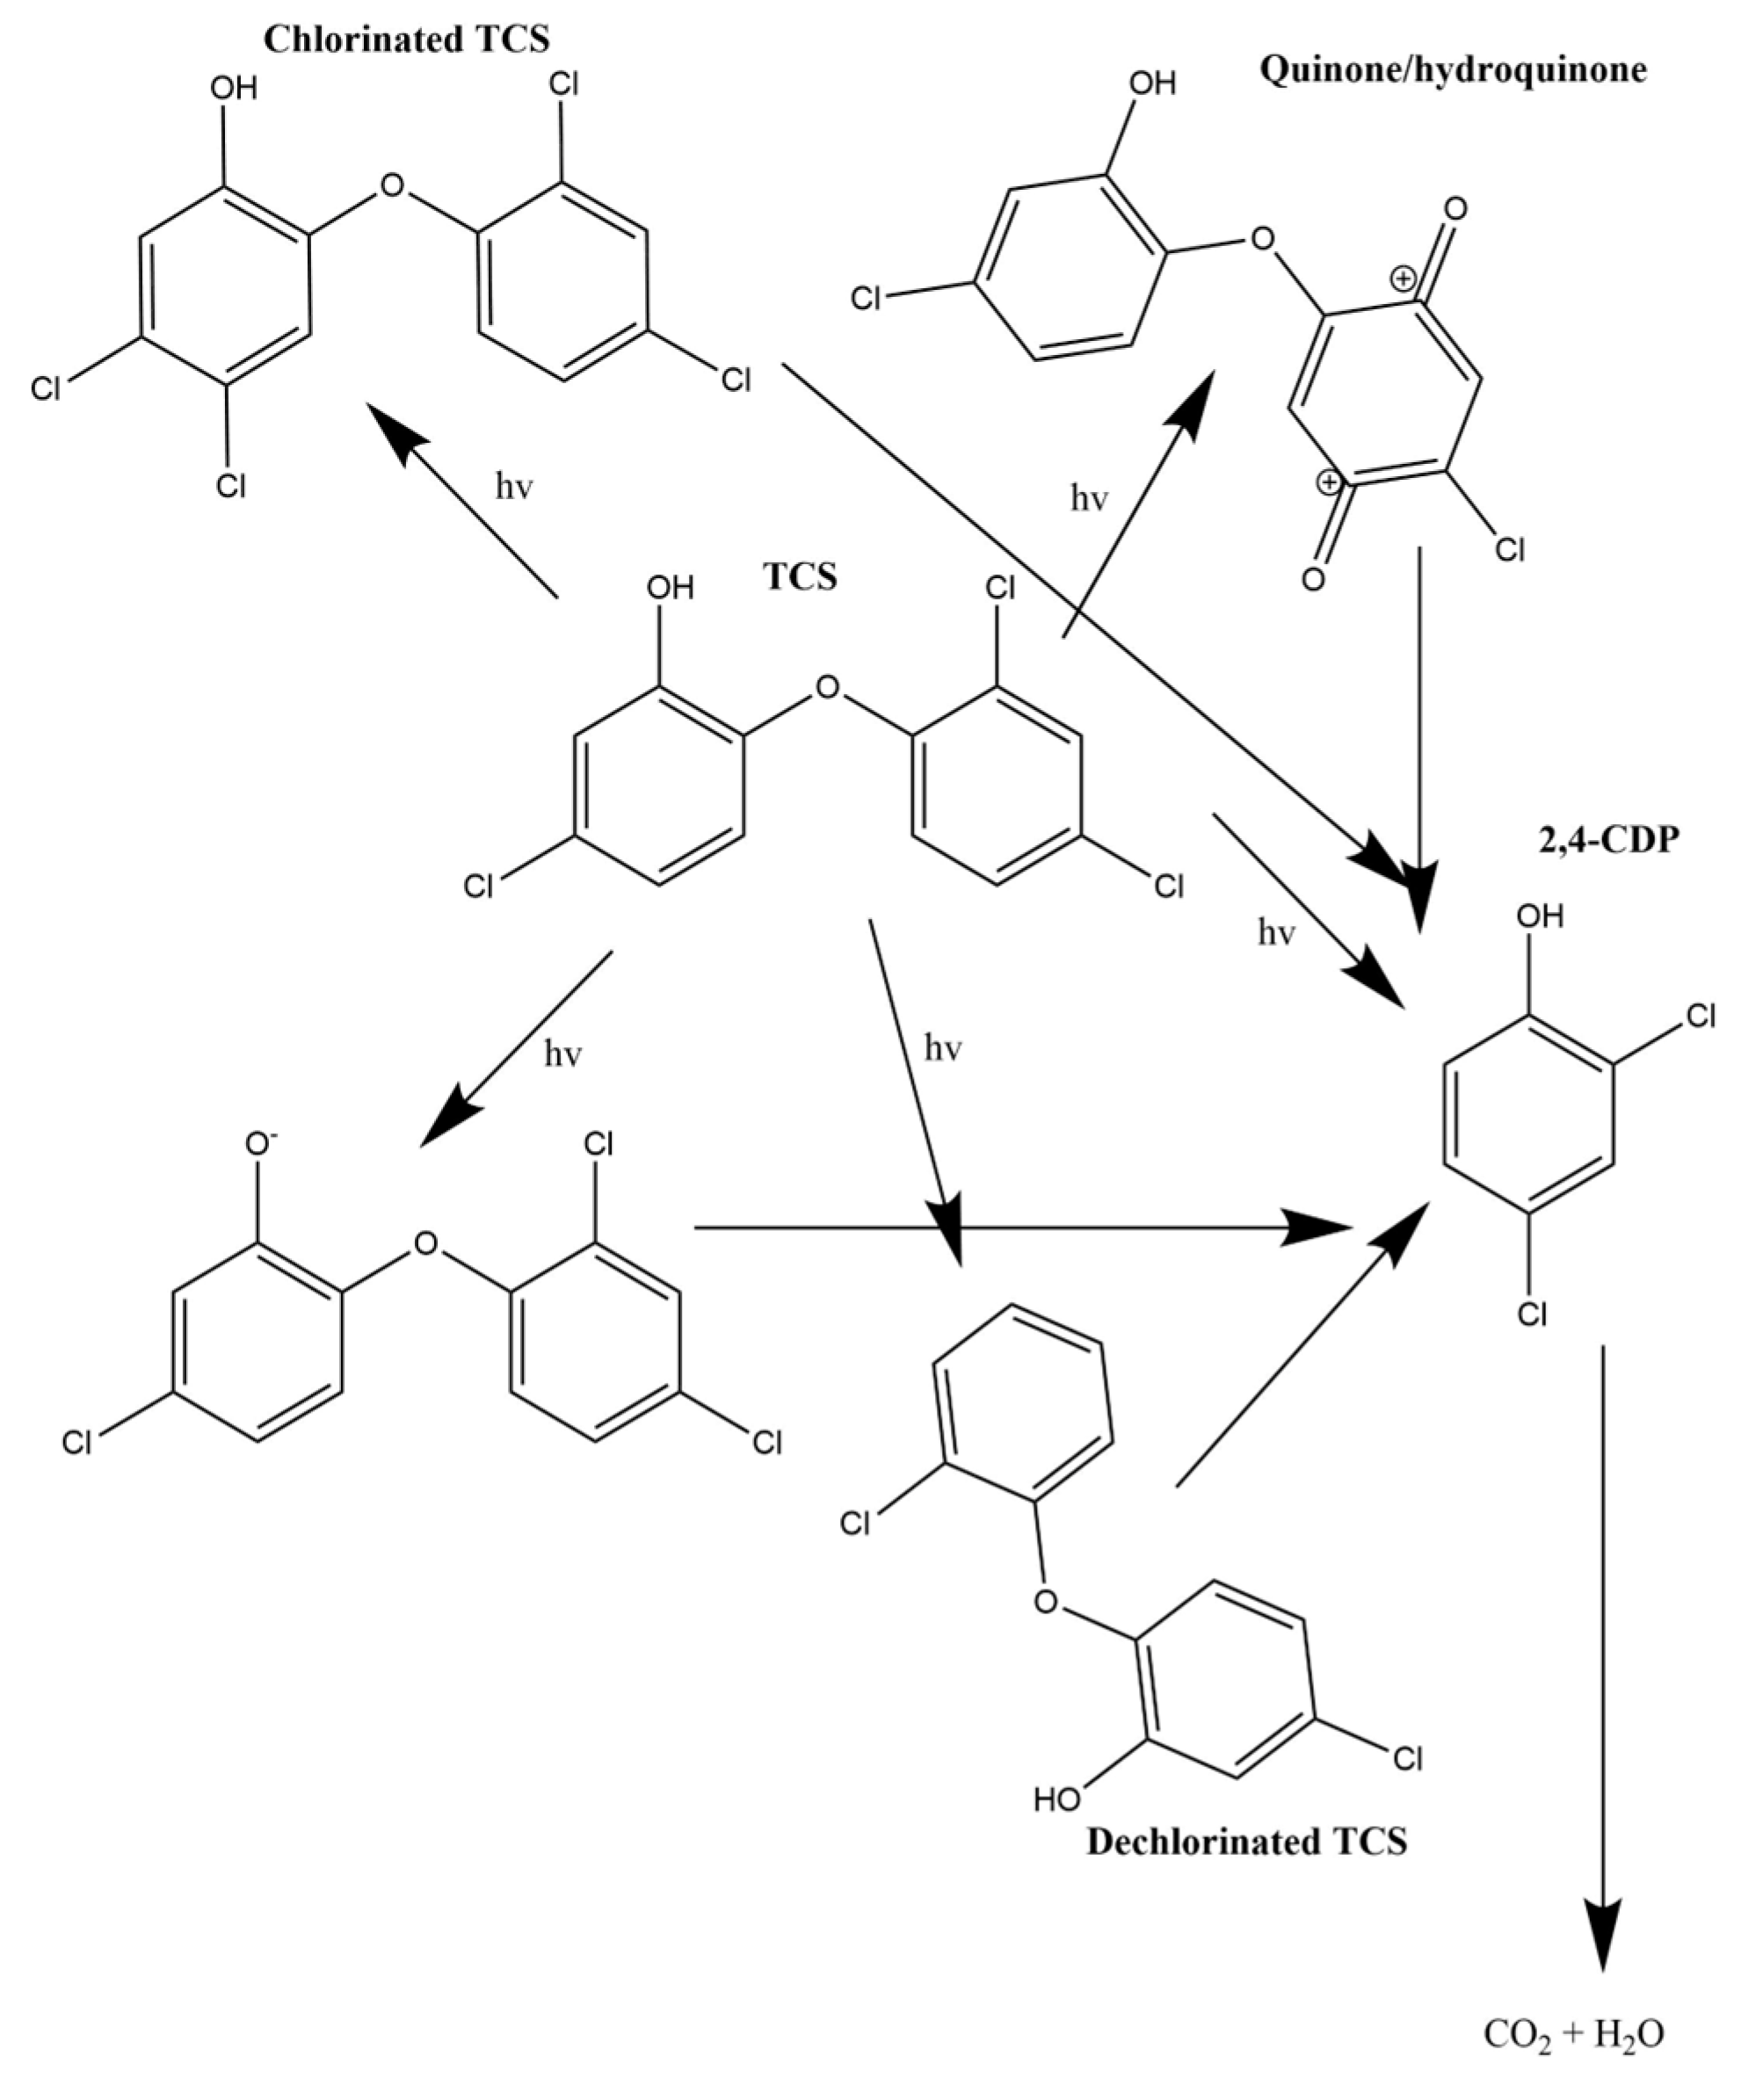
3.4. Potential Pathways for TCS Photodegradation

TCS, as a molecule sensitive to light, and particularly to UV-C radiation, undergoes degradation reactions upon continuous exposure to irradiation, whether from sunlight or UV light in the C region. This process results in the decomposition of the molecule, with 2,4-DCP being identified among the intermediate products, exclusively in the presence of UV-C light [37]. However, the quantity produced poses no environmental risk, as it does not exceed 0.75 mg L−1, and, after 30 min of irradiation, it undergoes complete mineralization [9]. Various potential degradation pathways of TCS to 2,4-DCP and other potential degradation byproducts are described in the literature [38,39,40]. Figure 8 illustrates the most probable routes when UV-C light is present.
It is noteworthy that, under these conditions, the identification of potential intermediates such as chlorinated and dechlorinated TCS molecules becomes challenging due to their instability. Nonetheless, some researchers have successfully isolated and identified them [40]. Similarly, quinone and hydroquinone-type intermediates, albeit less stable, were identifiable in this study when simulated sunlight was employed (Figure 9).
Most of the photodegradation routes depicted in Figure 8 and Figure 9 consist of the cleavage of the TCS molecule facilitated by hydroxyl radicals generated in the presence of a radiation source such as UV-C or sunlight. These highly reactive radicals initiate chain reactions that decompose the TCS molecule, eventually preceding the formation of 2,4-DCP until complete mineralization occurs [25].

4. Conclusions

The study investigated the degradation of TCS using simulated solar radiation across a range of irradiance levels and residence times and UV-C light with and without the presence of persulfate radicals. For simulated solar radiation, analysis revealed significant degradation rates influenced by both T and I, indicating that longer residence times and higher irradiance levels led to increased degradation. Response optimization suggested 4 h and 450 W m−2 as optimal conditions for maximum degradation. Comparable results were observed in previous studies, confirming the effectiveness of the chosen parameters.
Comparison of UV-C and solar degradation kinetics highlighted the superiority of UV-C in achieving higher degradation percentages. This difference was attributed to the greater efficiency of UV-C, supported by kinetic constants indicating faster degradation rates compared with solar degradation.
Furthermore, the addition of potassium persulphate to the degradation systems significantly enhanced degradation rates, particularly in solar degradation. Photodegradation pathways revealed the formation of various byproducts, including 2,4-DCP, quinone, and hydroquinone, under UV-C and solar irradiation. However, the presence of 2,4-DCP was minimal and posed no environmental risk.
Overall, the study provides valuable insights into the degradation kinetics and pathways of TCS under different irradiation conditions, emphasizing the potential for UV-C and solar photodegradation as effective methods for pollutant removal in practical terms. While acknowledging the potential matrix effect from real wastewater or river water, further research could explore additional optimization strategies and investigate the degradation mechanisms in more detail, especially in real wastewater scenarios.

Supplementary Materials

The following supporting information can be downloaded at: https://0-www-mdpi-com.brum.beds.ac.uk/article/10.3390/separations11050131/s1, Table S1. Analysis of variance for the influence of time and irradiation on the degradation efficiency for TCS under simulated solar irradiation, Figure S1. Effect of the initial concentration of TCS at 25 °C on UV-C and solar photodegradation. Lines represent the logarithmic second-order kinetic curves, Figure S2. Photodegradation degradation curves (logarithmic) of TCS in (a) UV-C/S2O82− and (b) sunlight/S2O82− systems. [TCS]0 = 60 mg L−1; pH = 7.0.

Author Contributions

Conceptualization: L.A.G.-F., M.C., N.A.M.-C., V.C.-R. and M.S.-P.; methodology: L.A.G.-F., M.C., N.A.M.-C., V.C.-R. and M.S.-P.; software: L.A.G.-F., M.C., N.A.M.-C., V.C.-R. and M.S.-P.; validation: L.A.G.-F., M.C., N.A.M.-C., V.C.-R. and M.S.-P.; formal analysis: L.A.G.-F., M.C., N.A.M.-C., V.C.-R., M.S.-P., R.O.-P. and J.E.V.-C.; investigation: L.A.G.-F., M.C., N.A.M.-C., V.C.-R. and M.S.-P.; resources: N.A.M.-C. and M.S.-P.; data curation: L.A.G.-F., M.C., N.A.M.-C., V.C.-R., M.S.-P., R.O.-P. and J.E.V.-C.; writing—original draft preparation: L.A.G.-F., M.C., N.A.M.-C., V.C.-R., M.S.-P., R.O.-P. and J.E.V.-C.; writing—review and editing: L.A.G.-F., M.C., N.A.M.-C., V.C.-R., M.S.-P., R.O.-P. and J.E.V.-C.; visualization, L.A.G.-F., V.C.-R. and M.S.-P.; funding acquisition: V.C.-R., N.A.M.-C. and M.S.-P. All authors have read and agreed to the published version of the manuscript.

Funding

This research received no external funding. This work has been developed as part of a PhD thesis work in Chemistry at the University of Granada and PhD in Environmental Sciences at the Autonomous University of San Luis Potosi.

Data Availability Statement

Data will be made available on request.

Conflicts of Interest

The authors declare no conflict of interest.

References

  1. Zhao, J.; Dang, Z.; Muddassir, M.; Raza, S.; Zhong, A.; Wang, X.; Jin, J. A New Cd(II)-Based Coordination Polymer for Efficient Photocatalytic Removal of Organic Dyes. Molecules 2023, 28, 6848. [Google Scholar] [CrossRef] [PubMed]
  2. Singh, A.K.; Chandra, R. Pollutants released from the pulp paper industry: Aquatic toxicity and their health hazards. Aquat. Toxicol. 2019, 211, 202–216. [Google Scholar] [CrossRef]
  3. Vasilachi, I.C.; Asiminicesei, D.M.; Fertu, D.I.; Gavrilescu, M. Occurrence and fate of emerging pollutants in water environment and options for their removal. Water 2021, 13, 181. [Google Scholar] [CrossRef]
  4. Zheng, M.; Chen, J.; Zhang, L.; Cheng, Y.; Lu, C.; Liu, Y.; Singh, A.; Trivedi, M.; Kumar, A.; Liu, J. Metal organic frameworks as efficient adsorbents for drugs from wastewater. Mater. Today Commun. 2022, 31, 103514. [Google Scholar] [CrossRef]
  5. Bilal, M.; Barceló, D.; Iqbal, H.M.N. Persistence, ecological risks, and oxidoreductases-assisted biocatalytic removal of triclosan from the aquatic environment. Sci. Total Environ. 2020, 735, 139194. [Google Scholar] [CrossRef]
  6. Srnovršnik, T.; Virant-Klun, I.; Pinter, B. Polycystic Ovary Syndrome and Endocrine Disruptors (Bisphenols, Parabens, and Triclosan)—A Systematic Review. Life 2023, 13, 138. [Google Scholar] [CrossRef]
  7. Guo, Y.; Shi, W.; Liu, Z.; Sun, X.; Wu, Y. Cetaceans as bio-indicators revealed the increased risks of triclosan exposure and associated thyroid hormone disruption during the COVID-19 pandemic. J. Hazard. Mater. 2023, 459, 132289. [Google Scholar] [CrossRef] [PubMed]
  8. Yoon, K.S.; Kwack, S.J. In vitro and in vivo estrogenic activity of triclosan. J. Toxicol. Environ. Health—Part A Curr. Issues 2021, 84, 800–809. [Google Scholar] [CrossRef]
  9. González-Fernández, L.A.; Medellín-Castillo, N.A.; Ocampo-Pérez, R.; Hernández-Mendoza, H.; Berber-Mendoza, M.S.; Aldama-Aguilera, C. Equilibrium and kinetic modelling of triclosan adsorption on Single-Walled Carbon Nanotubes. J. Environ. Chem. Eng. 2021, 9, 106382. [Google Scholar] [CrossRef]
  10. Medellín-Castillo, N.A.; González-Fernández, L.A.; Ocampo-Pérez, R.; Leyva-Ramos, R.; Luiz-Dotto, G.; Flores-Ramírez, R.; Navarro-Frómeta, A.E.; Aguilera-Flores, M.M.; Carrasco-Marín, F.; Hernández-Mendoza, H.; et al. Efficient removal of triclosan from water through activated carbon adsorption and photodegradation processes. Environ. Res. 2024, 246, 118162. [Google Scholar] [CrossRef]
  11. Marazuela, M.D.; García-Fresnadillo, D. An integrated photosensitizing/adsorbent material for the removal of triclosan from water samples. Sep. Purif. Technol. 2020, 251, 117392. [Google Scholar] [CrossRef]
  12. Solá-Gutiérrez, C.; Schröder, S.; San-Román, M.F.; Ortiz, I. Critical review on the mechanistic photolytic and photocatalytic degradation of triclosan. J. Environ. Manag. 2020, 260, 110101. [Google Scholar] [CrossRef] [PubMed]
  13. Liu, Y.; Xu, J.; Cao, Z.; Fu, R.; Zhou, C.; Wang, Z.; Xu, X. Adsorption behavior and mechanism of Pb(II) and complex Cu(II) species by biowaste-derived char with amino functionalization. J. Colloid Interface Sci. 2020, 559, 215–225. [Google Scholar] [CrossRef] [PubMed]
  14. Kaur, H.; Dahake, R.; Maddigapu, P.R.; Hippargi, G.; Pophali, G.R.; Bansiwal, A. Enhanced photocatalytic degradation of antimicrobial triclosan using rGO–TiO2 composite under natural solar illumination. J. Mater. Sci. Mater. Electron. 2020, 31, 6045–6058. [Google Scholar] [CrossRef]
  15. Schröder, S.; San-Román, M.F.; Ortiz, I. Photocatalytic transformation of triclosan. Reaction products and kinetics. Catalysts 2020, 10, 1468. [Google Scholar] [CrossRef]
  16. Titchou, F.E.; Zazou, H.; Afanga, H.; El Gaayda, J.; Ait Akbour, R.; Nidheesh, P.V.; Hamdani, M. Removal of organic pollutants from wastewater by advanced oxidation processes and its combination with membrane processes. Chem. Eng. Process.—Process Intensif. 2021, 169, 108631. [Google Scholar] [CrossRef]
  17. Pandit, C.; Banerjee, S.; Pandit, S.; Lahiri, D.; Kumar, V.; Chaubey, K.K.; Al-Balushi, R.; Al-Bahry, S.; Joshi, S.J. Recent advances and challenges in the utilization of nanomaterials in transesterification for biodiesel production. Heliyon 2023, 9, e15475. [Google Scholar] [CrossRef] [PubMed]
  18. Othman, Z.; Sinopoli, A.; MacKey, H.R.; Mahmoud, K.A. Efficient Photocatalytic Degradation of Organic Dyes by AgNPs/TiO2/Ti3C2Tx MXene Composites under UV and Solar Light. ACS Omega 2021, 6, 33325–33338. [Google Scholar] [CrossRef] [PubMed]
  19. Medellin-Castillo, N.A.; Ocampo-Pérez, R.; Leyva-Ramos, R.; Sanchez-Polo, M.; Rivera-Utrilla, J.; Méndez-Díaz, J.D. Removal of diethyl phthalate from water solution by adsorption, photo-oxidation, ozonation and advanced oxidation process (UV/H2O2, O3/H2O2 and O3/activated carbon). Sci. Total Environ. 2013, 442, 26–35. [Google Scholar] [CrossRef]
  20. Rodríguez-Blanco, L.A.J.; Ocampo-Pérez, R.; Gómez-Durán, C.F.A.; Mojica-Sánchez, J.P.; Razo-Hernández, R.S. Removal of sulfamethoxazole, sulfadiazine, and sulfamethazine by UV radiation and HO and SO4•− radicals using a response surface model and DFT calculations. Environ. Sci. Pollut. Res. 2020, 27, 41609–41622. [Google Scholar] [CrossRef]
  21. Prados-Joya, G.; Sánchez-Polo, M.; Rivera-Utrilla, J.; Ferro-garcía, M. Photodegradation of the antibiotics nitroimidazoles in aqueous solution by ultraviolet radiation. Water Res. 2011, 45, 393–403. [Google Scholar] [CrossRef] [PubMed]
  22. Polo, A.M.S.; López-Peñalver, J.J.; Sánchez-Polo, M.; Rivera-Utrilla, J.; Velo-Gala, I.; Salazar-Rábago, J.J. Oxidation of diatrizoate in aqueous phase by advanced oxidation processes based on solar radiation. J. Photochem. Photobiol. A Chem. 2016, 319, 87–95. [Google Scholar] [CrossRef]
  23. Mar-Ortiz, A.F.; Salazar-Rábago, J.J.; Sánchez-Polo, M.; Rozalen, M.; Cerino-Córdova, F.J.; Loredo-Cancino, M. Photodegradation of antihistamine chlorpheniramine using a novel iron-incorporated carbon material and solar radiation. Environ. Sci. Water Res. Technol. 2020, 6, 2607–2618. [Google Scholar] [CrossRef]
  24. Fernández-Perales, M.; Rozalen, M.; Sánchez-Polo, M.; Rivera-Utrilla, J.; López-Ramón, M.V.; Álvarez, M.A. Solar degradation of sulfamethazine using rGO/Bi composite photocatalysts. Catalysts 2020, 10, 573. [Google Scholar] [CrossRef]
  25. Liu, Y.; Mekic, M.; Carena, L.; Vione, D.; Gligorovski, S.; Zhang, G.; Jin, B. Tracking photodegradation products and bond-cleavage reaction pathways of triclosan using ultra-high resolution mass spectrometry and stable carbon isotope analysis. Environ. Pollut. 2020, 264, 114673. [Google Scholar] [CrossRef] [PubMed]
  26. Li, X.; Yuan, Z.; Huang, Z.; Koso, A.; Li, J.; Xie, B.; Ni, Z.; Xia, S. The photodegradation property and mechanism of tetracycline by persulfate radical activated In2O3@ LDHs Z−scheme heterojunction. Sep. Purif. Technol. 2022, 302, 122077. [Google Scholar] [CrossRef]
  27. House, D.A. Kinetics and mechanism of oxidations by peroxydisulfate. Chem. Rev. 1962, 62, 185–203. [Google Scholar] [CrossRef]
  28. Honarmandrad, Z.; Sun, X.; Wang, Z.; Naushad, M.; Boczkaj, G. Activated persulfate and peroxymonosulfate based advanced oxidation processes (AOPs) for antibiotics degradation–A review. Water Resour. Ind. 2023, 29, 100194. [Google Scholar] [CrossRef]
  29. Zhou, Z.; Liu, X.; Sun, K.; Lin, C.; Ma, J.; He, M.; Ouyang, W. Persulfate-based advanced oxidation processes (AOPs) for organic-contaminated soil remediation: A review. Chem. Eng. J. 2019, 372, 836–851. [Google Scholar] [CrossRef]
  30. Khan, I.; Liu, W.; Zada, A.; Raziq, F.; Ali, S.; Shah, M.I.A.; Ateeq, M.; Khan, M.; Alei, D.; Fazil, P. Recent progress in emerging materials and hybrid nanocomposites for peroxymonosulfate and peroxydisulfate activation towards solar light-driven photocatalytic degradation of emerging pollutants. Coord. Chem. Rev. 2024, 499, 215466. [Google Scholar] [CrossRef]
  31. Conte, L.O.; Cotillas, S.; Lorenzo, D.; Bahamonde, A.; Santos, A. Solar-assisted oxidation of organochlorine pesticides in groundwater using persulfate and ferrioxalate. Environ. Pollut. 2024, 343, 123205. [Google Scholar] [CrossRef]
  32. Türk, O.K.; Adalar, G.; Yazici Guvenc, S.; Can-Güven, E.; Varank, G.; Demir, A. Photodegradation of oxytetracycline by UV-assisted persulfate and percarbonate processes: Kinetics, influencing factors, anion effect, and radical species. Environ. Sci. Pollut. Res. 2023, 30, 869–883. [Google Scholar] [CrossRef]
  33. Xu, Z.; Liu, Z.; Li, S.; Li, F.; Gao, P.; Wang, S.; Lin, Y.; Xiong, G.; Li, Z.; Peng, H. Degradation of triclosan by peroxydisulfate/peroxomonosulfate binary oxidants activation under thermal conditions: Efficiency and mechanism. J. Environ. Manag. 2024, 354, 120211. [Google Scholar] [CrossRef]
  34. Wang, L.; Feng, J.; Chen, Q.; Jiang, H.; Zhao, J.; Chang, Z.; He, X.; Li, F.; Pan, B. Inhibition mechanisms of biochar-derived dissolved organic matter to triclosan photodegradation: A remarkable role of aliphatics. Environ. Pollut. 2024, 342, 123056. [Google Scholar] [CrossRef]
  35. Nfodzo, P.; Choi, H. Triclosan decomposition by sulfate radicals: Effects of oxidant and metal doses. Chem. Eng. J. 2011, 174, 629–634. [Google Scholar] [CrossRef]
  36. Son, H.S.; Khim, J.; Zoh, K.D. Degradation of triclosan in the combined reaction of Fe2+ and UV-C: Comparison with the Fenton and photolytic reactions. Environ. Prog. Sustain. Energy 2010, 29, 415–420. [Google Scholar] [CrossRef]
  37. Wu, C.; Zhou, J.; Pang, S.; Yang, L.; Li, X.; Lichtfouse, E.; Xia, S.; Liu, H. Enhanced removal of 2, 4-dichlorophenol by coupling of Pd nanoparticles with biofilm. J. Environ. Chem. Eng. 2024, 12, 112176. [Google Scholar] [CrossRef]
  38. Iovino, P.; Chianese, S.; Prisciandaro, M.; Musmarra, D. Triclosan photolysis: Operating condition study and photo-oxidation pathway. Chem. Eng. J. 2019, 377, 121045. [Google Scholar] [CrossRef]
  39. Orhon, K.B.; Orhon, A.K.; Dilek, F.B.; Yetis, U. Triclosan removal from surface water by ozonation—Kinetics and by-products formation. J. Environ. Manag. 2017, 204, 327–336. [Google Scholar] [CrossRef]
  40. Canosa, P.; Morales, S.; Rodríguez, I.; Rubí, E.; Cela, R.; Gómez, M. Aquatic degradation of triclosan and formation of toxic chlorophenols in presence of low concentrations of free chlorine. Anal. Bioanal. Chem. 2005, 383, 1119–1126. [Google Scholar] [CrossRef]
Figure 1. Response surface of the TCS percentage of degradation changing treatment time and irradiance.
Separations 11 00131 g001
Figure 2. Effect of the initial concentration of TCS at 25 °C on UV-C and solar photodegradation. Lines represent the second-order kinetic curves.
Separations 11 00131 g002
Figure 3. Photodegradation kinetic curves of TCS in (a) UV-C/S2O82− and (b) sunlight/S2O82− systems. [TCS]0 = 60 mg L−1; pH = 7.
Separations 11 00131 g003
Figure 4. Absorption spectrum of 2,4-DCP (60 mg L−1).
Separations 11 00131 g004
Figure 5. Concentration of 2,4-DCP obtained as a byproduct of direct photolysis of TCS (10 mg L−1) with UV-C light.
Separations 11 00131 g005
Figure 6. Gas chromatogram of TCS (10 mg L−1) irradiated with UV-C light at 254 nm for 5 min.
Separations 11 00131 g006
Figure 7. HPLC chromatograms of TCS irradiated with simulated solar light for (a) 30 min and (b) 4 h.
Separations 11 00131 g007
Figure 8. Possible photodegradation pathways of TCS with UV-C light.
Separations 11 00131 g008
Figure 9. Possible photodegradation pathways of TCS with simulated solar irradiation.
Separations 11 00131 g009
Table 1. Experimental design (RSM) for the TCS degradation using simulated solar irradiation.
Exp.Time (h)Irradiance (W m−2)%Deg
1245070.6
2645075.1
3445075.2
4260050.5
5630051.5
6260050.1
7230025.4
8660075.1
9460074.8
10630051.4
11430070.2
12660074.0
Table 2. Optimization parameters for the TCS percentage of degradation.
ParameterValue
Max %Deg (experimental)75.2
Max %Deg (model)79.4
Time (h)2
Irradiance (W m−2)450
Deviation (%)5.6
Table 3. Kinetic parameters for the degradation of TCS at 25 °C.
UV-C DegradationSolar Degradation
C T C S 0
(mg L−1)
k T C S 1 × 10 5 (s−1)R2 k T C S 2 × 10 5
(L mg−1 s−1)
R2
(%)
ΦTCS   ×   10 3
(mol Einstein−1)
k T C S 1 × 10 6
(s−1)
R2
(%)
k T C S 2 × 10 5
(L mg−1 s−1)
R2ΦTCS   ×   10 3
(mol Einstein−1)
1014560.874594000.999039535420.75258100.9995341
201480.85148500.98943581520.8525300.989913
30500.88992300.999497630.8936130.98955.5
40220.91151400.999659150.887750.99742
602.50.9417160.9973760.79991.50.99890.6
Disclaimer/Publisher’s Note: The statements, opinions and data contained in all publications are solely those of the individual author(s) and contributor(s) and not of MDPI and/or the editor(s). MDPI and/or the editor(s) disclaim responsibility for any injury to people or property resulting from any ideas, methods, instructions or products referred to in the content.

