Article

Determination of Trans-Anethole in Essential Oil, Methanolic Extract and Commercial Formulations of Foeniculum vulgare Mill Using a Green RP-HPTLC-Densitometry Method

1
Department of Pharmacognosy, College of Pharmacy, Prince Sattam Bin Abdulaziz University, Al-Kharj 11942, Saudi Arabia
2
Department of Pharmaceutics, College of Pharmacy, King Saud University, Riyadh 11451, Saudi Arabia
*
Author to whom correspondence should be addressed.
Submission received: 1 September 2020 / Revised: 14 September 2020 / Accepted: 28 September 2020 / Published: 29 September 2020
(This article belongs to the Special Issue Current Trends in Chromatography for Bioanalytical Applications)

Abstract

:
Due to the lack of ecofriendly/green reversed-phase high-performance thin-layer chromatography (RP-HPTLC) methods for trans-anethole (TAL) and its simplicity over routine analytical techniques, there was a necessity to establish a suitable HPTLC methodology for the quantitative analysis of TAL. Therefore, the first objective of this research was to develop an accurate, rapid and green RP-HPTLC densitometry methodology for the quantitative analysis of TAL in essential oil, traditional and ultrasound-assisted extracts of Foeniculum vulgare Mill and commercial formulations. The second objective was to compare the traditional method of extraction of TAL with its ultrasound-assisted method of extraction. The chromatogram of TAL from essential oil and traditional and ultrasound-assisted extracts of fennel and commercial formulations was verified by recoding its single spectra at Rf = 0.31 ± 0.01 in comparison to standard TAL. The proposed analytical methodology has been found to be superior in terms of linearity, accuracy and precision compared to most of the reported analytical methods for TAL analysis. The amount of TAL in the essential oil of fennel was recorded as 8.82 mg per g of oil. The content of TAL in traditional extracts of fennel, formulation 1 (dietary supplement 1) and formulation 2 (dietary supplement 2), was recorded as 6.44, 4.88 and 4.48 mg per g, respectively. The amount of TAL in ultrasound-assisted extracts of fennel, formulation 1 and formulation 2, was recorded as 8.34, 6.46 and 5.81 mg per g, respectively. The ultrasound method of extraction of TAL was found to be better than the traditional method of extraction. The results of validation studies and phytochemical analysis showed that the proposed methodology could be efficiently utilized for the quantification of TAL in the wide range of products having TAL as a component.

1. Introduction

Fennel (Foeniculum vulgare Mill; family: Apicaceae) is a biennial or perennial medicinal herb [1]. The main components of fennel seeds are essential oils which are important flavoring agents [1,2,3]. Various therapeutic activities in essential oils of fennel, such as “antioxidant [4,5,6,7], anti-inflammatory [7], analgesic [7], hepatoprotective [8], diuretic [2], antimicrobial [9], antibacterial [2,10,11], antifungal [12], antidiabetic [13], neuroprotective [14] and anti-tumor activities [15],” have been reported in the literature. Several analytical methods have been reported for the identification of the different chemical constituents of the essential oils of fennel [1,2,3,16,17,18,19,20,21,22]. Some chemical constituents like trans-anethole (TAL), fenchone, α-pinene, β-pinene and camphene have been reported as the biomarker compounds of the essential oils of fennel [1,2,3,20,21,22]. Gas chromatography–mass spectrometry (GC–MS) studies have revealed that TAL is the most abundant component of fennel essential oils [3]. TAL is a monoterpene which is isolated from the essentials oils of various plants such as fennel, tarragon and basil [23].
Some high-performance liquid chromatography (HPLC) methods have been utilized for the estimation of TAL either alone or in combination with other components of plant extracts [24,25,26]. HPLC methods have also been reported in the estimation of TAL in rat plasma, human plasma and human urine [26,27,28]. Various GC methods with different detectors were also utilized in the estimation of TAL in different plant-based products [29,30,31,32,33,34]. The nuclear magnetic resonance spectroscopy method has also been used for the quantitative analysis of TAL in fennel and anise seed essential oils [32]. The GC–MS technique was also utilized for the quantification of TAL in serum samples [35]. The liquid chromatography–mass spectrometry (LC–MS) method was also utilized for the quantitative analysis of TAL in combination with other components of plant extracts [36]. The differential pulse voltammetry technique was also utilized for the quantitative analysis of TAL in various herbal matrices [37]. A single high-performance thin layer chromatography (HPTLC) technique was utilized for the quantitative analysis of TAL in fennel essential oil, methanolic extract of fennel and various commercial formulations [38]. Although several analytical methods have been reported for the quantitative analysis of TAL in plant extracts, green analytical techniques for the quantitative analysis of TAL are scarce in the literature. In addition, the literature’s HPTLC method also used a toxic solvent system in the analysis of TAL [38].
Based on the published reports in the literature, it was concluded that green HPTLC techniques are not available for the quantitation of TAL. The unavailability of green analytical methodologies for the quantitative analysis of TAL creates the necessity for developing a new reversed-phase high-performance thin-layer chromatography (RP-HPTLC) method for its quantitative analysis. In addition, the green RP-HPTLC techniques showed several benefits compared to routine HPLC techniques, including low cost, high speed of analysis, being nontoxic to the environment, avoiding the interference of impurities and detection clarity [39,40,41,42]. Therefore, the first objective of this research was to develop and validate a green RP-HPTLC technique for the quantitative analysis of TAL in fennel essential oil, traditional and ultrasound-assisted extracts of fennel and commercial formulations. The second objective was to compare the traditional method of extraction of TAL with its ultrasound-assisted method of extraction. The green RP-HPTLC technique for the quantitative analysis of TAL was validated for various validation parameters by following the International Conference on Harmonization (ICH) Q2 (R1) guidelines [43].

2. Materials and Methods

2.1. Materials

Standard TAL was procured from Sigma Aldrich (St. Louis, MO, USA). Chromatography grade methanol and ethanol (EtOH) were procured from E-Merck (Darmstadt, Germany). Fennel seeds were purchased from a local market in Al-Kharj, Saudi Arabia. The specimen seeds were identified with a voucher specimen repository available at Prince Sattam bin Abdulaziz University, Al Kharj, Saudi Arabia. Two different dietary supplement formulations (formulations 1 and 2), which are used in the treatment of infants and nursing children suffering from colic and dyspeptic disease, as a digestive aid to treat upper respiratory infections, coughs and sore throat, were purchased from a local market in Riyadh, Saudi Arabia. Chromatography-grade water (H2O) was obtained from the Milli-Q apparatus. All the solvents used were of HPLC grades and reagents were of analytical grades.

2.2. Chromatographic Conditions and Instrumentation

The quantitative analysis of TAL in standard TAL, fennel essential oils and traditional and ultrasound-assisted extracts of fennel seeds and commercial formulations was carried out using an HPTLC CAMAG TLC system (CAMAG, Muttenz, Switzerland). The quantitative analysis of TAL was conducted on 10 × 20 cm glass backed plates pre-coated with RP silica gel 60 F254S plates (E-Merck, Darmstadt, Germany). The samples were spotted as 6 mm bands using a CAMAG Automatic TLC Sampler 4 (ATS4) sample applicator (Geneva, Muttenz, Switzerland) which was fitted with a CAMAG microliter syringe (Hamilton, Bonaduz, Switzerland). The application rate for the quantitative analysis of TAL was fixed at 150 nL/s. The gas used for the sample application was nitrogen. The linear ascending development of HPTLC plates at a distance of 80 mm was performed using a binary composition of EtOH:H2O (7.5:2.5 v/v) as mobile phase in a CAMAG automatic developing chamber 2 (ADC2) (CAMAG, Muttenz, Switzerland). The developing chamber was saturated previously with a binary composition of EtOH:H2O (7.5:2.5 v/v) for 30 min at an ambient temperature (22 °C). The RP-HPTLC scanning was conducted at the wavelength (λmax) = 262 nm. The slit dimensions and scanning rate were kept at 4 × 0.45 mm and 20 mm/s, respectively. Each quantification was carried out in three different replicates (n = 3). The software utilized for data analysis was WinCAT’s (version 1.4.3.6336, CAMAG, Muttenz, Switzerland).

2.3. Calibration Curve of TAL

First, the stock solution (SS) of TAL was obtained by dispensing 10 mg of TAL in 10 mL of methanol. Around 1 mL of SS of TAL was diluted further with a binary composition of EtOH:H2O (7.5:2.5 v/v) to get the final SS of 100 μg/mL. Serial dilutions of SS of TAL were prepared by taking different volumes of TAL SS and diluting with EtOH:H2O (7.5:2.5 v/v) to get the concentrations in the range of 50–1000 ng/band. The SS of TAL was obtained in six replicates (n = 6). The same volume of each concentration of TAL was applied onto HPTLC plates and the peak area for each concentration was measured. The calibration curve (CC) of TAL was generated by plotting the concentrations against the measured area of TAL. The CC of the TAL was constructed for six replicates (n = 6).

2.4. Isolation of the Essential Oil from Foeniculum vulgare Mill Seeds

The essential oil of fennel seeds was obtained by a hydro-distillation method according to the standard method of Egyptian Pharmacopoeia. Around 200 g of fennel seeds were used for essential oil extraction under a Clevenger trap apparatus. The specified amount of fennel seeds was mixed with 1000 mL of water for 8 h distillations. The oil layer and water separation were trapped with dichloromethane (3 × 50 mL). Further, the organic layer was concentrated under a rotary vacuum evaporator in order to obtain the pure essential oil.

2.5. Traditional Extraction of TAL from Fennel Seeds

About 10 g of fennel seeds were taken and triturated to get the fine powder. The fine powder of fennel seeds was refluxed with 100 mL of methanol for about 1 h in a water bath. The contents were filtered and the marc left was refluxed further with 70 mL of methanol for 1 h and filtered again. Methanol was evaporated under a rotary vacuum evaporator. The residue obtained was reconstituted in 50 mL methanol. This procedure was repeated three times (n = 3). The obtained solution was used as a test solution for the quantitative analysis of TAL in the traditional methanolic extract of fennel seeds.

2.6. Traditional Extraction of TAL from Commercial Formulations (Dietary Supplements)

TAL was determined in two different commercial formulations (dietary supplements). Commercial formulations 1 and 2 were triturated to get the fine powder. Approximately 5 g of each formulation was refluxed with 100 mL of methanol for about 1 h in water bath. The contents were filtered and the marc left was refluxed further with 70 mL of methanol for 1 h and filtered again. Methanol was evaporated under a rotary vacuum evaporator. The residue obtained was reconstituted in 25 mL methanol. This extraction was repeated three times (n = 3). These solutions were used as test solutions for the quantitative analysis of TAL in commercial dietary supplement formulations.

2.7. Ultrasound-Assisted Extraction of TAL from Fennel Seeds

The ultrasound-assisted extraction of TAL from the fennel seeds was conducted under ultrasonic vibrations using an ultrasonicator. Approximately 10 g of finely powdered fennel seeds was extracted with 100 mL of methanol. Methanol was evaporated under a rotary vacuum evaporator. The residue obtained was reconstituted with 50 mL of methanol. The residue solution was ultrasonicated at 50 °C for about 1 h. This extraction was carried out three times (n = 3). The obtained solution was utilized as a test solution for the quantitative analysis of TAL in the ultrasound-assisted methanolic extract of fennel seeds.

2.8. Ultrasound-Assisted Extraction of TAL from Commercial Formulations (Dietary Supplements)

For the analysis of TAL in commercial dietary supplements, both formulations were powdered using a glass pestle and mortar. Around 5 g of each commercial formulation was taken in a beaker separately and mixed vigorously to get a homogenous mixture. Both formulations were ultrasonicated at 50 °C for about 1 h with 70 mL of methanol and filtered. The filtrates were combined and concentrated under a rotary vacuum evaporator to a final volume of 25 mL. Each extraction was carried out three times (n = 3). These solutions were utilized as test solutions for the quantitative analysis of TAL in ultrasound-assisted extracts of commercial dietary formulations.

2.9. Method Validation

The proposed analytical methodology for the quantitative analysis of TAL was validated for different validation parameters according to the ICH Q2 (R1) guidance [43]. The linearity range of TAL was estimated by plotting the concentration of TAL on an x-axis and its peak area on a y-axis. The linearity of TAL was determined in the range of 50–1000 ng/band in six replicates (n = 6). The method accuracy of TAL was estimated as the percent of recovery (% recovery) by adopting the standard addition method. In this method, the previously quantified solution of TAL (100 ng/band) was spiked with an extra 0–150% content of TAL. The obtained concentrations of 100, 150, 200 and 250 ng/band of TAL were re-quantified by applying the proposed technique (n = 6). The % recovery was estimated at each concentration of TAL.
The method precision for TAL was calculated as intra-day and inter-day precision. Intra-day precision for TAL was estimated by the quantification of samples on the same day at 100, 150, 200 and 250 ng/band concentrations in six replicates (n = 6). Meanwhile, inter-day precision for TAL was evaluated by the estimation of 100, 150, 200 and 250 ng/band concentrations on three different days in six replicates (n = 6).
The method robustness for TAL was studied by introducing some minor changes in the mobile phase components during TAL quantification. The original mobile phase components of EtOH:H2O (7.5:2.5) were changed into EtOH:H2O (7.7:2.3) and EtOH:H2O (7.3:2.7) for robustness evaluation. The robustness for TAL was obtained in six different replicates (n = 6)
The method sensitivity for TAL was estimated as the detection (LOD) and quantification (LOQ) limits using the standard deviation (SD) technique. The LOD and LOQ of TAL were estimated in six replicates (n = 6) using their standard formulae reported in literature [38,39].
The method specificity for TAL was determined by comparing the retardation factor (Rf) values and ultraviolet (UV)-absorption spectra of TAL in essential oil, traditional and ultrasound-assisted extracts of fennel and commercial formulations with that of standard TAL.

2.10. Quantitative Analysis of TAL in Essential Oil and Traditional and Ultrasound-Assisted Extracts of Fennel and Commercial Formulations

The obtained samples of essential oil and traditional and ultrasound-assisted extracts of fennel seeds and commercial formulations were applied on RP-HPTLC plates and a chromatogram of each sample was obtained under the same experimental conditions as described for the quantitative analysis of standard TAL. The peak area of TAL in all test samples was recorded and compared (n = 3). The amount of TAL in each sample was calculated using the CC of TAL.

2.11. Statistical Evaluation

All the values are represented as mean ± SD (n = 3 or n = 6). The statistical evaluation was performed by applying Dunnett’s test using the GraphPad Prism software (version 6, GraphPad, San Diego, CA, USA). Each statistical evaluation was conducted at a 5% level of significance.

3. Results and Discussion

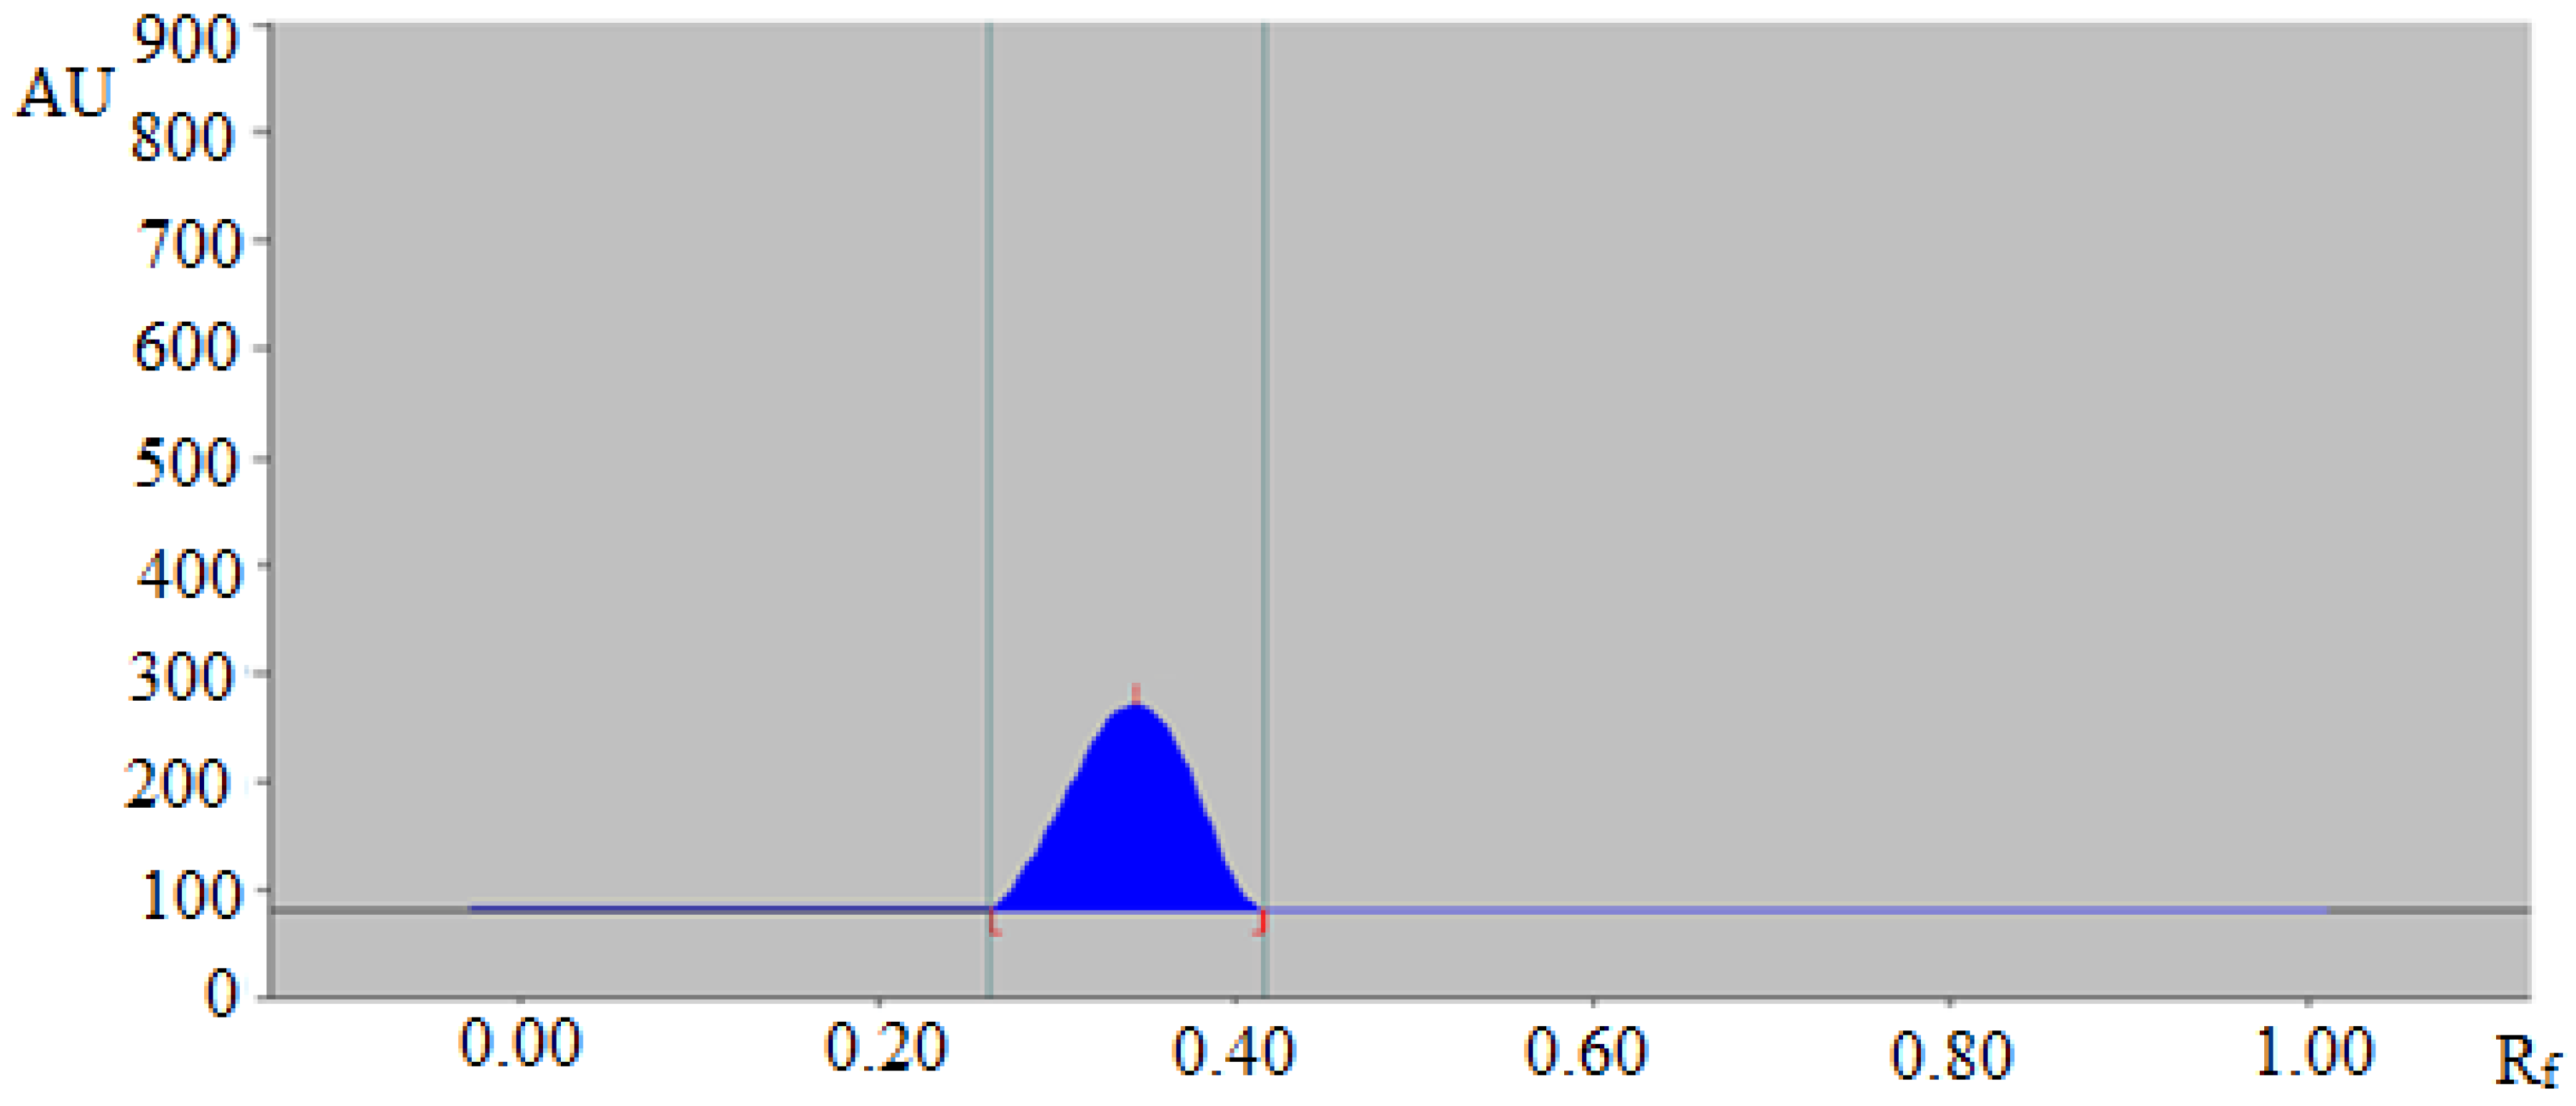
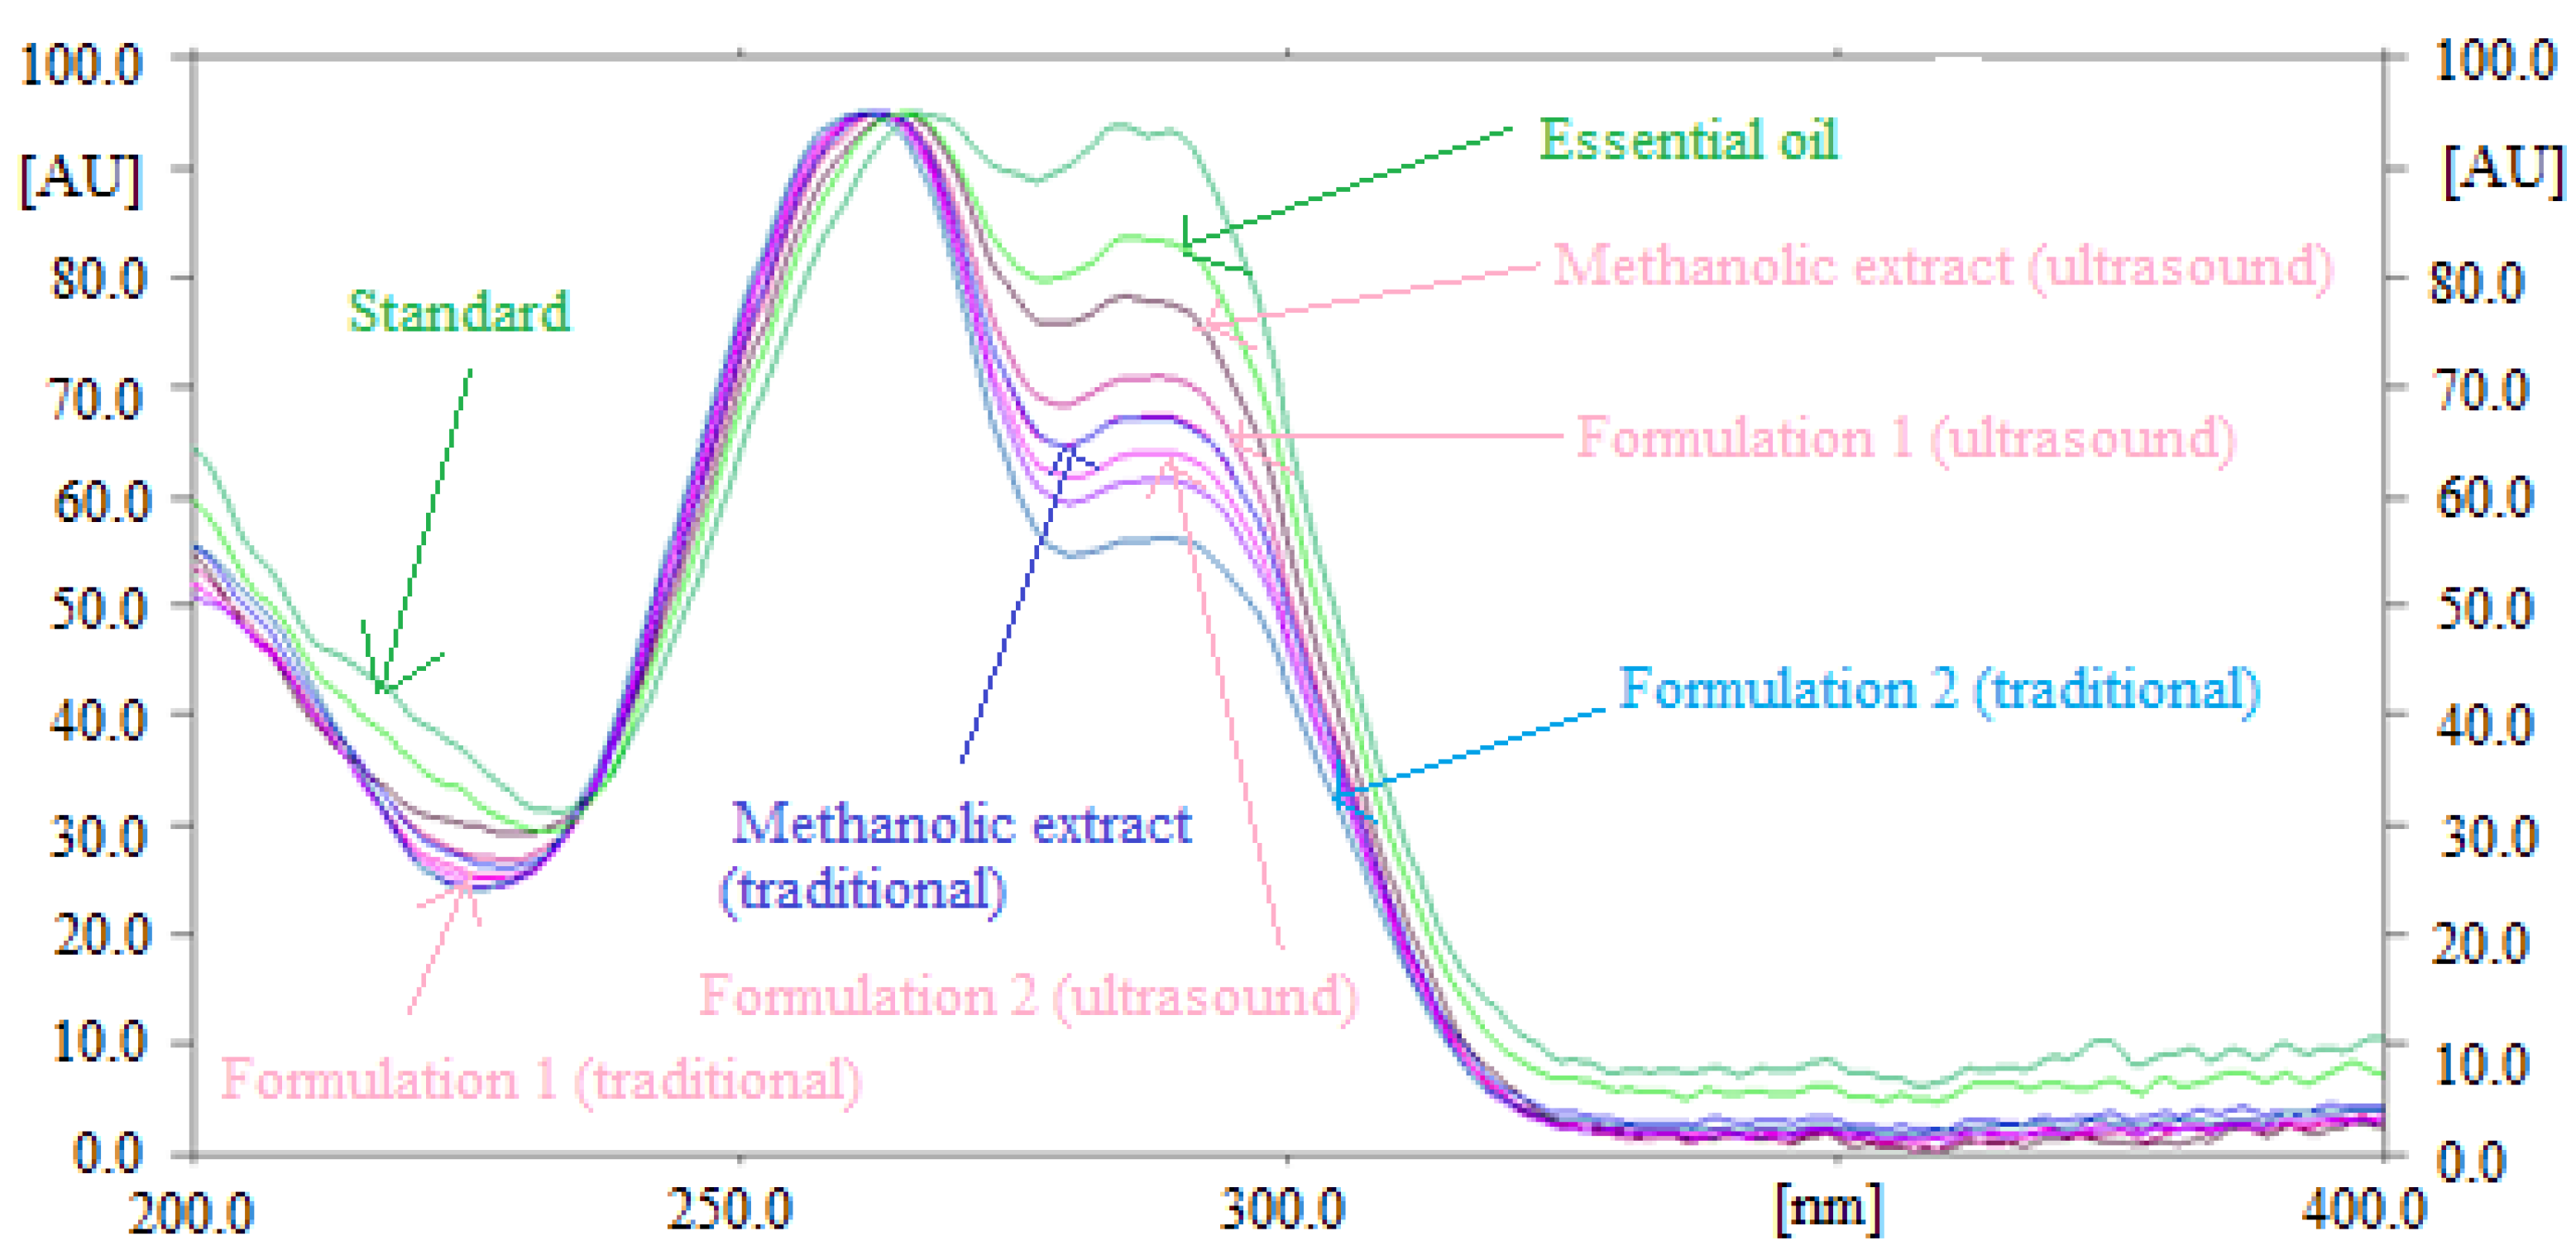
3.1. Method Development

An exhaustive literature search revealed no green RP-HPTLC technique for the quantitative analysis of TAL in plant extracts and commercial formulations. Therefore, this research was conducted to develop and validate a green RP-HPTLC technique for the quantitative analysis of TAL. The utility of RP-HPTLC techniques presented several advantages over normal phase HPTLC techniques [40,41]. Moreover, a green RP-HPTLC technique for the quantitative analysis of TAL could also avoid the chances of environmental toxicity [41,42].
In this work, several combinations of EtOH and H2O like 6:4 (%, v/v), 7:3 (%, v/v), 8:2 (%, v/v) and 7.5:2.5 (%, v/v) were evaluated as the mobile phases for the development of a suitable RP-HPTLC method for the quantitative analysis of TAL. From the results recorded, it was observed that the binary combination of EtOH and H2O like 6:4 (%, v/v), 7:3 (%, v/v) and 8:2 (%, v/v) offered poor densitometry peaks of TAL with a poor asymmetry factor. However, when the binary combination of EtOH and H2O like 7.5:2.5 (%, v/v) was studied, it was observed that this composition offered a well-resolved, symmetrical and compact densitometric peak of TAL at Rf = 0.31 ± 0.01 (Figure 1). Hence, the binary composition of EtOH:H2O (7.5:2.5 v/v) was selected as the green mobile phase for the quantitative analysis of TAL in fennel essential oil and traditional and ultrasound-assisted extracts of fennel and commercial formulations. The band spectra for TAL were recorded and a maximum response was recorded at λmax = 262 nm for TAL. Therefore, all quantifications of TAL were conducted at λmax = 262 nm.

3.2. Method Validation

Several validation parameters for the quantitative analysis of TAL were studied according to ICH recommendations [43]. The resulting data for linear regression analysis of the CC of TAL are tabulated in Table 1.
The CC of TAL was found to be linear in the range of 50–1000 ng/band. The results of regression analysis indicated a good linear relationship between the concentration and peak area of TAL. The determination coefficient (R2) value for TAL was estimated as 0.9995. The regressed R2 value for TAL was significant (p < 0.05). These results suggested that the proposed green analytical methodology was linear for the quantitative analysis of TAL.
The method accuracy for TAL was determined as % recovery and the results are listed in Table 2.
The percentages of recovery of TAL after spiking an extra 0–150% were recorded as 98.41–101.13% using the proposed analytical methodology. The % RSD values for recovery studies of TAL were calculated as 0.95–1.86%. The recorded % recoveries within the limit of 100 ± 2% for TAL indicated that green RP-HPTLC method was accurate for the quantitative analysis of TAL. The method precision for TAL was determined as % RSD and the results are listed in Table 3.
For repeatability, the % RSD values of TAL were recorded as 0.74–1.63%. For intermediate precision, the % RSD values of TAL were estimated as 0.77–1.88%. The estimated % RSD values for TAL within the range of ± 2% indicated that the green RP-HPTLC method was precise for the quantitative analysis of TAL.
Robustness for the TAL quantitative analysis was obtained by introducing minor changes in the mobile phase mixtures and the results are listed in Table 4. The errors in terms of % RSD for TAL after introducing minor changes in the mobile phase mixtures were estimated as 0.76–0.94% in addition to a minor change in Rf values. The lower RSD values and small variations in Rf values showed that the proposed method was robust for the quantitative analysis of TAL.
Method sensitivity for the TAL quantitative analysis was studied in the form of LOD and LOQ and the resulting data are listed in Table 1. The LOD and LOQ for TAL were estimated as 16.85 ± 0.82 and 50.55 ± 2.46 ng/band, respectively. The results of sensitivity suggested that the proposed analytical methodology was sensitive for the quantitative analysis of TAL.
The specificity and the peak purity of the method for quantitative analysis of TAL were determined by comparing the overlaid UV-absorption spectra of TAL in essential oil and traditional and ultrasound-assisted extracts of fennel seeds and commercial formulations with that of standard TAL. The overlaid UV-absorption spectra of standard TAL and TAL in essential oil and traditional and ultrasound-assisted extracts of fennel seeds and commercial formulations are summarized in Figure 2.
The maximum densitometry response of TAL in standard, essential oil and traditional and ultrasound-assisted extracts of fennel seeds and commercial formulations were observed at λmax = 262 nm. The similar UV-absorption spectra, Rf values and λmax of TAL in standard, essential oil and traditional and ultrasound-assisted extracts of fennel seeds and commercial formulations suggested the method’s specificity for the quantitative analysis of TAL.

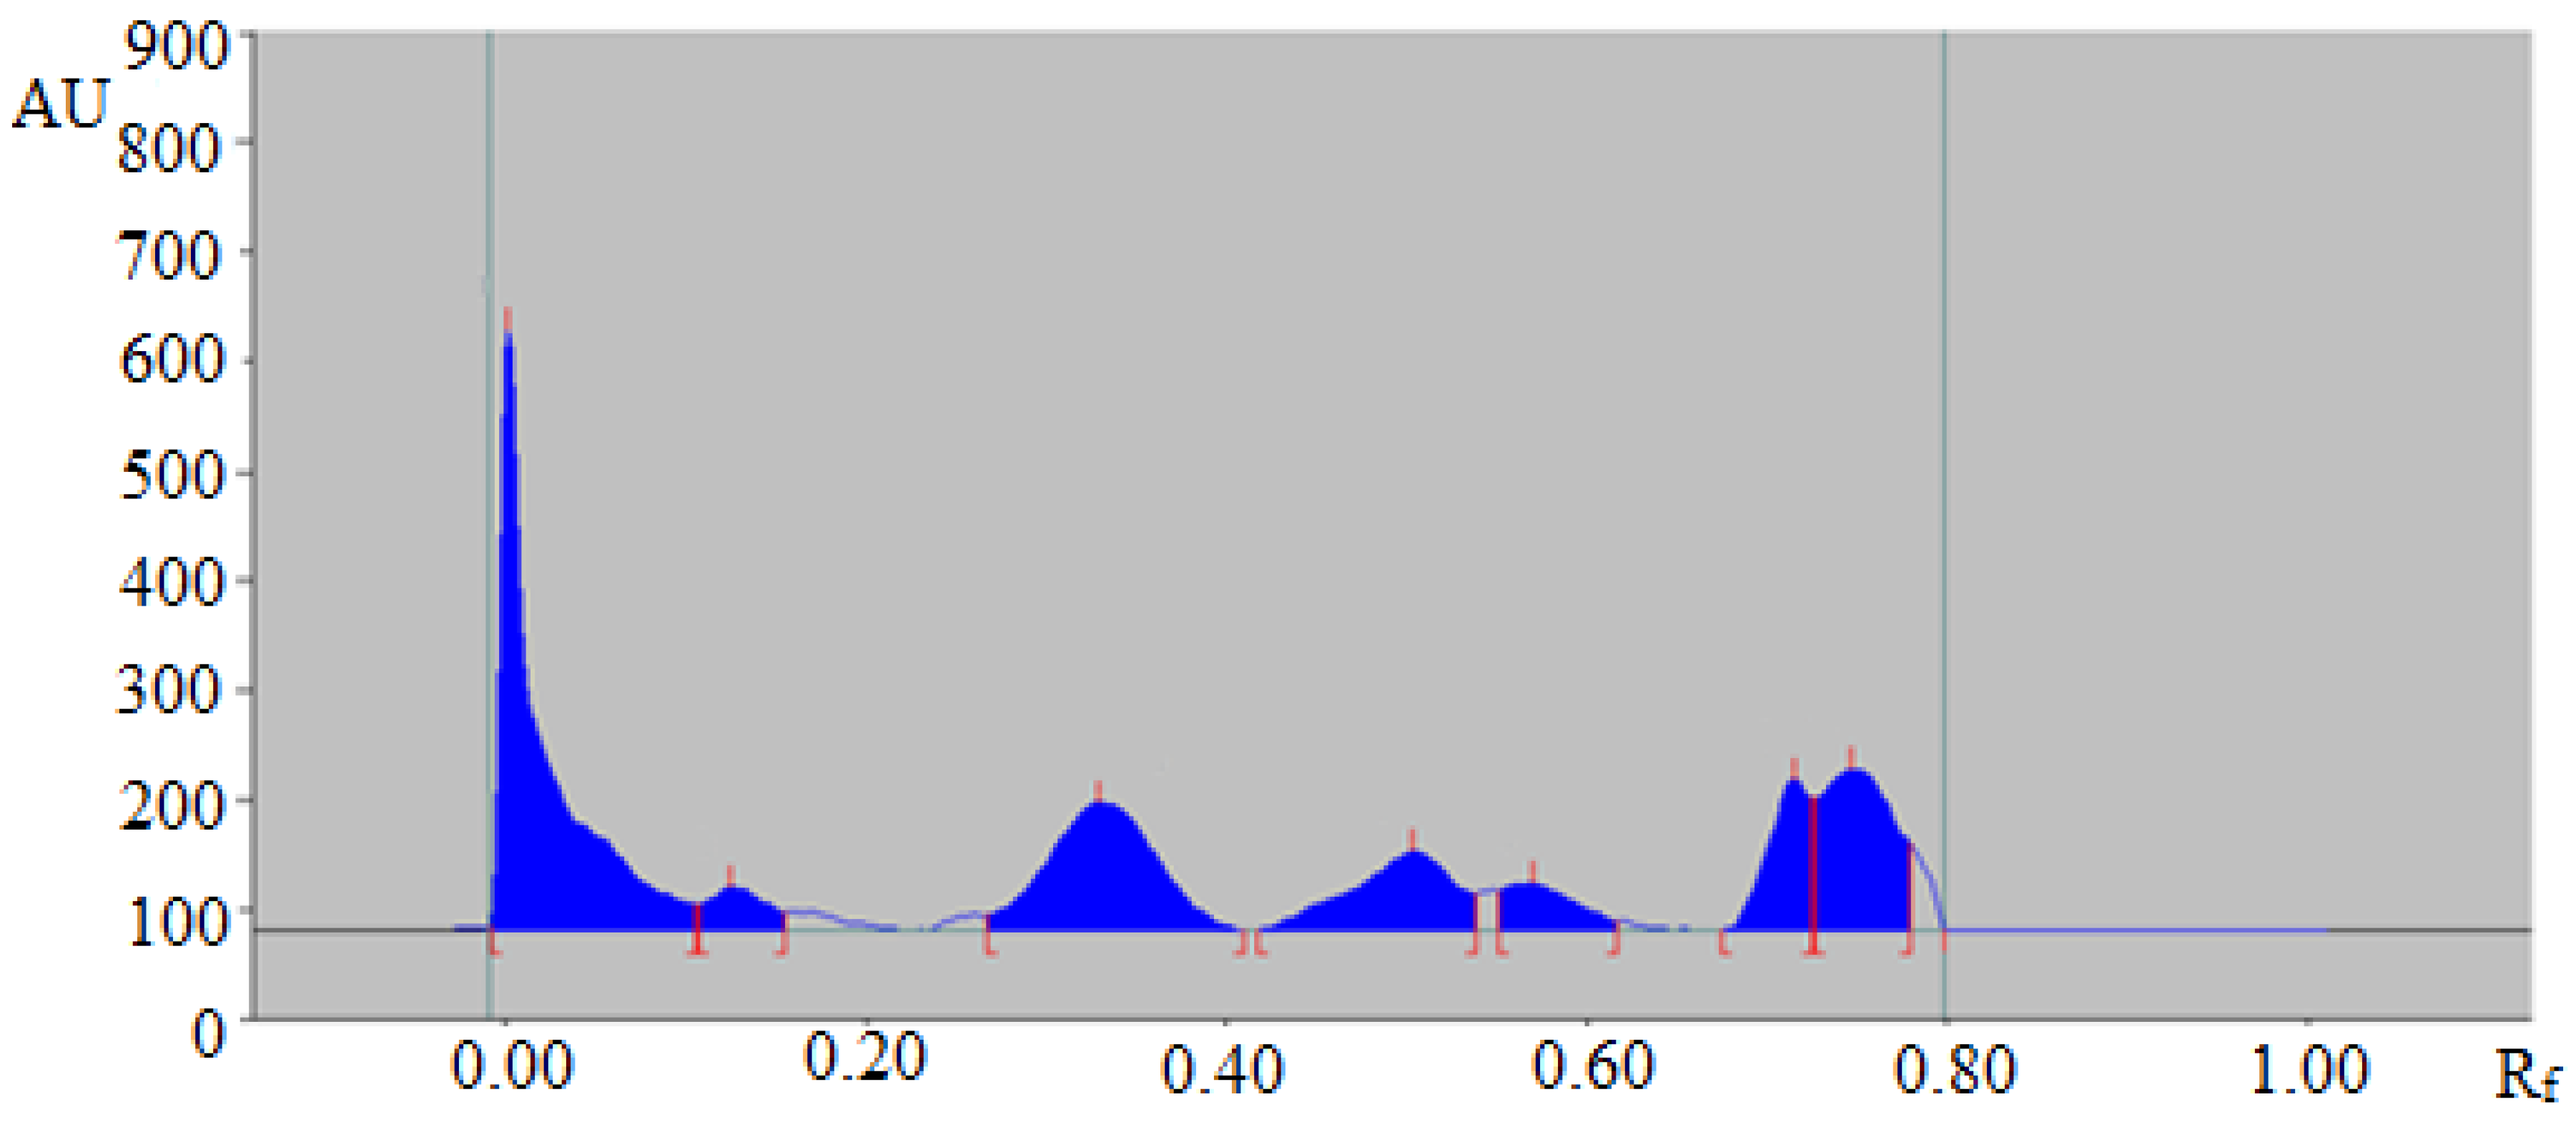
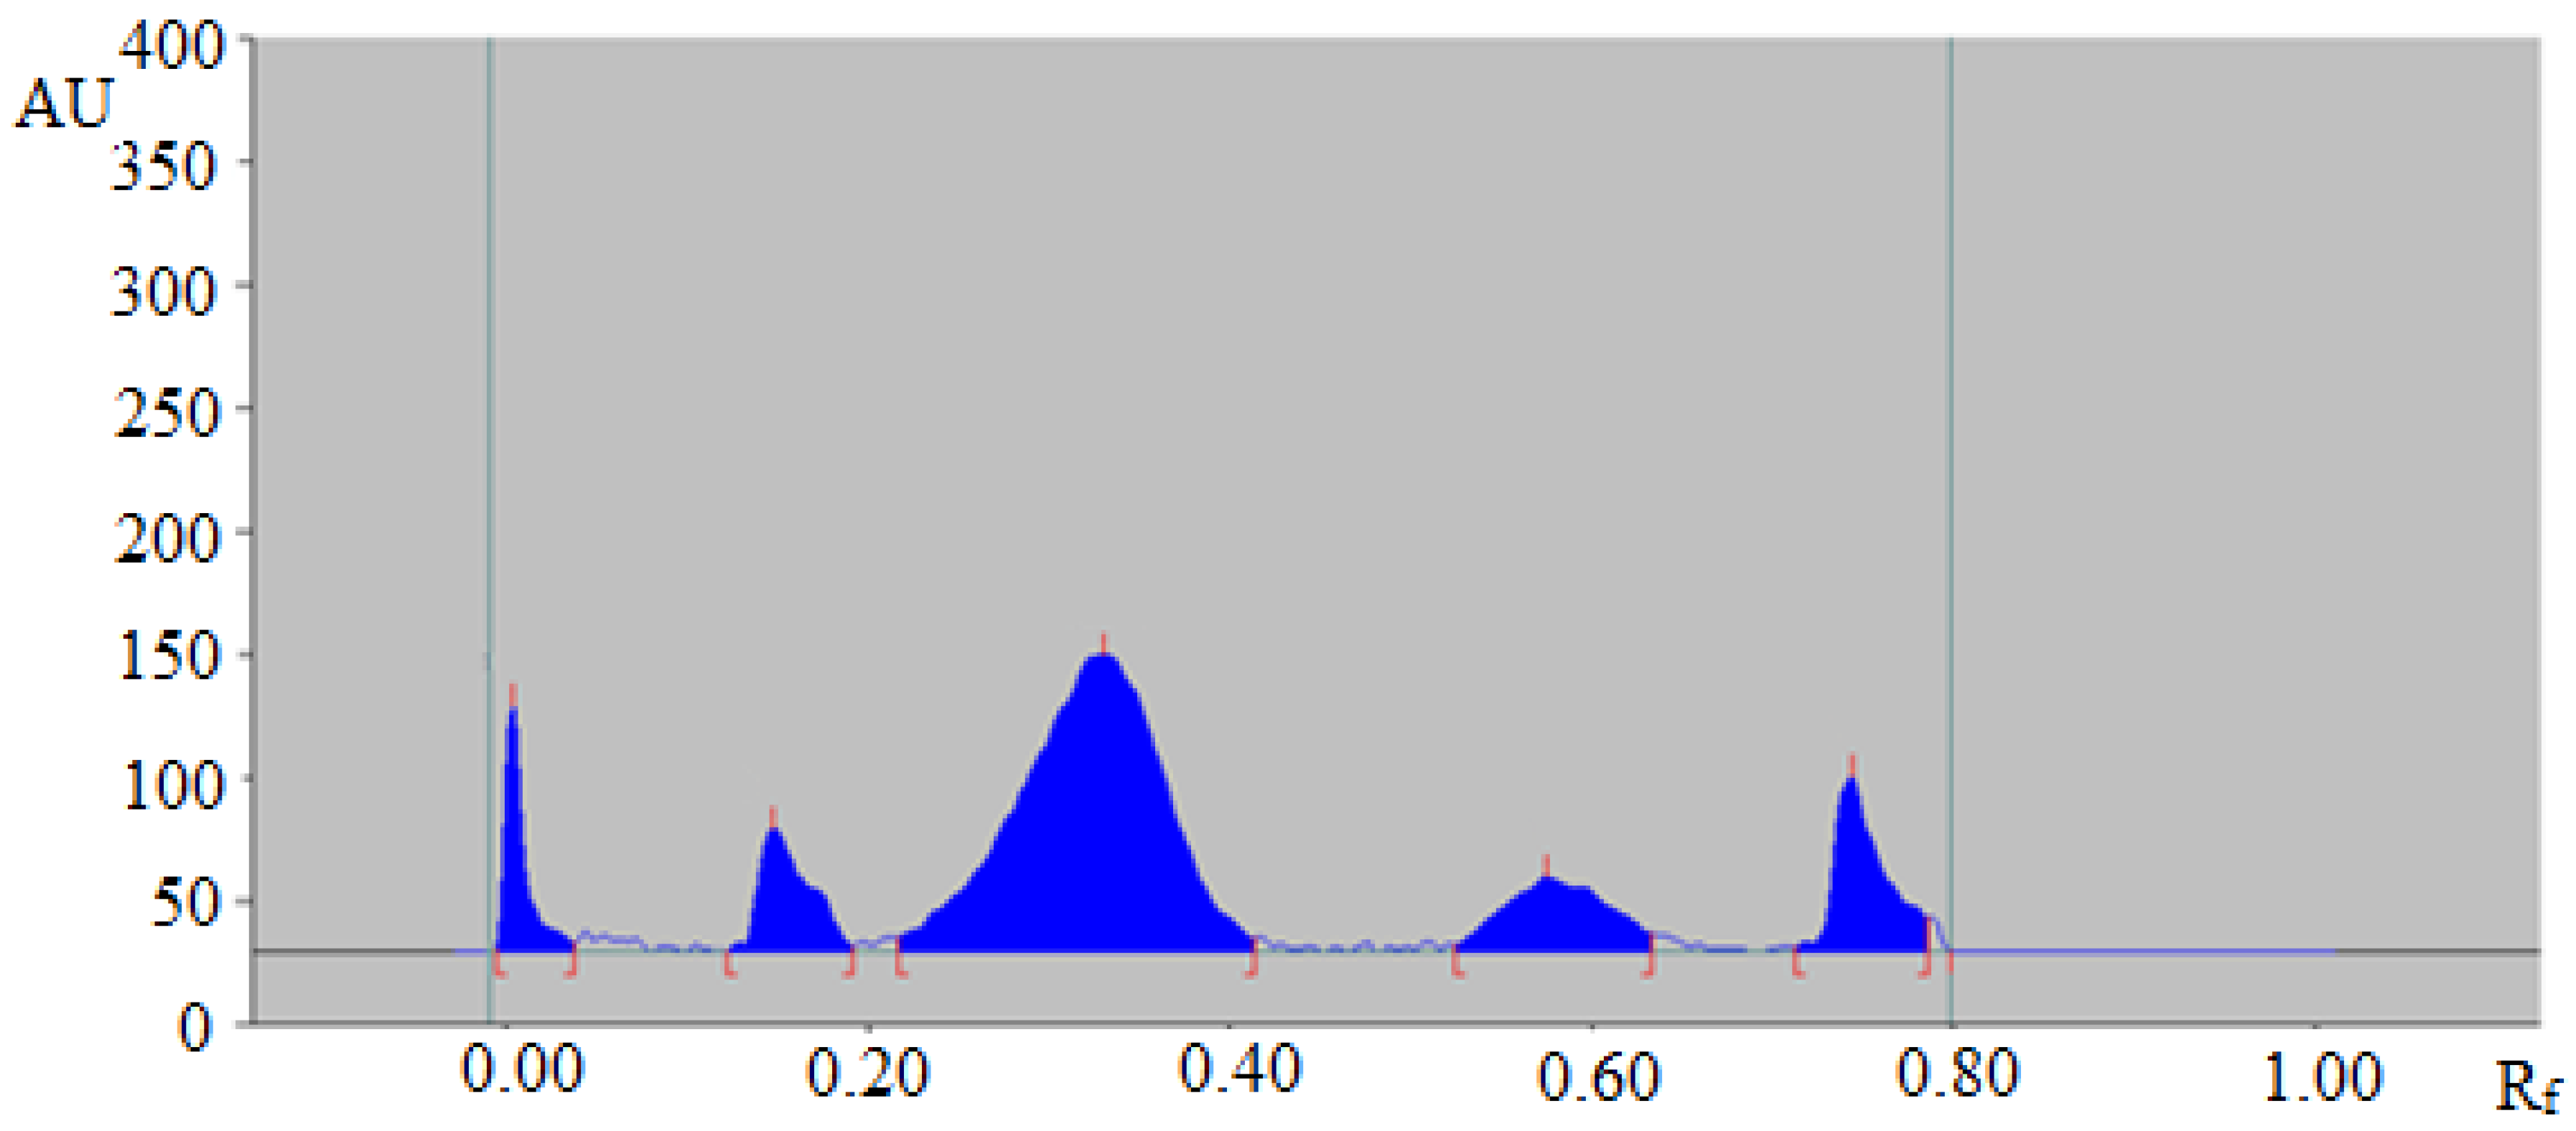
3.3. Quantitative Analysis of TAL in Essential Oil and Traditional and Ultrasound-Assisted Extracts of Fennel and Commercial Formulations

The proposed green RP-HPTLC technique could be utilized as an alternative approach to conventional methods of analysis for the quantitative analysis of TAL in essential oil and traditional and ultrasound-assisted extracts of fennel seeds and commercial formulations. The HPTLC-densitometry peak of TAL from fennel essential oil and traditional and ultrasound-assisted extracts of fennel seeds and commercial formulations was verified by obtaining its single TLC band at Rf = 0.31 ± 0.01 for TAL with that of standard TAL. The HPTLC chromatogram of TAL in traditional methanolic extract of fennel seeds is summarized in Figure 3, which presented a similar peak of TAL with that of standard TAL. Moreover, six additional peaks were also observed in the traditional methanolic extract of fennel seeds.
The representative HPTLC chromatogram of TAL in fennel essential oil is summarized in Figure 4, which also presented a similar peak of TAL to that of standard TAL. In addition, four additional peaks were also observed in fennel essential oil.
The representative HPTLC chromatogram of TAL in a traditional extract of commercial formulation 1 is summarized in Figure 5, which also showed a similar peak of TAL to that of standard TAL. Moreover, six additional peaks were also detected in the traditional extract of commercial formulation 1.
The presence of additional peaks in essential oil and traditional extracts of fennel seeds and commercial formulations indicated that the proposed analytical methodology could be effectively utilized in the quantitative analysis of TAL in the presence of impurities/different compounds.
The content of TAL in essential oil and traditional and ultrasound-assisted extracts of fennel seeds and commercial formulations was calculated using the CC of TAL and the results are summarized in Table 5.
The amount of TAL was found to be highest in fennel essential oil (8.82 ± 0.54 mg/g). The amount of TAL in traditional extracts of fennel seeds, formulation 1 and formulation 2, was recorded as 6.44 ± 0.32, 4.88 ± 0.27 and 4.48 ± 0.24 mg per g, respectively. Alongside this, the content of TAL in ultrasound-assisted extracts of fennel seeds, formulation 1 and formulation 2, was recorded as 8.34 ± 0.48, 6.46 ± 0.35 and 5.81 ± 0.30 mg per g, respectively. It was noted that the amount of TAL was found to be significantly higher in ultrasound-assisted extracts of fennel seeds, formulations 1 and formulations 2, compared with respective traditional extracts (p < 0.05). Based on such observations, the ultrasound technique for the extraction of TAL in fennel seeds and commercial formulations is proposed as better than the traditional method of extraction. Overall, these results indicate that the proposed RP-HPTLC technique could be effectively utilized in the quantitative analysis of TAL in a wide variety of products containing TAL as one of the ingredients.

3.4. Literature Comparison

The current RP-HPTLC technique for the quantitative analysis of TAL was compared with similar analytical methodologies used for the quantification of TAL. The results of the current analytical methodology compared with previously reported methods are summarized in Table 6.
The main validation parameters compared were linearity, accuracy and precision. The linearity range and accuracy of the reported HPLC-UV method for the quantitative analysis of TAL were observed as inferior to those in the present RP-HPTLC method [24]. Alongside this, the precision of the reported HPLC-UV method was observed as being similar to the present RP-HPTLC technique [24]. The accuracy and precision of another HPLC-UV method was also found to be inferior to those of the present RP-HPTLC technique [26]. The precision of the other HPLC-UV technique was also found as out of the ICH recommendation as compared with the present RP-HPTLC method [25]. The linearity, accuracy and precision of a reported normal phase HPTLC-UV technique have been reported as 100–600 ng/band, 98.33–99.30% and 0.34–1.02%, respectively [38]. The accuracy and precision of the reported HPTLC-UV method were within the range of the ICH guidance. Meanwhile, its linearity range was much inferior to the present RP-HPTLC method [38]. The accuracy and precision of the reported GC–flame ionization detector [FID] (GC–FID) method was observed as within the limit of ICH guidelines compared with the present RP-HPTLC method. However, its linearity range was inferior to that of the present RP-HPTLC method [31]. Overall, the present RP-HPTLC method was found reliable and better than the reported analytical methods for the quantitative analysis of TAL.

4. Conclusions

Due to the unavailability of a green RP-HPTLC technique for the quantitative analysis of TAL in the existing literature, the aim of this work was to develop and validate a green RP-HPTLC technique for the quantitative analysis of TAL in fennel essential oil, traditional and ultrasound-assisted extracts of fennel seeds and commercial formulations. The green RP-HPTLC has been found to be rapid, simple, accurate, precise, robust, sensitive and specific for the quantitative analysis of TAL. In general, the amount of TAL was recorded as highest in fennel essential oil. In addition, the amount of TAL obtained was significantly higher in ultrasound-assisted extracts of fennel seeds and commercial formulations as compared with their traditional extracts (p < 0.05). The results of this work suggest that the ultrasound-assisted extraction of TAL is superior over the traditional method of extraction of TAL from fennel seeds and commercial formulations. In conclusion, the results of this work show that the green RP-HPTLC technique could be successfully applied in the quantitative analysis of TAL in the real samples of fennel essential oil, fennel seeds and commercial formulations containing TAL as one of the constituents.

Author Contributions

Conceptualization, supervision—P.A.; Methodology—A.I.F., P.A., H.S.Y., M.H.A., M.A.S. and F.S.; Validation—P.A. and F.S.; Data curation—A.I.F., H.S.Y., M.H.A. and P.A.; Funding acquisition—A.I.F.; Project administration—A.I.F.; Software—P.A., M.H.A. and F.S.; Writing, original draft—F.S.; Writing, review and editing—A.I.F., M.H.A., M.A.S. and P.A. All authors have read and agreed to the published version of the manuscript.

Funding

This project was funded by the Support Research Projects with Global Partnership Program, Deanship of Scientific Research, Prince Sattam Bin Abdulaziz University, Al-Kharj, KSA (Grant No. 2020/03/17097). The article processing charge (APC) was also funded by the Deanship of Scientific Research, Prince Sattam Bin Abdulaziz University, Al-Kharj, KSA.

Acknowledgments

The authors would like to express their gratitude to the Deanship of Scientific Research of Prince Sattam Bin Abdulaziz University, Al-Kharj for their assistance.

Conflicts of Interest

The authors declare that they have no conflict of interests associated with this manuscript.

References

  1. Bahmani, K.; Darbandi, A.I.; Ramshini, H.A.; Moradi, N.; Akbari, A. Agro-morphological and phytochemical diversity of various Iranian fennel landraces. Ind. Crops Prod. 2015, 77, 282–294. [Google Scholar] [CrossRef]
  2. Shahat, A.A.; Ibrahim, A.Y.; Hendawy, S.F.; Omer, E.A.; Hammouda, F.M.; Abdel-Rahman, F.H.; Saleh, M.A. Chemical composition, antimicrobial and antioxidant activities of essential oils from organically cultivated fennel cultivars. Molecules 2011, 16, 1366–1377. [Google Scholar] [CrossRef]
  3. Alam, P.; Abdel-Kader, M.S.; Alqarni, M.H.; Zaatout, H.H.; Ahamad, S.R.; Shakeel, F. Chemical composition of fennel seed extract and determination of fenchone in commercial formulations by GC-MS method. J. Food Sci. Technol. 2019, 56, 2395–2403. [Google Scholar] [CrossRef] [PubMed]
  4. Badgujar, S.M.; Patel, V.V.; Bandivdekar, A.H. Foeniculum vulgare mill: A review of its botany, phytochemistry, pharmacology, contemporary application, and toxicity. Biomed. Res. Int. 2014, 2014, E8426674. [Google Scholar] [CrossRef] [PubMed] [Green Version]
  5. Kontogiorgis, C.; Deligiannidou, G.E.; Hadjipavlou-Litina, D.; Lazari, D.; Papadopoulos, A. Antioxidant protection: The contribution of proper preparation of fennel (Foeniculum vulgare Mill.) beverage. Ind. Crops Prod. 2016, 79, 57–62. [Google Scholar] [CrossRef]
  6. Majdoub, N.; El-Guendouz, S.; Rezgui, M.; Carlier, J.; Costa, C.; Kaab, L.B.B.; Miguel, M.G. Growth, photosynthetic pigments, phenolic contants and biological activities of Foeniculum vulgare Mill., Anethum greolens L. and Pimpinella anisum L. (Apiaceae) in response to zinc. Ind. Crops Prod. 2017, 109, 627–636. [Google Scholar] [CrossRef]
  7. Choi, E.; Hwang, J. Anti-inflammatory, analgesic and antioxidant activities of the fruit of Foeniculum vulgare. Fitoter. 2004, 75, 557–565. [Google Scholar] [CrossRef]
  8. Ozbek, H.; Ugras, S.; Dulger, H.; Bayram, I.; Tuncer, I.; Ozturk, G. Hepatoprotective effect of Foeniculum vulgare essential oil. Fitoter. 2003, 74, 317–319. [Google Scholar] [CrossRef]
  9. Roby, M.H.H.; Sarhan, M.A.; Selim, K.A.H.; Khalel, K.A. Antioxidant and antimicrobial activities of essential oil and extracts of fennel (Foeniculum vulgare L.) and chamomile (Matricaria chamomilla L.). Ind. Crops Prod. 2013, 44, 437–445. [Google Scholar] [CrossRef]
  10. Diao, W.R.; Hu, Q.P.; Zhang, H.; Xu, J.G. Chemical composition: Antibacterial activity and mechanism of action of essential oil from seeds of fennel (Foeniculum vulgare Mill.). Food Control 2014, 35, 109–116. [Google Scholar] [CrossRef]
  11. Elagayyar, M.; Draughon, F.A.; Golden, D.A. Antimicrobial activity of essential oil from plants against selected pathogenic and saprophytic microorganisms. J. Food Prot. 2001, 64, 1019–1024. [Google Scholar] [CrossRef] [PubMed]
  12. Singh, G.; Maurya, S.; Lampasona, M.P.; Catalan, C. Chemical constituents: Antifungal and antioxidative potential of Foeniculum vulgare volatile oil and its acetone extract. Food Control 2006, 17, 745–752. [Google Scholar] [CrossRef]
  13. Saleem, F.; Sarkar, D.; Ankolekar, C.; Shetty, K. Phenolic bioactives and associated antioxidant and anti-hyperglycemic functions of select species of Apiaceae family targeting for type 2 diabetes relevant nutraceuticals. Ind. Crops Prod. 2017, 107, 518–525. [Google Scholar] [CrossRef]
  14. Cioanca, O.; Hancianu, M.; Mircea, C.; Trifan, A.; Hritcu, L. Essential oils from Apiaceae as valuable resources in neurological disorders: Foeniculum vulgare aetheroleum. Ind. Crops Prod. 2016, 88, 51–57. [Google Scholar] [CrossRef]
  15. Anand, P.; Kunnumakara, A.; Sundaram, C.; Harikumar, K.; Tharakan, S.; Lai, O.; Sung, B.; Aggarwal, B. Cancer is a preventable disease that requires major lifestyle changes. Pharm. Res. 2008, 25, 2097–2116. [Google Scholar] [CrossRef]
  16. Hammouda, F.M.; Saleh, M.A.; Abdel-Azim, N.S.; Shams, K.A.; Ismail, S.I.; Shahat, A.A.; Saleh, I.A. Evaluation of the essential oil of Foeniculum vulgare Mill (fennel) fruits extracted by three different extraction methods by GC/MS. Afr. J. Trad. Compl. Alt. Med. 2013, 11, 277–279. [Google Scholar] [CrossRef] [Green Version]
  17. Rodriguez-Solana, R.; Salgado, J.M.; Dominguez, J.M.; Cortes-Dieguez, S. Characterization of fennel extracts and quantification of estragole: Optimization and comparison of accelerated solvent extraction and Soxhlet techniques. Ind. Crops Prod. 2014, 52, 528–536. [Google Scholar] [CrossRef]
  18. Acimovic, M.; Tesevic, V.; Todosijevic, M.; Djisalov, J.; Oljaca, S. Compositional characteristics of the essential oil of Pimpinella anisum and Foeniculum vulgare grown in Serbia. Bot. Serb. 2015, 39, 9–14. [Google Scholar]
  19. Shojaiefar, S.; Mirlohi, A.; Sabzalian, M.R.; Yaghini, M. Seed yield and essential oil content of fennel influenced by genetic variation and genotype x year interaction. Ind. Crops Prod. 2015, 71, 97–105. [Google Scholar] [CrossRef]
  20. Upadhyay, R.K. GC-MS analysis and in vitro antimicrobial susceptibility of Foeniculum vulgare seed essential oil. Am. J. Plant Sci. 2015, 6, 1058–1068. [Google Scholar] [CrossRef] [Green Version]
  21. Abdel Karm, M.; Ayda, A.; Khalid, M.S. GC-MS analysis and antimicrobial activity of Saudi Foeniculum vulgare Mill. (Apiaceae) fixed oil. Int. J. Adv. Res. 2017, 5, 1523–1528. [Google Scholar] [CrossRef] [Green Version]
  22. Ahmad, B.S.; Talou, T.; Saad, Z.; Hijazi, A.; Cerny, M.; Kanaan, H.; Chokr, A.; Merah, O. Fennel oil and by-products seed characterization and their potential applications. Ind. Crops Prod. 2018, 111, 92–98. [Google Scholar] [CrossRef] [Green Version]
  23. Tao, Y.; He, F.; Jin, K.; Wang, J.; Wang, Y.; Zhou, J.; Sun, J.; Fang, Q. Facile conversion of plant oil (anethole) to a high-performance material. Polym. Chem. 2017, 8, 2010–2015. [Google Scholar] [CrossRef] [Green Version]
  24. Jurado, J.M.; Alcazar, A.; Pablos, F.; Martin, M.J. LC determination of anethole in aniseed drinks. Chromatographia 2006, 64, 223–226. [Google Scholar] [CrossRef]
  25. Pang, X.; Bai, L.; Wang, Z.; Yang, H.; Liu, H.; Yan, H. Establishment of quantitatively analytical methods for the determination of aroma compounds in edible spices using a homemade chromatographic monolithic column. Chromatographia 2019, 82, 1345–1354. [Google Scholar] [CrossRef]
  26. Rajabi, M.; Haji-Esfandiari, S.; Barfi, B.; Ghanbari, H. Ultrasound-assisted temperature-controlled ionic-liquid dispersive liquid phase microextraction method for simultaneous determination of anethole, estragole, and para-anisaldehyde in different plant extracts and human urine: A comparative study. Anal. Bioanal. Chem. 2014, 406, 4501–4512. [Google Scholar] [CrossRef]
  27. Li, W.; Deng, J.; Qiao, J.; Li, Q.; Zhang, Y. HPLC determination of 4-hydroxy-anethole trithione in plasma via enzymatic hydrolysis and its application to bioequivalence study. J. Pharm. Biomed. Anal. 2008, 47, 612–617. [Google Scholar] [CrossRef]
  28. Fagundes, V.H.V.; Pinho, R.J.; Wiirzler, L.A.M.; Kimura, E.; Bersani-Amado, C.A.; Cuman, R.K.N. High performance liquid chromatography method for the determination of anethole in rat plasma. Trop. J. Pharm. Res. Anal. 2014, 13, 793–799. [Google Scholar] [CrossRef] [Green Version]
  29. Najdoska-Bogdanov, M.; Bogdanov, J.B.; Stefova, M. Simultaneous determination of essential oil components and fatty acids in fennel using gas chromatography with a polar capillary column. Nat. Prod. Comm. 2015, 10, 1619–1626. [Google Scholar] [CrossRef] [Green Version]
  30. Leal, P.F.; Almeida, T.S.; Prado, G.H.C.; Prado, J.M.; Meireles, M.A.A. Extraction kinetics and anethole content of fennel (Foeniculum vulgare) and anise seed (Pimpenella anisum) extracts obtained by Soxhlet, ultrasound, percolation, centrifugation, and steam distillation. Sep. Sci. Technol. 2011, 46, 1848–1856. [Google Scholar] [CrossRef]
  31. Saini, N.; Singh, G.K. Gas chromatographic validated method for quantification of ayurvedic polyherbal formulation. Asian J. Pharm. 2015, 9, 200–205. [Google Scholar] [CrossRef]
  32. Duta, D.E.; Culetu, A.; Negoita, M.; Ionescu, V. Quantification of anethole in fennel and anise essential oils using gas chromatography and 1H-NMR-spectroscopy. Bull. UASVM Food Sci. Technol. 2019, 76, 105–113. [Google Scholar]
  33. Najdoska, M.; Bogdanov, J.; Zdravkovski, Z. TLC and GC-MS analyses of essential oil isolated from Macedonian Foeniculi fructus. Maced. Pharm. Bull. 2010, 56, 29–36. [Google Scholar] [CrossRef]
  34. Quezada-Moreno, W.F.; Quezada-Torres, W.D.; Gallardo-Aguilar, I.; Cevallos-Carvajal, E.; Arias-Palma, G.; Travez-Castellano, A.; Zambrano-Ochoa, Z.; Rojas-Molina, O. Extraction and chemical characterization of the essential oil of Tagetes pusilla, in fresh and stored samples. Afinidad 2019, 76, 307–313. [Google Scholar]
  35. Schulz, K.; Schlenz, K.; Metasch, R.; Malt, S.; Romhild, W.; Drebler, J. Determination of anethole in serum samples by headspace solid-phase microextraction-gas chromatography-mass spectrometry for congener analysis. J. Chromatogr. A 2008, 1200, 235–241. [Google Scholar] [CrossRef] [PubMed]
  36. Bilia, A.R.; Fumarola, M.; Gallori, S.; Mazzi, G.; Vincieri, F.F. Identification by HPLC-DAD and HPLC-MS analyses and quantification of constituents of fennel teas and decoctions. J. Agric. Food Chem. 2000, 48, 4734–4738. [Google Scholar] [CrossRef]
  37. Kowalcze, M.; Wyrwa, J.; Dziubaniuk, M.; Jakubowska, M. Voltammetric determination of anethole on La2O3/CPE and BDDE. J. Anal. Methods Chem. 2018, 2018, E2158407. [Google Scholar] [CrossRef] [Green Version]
  38. Alam, P.; Alqarni, M.H.; Alam, P.; Foudah, A.I.; Ghazwani, M. A HPTLC method for determination of anethole in essential oil, methanolic extract of Foeniculum vulgare and commercial herbal products. J. Pharm. Res. Int. 2020, 32, 68–75. [Google Scholar] [CrossRef]
  39. Alam, P.; Ezzeldin, E.; Iqbal, M.; Anwer, M.K.; Mostafa, G.A.E.; Alqarni, M.H.; Foudah, A.I.; Shakeel, F. Ecofriendly densitometric RP-HPTLC method for determination of rivaroxaban in nanoparticle formulations using green solvents. RSC Adv. 2020, 10, 2133–2140. [Google Scholar] [CrossRef] [Green Version]
  40. Alam, P.; Ezzeldin, E.; Iqbal, M.; Mostafa, G.A.E.; Anwer, M.K.; Alqarni, M.H.; Foudah, A.I.; Shakeel, F. Determination of delafloxacin in pharmaceutical formulations using a green RP-HPTLC and NP-HPTLC methods. Antibiotics 2020, 9, 359. [Google Scholar] [CrossRef]
  41. Foudah, A.I.; Alam, P.; Anwer, M.K.; Yusufoglu, H.S.; Abdel-Kader, M.S.; Shakeel, F. A green RP-HPTLC-densitometry method for the determination of diosmin in pharmaceutical formulations. Processes 2020, 8, 817. [Google Scholar] [CrossRef]
  42. Foudah, A.I.; Shakeel, F.; Yusufoglu, H.S.; Ross, S.A.; Alam, P. Simultaneous determination of 6-shogaol and 6-gingerol in various ginger (Zingiber officinale Roscoe) extracts and commercial formulations using a green RP-HPTLC-densitometry method. Foods 2020, 9, 1136. [Google Scholar] [CrossRef] [PubMed]
  43. International conference on harmonization (ICH). Q2 (R1): Validation of Analytical Procedures–Text and Methodology; International Conference on Harmonization (ICH): Geneva, Switzerland, 2005. [Google Scholar]
Figure 1. High-performance thin layer chromatography (HPTLC) densitogram of standard trans-anethole (TAL).
Separations 07 00051 g001
Figure 2. Overlaid ultraviolet (UV) absorption spectra of standard TAL, fennel essential oil and traditional and ultrasound-assisted fennel extract and commercial formulations.
Separations 07 00051 g002
Figure 3. HPTLC chromatogram of TAL in a traditional methanolic extract of Foeniculum vulgare.
Separations 07 00051 g003
Figure 4. HPTLC chromatogram of TAL in the essential oil of Foeniculum vulgare.
Separations 07 00051 g004
Figure 5. HPTLC chromatogram of TAL in a traditional extract of commercial formulation 1 containing Foeniculum vulgare.
Separations 07 00051 g005
Table 1. Linear regression analysis for the calibration curve of trans-anethole (TAL) (mean ± SD; n = 6).
Linearity Range (ng/band)50–1000
Regression equationY = 12.24x + 59.01
Determination coefficient0.9995
Slope ± SD12.24 ± 0.79
Intercept ± SD59.01 ± 2.76
Standard error of slope0.32
Standard error of intercept1.12
95% confidence interval of slope10.8–13.6
95% confidence interval of intercept54.1–63.8
LOD ± SD (ng/band)16.85 ± 0.82
LOQ ± SD (ng/band)50.55 ± 2.46
Table 2. Accuracy results of a green reversed phase high-performance thin layer chromatography (RP-HPTLC) method (mean ± SD; n = 6).
Excess Drug Added to Analyte (%)Theoretical Content (ng/band)Conc. Found (ng/band) ± SDRecovery (%)RSD (%)
010098.41 ± 1.8498.411.86
50150147.86 ± 2.1498.571.44
100200201.47 ± 2.18100.731.08
150250252.84 ± 2.42101.130.95
Table 3. Precision analysis of a green RP-HPTLC method (mean ± SD; n = 6).
Conc.
(ng/band)
Repeatability (Intraday Precision)Intermediate Precision (Interday)
Area ± SDStandard Error% RSDArea ± SDStandard Error% RSD
1001344 ± 228.981.631324 ± 2510.201.88
1502086 ± 249.791.152062 ± 2711.021.30
2002568 ± 218.570.812580 ± 239.390.89
2503076 ± 239.390.743102 ± 249.790.77
Table 4. The robustness of a green RP-HPTLC method (mean ± SD; n = 6).
Conc.
(ng/band)
Mobile Phase Composition (EtOH:H2O)Results
OriginalUsed Area ± SD% RSDRf
7.7:2.3+0.22534 ± 210.820.30
2007.5:2.57.5:2.50.02498 ± 190.760.31
7.3:2.7−0.22438 ± 230.940.32
Table 5. Quantitative analysis of TAL in essential oil, methanolic extract and commercial formulations extracted by traditional and ultrasound methods using a green RP-HPTLC method (mean ± SD; n = 3).
SamplesTraditional ExtractionUltrasound-Based Extraction
Amount of TAL (mg/g)
Essential oil8.82 ± 0.54NA *
Methanolic extract6.44 ± 0.328.34 ± 0.48
Formulation 14.88 ± 0.276.46 ± 0.35
Formulation 24.48 ± 0.245.81 ± 0.30
* Ultrasound extraction is not applicable to essential oil, as direct analysis was performed on essential oil.
Table 6. Comparison of the present green RP-HPTLC method with the previous literature’s methods for the quantitative analysis of TAL.
Analytical MethodLinearity RangeAccuracy (% Recovery)Precision (% RSD)Ref.
HPLC2–16 (µg/mL)95–1010.9–1.6[24]
HPLC0.015–98 (µg/mL)97.6–101.13.6[26]
HPLC0.1–200 (µg/mL)99.38–101.331.53–2.82[25]
HPTLC100–600 (ng/band)98.33–99.300.34–1.02[38]
GC240–1200 (µL/mL)99.70–100.900.21[31]
HPTLC50–1000 (ng/band)98.42–101.130.74–1.88Present work

