Article

Vortex-Assisted Dispersive Molecularly Imprinted Polymer-Based Solid Phase Extraction of Acetaminophen from Water Samples Prior to HPLC-DAD Determination

by
Neliswa Mpayipheli
1,2,
Anele Mpupa
1,2 and
Philiswa Nosizo Nomngongo
1,2,*
1
Department of Chemical Sciences, University of Johannesburg, Doornfontein Campus, P.O. Box 17011, Doornfontein 2028, South Africa
2
Department of Science and Innovation (DSI)/National Research Foundation (NRF) South African Research Chair Initiative (SARChI), Nanotechnology for Water, University of Johannesburg, Doornfontein 2028, South Africa
*
Author to whom correspondence should be addressed.
Submission received: 22 September 2021 / Revised: 11 October 2021 / Accepted: 13 October 2021 / Published: 19 October 2021

Abstract

:
In the present study, acetaminophen (ACT) molecularly imprinted polymer (ACT-MIP) were successfully synthesized via surface imprinting polymerization. The structural and morphological properties of ACT-MIP were characterized using various analytical techniques. ACT-MIP were used as an adsorbent in a vortex-assisted dispersive molecularly imprinted solid-phase micro-extraction (VA-d-μ-MISPE), coupled with a high-performance liquid chromatography–diode array detector (HPLC-DAD) method for the determination of ACT in water samples. Influential parameters such as the mass of adsorbent, vortex speed, extraction time, desorption volume, and desorption time were optimized using a multivariate approach. Under optimum conditions, the maximum binding capacities of ACT-MIP and NIP (non-imprinted polymers) were 191 mg/g and 71.5 mg/g, respectively. The linearity was attained across concentrations ranging from 0.630 to 500 µg/L, with a coefficient of determination of 0.9959. For ACT-MIP, the limit of detection (LOD) and limit of quantification (LOQ), enhancement factor, and precision of the method were 0.19 ng/L, 0.63 ng/L, 79, and <5%, respectively. The method was applied in the analysis of spiked water samples, and satisfactory percentage recoveries in the range of 95.3–99.8% were obtained.

1. Introduction

Environmental pollution has increased globally, and it is mainly caused by the release of different compounds as a result of urbanization, industrialization, and population growth [1]. The most popular route at which these compounds end up in the environment is through the discharge of untreated municipal and industrial wastewater [2]. It has been concluded that wastewater treatment plants (WWTPs) cannot efficiently degrade or remove chemicals of emerging concern because of their persistent nature, as well as low concentrations [3]. The occurrence and toxic effects of these compounds are not yet fully understood; as a result, it is difficult to set any regulations on their use [4]. Acetaminophen, (ACT) also known as paracetamol (N-acetyl-4-aminophenol), is an alternative to aspirin [5] commonly used to relieve general pain such as headache, muscular aches, backache, toothache, as well as fever [6]. It is categorized as one of the most consumed drugs in the world [7]. Acetaminophen comes in different forms that are openly available in the market, including drops, tablets, or capsules [8]. Due to its extensive use and consumption, it has been detected in influents, effluents, and surface waters in concentrations ranging from ng/L to mg/L [9]. It is one of the most commonly used pain relievers and antipyretic drugs, and is easily excreted in urine [10]. Humans can be exposed to acetaminophen in various ways, including irrigating crops with water contaminated with pharmaceuticals, and studies suggest that these compounds can be taken up by crops during the irrigation process [11]. Furthermore, the continuous increase in ACT in drinking water might lead to increased cardiovascular, kidney, and gastro-intestine diseases, as well as mortality [12].
Therefore, the development of easy and sensitive analytical methods for the determination of ACT from various matrices is of great importance [13]. At present, most of the proposed methods for the detection of drugs are based on high performance liquid chromatography–tandem mass spectrometry (HPLC–MS/MS), due to high selectivity and sensitivity [14] Other analytical detection methods that have been explored for the determination of acetaminophen in different samples include capillary electrophoresis [15], electrochemical impedance spectroscopy [16], ultraviolet (UV) spectrophotometry [17], high-performance liquid chromatography (HPLC) [18], liquid chromatography–tandem mass spectrometry (LC-MS/MS) [19], and electrochemical sensors [20]. Among the above-mentioned analytical techniques, HPLC is one of the most widely used because of its simplicity and user-friendliness. However, HPLC suffers from low sensitivity and selectivity. To overcome these challenges, sample preparation methods such as solid-phase extraction [21], liquid–liquid microextraction [5,22] and molecularly imprinted solid-phase extraction (MISPE) [5] have been used for the extraction of ACT from different sample matrices prior to HPLC analysis.
Molecularly imprinted polymers (MIPs) are polymers designed in a unique manner to enable the selective and specific recognition of a target molecule in its cavities [23]. These polymers are usually made in a way that matches the size, shape, and elemental composition of the target analyte [24]. MIPs are used as promising alternative selective adsorbents, owing to their ease of preparation and tailor-made recognition sites [25]. They have been applied in the analysis of pharmaceuticals in various complex matrices, including environmental [26] and biological fields [5]. Their unique properties lead to attractive advantages such as excellent selectivity, and physical and chemical stability [27].
In this study, ACT-MIP were successfully synthesized using surface imprinting onto silicon dioxide nanoparticles. The synthesized ACT-MIP were employed as a sorbent in vortex-assisted dispersive solid-phase micro-extraction of ACT in water samples. The analyte of interest was separated and quantified using high performance liquid chromatography–diode array detector (HPLC-DAD). The adsorption and selectivity properties of ACT-MIP and non-imprinted polymers (NIP) were investigated. In addition, multivariate approaches such as fractional factorial design and central composite design were used for the optimization of experimental parameters affecting the molecular recognition properties of the MISPE. The VA-d-μ-MISPE/HPLC-DAD procedure was used for ACT quantification in complex matrices.

2. Materials and Methods

2.1. Material and Reagents

All the reagents and chemicals employed in this study were of analytical grade, and ultra-pure water (Direct-Q® 3UV-R purifier system, Millipore, Merck, Darmstadt, Germany) was used during the experiments. Methacrylic acid (MAA), 2,2’-azobisisobutyronitrile (AIBN), ethylene glycol dimethacrylate (EGDMA), tetraethyl silicate (TEOS), 3-aminopropyltriethoxysilane (APTES), acetic acid, ammonium hydroxide, toluene, absolute ethanol, methanol (HPLC grade), and acetonitrile (HPLC grade) were purchased from Sigma-Aldrich (St. Loius, MO, USA).

2.2. Instrumentation

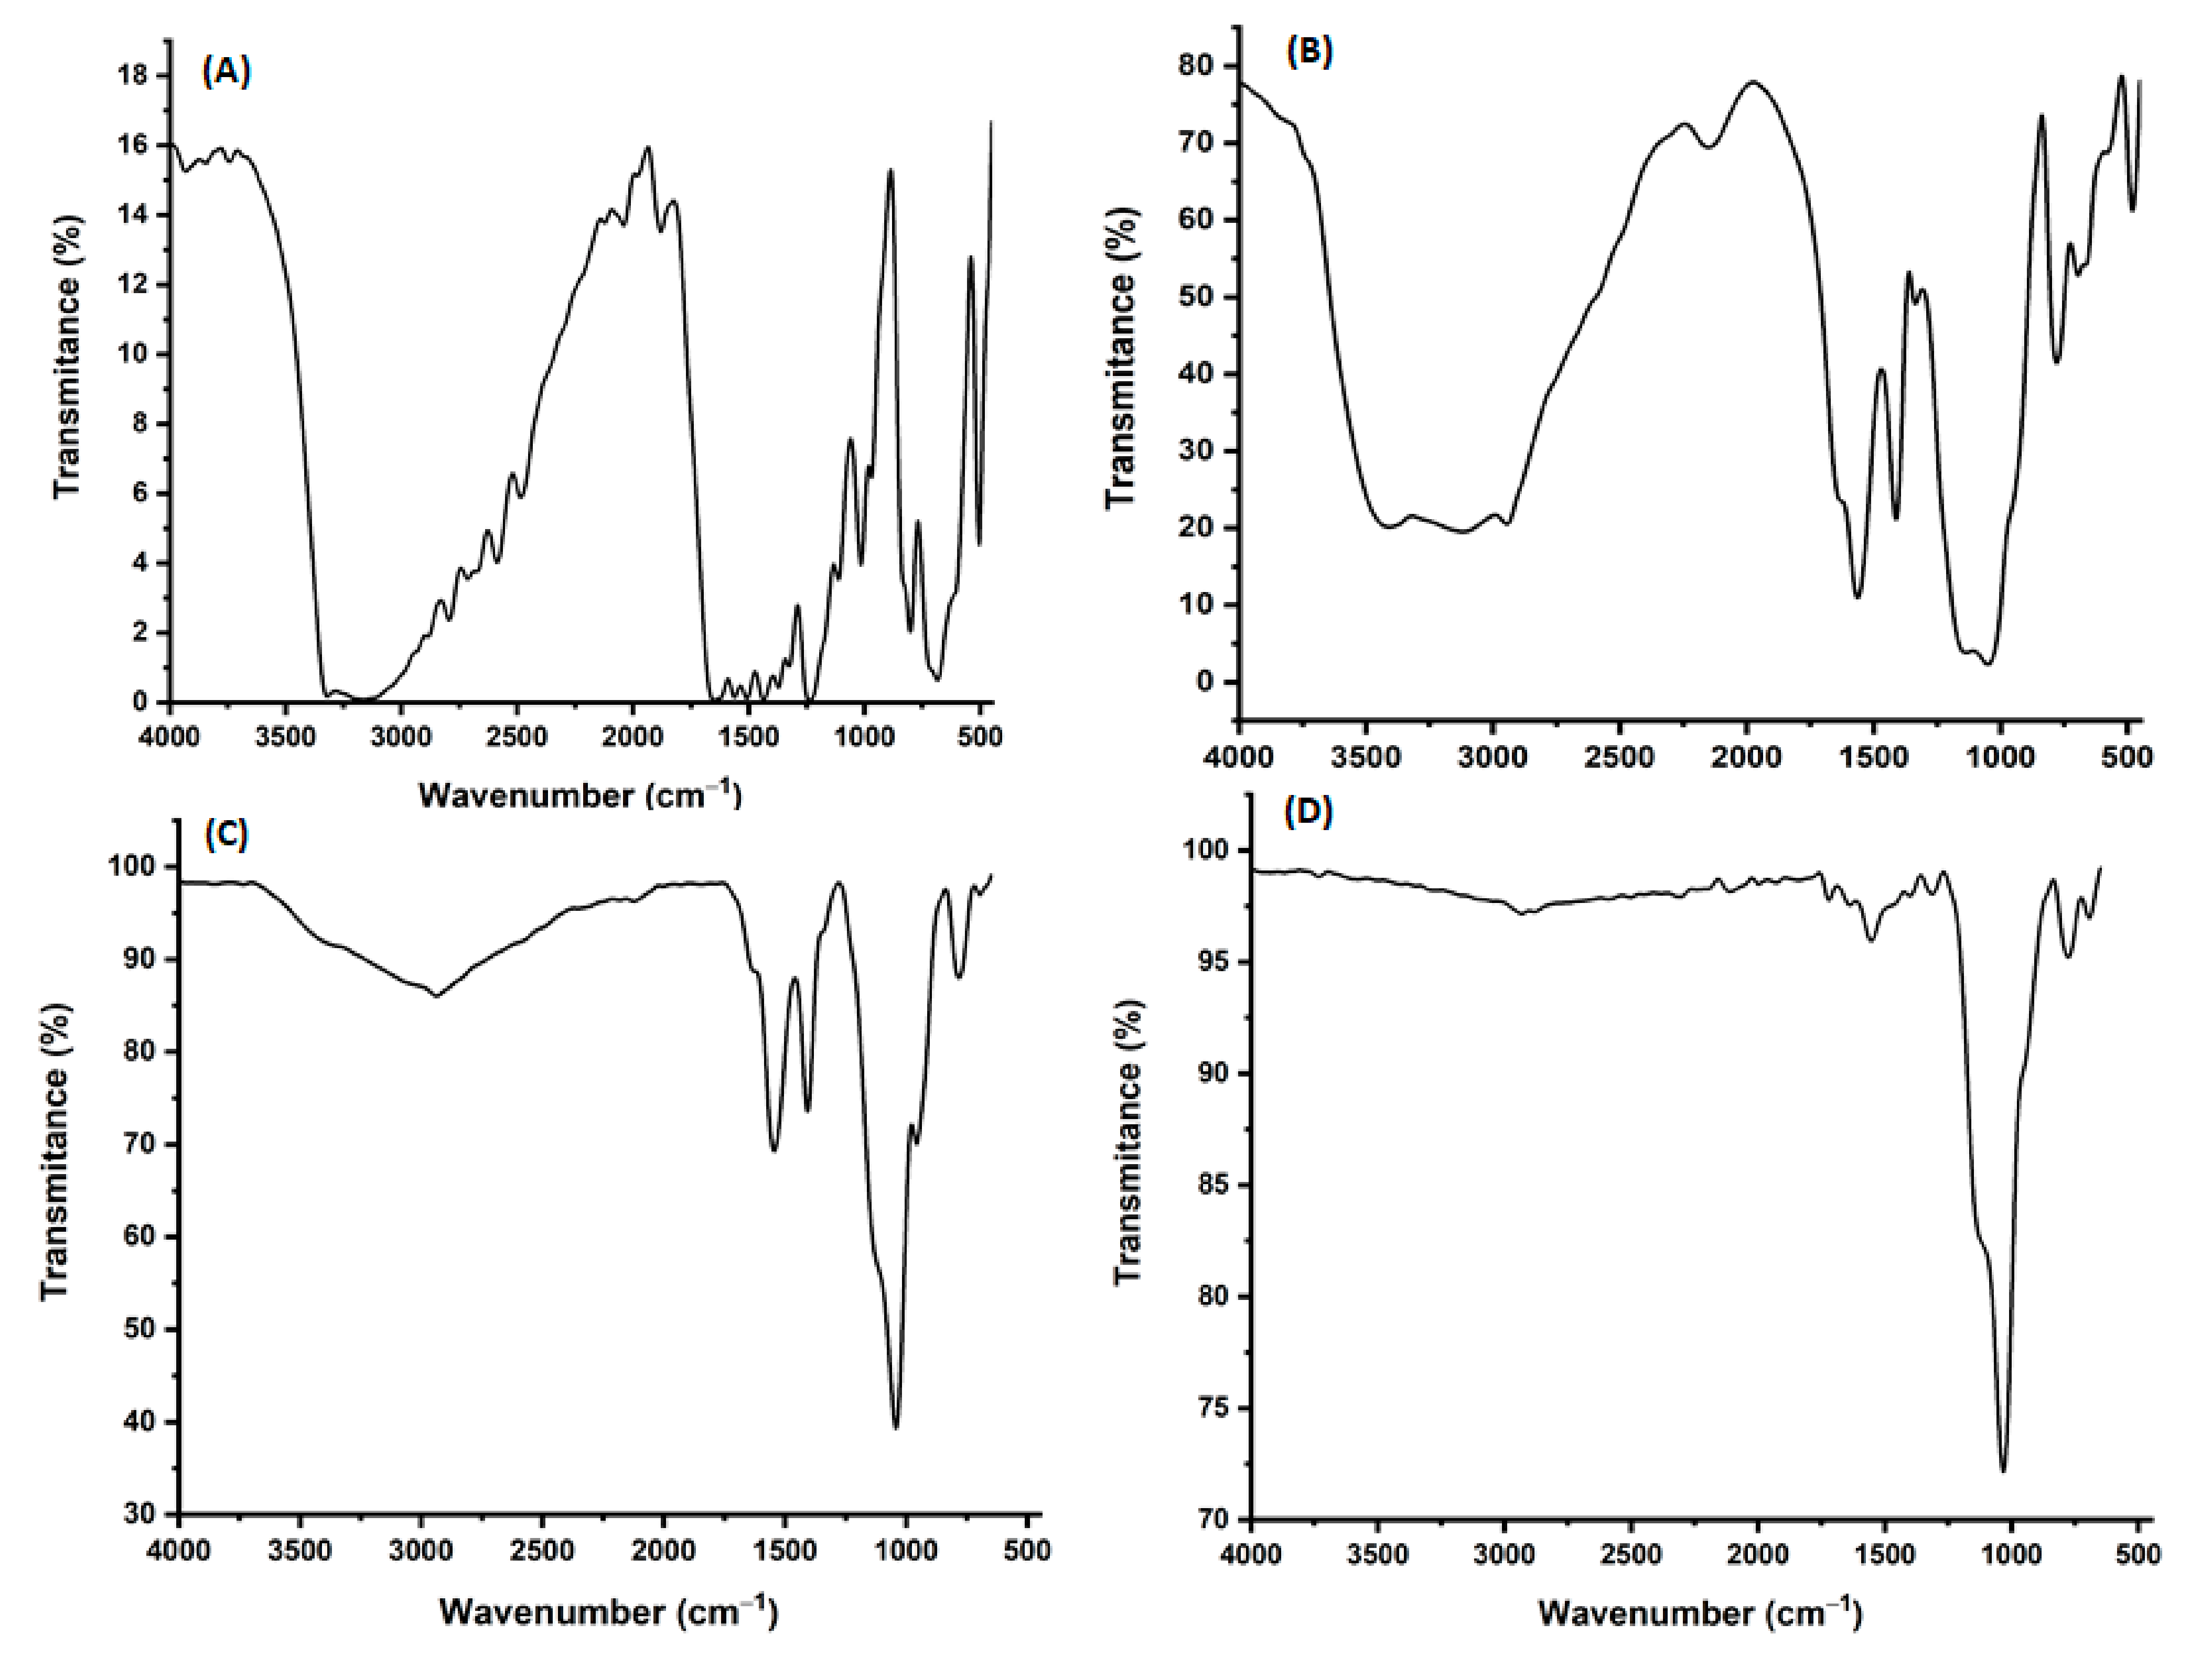
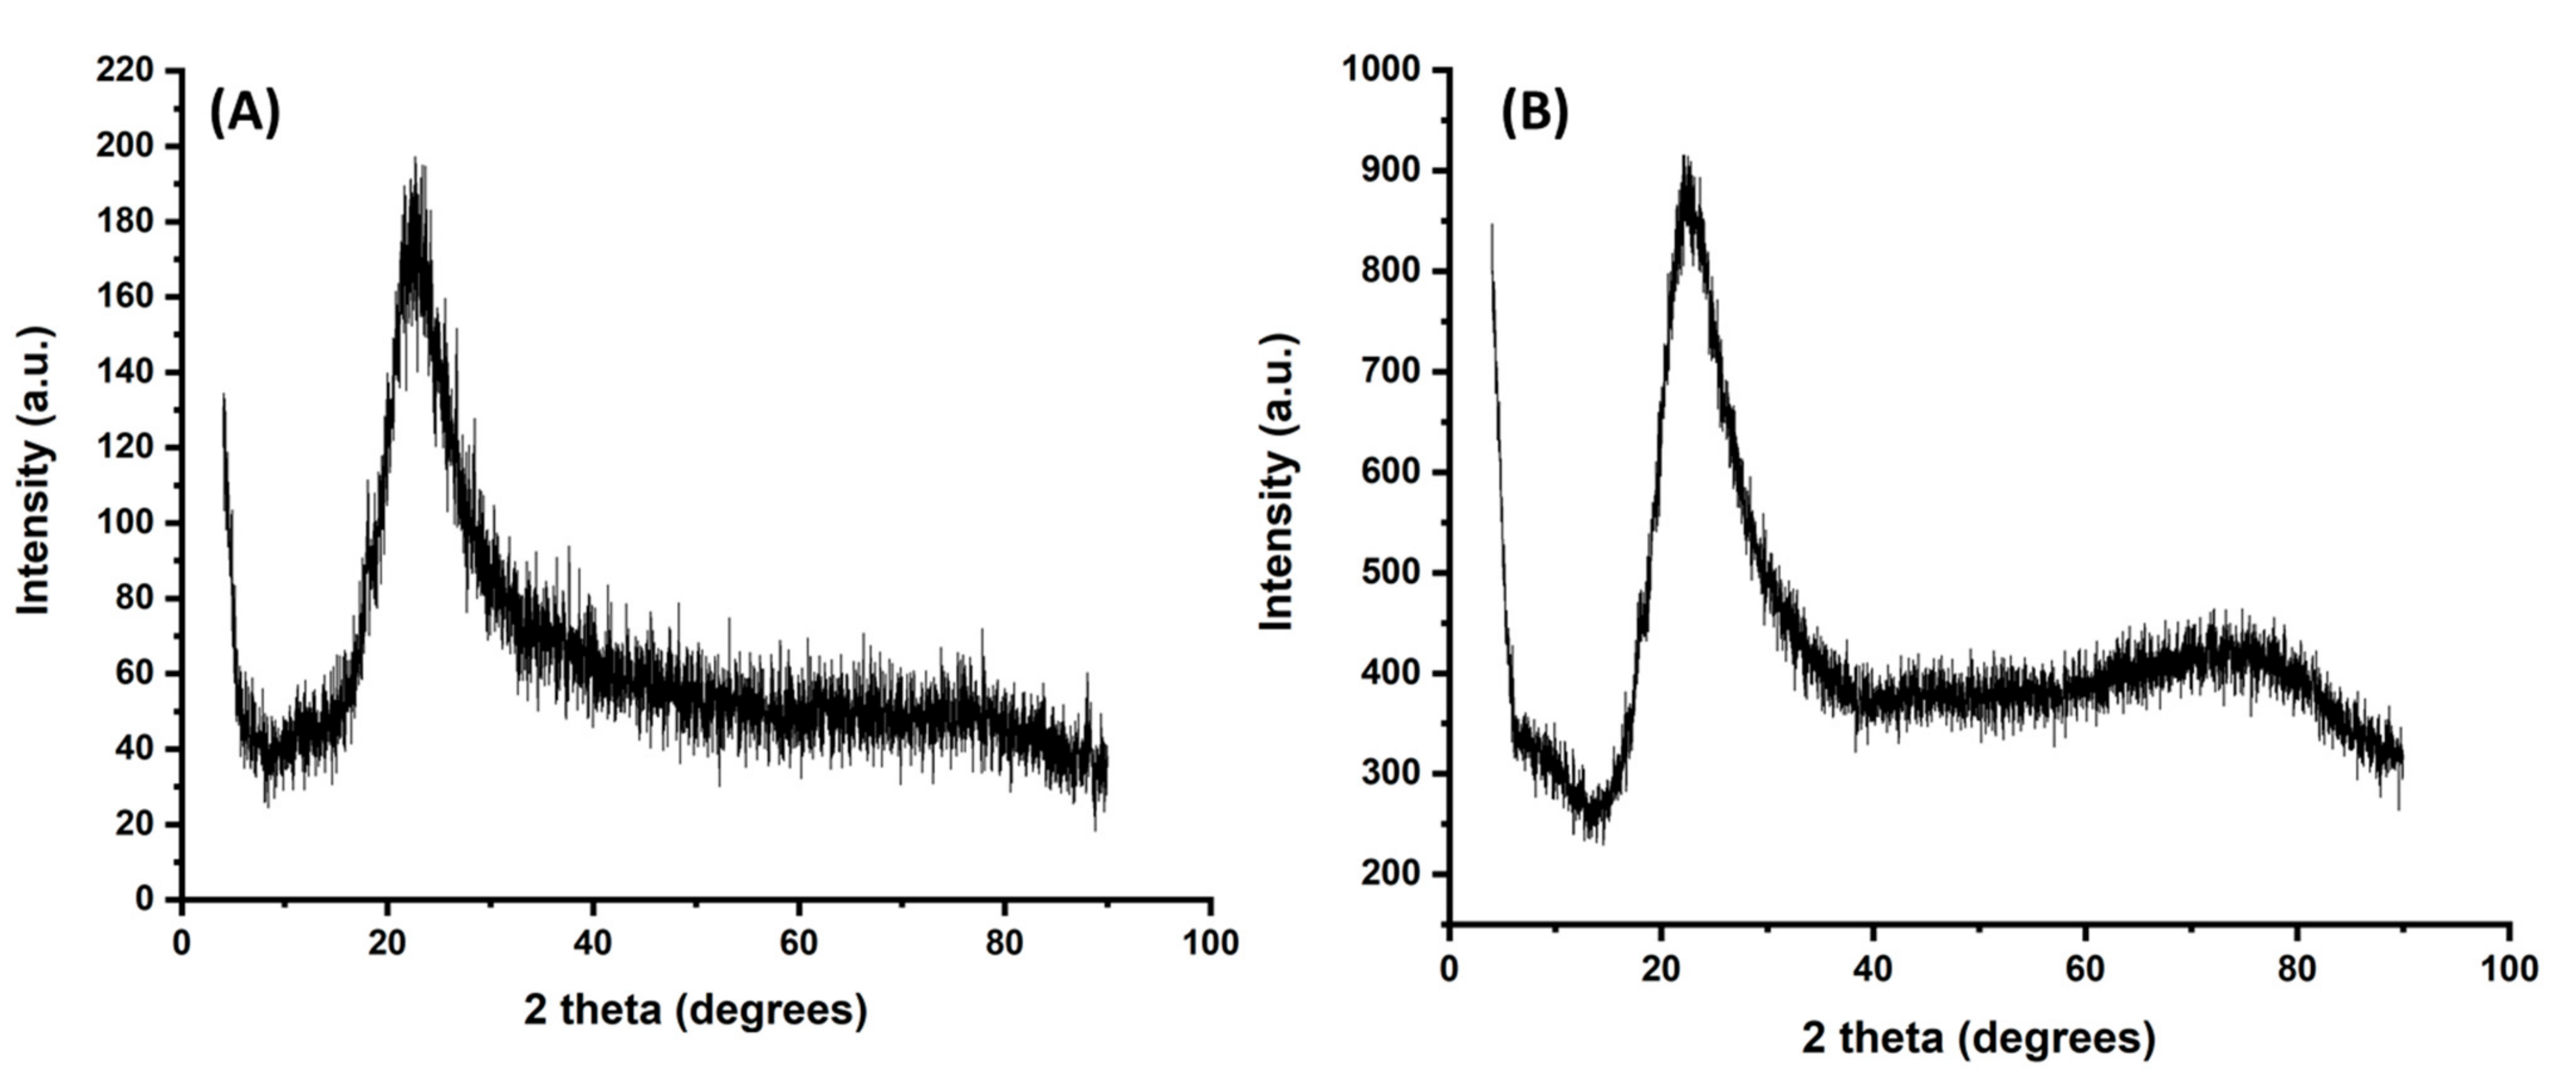
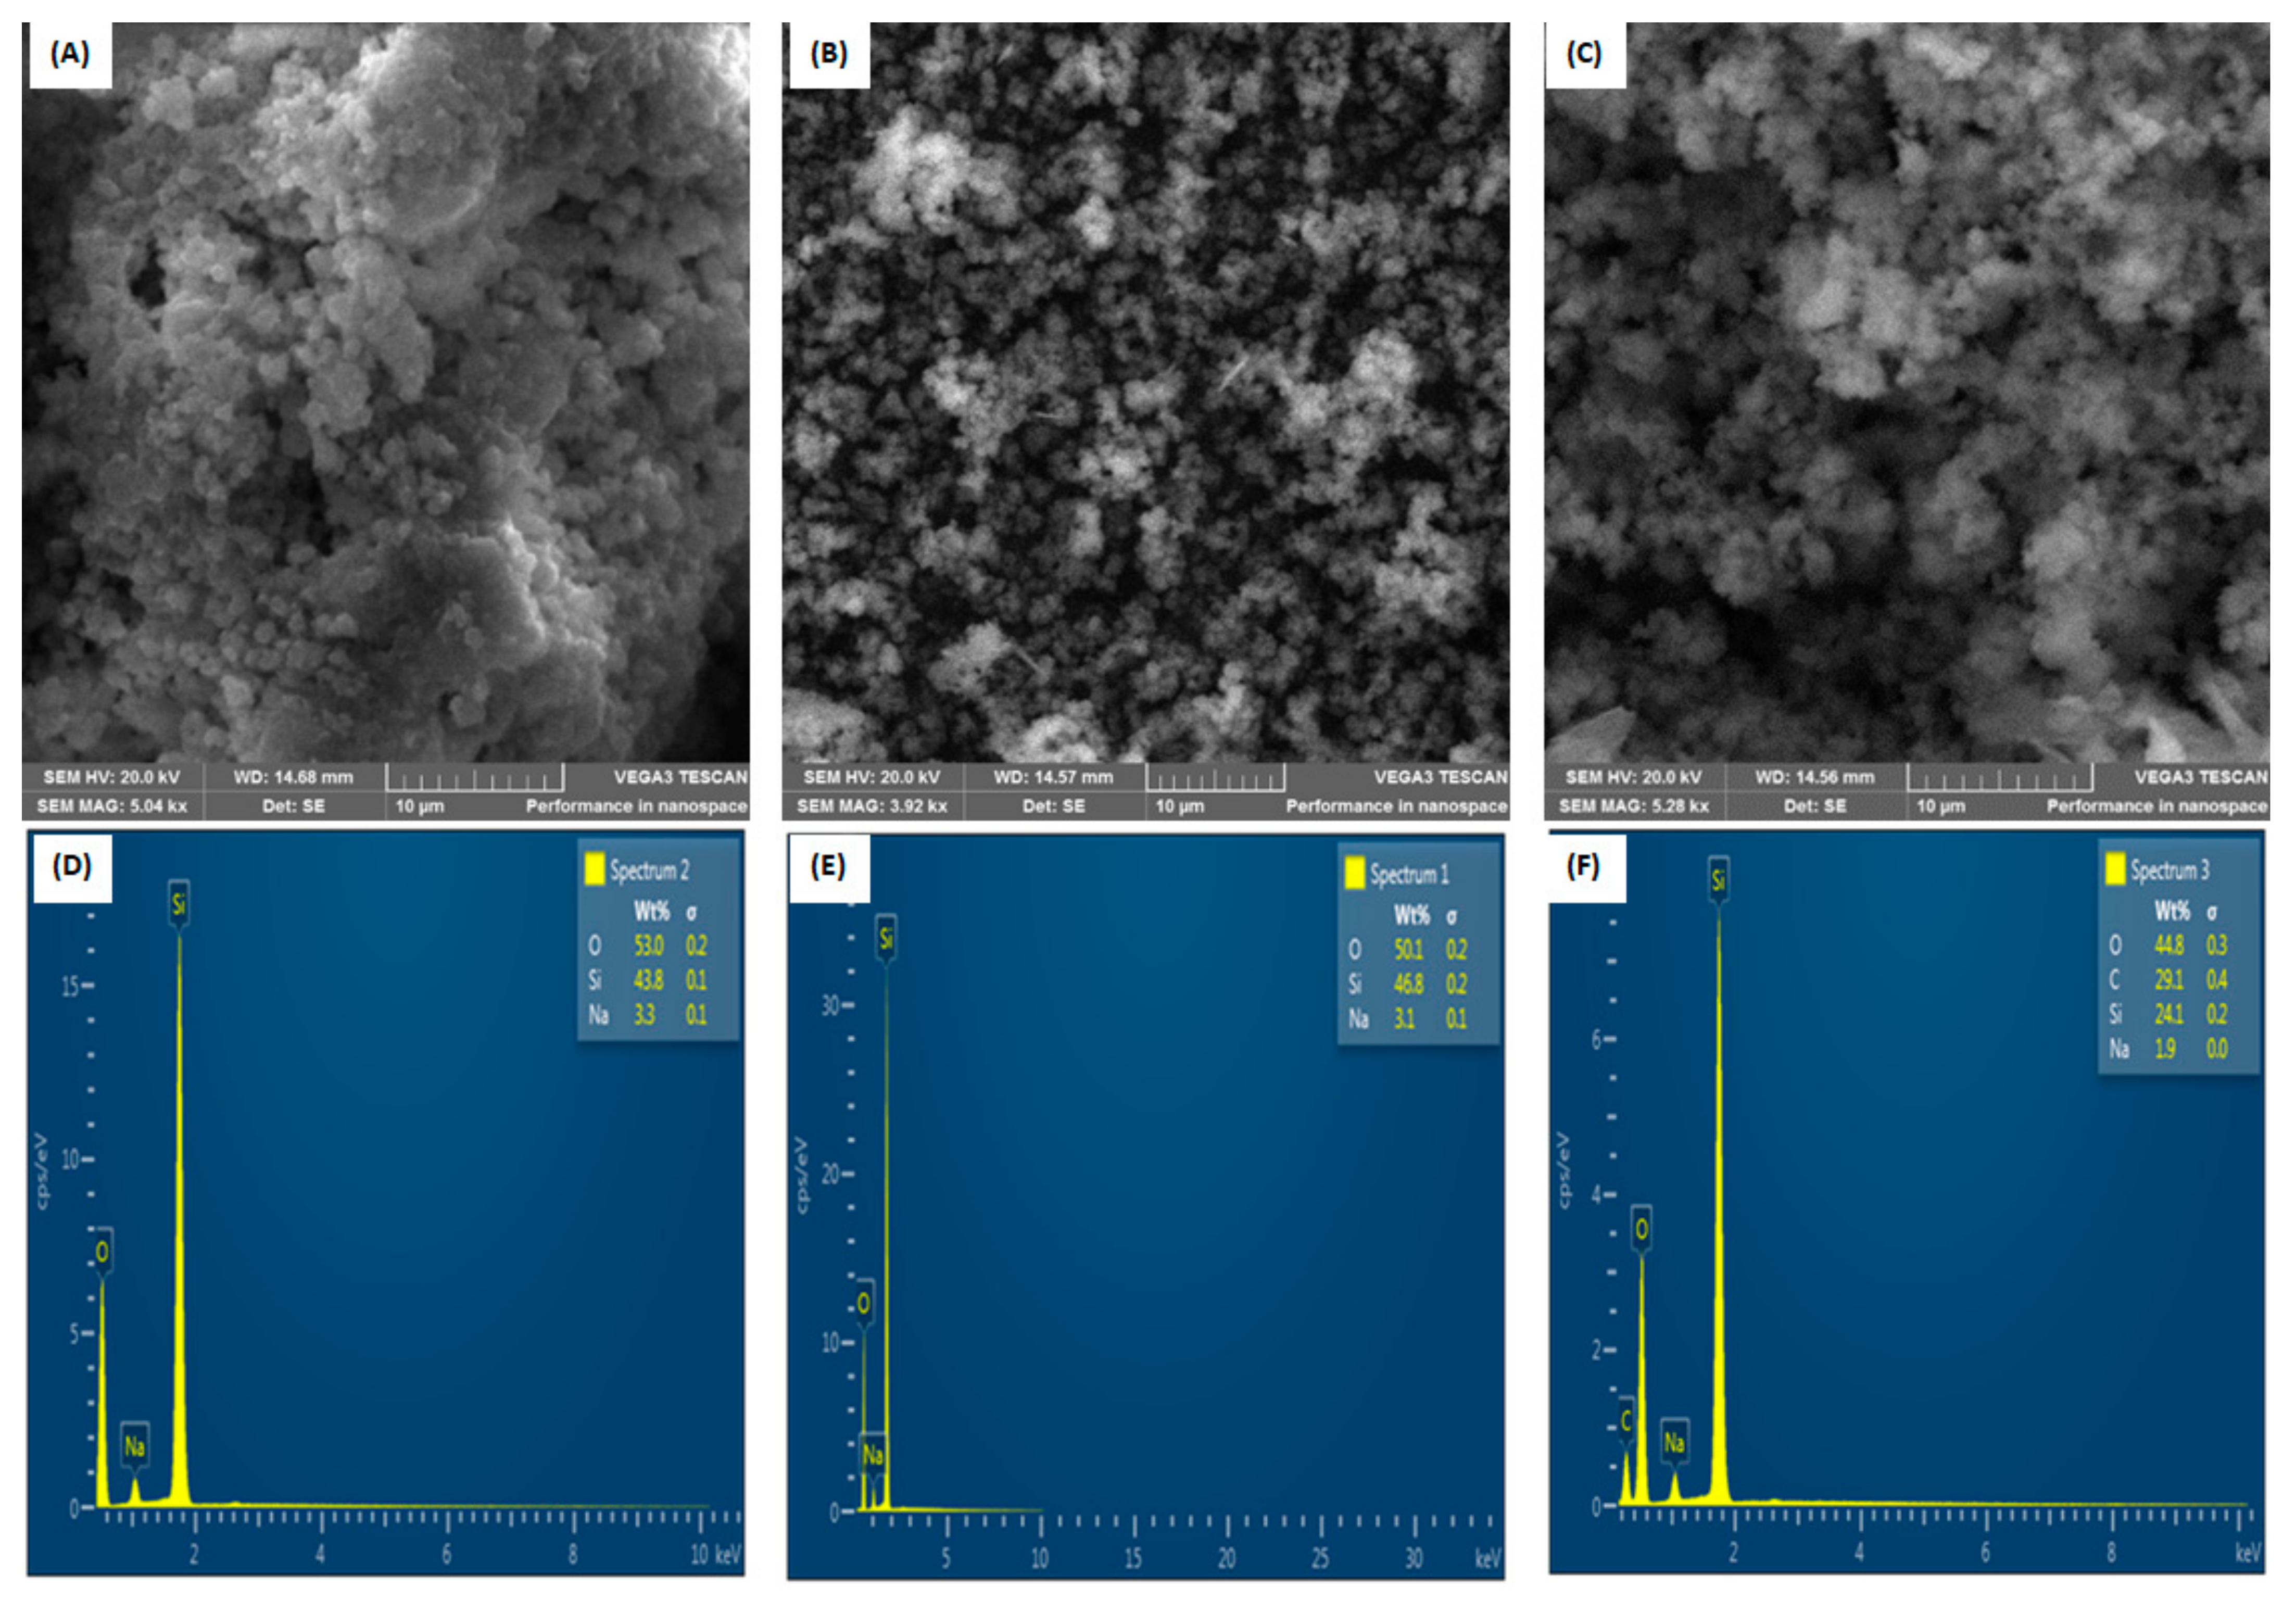
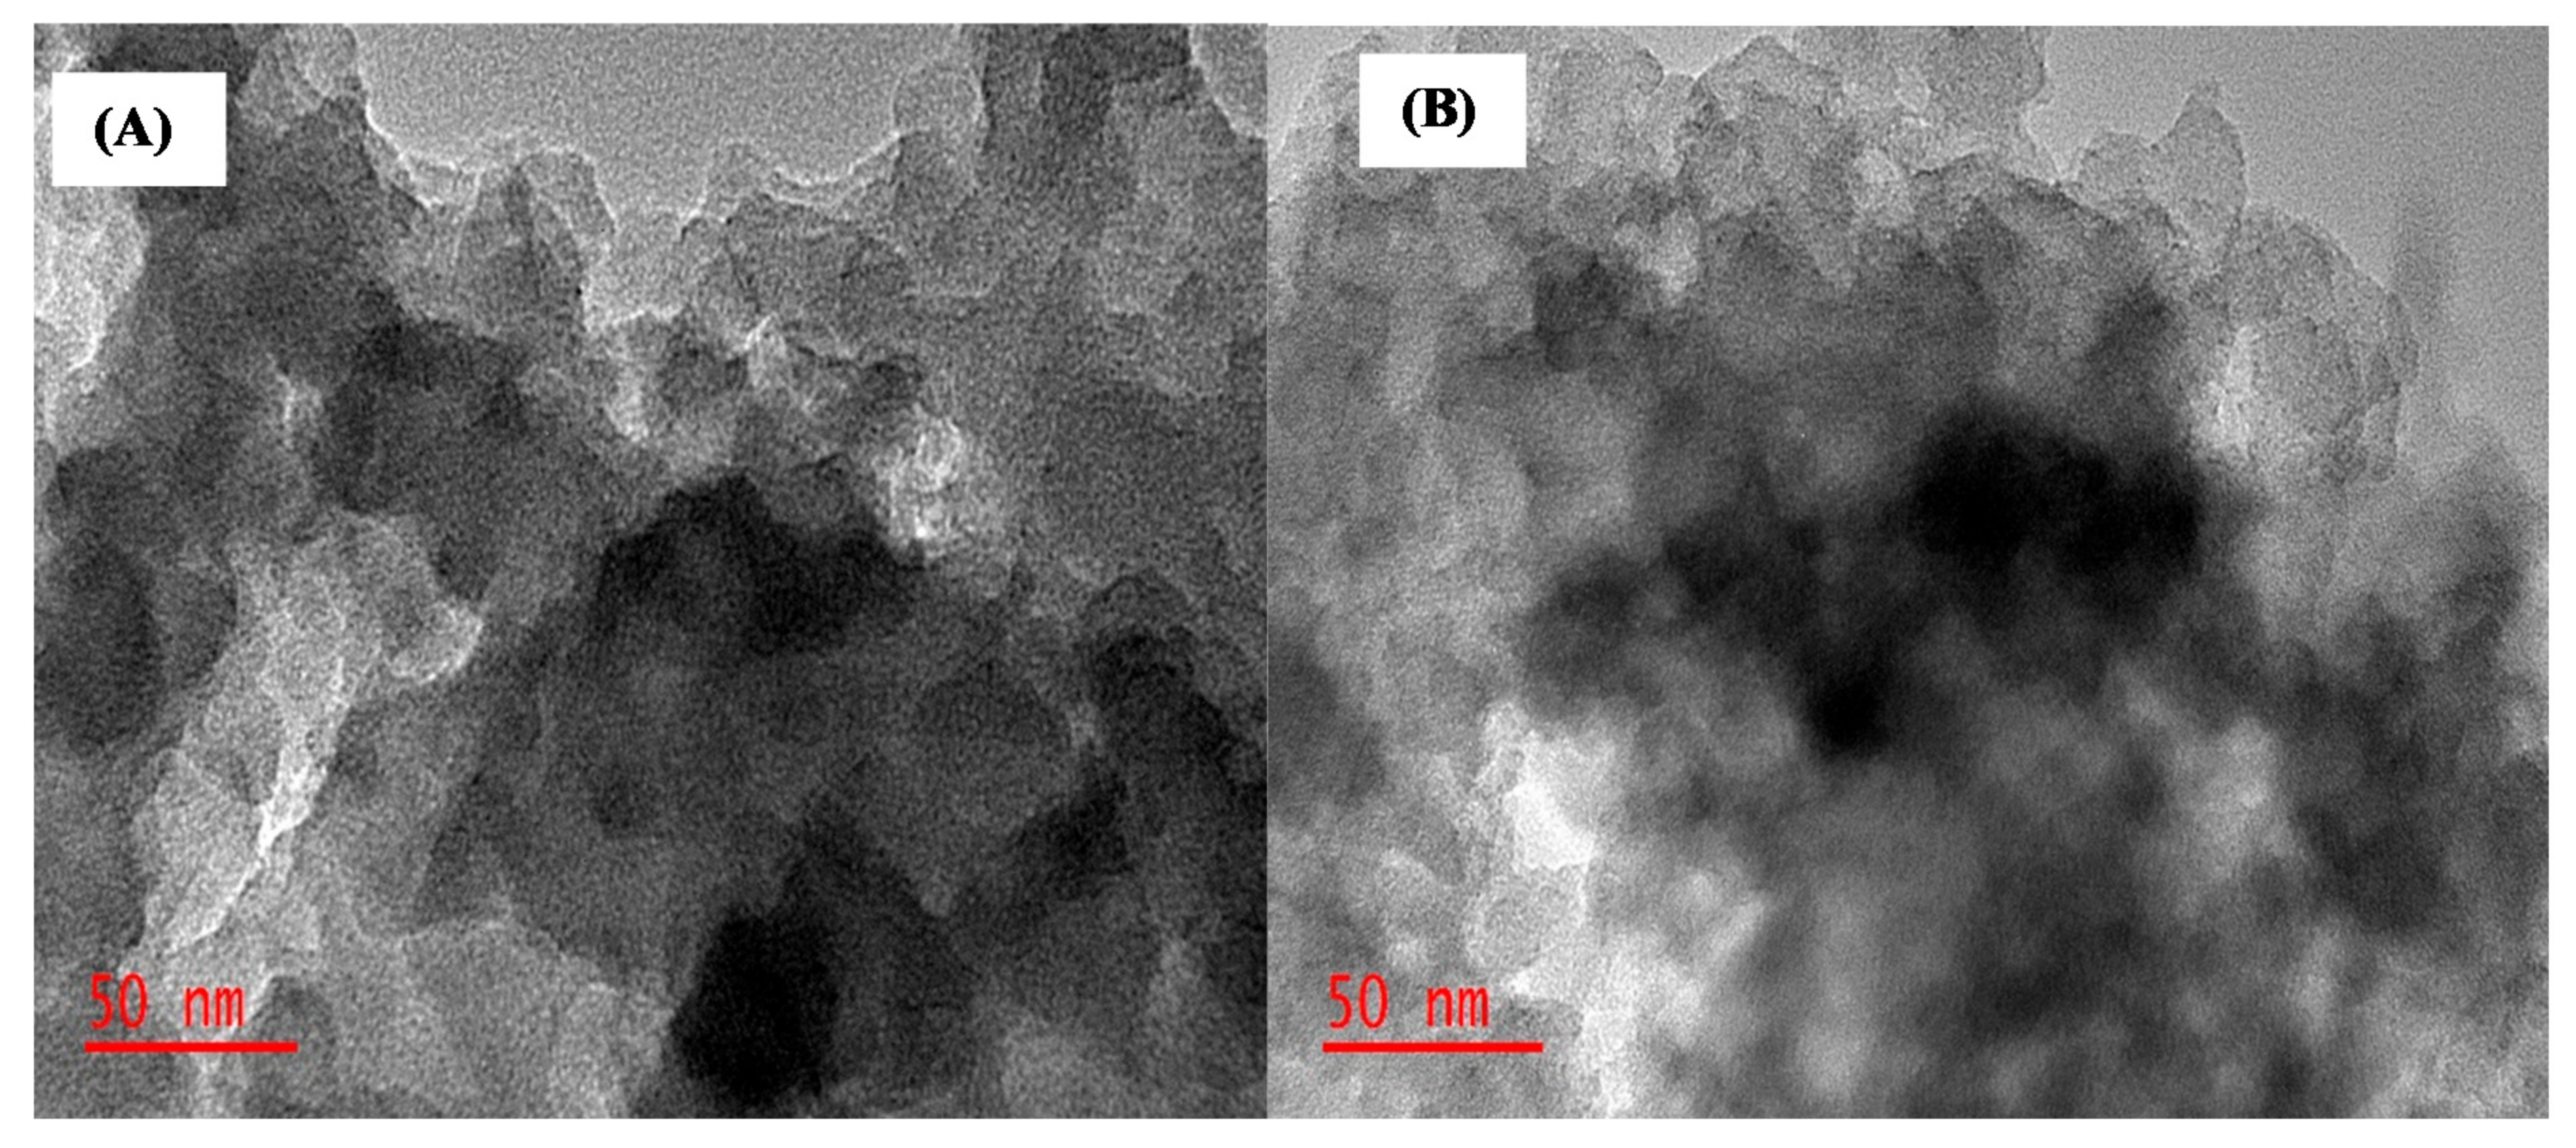
The following analytical instrumentations were used in this study: An analytical balance Radwag AS220/C/2 (Radwag, Radom, Poland) for recording the masses of adsorbents and salts. Spectrum 100 Attenuated total reflection Fourier transform infrared (ATR-FTIR) (PerkinElmer, Waltham, MA, USA) spectrometer for functional group determination; X’Pert PRO X-ray diffractometer (XRD; PANalytical, Almelo, The Netherlands; PW 3710/31a; CuKα anode; Ni-filter at 40 kV and 40 mA) for crystallinity investigation; transmission electron microscopy (TEM, JEM-2100, JEOL, Tokyo, Japan) and scanning electron microscopy (SEM, TESCAN VEGA 3 XMU, LMH instrument, Brno, Czech Republic) coupled with energy dispersive X-ray spectroscopy (EDS) for morphological properties and elemental composition; Eppendorf 5702 Centrifuge (Eppendorf, Hamburg, Germany); OHAUS starter 2100 pH meter (Pine Brook, NJ, USA) and an Agilent HPLC 1200 Infinity series, equipped with a photodiode array detector (Agilent Technologies, Waldbronn, Germany). An Agilent Zorbax Eclipse Plus C18 column (3.5 μm × 150 mm × 4.6 mm) (Agilent, Newport, CA, USA) was operated at a column temperature of 25 °C. The mobile phase was (70%) of 0.01 M phosphoric acid (mobile phase A) and (30%) acetonitrile (mobile phase B) at a flow rate of 1.00 mL min−1 throughout the analysis. The chromatograms were recorded at 260 nm.

2.3. Synthesis

2.3.1. Preparation of Silicone Dioxide

The preparation of silicone dioxide was adopted from previous studies [28]. Briefly, about 30 mL of ammonium hydroxide was added to 120 mL of absolute ethanol, and the mixture was stirred at room temperature. In a separate beaker, approximately 3 mL of TEOS and 2 mL of APTES were added into 25 mL of absolute ethanol, the mixture was stirred at ambient temperature. The two solutions were then mixed and stirred at 700 rpm for 45 min. Thereafter, the resultant material was washed with ethanol and separated by centrifugation for 10 min at 2000 rpm, and subsequently dried in an oven at 40 °C for 24 h.

2.3.2. Synthesis of ACT-MIP

The synthesis of the MIP was carried out based on the study reported elsewhere [28]. Firstly, 1 g of SiO2 was dispersed in 100 mL of acetonitrile; afterwards, 1 mmol of acetaminophen (ACT) and 0.5 methacrylic acid (MAA) were added into the solution. The mixture was then shaken at 150 rpm for 1 h and 30 min at room temperature. Subsequently, 10 mmol EGDMA and 20 mg AIBN were dispersed into the above mixture, and it was stirred at 60 °C for 24 h. The obtained polymer was washed using a mixture methanol and acetic acid (9:1, v/v) until the template was not detected by HPLC. The non-imprinted polymer (NIP) was prepared in the same way with the template excluded.

2.4. Pre-Concentration Procedure

2.4.1. Vortex-Assisted Dispersive Solid-Phase Microextraction Procedure

Firstly, 20 mg of ACT-MIP was transferred into a centrifuge tube containing 10 mL of a sample solution containing 100 mg/L of acetaminophen. The mixture was placed in a vortex mixer for 12 min to intensify the sorption of ACT onto ACT-MIP. After the analyte was adsorbed by the sorbent, ACT-MIP were separated from the sample solution using a centrifuge at 3500 rpm for 5 min. The supernatant was discarded, and 1000 µL of methanol and acetic acid was added to the residue, then the mixture was vortexed for 5 min at 800 rpm to elute the retained analyte. Finally, the mixture was separated via centrifugation at 3500 rpm for 5 min and the eluent was analyzed using HPLC-DAD.

2.4.2. Optimization of VA-d-μ-MISPE Procedure Using Design of Experiments (DOE)

Five factors (mass of adsorbent, vortex speed, extraction time, desorption volume, and desorption time) were firstly screened for their effect on analytical response using the 25−1 fractional factorial design (Table 1). Fractional factorial designs were chosen because it is a relatively inexpensive and efficient way to identify the most influential parameters; it allows the attainment of information on main effects and low-order interactions without having to run the full design [29].
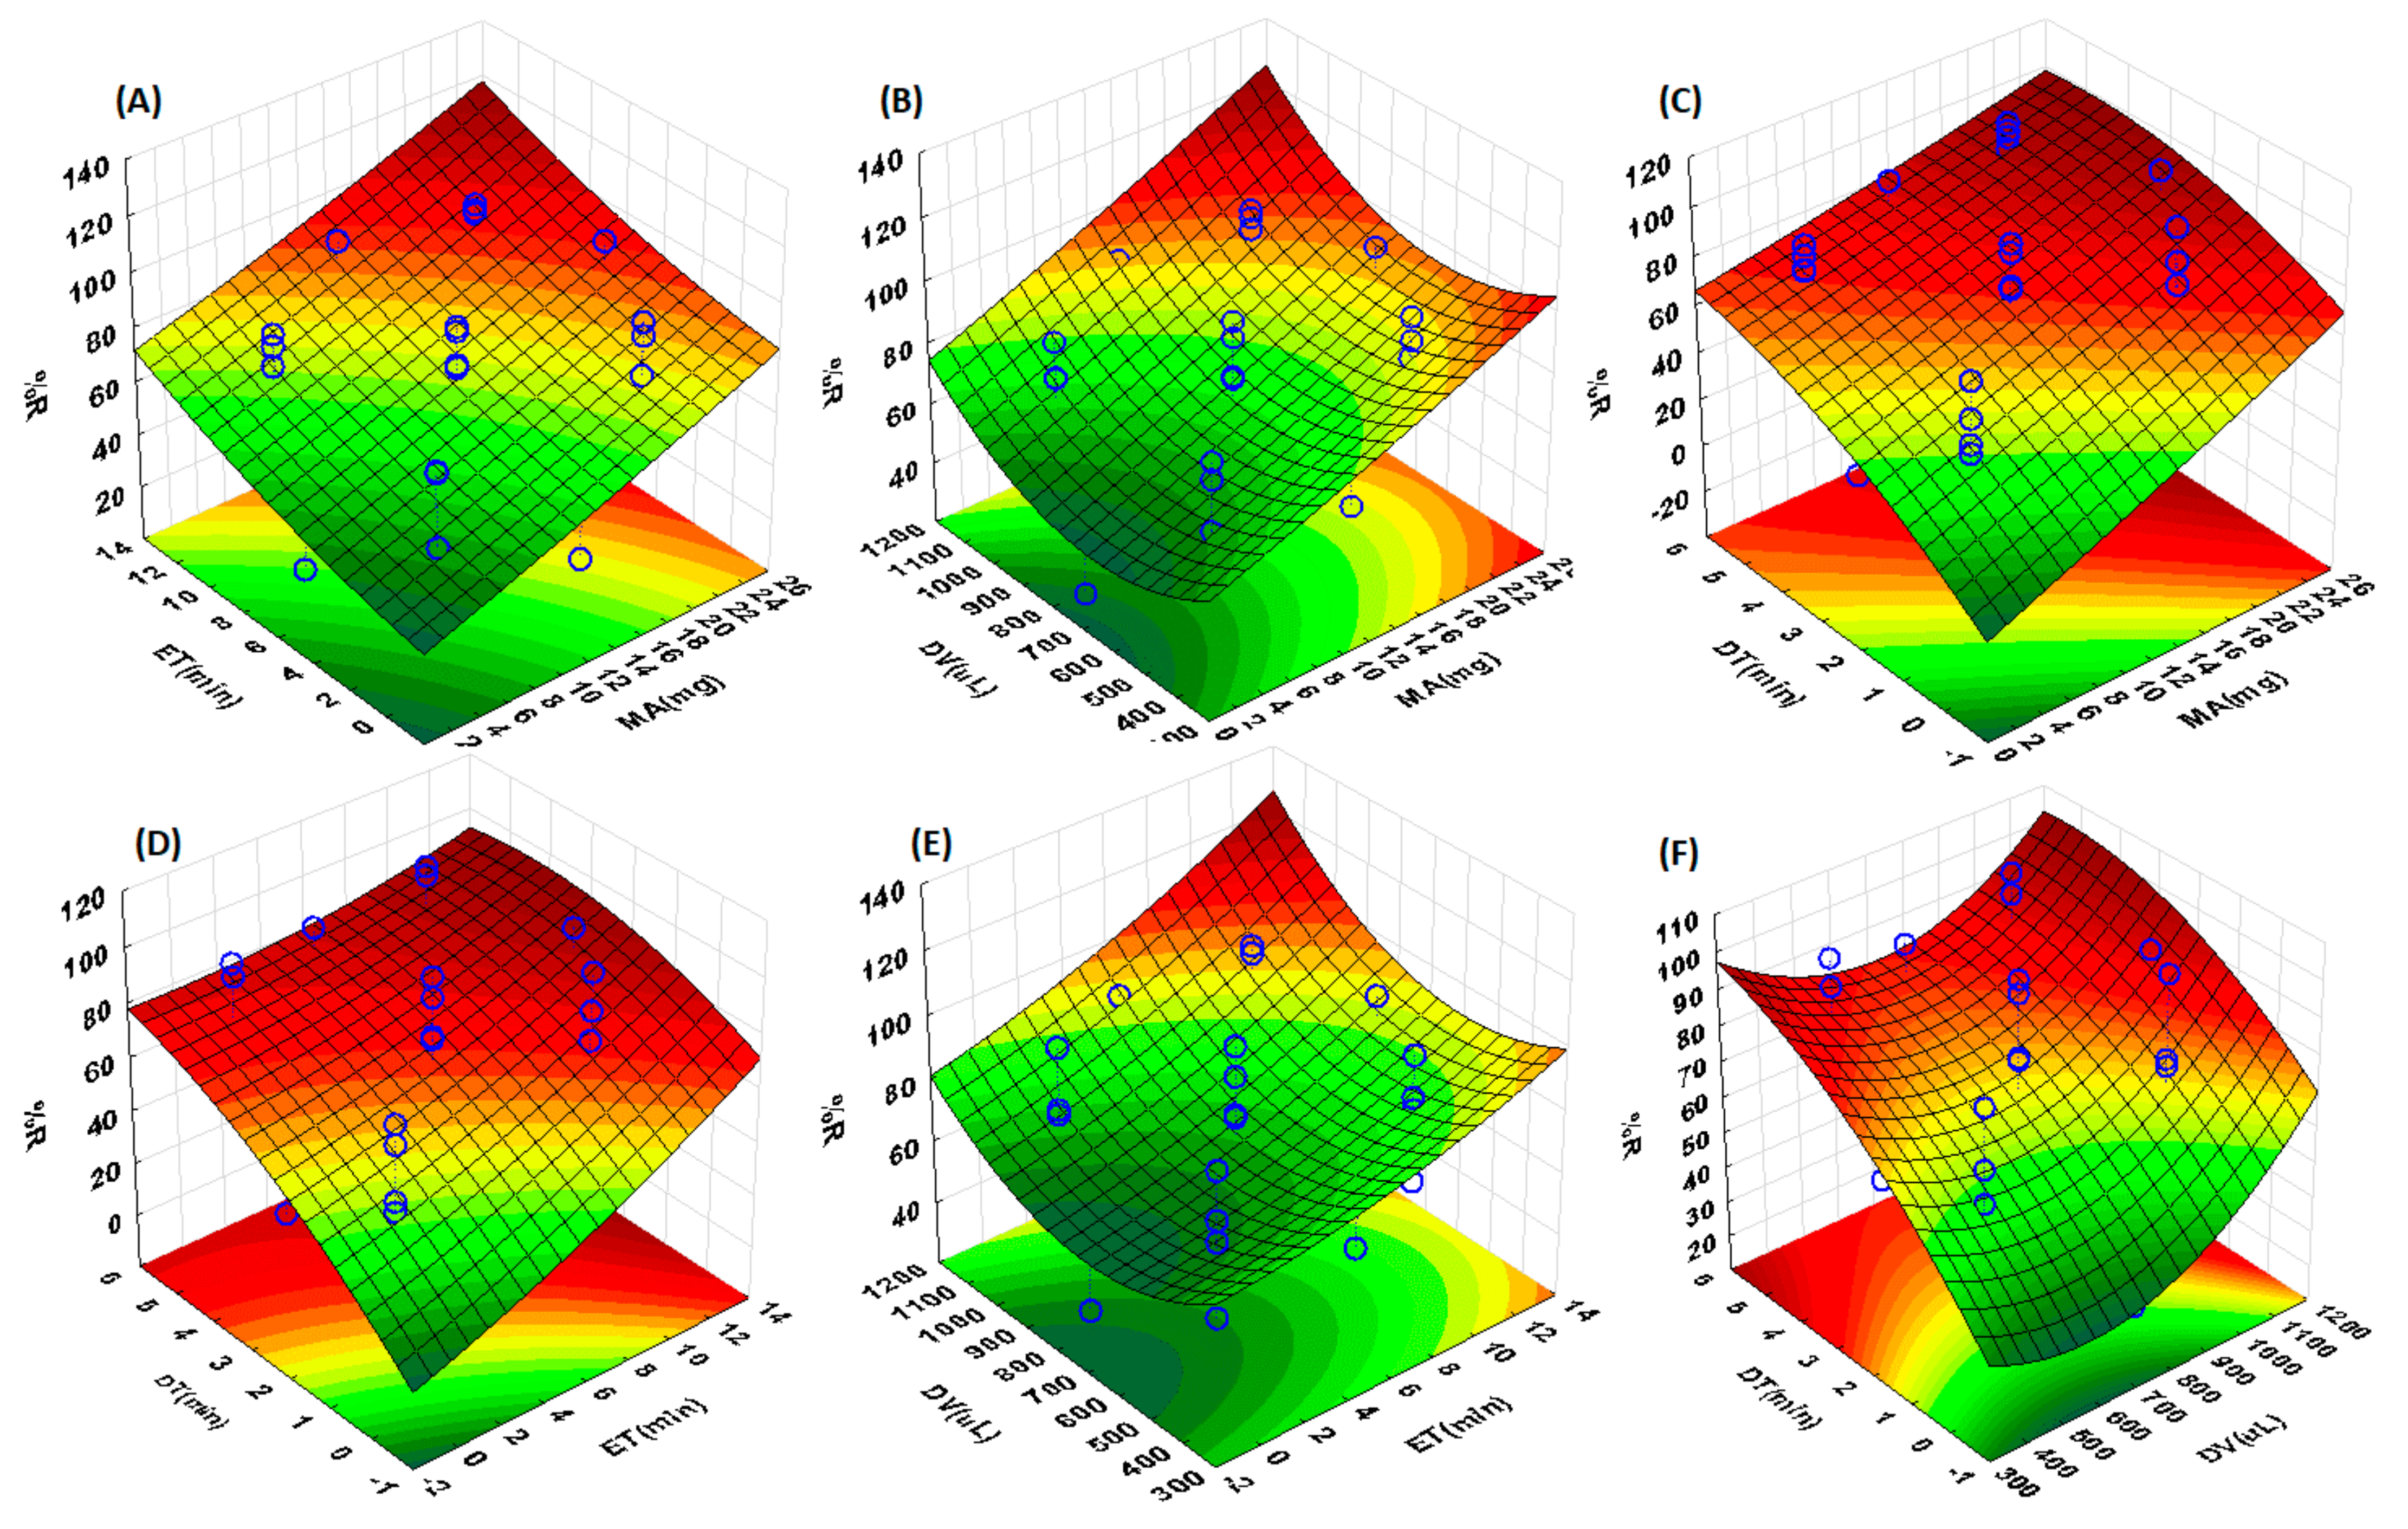
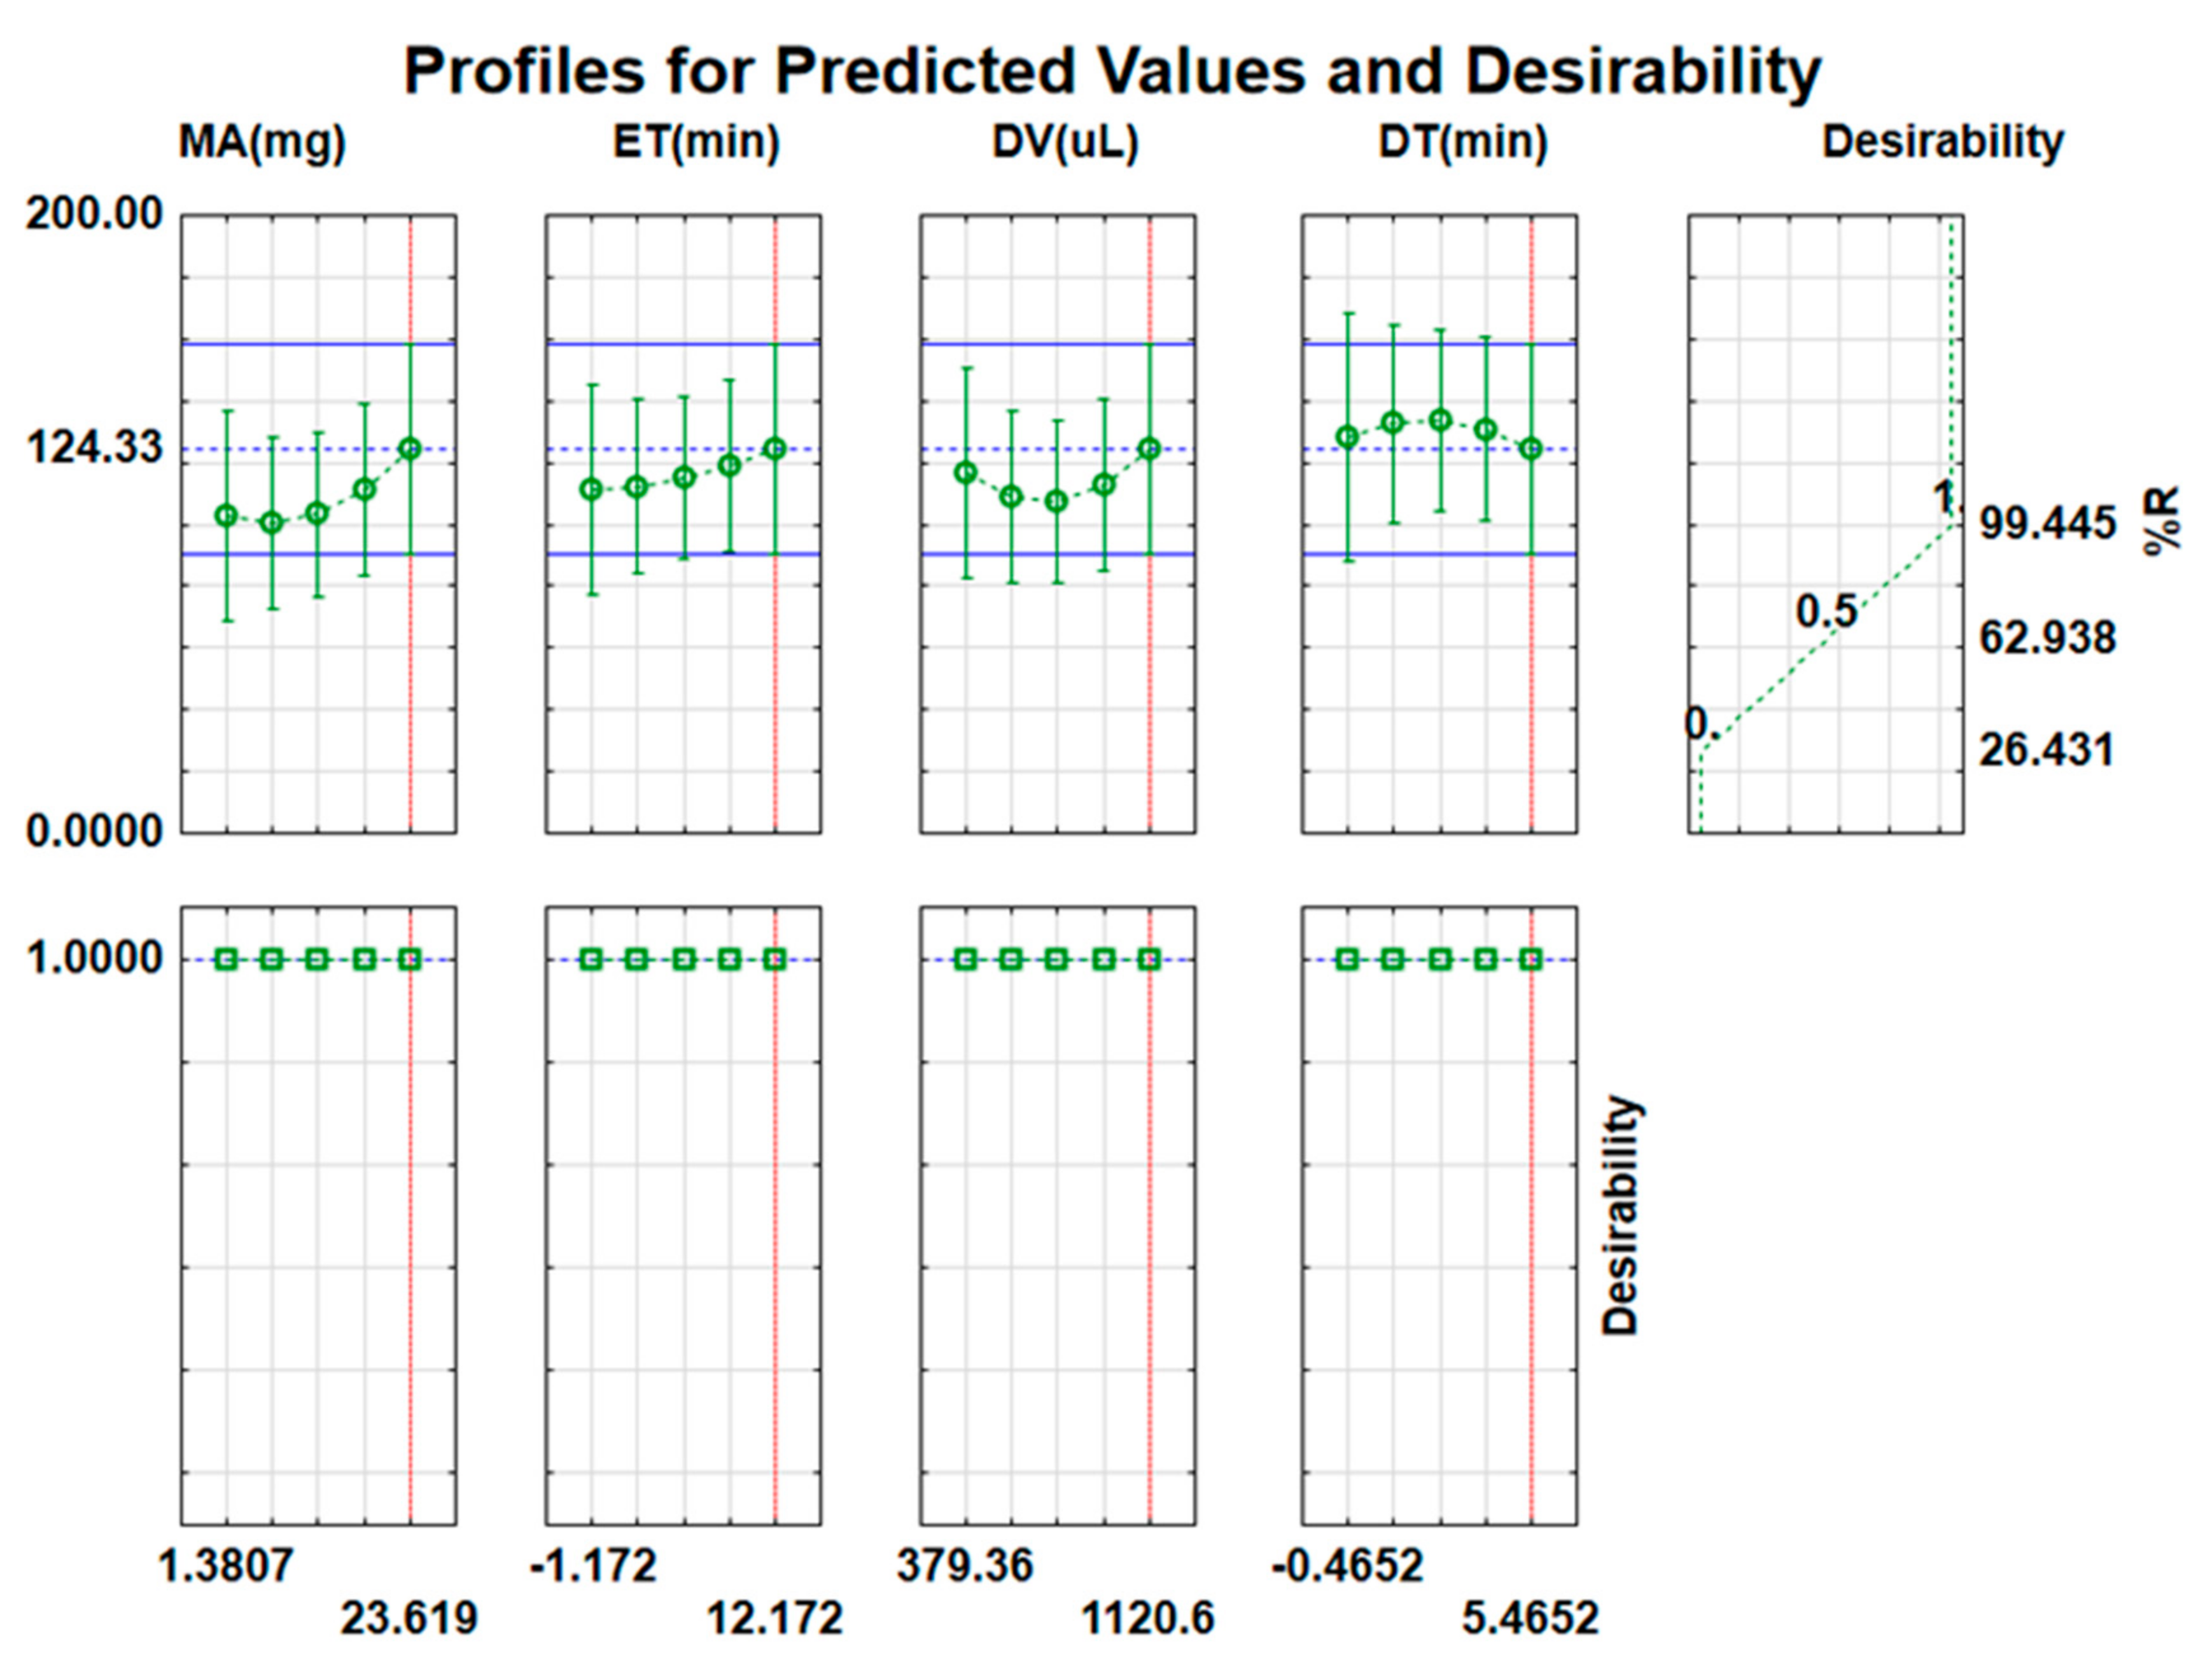
Thereafter, the most influential parameters were obtained and were further optimized using response surface methodology based on central composite design (CCD). CCD was chosen because it stipulates the impact of individual variables (main effects) and their interactions on the analytical response at a cheaper cost and short analysis time. It consists of a full factorial design (±1), axial points (±α), and the central points (0) (Table 2).

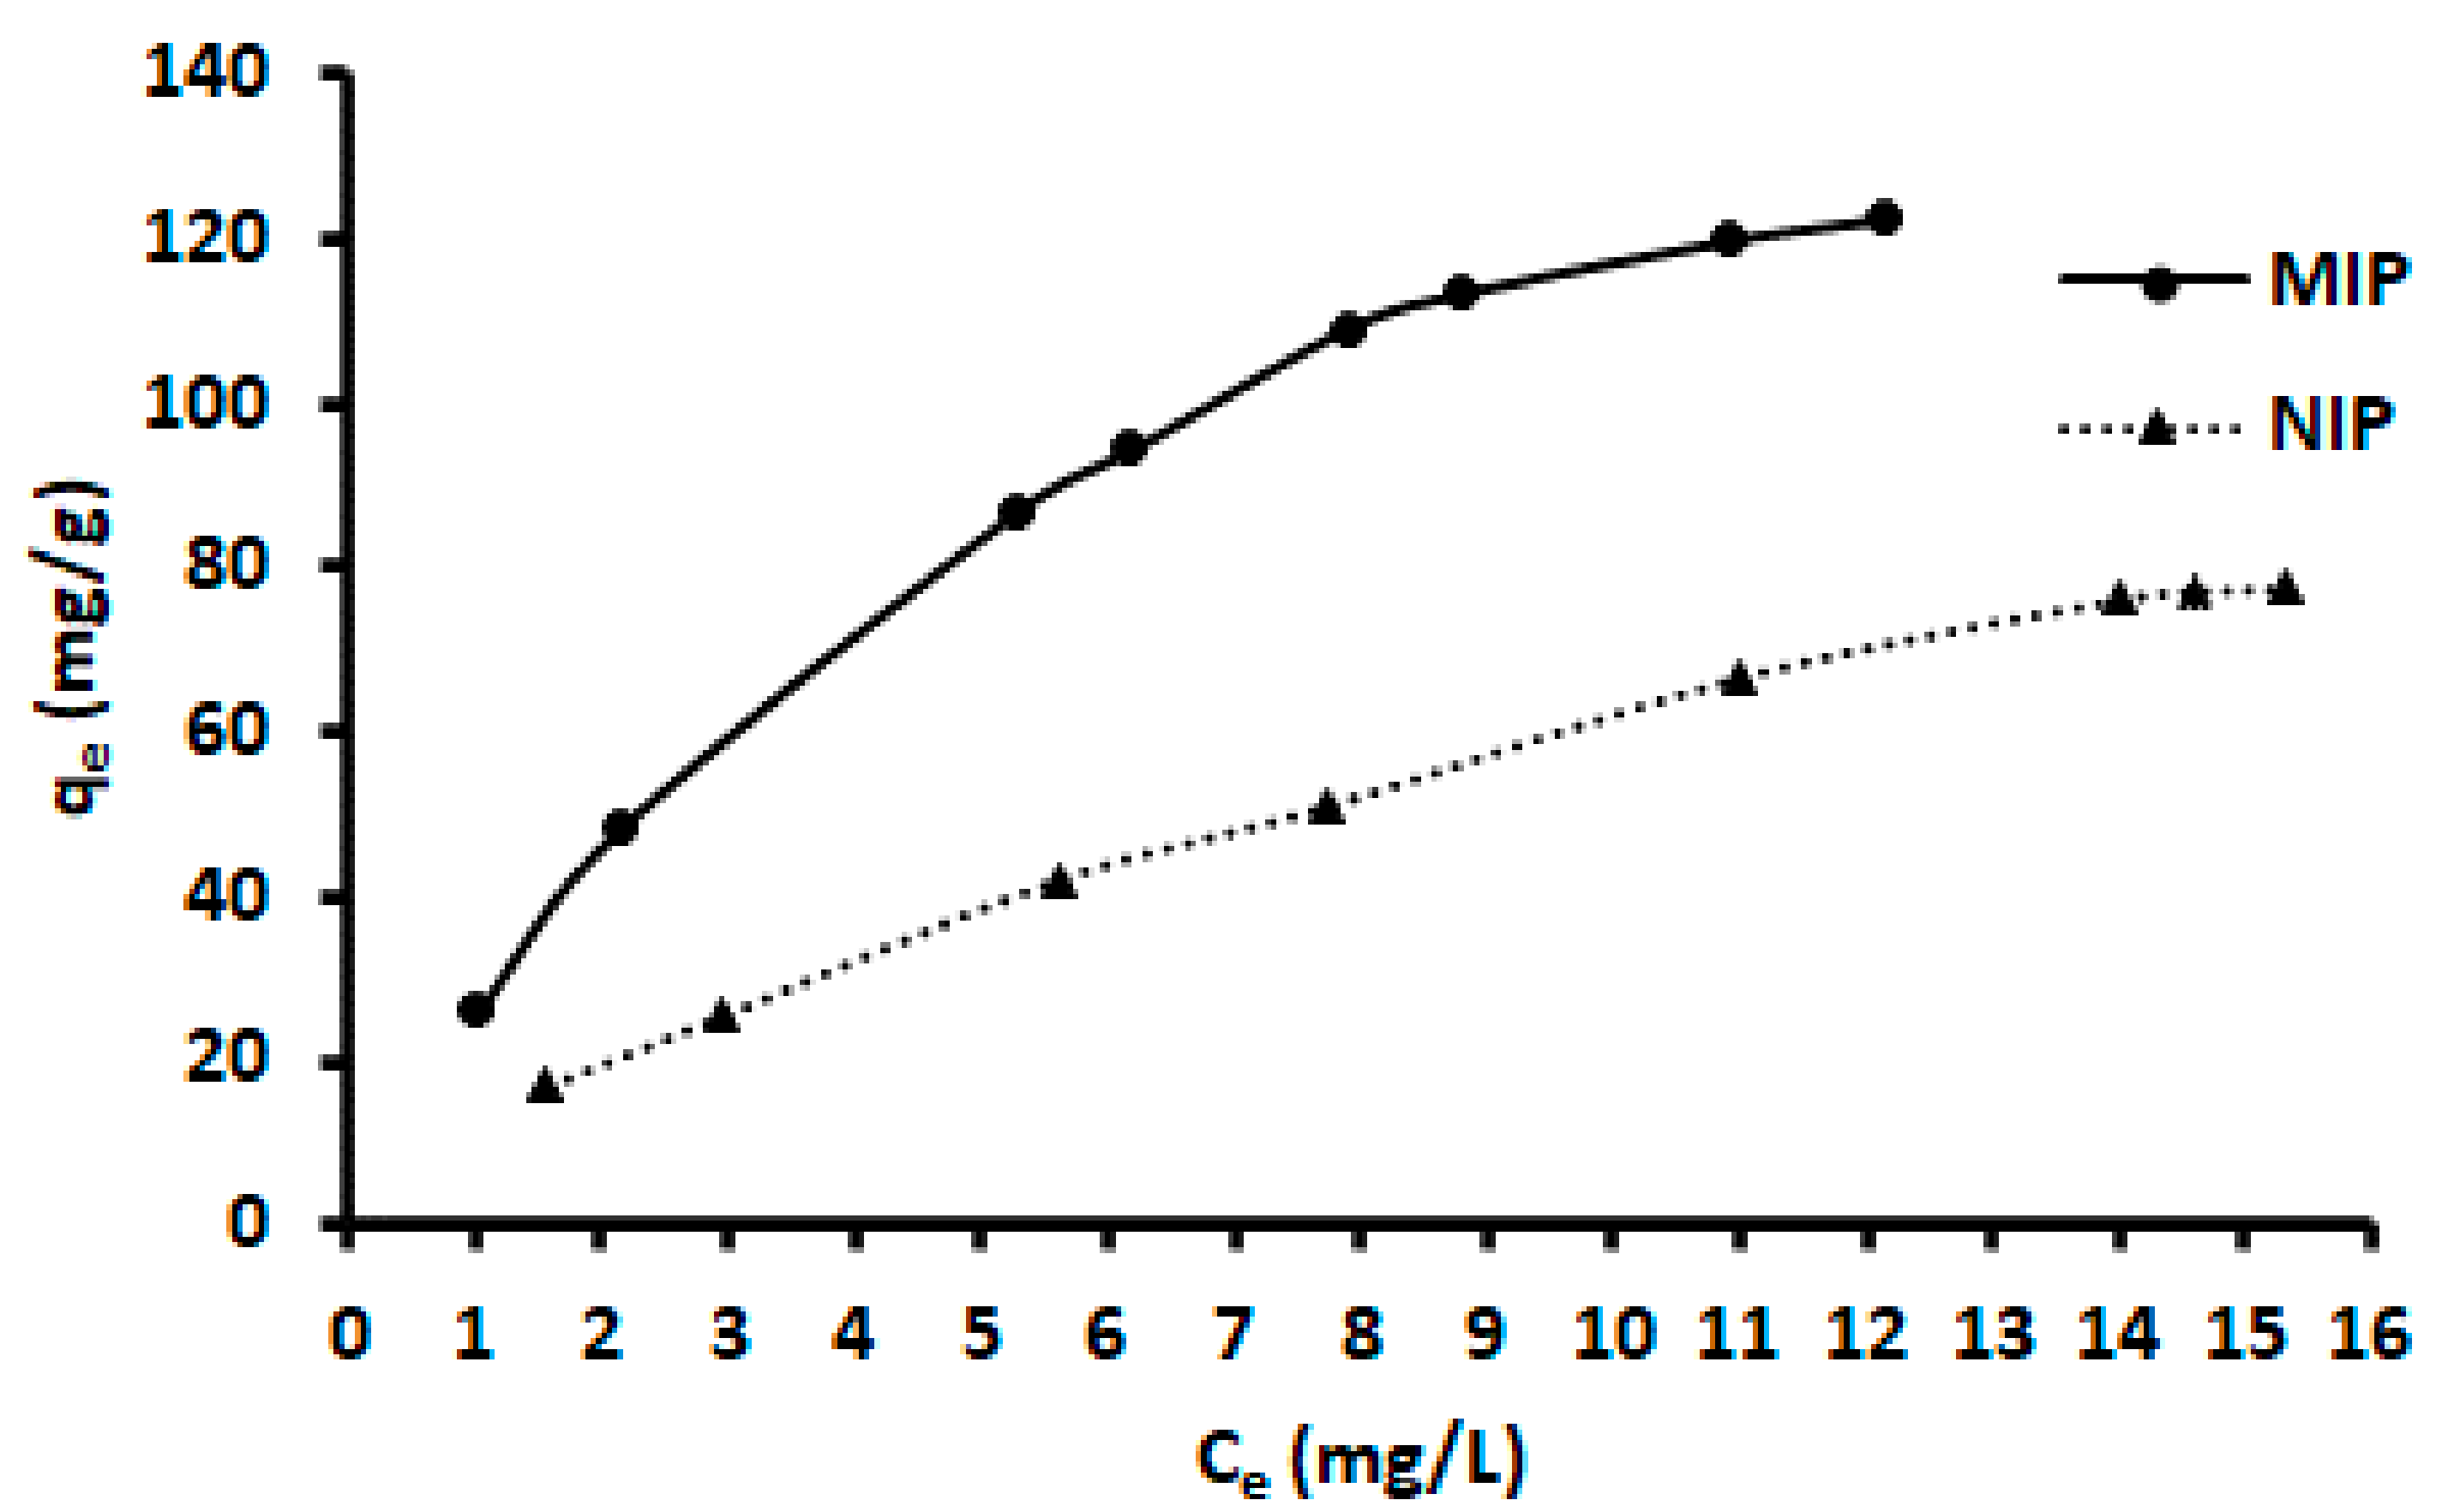
2.5. Adsorption Batch Experiments

The binding capacity of ACT-MIP was investigated by performing batch adsorption equilibrium experiments of ACT. To achieve this, 100 mL ACT solution at different concentrations ranging between 1 and 20 mg/L was added to a 200 mL sample bottle containing 23 mg polymer, and then the mixture was shaken using a vortex for 12 min. After the equilibrium was reached, the adsorbent was separated from the aqueous solution by centrifugation at 5000 rpm for 10 min. The concentrations of ACT before and after adsorption were determined (HPLC-DAD). The binding capacity was estimated using the following expression:
q e = C 0 C e V m
where C0 and 
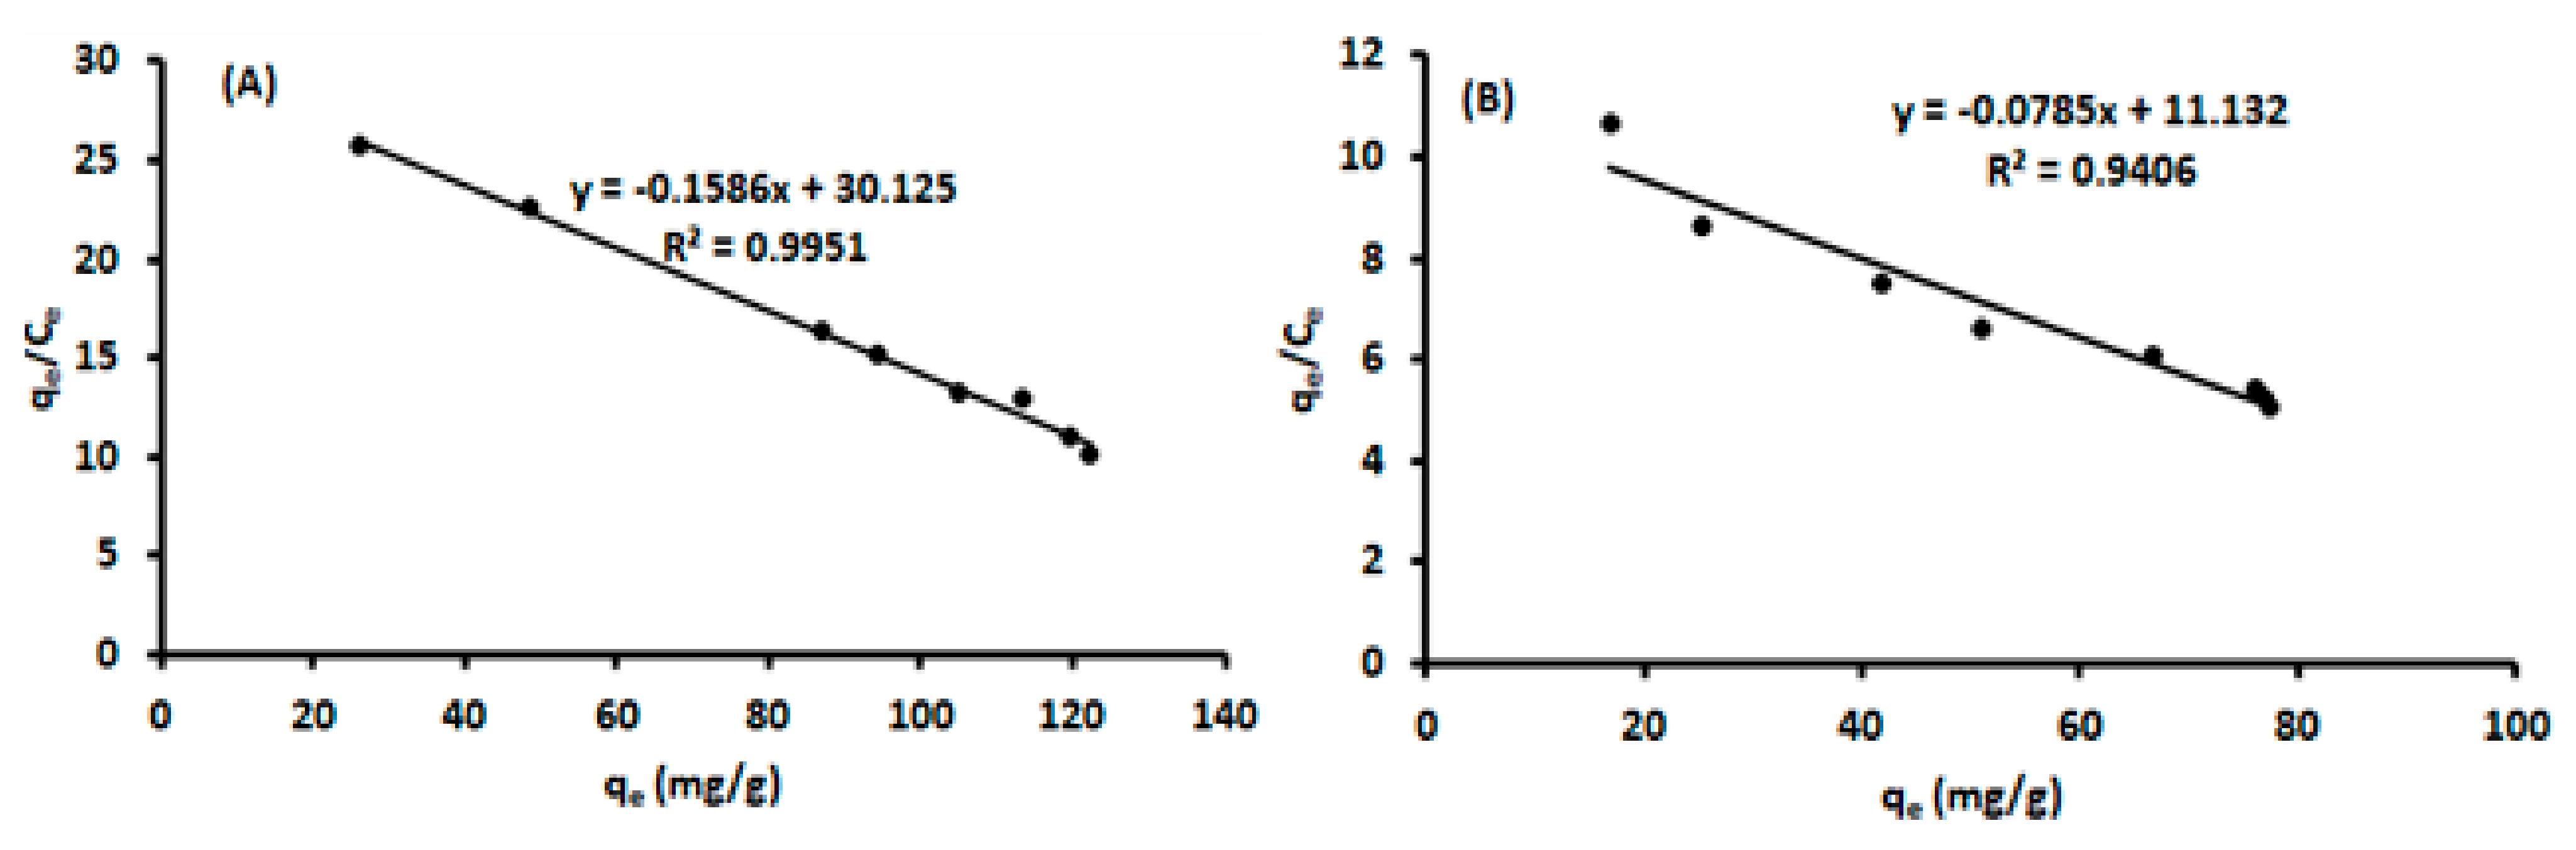
Ce were the initial and equilibrium concentrations ACT (mg/L); V was the volume of synthetic/model solution (L); m was the mass of ACT-MIP (g). The adsorption data were described using five isotherm models [30,31,32], and the equations are presented in Table 3.

2.6. Method Validation

The developed method was validated by evaluating parameters such as the accuracy, precision (intraday (repeatability) and interday (reproducibility), the linear dynamic range, enrichment factor, limit of detection (LOD), and limit of quantification (LOQ). The linearity of the proposed method was carried out by setting a calibration curve using linear regression analysis in the concentration range of 0–1500 µg/L. The accuracy (expressed as recovery percentage) was obtained by recovery studies whereby real water samples were spiked at different concentration levels (0.1, 0.5, and 1.0 μg/L). The LOD and LOQ were calculated using the following expressions: LOD = 3 Sd/b and LOQ = 10 Sd/b, where Sd is the standard deviation of 7 replicate determinations of the lowest concentration of calibration curves (0.5 μg/L), and the slope of each calibration curve is represented as b. For the estimation of LOD and LOQ, blank water samples were spiked with the target analyte at three concentration levels (0.1, 0.5, and 1.0 μg/L).

2.7. Selectivity of ACT-MIP

The selectivity of ACT-MIP was explored using aspirin or acetylsalicylic acid (ASA), which are compounds that have a similar chemical structure to the target analyte. A total of 100 mL model sample solutions of ACT and ASA at 20 mg/L were placed in a sample bottle containing 23 mg of ACT-MIP and NIP. The adsorption process was carried using the procedure described in Section 2.5. The distribution ratio (KD) and selectivity coefficient (α) were calculated using Equations (2) and (3) [33].
K D = C i C f V C f m
where V, Ci, Cf, and m represent the volume of the solution (mL), drug concentration before and after adsorption (mg/L), and mass of the polymer, respectively.
α = K D ACT K D ASA

2.8. Sample Collection and Application of the Proposed Method

The wastewater samples were from the wastewater treatment plant (WWTP), Gauteng Province, Johannesburg, South Africa (Pretoria). Samples were kept in glass bottles and stored in the refrigerator (at 4 °C). Tap water samples were obtained from the University of Johannesburg laboratory taps. The samples were filtered using a microfilter prior to analysis. The optimized conditions were applied in the real sample for extraction and pre-concentration of acetaminophen.

3. Results and Discussion

3.1. Characterization

3.1.1. Fourier Transform Infrared Spectroscopy (FT-IR)

To confirm the successful preparation of ACT-MIP, FT-IR spectra for ACT, ACT-MIP (before template removal), ACT-MIP (after template removal), and NIP were recorded, and they are illustrated in Figure 1. Figure 1A shows the FTIR spectrum of ACT, and it was compared with that of ACT-MIP before removal of the template (Figure 1B). As can be seen, similarities were observed between the two spectra, and it was concluded that ACT was successfully incorporated. This was affirmed by the presence of a new strong absorption peak at 1100 cm−1 on the spectrum of ACT-MIP (before template removal). This peak was attributed to the Si-O-Si stretching vibration. In addition, the peak at around 780 cm−1 in the spectra of ACT-MIP (before template removal) (Figure 1C), ACT-MIP (Figure 1C), and NIP (Figure 1D) are due to the vibration of Si-O groups [34]. These peaks were not observed in Figure 1A, confirming that ACT was imprinted in the polymer matrix (Figure 1B). Lastly, the comparison between the spectrum of ACT-MIP and NIP confirmed the removal of the template. The strong peak at 1038 cm−1 in both ACT-MIP and NIP is attributed to the symmetric stretching vibration peaks of Si-O-Si vibration. In addition, the broad peaks attributed to ACT disappeared in Figure 1C. From Figure 1C,D, ACT-MIP material has almost similar spectra to NIP. This is because the chemical composition of ACT-MIP is more or less identical to that of NIP [33].

3.1.2. X-ray Diffraction (XRD)

Figure 2 shows XRD patterns for the prepared polymers, and the results revealed that both ACT-MIP and NIP were amorphous. This is due to the presence of the broad peak at 2θ values around 20–30°. However, it is worth noticing that ACT-MIP (Figure 2A) had a broader peak and was more amorphous compared with NIP (Figure 2B). It can be concluded that the crystallinity of NIP is higher than that of ACT-MIP. The observed peak at about 23.8 could be assigned to the (220) plane from SiO2, indicating the formation of SiO2 core–shell structure in ACT-MIP and NIP composites [35].

3.1.3. Scanning Electron Microscopy Coupled with Energy-Dispersive X-ray Spectroscopy (SEM/EDS)

The surface morphology of the synthesized ACT-MIP (before template removal), ACT-MIP (after template removal), and NIP was characterized by SEM/EDS, as shown in Figure 3. The SEM images for both ACT-MIP and NIP were almost similar. Figure 3A shows the SEM images of ACT-MIP (before template removal) with smooth spheroidal surface morphology. This might be due to the presence of the template. It can also be observed that most of the particles have aggregated with each other, resulting in irregular surface morphology. EDS analysis was carried out to confirm the presence of components within ACT-MIP, NIP and ACT-MIP (with template) structures Figure 3D–F. Similar spectra were obtained for ACT-MIP and NIP, which only vary in percentages. Roughly, the element composition for ACT-MIP was Si (43.8) and O (53.0%), and NIP was Si (46.3%) and O (50%). An additional carbon element is observed in ACT-MIP (with template): C (29.1%), Si (24.1), O (44.8%), which provided evidence for the presence of ACT before the removal of a template (Figure 3F).

3.1.4. Transmission Electron Microscopy (TEM)

Figure 4 shows TEM images for ACT-MIP and NIP. The polymer layers are surrounding the cores in both images. It can also be noticed that the surface of the materials is made up of irregular shapes.

3.2. Optimization of the Pre-Concentration Procedure

3.2.1. Screening Using Fractional Factorial Design

The effect of independent variables which included the mass of adsorbent (MA), vortex speed (VS), extraction time (ET), desorption volume (DV), and desorption time (DT) on the dependent variable (analytical response, that is, % recovery) was investigated using the 25−2 fractional factorial design (FrFD). The design matrix and the respective experimental responses are presented in Table 4. The obtained results were then subjected to Statistica software to evaluate the most influential parameters on the analytical response. The analysis of variance (ANOVA) results presented in the form of a Pareto chart is illustrated in Figure 5.
As seen in Figure 5, the Pareto chart demonstrated that, for linear terms of all DV, ET, MA, and DT were not statistically significant (p < 0.05), at 95% confidence level. These results confirmed that DV, ET, MA, and DT have the highest influence on the analytical response. Therefore, these parameters were further optimized using RSM based on CCD.
Figure 6 shows that the statistical model fitted well, suggesting that the experimental responses agreed with the predicted values. The coefficient of determination (R2) and adjusted R2 were 0.9722 and 0.9236. These results led to a conclusion that the changes in the investigated factors explain nearly 92% of the variability observed in %R. This further demonstrated that the model was adequate and accurate in predicting the most influential factors.

3.2.2. Response Surface Methodology (RSM) Based on Central Composite Design (CCD)

Influential parameters including the mass of adsorbent, eluent volume, extraction time, and elution time were optimized using RSM based on CCD. The interactive effects of the independent variables were envisioned through the surface contour plot. According to the literature, circular contour plot mostly suggests no significant interaction between variables [36,37]. The ellipse contour plot, on the other hand, suggested that there are significant interactions between variables [36,37]. The combined effects (interactions between factors) of the independent variables on the analytical response are presented in Figure 7. As seen in Figure 7, none of the contour plots had a circular shape, suggesting that the interactions were significant. The 3D surface plots showed that when the mass of adsorbent (MA) is between 22–26 mg, maximum %R is obtained (Figure 7A–C). This is due to the increase in available binding sites when the mass is increased. The interactive effects of ET with MA and DV revealed that better %R could be obtaining when ET is above 12 min (Figure 7A,B,E). The effect of DV (Figure 7B,E,F) combined with other factors such as MA, ET, and DT, revealed that to obtain quantitative recoveries, an eluent volume between 1100–1200 µL is required. The results also showed that there is a strong interactive effect between MA and DT. Lastly, as desorption time reaches 2 min, higher %R is obtained, and this indicates that elution occurs rapidly when higher volumes are used.

3.2.3. Desirability Function

Figure 8 shows the desirability function with predicted values to determine optimum conditions for extraction and preconcentration of acetaminophen. The desirability of 1.0 is for maximum recovery, 0.0 for minimum, and 0.5 for middle. Underneath the left-hand side of this figure, desirability values are given for different parameters, respectively (mass of adsorbent, extraction time, dilution volume, and desorption time). The desirability of 1.0 was assigned as a target value. Based on the desirability function, the maximum recovery was estimated at the following optimum conditions: 100 rpm for vortex speed, 23.6 mg of ACT-MIP, 12.2 min for extraction time, and 1120 µL desorption volume and 5.5 min for desorption time. These optimum conditions were confirmed experimentally (performed in triplicates) and the experimental value (98.7 ± 1.6%) agreed with the predicted value (99.4%), implying that the model was valid and accurate at a 95% confidence level.

3.3. Scatchard Analysis

The equilibrium dissociation constant of ACT-MIP and NIP were estimated using the Scatchard equation (Equation (4)) [38,39].
q e C e = q max K d q e K d
where qe is the amount of ACT bound to the polymer, qmax is the maximum adsorption capacity of the polymer, Kd (mg/L) is the equilibrium dissociation constant of the binding site, and Ce is the equilibrium of ACT concentration (mg/L). The Scatchard analysis stipulates benefits for binding characteristics of ACT-MIP and NIP [39,40]. The plot qe/Ce against qe (Figure 9) showed one straight linear fit for both ACT-MIP and NIP, suggesting that the existence of homogeneous binding sites existed for both polymers [41].
Table 5 shows that MIP had lower Kd and higher qmax values, suggesting that ACT-MIP had higher binding affinity and capacity compared with NIP. These parameters are beneficial with respect to the selective elimination of interferences through the washing of the adsorbent before elution of the target analyte. Furthermore, the higher adsorption capacity and R2 signify that ACT-MIP had the capability of recognizing ACT (template molecule) compared with NIP. The non-linear regression curves for binding of ACT on NIPs suggest that ACT-MIP and NIP have different binding affinity properties [41]. According to the literature, the non-linear nature of NIP is due to the weak interaction of ACT with the functional groups that are randomly arranged on its surface [40]. For ACT-MIP, specific binding sites on the surface matched the ACT (template) in size, shape, and interactions, thus leading to better performance of ACT-MIP compared with NIP [41].

3.4. Adsorption Capacity

The sorption properties of ACT-MIP for ACT were investigated by performing adsorption equilibrium studies. The adsorption capacities of ACT-MIP and NIP estimated at various ACT concentrations are presented in Figure 10. As expected, the amount of ACT bound to the MIP increased as the equilibrium concentration of ACT increased and reached a plateau at maximum equilibrium concentration. The performance of ACT-MIP in comparison with NIP showed that a concentration of ACT bound to ACT-MIP was higher than what was bound to the NIP (Figure 10). This confirmed that the imprinted voids of ACT-MIP led to a high binding affinity of the ACT to the polymer.
The experimental data were fitted to five isotherms such Langmuir, Freundlich, Dubinin–Radushkevich, Sips, and Redlich–Peterson models. The linear fits for each isotherm are presented in Figures S1 and S2 and the respective parameters are in Table 6. Judging from the coefficient of determination (R2) of each model, the equilibrium data fitting followed the trend: Sips > Langmuir > Redlich–Peterson > Dubinin–Radushkevich > Freundlich for ACT-MIP. The trend for NIP was as follows: Freundlich > Redlich–Peterson > Sips > Langmuir > Dubinin–Radushkevich. The results suggest that the monolayer adsorption process took place on the surface of ACT-MIP as opposed to NIP (multilayer adsorption). Based on qmax values of ACT-MIP and NIP obtained from the Langmuir model, the imprinting factor (was calculated to be 1.7 implying that the imprinting was favorable. The maximum adsorption capacity of ACT was estimated to be 133 mg/g for ACT-MIP and 66.4 mg/L for the NIP. The evaluated adsorption capacity is as compared with other related ACT-MIP sorbents described in the literature. The current adsorption capacity was 380, 13, and 1.6 times higher than those reported by [33,42], respectively.

3.5. Selectivity Studies

The results for the selectivity studies, that is, the values for distribution ratio (KD), selectivity coefficient (α), and relative selectively coefficient (α′) of ACT-MIP and NIP are shown in Table 7. As can be seen, high KD values were obtained for ACT, confirming that the prepared ACT-MIP has higher selectivity for the template compound. In addition, the data in Table 7 demonstrate that that ACT-MIP had some affinity for ASA. This might be due to its close similarity to ACT in terms of the functional groups which are arranged by the size of the chemical structure.

3.6. Analytical Figures of Merit

Based on optimum conditions, the analytical performances for the developed method (VA-d-μ-MISPE) for extraction and preconcentration of ACT were evaluated as described in Section 2.5. The LOD, LOQ, linearity, repeatability, reproducibility, and enhancement factor are presented in Table 8. The developed method showed a wide linear range with a correlation coefficient of 0.9959, high enhancement factor, low LOD, and LOQ as well as acceptable precision.

3.7. Comparison of VA-d-μ-MISPE with Other Sample Pre-Treatment Techniques

The proposed method was correlated with other methods which have been explored in the past for extraction and pre-concentration of acetaminophen from different matrices. Linearity, LOD enhancement factor, and RSD were used to measure the difference between the literature and the current work. Compared with other methods, the analytical figures of merit obtained for the work have shown better improvement, whereas similar analytical performance was noticed with other methods (Table 9). It can be concluded that the developed method can be successfully applied in the extraction of acetaminophen, because of its excellent analytical performance.

3.8. Application to Real Samples

The proposed method was successfully validated by spiking real water samples (influent, effluent, and tap water). The samples were spiked at three points, as shown in Table 10. The spike recovery tests were performed to investigate the accuracy and effect sample matrix. Recoveries ranged from 95.3–99.4%, with % RSD ranging from 1.5 to 4.2%. From these results, it can be deduced that interferences in real water samples did not affect the determination of ACT.
The results in Table 10 shows that influent, effluent, and tap water samples contained ACT and concentrations of 3290 ng/L, 2150 ng/L, and 600 ng/L, respectively. The concentration of ACT obtained in this work was compared with those obtained in previous studies. Concentrations of ACT have been reported in different environmental compartments; for instance, high concentrations have been detected in Kenyan river water (16,000 ng/L) [50]. In another study conducted in water collected from the Umgeni River (South Africa), ACT concentrations ranging from 5800–58,700 ng/L were reported [51]. In the Mexican surface water and influent wastewater, the average ACT concentrations were 354–4460 ng/L and 2330–14,900 ng/L [4]. Concentrations of ACT up to 1233 ng/L were detected in the Nigerian Lagoons [52]. The concentration of ACT in a private wastewater treatment facility and receiving water in Korea were found to be 11,331 ng/L and 1586 ng/L, respectively (Kang et al. 2019). Lastly, concentrations of acetaminophen ranging from <1–12,430 ng/L), 2–188 ng/L, and <1–11 ng/L) were found in surface water, groundwater, and drinking water in Lagos State, Nigeria, respectively [53]. The concentration of ACT in this study was found to be within concentration ranges reported in previous studies.

4. Conclusions

In this work, ACT-MIP and NIP were successfully synthesized and applied for the extraction and pre-concentration of ACT from different water samples. The polymers were synthesized by using ACT as the template, methacrylic acid (MAA) as the functional monomer and ethylene glycol dimethylacrylate (EGDMA) as the cross linker. The obtained materials were characterized by SEM, TEM, FT-IR, and XRD. ACT-MIP has shown high selectivity (imprinting factor of 2.44, selectivity factor of 1.48, and selectivity constant of 1.44). In addition, the prepared ACT-MIP demonstrated satisfactory binding properties, and the maximum adsorption capacity was estimated to 191 mg/g. The MISPE coupled to the HPLC-DAD method displayed appropriate selectivity, acceptable precision, and accuracy, as well as a relatively wide linear range. Recoveries greater than 95% were obtained in different water matrices. In view of the above, it can be concluded that the VA-d-μ-MISPE/HPLC-DAD method appears to be a simple, selective, sensitive, rapid, and inexpensive approach for monitoring ACT in environmental matrices.

Supplementary Materials

The following are available online at https://0-www-mdpi-com.brum.beds.ac.uk/article/10.3390/separations8100194/s1, Figure S1: Isotherms models (a) Langmuir, (b) Freundlich, and (c) Dubinin–Radushkevich., Figure S2: Isotherms models (a) Sips and (b) Redlich–Peterson.

Author Contributions

Conceptualization, N.M., A.M. and P.N.N.; methodology, N.M.; software, P.N.N.; validation, N.M., A.M. and P.N.N.; formal analysis, N.M. and P.N.N.; investigation, N.M.; resources, P.N.N.; data curation, N.M., A.M. and P.N.N.; writing—original draft preparation, N.M.; writing—review and editing, P.N.N. and A.M.; visualization, N.M.; supervision, P.N.N.; project administration, P.N.N.; funding acquisition, P.N.N. All authors have read and agreed to the published version of the manuscript.

Funding

This research was funded by Department of Science and Innovation/National Research Foundation South African Research Chairs Initiative (DSI/NRF SARChI), grant no. 91230 and “The APC was funded by University of Johannesburg Research and Publication Trust fund.”

Institutional Review Board Statement

Not applicable.

Informed Consent Statement

Not applicable.

Data Availability Statement

The raw data supporting the conclusions of this article will be made available by the authors when it is required, without any reservation.

Acknowledgments

The authors would like to thank the University of Johannesburg (Chemical sciences department) for providing lab facilities. The authors are also grateful to Siyasanga Mpelane and Orienda Sebabi Molahlegi for their assistance in characterization techniques. This article is based upon work from the Sample Preparation Study Group and Network, supported by the Division of Analytical Chemistry of the European Chemical Society.

Conflicts of Interest

The authors declare no conflict of interest.

References

  1. Ghodsi, J.; Rafati, A.A.; Shoja, Y. Determination of acetaminophen using a glassy carbon electrode modified by horseradish peroxidase trapped in MWCNTs/silica sol-gel matrix. Adv. J. Chem. A 2018, 1, 39–55. [Google Scholar] [CrossRef] [Green Version]
  2. Pires, A.; Almeida, Â.; Calisto, V.; Schneider, R.J.; Esteves, V.I.; Wrona, F.J.; Soares, A.M.; Figueira, E.; Freitas, R. Hediste diversicolor as bioindicator of pharmaceutical pollution: Results from single and combined exposure to carbamazepine and caffeine. Comp. Biochem. Physiol. Part C Toxicol. Pharmacol. 2016, 188, 30–38. [Google Scholar] [CrossRef] [PubMed]
  3. Simón-Herrero, C.; Naghdi, M.; Taheran, M.; Brar, S.K.; Romero, A.; Valverde, J.L.; Ramirez, A.A.; Sánchez-Silva, L. Immobilized laccase on polyimide aerogels for removal of carbamazepine. J. Hazard. Mater. 2019, 376, 83–90. [Google Scholar] [CrossRef] [PubMed]
  4. James, C.A.; Miller-Schulze, J.P.; Ultican, S.; Gipe, A.D.; Baker, J.E. Evaluating Contaminants of Emerging Concern as tracers of wastewater from septic systems. Water Res. 2016, 101, 241–251. [Google Scholar] [CrossRef]
  5. Abbasi, S.; Haeri, S.A.; Sajjadifar, S. Bio-dispersive liquid liquid microextraction based on nano rhamnolipid aggregates combined with molecularly imprinted-solid phase extraction for selective determination of paracetamol in human urine samples followed by HPLC. Microchem. J. 2018, 146, 106–114. [Google Scholar] [CrossRef]
  6. Ratanapongleka, K.; Punbut, S. Removal of acetaminophen in water by laccase immobilized in barium alginate. Environ. Technol. 2017, 39, 336–345. [Google Scholar] [CrossRef] [PubMed]
  7. Lin, C.J.; Yang, W.-T.; Chou, C.-Y.; Liou, S.Y.H. Hollow mesoporous TiO2 microspheres for enhanced photocatalytic degradation of acetaminophen in water. Chemosphere 2016, 152, 490–495. [Google Scholar] [CrossRef]
  8. Saleem, A.; Anwar, S.; Hussain, T.; Ahmad, R.; Mustafa, G.; Ashfaq, M. Simultaneous determination of acetaminophen, pamabrom and pyrilamine maleate in pharmaceutical formulations using stability indicating HPLC assay method. J. Mex. Chem. Soc. 2017, 59, 93–98. [Google Scholar] [CrossRef]
  9. Escapa, C.; Coimbra, R.N.; Neuparth, T.; Torres, T.; Santos, M.M.; Otero, M. Acetaminophen removal from water by microalgae and effluent toxicity assessment by the zebrafish embryo bioassay. Water 2019, 11, 1929. [Google Scholar] [CrossRef] [Green Version]
  10. Dai, Y.; Li, X.; Lu, X.; Kan, X. Voltammetric determination of paracetamol using a glassy carbon electrode modified with Prussian Blue and a molecularly imprinted polymer, and ratiometric read-out of two signals. Microchim. Acta 2016, 183, 2771–2778. [Google Scholar] [CrossRef]
  11. Sharma, B.M.; Bečanová, J.; Scheringer, M.; Sharma, A.; Bharat, G.K.; Whitehead, P.G.; Klanova, J.; Nizzetto, L. Health and ecological risk assessment of emerging contaminants (pharmaceuticals, personal care products, and artificial sweeteners) in surface and groundwater (drinking water) in the Ganges River Basin, India. Sci. Total Environ. 2018, 646, 1459–1467. [Google Scholar] [CrossRef]
  12. Alam, A.U.; Qin, Y.; Howlader, M.M.; Hu, N.-X.; Deen, J. Electrochemical sensing of acetaminophen using multi-walled carbon nanotube and β-cyclodextrin. Sens. Actuators B Chem. 2018, 254, 896–909. [Google Scholar] [CrossRef]
  13. Annadurai, K.; Sudha, V.; Murugadoss, G.; Thangamuthu, R. Electrochemical sensor based on hydrothermally prepared nickel oxide for the determination of 4-acetaminophen in paracetamol tablets and human blood serum samples. J. Alloys Compd. 2020, 852, 156911. [Google Scholar] [CrossRef]
  14. Pugajeva, I.; Rusko, J.; Pērkons, I.; Lundanes, E.; Bartkevics, V. Determination of pharmaceutical residues in wastewater using high performance liquid chromatography coupled to quadrupole-Orbitrap mass spectrometry. J. Pharm. Biomed. Anal. 2017, 133, 64–74. [Google Scholar] [CrossRef] [PubMed]
  15. Sultan, M.A.; Maher, H.M.; Alzoman, N.Z.; Alshehri, M.M.; Rizk, M.S.; Elshahed, M.S.; Olah, I.V. Capillary electrophoretic determination of antimigraine formulations containing caffeine, ergotamine, paracetamol and domperidone or metoclopramide. J. Chromatogr. Sci. 2012, 51, 502–510. [Google Scholar] [CrossRef] [PubMed] [Green Version]
  16. Su, C.; Li, Z.; Zhang, D.; Wang, Z.; Zhou, X.; Liao, L.; Xiao, X. A highly sensitive sensor based on a computer-designed magnetic molecularly imprinted membrane for the determination of acetaminophen. Biosens. Bioelectron. 2019, 148, 111819. [Google Scholar] [CrossRef]
  17. Dinç, E.; Ertekin, Z.C.; Ünal, N. Three-way analysis of pH-UV absorbance dataset for the determination of paracetamol and its pKa value in presence of excipients. Spectrochim. Acta Part A Mol. Biomol. Spectrosc. 2020, 230, 118049. [Google Scholar] [CrossRef]
  18. Revankar, S.N.; Desai, N.D.; Bhatt, A.D. Rapid determination of rifampicin in human plasma by high performance liquid chromatography. Indian Drugs 2000, 37, 323–327. [Google Scholar]
  19. Geib, T.; Lento, C.; Wilson, D.J.; Sleno, L. Liquid Chromatography-Tandem Mass Spectrometry Analysis of Acetaminophen Covalent Binding to Glutathione S-Transferases. Front. Chem. 2019, 7, 558. [Google Scholar] [CrossRef] [PubMed] [Green Version]
  20. de Holanda, L.F.; Ribeiro, F.W.P.; Sousa, C.P.; Casciano, P.N.D.S.; de Lima-Neto, P.; Correia, A.N. Multi-walled carbon nanotubes–cobalt phthalocyanine modified electrode for electroanalytical determination of acetaminophen. J. Electroanal. Chem. 2016, 772, 9–16. [Google Scholar] [CrossRef]
  21. Sadutto, D.; Ruiz, R.A.; Picó, Y. Systematic assessment of extraction of pharmaceuticals and personal care products in water and sediment followed by liquid chromatography–tandem mass spectrometry. Anal. Bioanal. Chem. 2020, 412, 113–127. [Google Scholar] [CrossRef]
  22. Jain, R.; Kumari, A.; Khatri, I. Simple and rapid analysis of acetaminophen in human autopsy samples by vortex-assisted dispersive liquid–liquid microextraction-thin layer chromatography-image analysis. Sep. Sci. Plus. 2021, 4, 92–100. [Google Scholar] [CrossRef]
  23. Zia, A.I.; Mukhopadhyay, S.; Yu, P.-L.; Al-Bahadly, I.; Gooneratne, C.P.; Kosel, J. Rapid and molecular selective electrochemical sensing of phthalates in aqueous solution. Biosens. Bioelectron. 2014, 67, 342–349. [Google Scholar] [CrossRef]
  24. Liang, W.; Lu, Y.; Li, N.; Li, H.; Zhu, F. Microwave-assisted synthesis of magnetic surface molecular imprinted polymer for adsorption and solid phase extraction of 4-nitrophenol in wastewater. Microchem. J. 2020, 159, 105316. [Google Scholar] [CrossRef]
  25. Cantarella, M.; Carroccio, S.C.; Dattilo, S.; Avolio, R.; Castaldo, R.; Puglisi, C.; Privitera, V. Molecularly imprinted polymer for selective adsorption of diclofenac from contaminated water. Chem. Eng. J. 2019, 367, 180–188. [Google Scholar] [CrossRef]
  26. da Silva, L.C.; Souza, M.C.; Sumere, B.R.; Silva, L.G.; da Cunha, D.T.; Barbero, G.F.; Bezerra, R.M.; Rostagno, M.A. Simultaneous extraction and separation of bioactive compounds from apple pomace using pressurized liquids coupled on-line with solid-phase extraction. Food Chem. 2020, 318, 126450. [Google Scholar] [CrossRef]
  27. Li, S.; Wen, J.; He, B.; Wang, J.; Hu, X.; Liu, J. Occurrence of caffeine in the freshwater environment: Implications for ecopharmacovigilance. Environ. Pollut. 2020, 263, 114371. [Google Scholar] [CrossRef] [PubMed]
  28. Xu, W.; Zhang, X.; Huang, W.; Luan, Y.; Yang, Y.; Zhu, M.; Yang, W. Synthesis of surface molecular imprinted polymers based on carboxyl-modified silica nanoparticles with the selective detection of dibutyl phthalate from tap water samples. Appl. Surf. Sci. 2017, 426, 1075–1083. [Google Scholar] [CrossRef]
  29. Noah, N.F.M.; Othman, N.; Jusoh, N. The use of factorial design in screening of factors influencing hexavalent chromium extraction by continuous green emulsion liquid membrane. IOP Conf. Ser. Mater. Sci. Eng. 2018, 458, 012032. [Google Scholar] [CrossRef] [Green Version]
  30. Tran, T.; Nguyen, D.T.C.; Nguyen, T.T.; Pham, Q.T.; Vo, D.-V.N.; Nguyen, T.-D.; Van Pham, T.; Nguyen, T.D. Linearized and nonlinearized modellings for comparative uptake assessment of metal-organic framework-derived nanocomposite towards sulfonamide antibiotics. Environ. Sci. Pollut. Res. 2020, 1–16. [Google Scholar] [CrossRef]
  31. Nebaghe, K.; El Boundati, Y.; Ziat, K.; Naji, A.; Rghioui, L.; Saidi, M. Comparison of linear and non-linear method for determination of optimum equilibrium isotherm for adsorption of copper(II) onto treated Martil sand. Fluid Phase Equilibria 2016, 430, 188–194. [Google Scholar] [CrossRef]
  32. Ho, Y.-S.; Wang, C.-C. Sorption equilibrium of mercury onto ground-up tree fern. J. Hazard. Mater. 2008, 156, 398–404. [Google Scholar] [CrossRef] [PubMed]
  33. Azodi-Deilami, S.; Najafabadi, A.H.; Asadi, E.; Abdouss, M.; Kordestani, D. Magnetic molecularly imprinted polymer nanoparticles for the solid-phase extraction of paracetamol from plasma samples, followed its determination by HPLC. Microchim. Acta 2014, 181, 1823–1832. [Google Scholar] [CrossRef]
  34. Montaseri, H.; Forbes, P.B. Molecularly imprinted polymer coated quantum dots for fluorescence sensing of acetaminophen. Mater. Today Commun. 2018, 17, 480–492. [Google Scholar] [CrossRef]
  35. Rafigh, S.M.; Heydarinasab, A. Mesoporous Chitosan–SiO2 Nanoparticles: Synthesis, Characterization, and CO2 Adsorption Capacity. ACS Sustain. Chem. Eng. 2017, 5, 10379–10386. [Google Scholar] [CrossRef]
  36. Benyahia, N.; Belkhouche, N.; Jönsson, J. A comparative study of experimental optimization and response surface methodology of Bi(III) extraction by emulsion organophosphorus liquid membrane. J. Environ. Chem. Eng. 2014, 2, 1756–1766. [Google Scholar] [CrossRef]
  37. Rosly, M.B.; Jusoh, N.; Othman, N.; Rahman, H.A.; Noah, N.F.M.; Sulaiman, R.N.R. Effect and optimization parameters of phenol removal in emulsion liquid membrane process via fractional-factorial design. Chem. Eng. Res. Des. 2019, 145, 268–278. [Google Scholar] [CrossRef]
  38. Zengin, A.; Badak, M.U.; Bilici, M.; Suludere, Z.; Aktaş, N. Preparation of molecularly imprinted PDMS elastomer for selective detection of folic acid in orange juice. Appl. Surf. Sci. 2018, 471, 168–175. [Google Scholar] [CrossRef]
  39. Han, Y.; Wang, Z.; Jia, J.; Bai, L.; Liu, H.; Shen, S.; Yan, H. Newly designed molecularly imprinted 3-aminophenol-glyoxal-urea resin as hydrophilic solid-phase extraction sorbent for specific simultaneous determination of three plant growth regulators in green bell peppers. Food Chem. 2019, 311, 125999. [Google Scholar] [CrossRef]
  40. El-Akaad, S.; Mohamed, M.A.; Abdelwahab, N.S.; Abdelaleem, E.A.; De Saeger, S.; Beloglazova, N. Capacitive sensor based on molecularly imprinted polymers for detection of the insecticide imidacloprid in water. Sci. Rep. 2020, 10, 1–10. [Google Scholar] [CrossRef] [PubMed]
  41. Long, Z.; Xu, W.; Lu, Y.; Qiu, H. Nanosilica-based molecularly imprinted polymer nanoshell for specific recognition and determination of rhodamine B in red wine and beverages. J. Chromatogr. B Anal. Technol. Biomed. Life Sci. 2016, 1029–1030, 230–238. [Google Scholar] [CrossRef]
  42. Jafari, M.T.; Rezaei, B.; Bahrami, H. Magnetic dual-template molecularly imprinted polymer nanoparticles for the simultaneous determination of acetaminophen and codeine in urine samples by ion mobility spectrometry. Anal. Sci. 2018, 34, 297–303. [Google Scholar] [CrossRef] [Green Version]
  43. Lopes, V.S.A.; Riente, R.R.; da Silva, A.A.; Torquilho, D.F.; Carreira, R.; Marques, M. Development of a solid-phase extraction system modified for preconcentration of emerging contaminants in large sample volumes from rivers of the lagoon system in the city of Rio de Janeiro, Brazil. Mar. Pollut. Bull. 2016, 110, 572–577. [Google Scholar] [CrossRef]
  44. Hashemi, S.H.; Kaykhaii, M.; Keikha, A.J.; Naruie, N. Application of molecularly imprinted polymer pipette tip micro-solid phase extraction of nalidixic acid and acetaminophen from pills and seawater samples and their determination by spectrophotometry. Chem. Pap. 2020, 74, 4009–4023. [Google Scholar] [CrossRef]
  45. Wei, Y.; Zeng, Q.; Bai, S.; Wang, M.; Wang, L. Nanosized Difunctional Photo Responsive Magnetic Imprinting Polymer for Electrochemically Monitored Light-Driven Paracetamol Extraction. ACS Appl. Mater. Interfaces 2017, 9, 44114–44123. [Google Scholar] [CrossRef] [PubMed]
  46. Yang, H.; Liu, B.; Ding, Y.; Li, L.; Ouyang, X. Fabrication of cuprous oxide nanoparticles-graphene nanocomposite for determination of acetaminophen. J. Electroanal. Chem. 2015, 757, 88–93. [Google Scholar] [CrossRef]
  47. Lotfi, S.; Veisi, H. Pd nanoparticles decorated poly-methyldopa@GO/Fe3O4 nanocomposite modified glassy carbon electrode as a new electrochemical sensor for simultaneous determination of acetaminophen and phenylephrine. Mater. Sci. Eng. C 2019, 105, 110112. [Google Scholar] [CrossRef] [PubMed]
  48. Khoshhesab, Z.M. Simultaneous electrochemical determination of acetaminophen, caffeine and ascorbic acid using a new electrochemical sensor based on CuO-graphene nanocomposite. RSC Adv. 2015, 5, 95140–95148. [Google Scholar] [CrossRef]
  49. Ulusoy, H.I.; Yilmaz, E.; Soylak, M. Magnetic solid phase extraction of trace paracetamol and caffeine in synthetic urine and wastewater samples by a using core shell hybrid material consisting of graphene oxide/multiwalled carbon nanotube/Fe3O4/SiO2. Microchem. J. 2018, 145, 843–851. [Google Scholar] [CrossRef]
  50. K’Oreje, K.O.; Demeestere, K.; De Wispelaere, P.; Vergeynst, L.; Dewulf, J.; Van Langenhove, H. From multi-residue screening to target analysis of pharmaceuticals in water: Development of a new approach based on magnetic sector mass spectrometry and application in the Nairobi River basin, Kenya. Sci. Total. Environ. 2012, 437, 153–164. [Google Scholar] [CrossRef]
  51. Agunbiade, F.O.; Moodley, B. Pharmaceuticals as emerging organic contaminants in Umgeni River water system, KwaZulu-Natal, South Africa. Environ. Monit. Assess. 2014, 186, 7273–7291. [Google Scholar] [CrossRef] [PubMed]
  52. Folarin, O.; Otitoloju, A.; Amaeze, N.; Saliu, J. Occurrence of Acetaminophen, Amoxicillin, Diclofenac and Methylparaben in Lagos and Ologe Lagoons, Lagos, Nigeria. J. Appl. Sci. Environ. Manag. 2020, 23, 2143. [Google Scholar] [CrossRef] [Green Version]
  53. Ebele, A.J.; Oluseyi, T.; Drage, D.S.; Harrad, S.; Abdallah, M.A.-E. Occurrence, seasonal variation and human exposure to pharmaceuticals and personal care products in surface water, groundwater and drinking water in Lagos State, Nigeria. Emerg. Contam. 2020, 6, 124–132. [Google Scholar] [CrossRef]
Figure 1. FTIR spectra for (A) ACT, (B) ACT-MIP (before template removal), (C) ACT-MIP, and (D) NIP.
Separations 08 00194 g001
Figure 2. X-ray diffraction (XRD) patterns of (A) ACT-MIP, (B) NIP.
Separations 08 00194 g002
Figure 3. SEM (A) ACT-MIP (before template removal), (B) ACT-MIP and (C) NIP and EDS images of (D) ACT-MIP (before template removal), (E) ACT-MIP and (F) NIP.
Separations 08 00194 g003
Figure 4. TEM images of (A) ACT-MIP and (B) NIP.
Separations 08 00194 g004
Figure 5. Pareto chart of standardized effects for the investigated parameter for extraction and pre-contraction of acetaminophen.
Separations 08 00194 g005
Figure 6. Plot of predicted values versus experimental response values.
Separations 08 00194 g006
Figure 7. 3D response surface plots showing effects of on percentage recovery (%R) of ACT. The individual figures represent the interactions between (A) extraction time (ET) and mass of adsorbent (MA), (B) desorption volume (DV) and MA, (C) desorption time (DT) and MA, (D) DT and extraction time (ET), (E) DV and ET, (F) DT and DV.
Separations 08 00194 g007
Figure 8. Desirability function profile for percentage recovery (%R) of ACT.
Separations 08 00194 g008
Figure 9. Scatchard plot of (A) ACT on MIP and (B) NIP Experimental parameters: initial concentration, 1–20 mg/L, mass of adsorbent, 23 mg; contact time, 12 min, sample pH; sample volume, 100 mL.
Separations 08 00194 g009
Figure 10. Adsorption isotherm for MIP (circle) and NIP (triangle). Experimental parameters: initial concentration, 1–20 mg/L, the mass of adsorbent, 23 mg; contact time, 12 min, sample pH; sample volume, 100 mL.
Separations 08 00194 g010
Table 1. Parameters and levels used in 25−1 fractional factorial design for extraction and pre-concentration of ACT.
ParametersMinimum (−1)Central Point (0)Maximum (+1)
Mass of adsorbent (MA),(mg)512.520
Vortex speed (VS), (rpm)1005001000
Extraction time (EXT), (min)15.510
Desorption time (DT), (min)5007501030
Desorption volume (DV), (µL)1.03.05.0
Table 2. Parameters and levels used in CCD experimental design.
Parameters−α−10+1
Mass of adsorbent (mg)1.07512.52023.9
Extraction time(min)1.415.51012.4
Desorption volume (µL)368.850075010001131
Desorption time(min)0.5512,555.5
pH4.45799.6
Table 3. Linear equations of isotherm models.
Isotherm ModelLinear Equations
Langmuir C e q e = 1 K L q max C e + 1 q max
Freundlich ln q e = ln K F + 1 n ln C e
Dubinin–Radushkevich ln q e = ln q D R β ε 2 , ε = RTln 1 + 1 C e
Sips 1 q e = 1 K s q mS 1 C e 1 n S + 1 q mS
Redlich–Peterson ln K R C e q e 1 = b R lnC e + ln α R
qe: amount adsorbed; qmax: maximum monolayer adsorption; KL (L/mg): Langmuir constant; Ce; concentration of adsorbate at equilibrium; KF (mg/L)−1/n): adsorption capacity; 1/n: adsorption intensity; β: Dubinin–Radushkevich constant: E: mean adsorption energy (kJ/mol); ε: Polanyi potential; R: gas constant; T: temperature; KR, bR, and αR: Redlich–Peterson constants; qmS (mg/g): Sips maximum adsorption capacity; KS (mg/L)−1/nS) Sips isotherm model constant; nS: Sips isotherm model exponent.
Table 4. Design matrix with respective experimental analytical responses obtained using screening process using 2-level FrFD during the extraction and pre-concentration of ACT using VA-d-μ-MISPE.
Experimental RunsMA(mg)VS(rpm)ET(min)DV(µL)DT(min)%R
1510011000562.4
2201001500196.1
359001500590.7
42090011000196.3
55100101000169.3
62010010500596.9
7590010500157.2
820900101000560.0
9 (C) a12.55005.5750367.5
10 (C)12.55005.5750396.7
11 (C)12.55005.5750398.4
12 (C)12.55005.5750397.9
a C represents central points of the FrFD.
Table 5. The results of Scatchard analysis for ACT by ACT-MIP and NIP.
ParametersACT-MIPNIP
Kd (L/mg)6.312.7
Qmax (mg/g)191142
R20.99510.9406
Table 6. Isotherm parameters for the adsorption of ACT by ACT-MIP and NIP.
IsothermsParametersACT-MIPNIP
Langmuirqmax (mg/g)18771.4
KL(L/mg)1.61.9
R20.99580.9674
FreundlichKF (mg/L)−1/n26.012.2
n1.51.5
R20.93660.9982
Dubinin–RadushkevichqD-R (mg/g)18164.7
E (kJ/mol)30.20.289
R20.98000.8124
SipsqmS (mg/g):19170.4
KS (mg/L)−1/nS1.11.7
nS0.250.17
R20.99980.9903
Redlich–PetersonKR2727
bR1.40.43
αR0.0613
R20.98940.9916
Table 7. Distribution ratio (KD) and selectivity coefficient (α) values for ACT-MIP and NIP.
Analytes Distribution Ratio (KD) mL/gSelectivity Coefficient (α)α’
ACT-MIPNIPACT-MIPNIP
ACT29415.2
ASA25.114.911.71.0211.4
Table 8. Analytical figures of merit in ultrapure water.
Analytical Performance ParametersValue
Linearity (µg/L)LOQ-500
Coefficient of determination0.9959
LOD (µg/L)0.19
LOQ (µg/L)0.63
Repeatability (%RSD, n = 10)2
Reproducibility (%RSD, n = 5 working days)4.2
Enhancement factor79
Table 9. Comparison studies.
Matrix AdsorbentInstrumentLinearity LOD RSD%References
River waterPhenomenex Strata-X reverse phase cartridgesSPE-HPLC-MS-TOF1.73 × 10−8 mol/L0.500 mg/L [43]
seawater samplesmolecularly imprinted polymerSpectrophotometry1.0–100.0 µg/L0.3µg/L3.0[44]
Human urinemagnetic electrochemical imprinting sensorHPLC-UV0.001 to 0.7 mmol/L and 0.7 to 7 mmol/L0.000 43 mmol/L2.32–3.21[45]
Pharmaceutical samplesCu2O/GR/GCESquare wave voltammetry (SWV)0.02–1.3 M6.67 × 10−9 M2.6–3.0[46]
Human serum samples.(GO/Fe3O4@PMDA/Pd/GCE)Differentia l pulse voltammetry (DPV)0.05–3 nM7.8 nM4.1, 4.3[47]
Blood serum, urine, and pharmaceutical samples.CuO nanoparticles/graphene nanosheetsDifferential pulse voltammetry0.025–5.3 µmol/L0.008µmol/L2.7[48]
Urine and tablet samplesSolGel/HRP/MWCNT/GCE 1.85–2700 nM0.018 nM [1]
Urine and wastewater samples(GO/MWCNT/Fe3O4/SiO2)HPLC-UV10–1000 ng/mL3.32 ng/mL2.5[49]
Urine samplesMagnetic molecular imprinted polymerIon mobility spectrometry0.20–2.00.05μg/mL [42]
Human plasmaMIPHPLC1–300 µg/L0.17 µg/L [33]
Water samplesACT-MIPHPLC-DAD0.63–500 µg/L0.19 µg/L2This study
Table 10. Accuracy and precision of (VA-d-μ-MISPE) method for extraction and pre-concentration of ACT in real samples.
SamplesAdded (µg/L)Found (µg/L)%R%RSD
Influent03.29 ± 0.14-4.2
14.24 ± 0.1495.33.3
58.13 ± 0.2296.72.8
1013.1 ± 0.397.82.3
Effluent02.15 ± 0.07-3.2
13.13 ± 0.1197.43.5
57.06 ± 0.1598.22.1
1012.0 ± 0.298.51.5
Tap water00.63 ± 0.02-2.4
11.62 ± 0.0398.51.7
55.59 ± 0.0999.11.6
1010.6 ± 0.1899.41.7
Publisher’s Note: MDPI stays neutral with regard to jurisdictional claims in published maps and institutional affiliations.

