
Determination of Sr–Nd–Pb Isotopic Ratios of Rock Reference Materials Using Column Separation Techniques and TIMS


Abstract
:1. Introduction
2. Materials and Methods
2.1. Reagents, Labware, and Chromatographic Materials
2.2. Sample Digestion
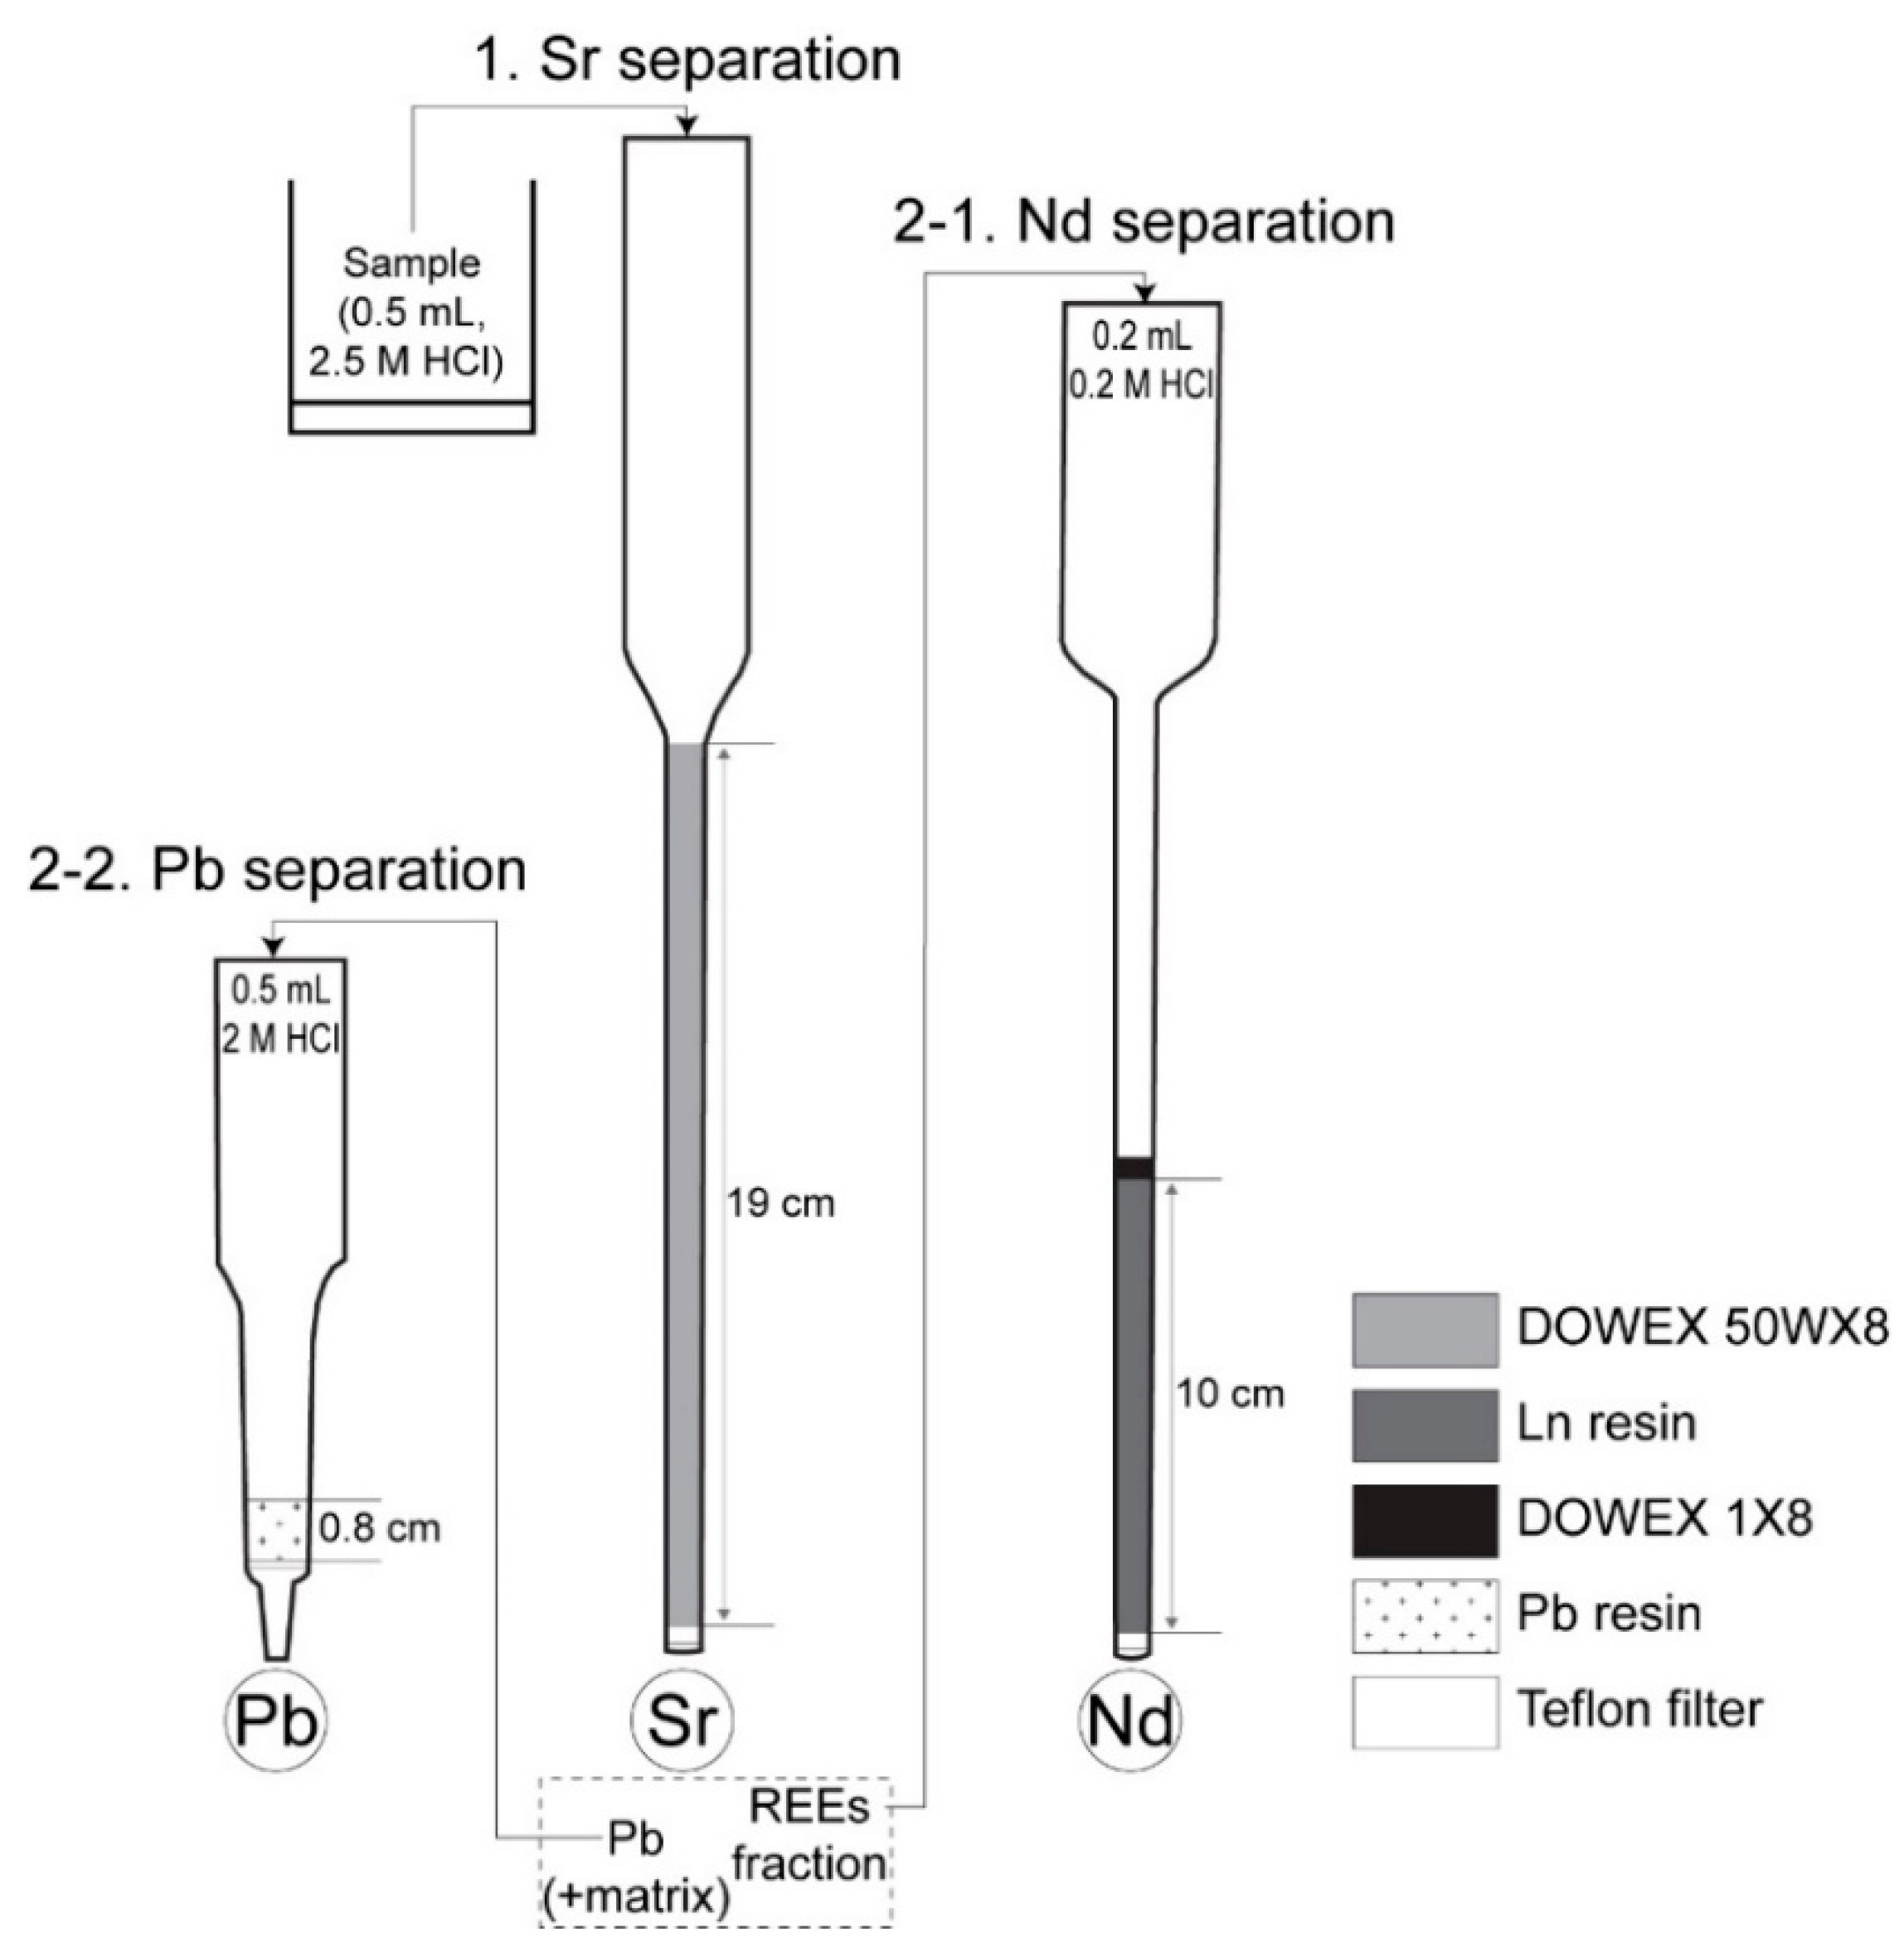
2.3. Sr–Nd–Pb Separation
2.4. TIMS Sr–Nd–Pb Isotope Analyses
3. Results and Discussion
4. Conclusions
Author Contributions
Funding
Institutional Review Board Statement
Informed Consent Statement
Data Availability Statement
Acknowledgments
Conflicts of Interest
References
- Faure, G.; Mensing, T.A. Isotopes: Principles and Applications, 3rd ed.; John Wiley & Sons, Inc.: New York, NY, USA, 2005; p. 897. [Google Scholar]
- Rudnick, R.L.; Gao, S. Composition of the continental crust. In The Crust; Rudnick, R.L., Ed.; Elsevier: Amsterdam, The Netherlands, 2003; Volume 3, pp. 1–64. [Google Scholar]
- Dhuime, B.; Wuestefeld, A.; Hawkesworth, C.J. Emergence of modern continental crust about 3 billion years ago. Nat. Geosci. 2015, 8, 552–555. [Google Scholar] [CrossRef]
- Hawkesworth, C.J.; Cawood, P.A.; Dhuime, B.; Kemp, T.I.S. Earth’s Continental Lithosphere through Time. Annu. Rev. Earth Planet Sci. 2017, 45, 169–198. [Google Scholar] [CrossRef] [Green Version]
- Gao, S.; Rudnick, R.L.; Yuan, H.; Liu, X.; Liu, Y.; Xu, W.; Ling, W.; Ayers, J.; Wang, X.; Wang, Q. Recycling lower continental crust in the North China craton. Nature 2004, 432, 892–897. [Google Scholar] [CrossRef] [PubMed]
- Chauvel, C.; Lewin, E.; Carpentier, M.; Arndt, N.T.; Marini, J.C. Role of recycled oceanic basalt and sediment in generating the Hf–Nd mantle array. Nat. Geosci. 2008, 1, 64–67. [Google Scholar] [CrossRef]
- Spencer, C.J.; Murphy, J.B.; Kirkland, C.L.; Liu, Y.; Mitchell, R.N. A Palaeoproterozoic tectono-magmatic lull as a potential trigger for the supercontinent cycle. Nat. Geosci. 2018, 11, 97–101. [Google Scholar] [CrossRef]
- Chapman, J.B.; Ducea, M.N. The role of arc migration in Cordilleran orogenic cyclicity. Geology 2019, 47, 627–631. [Google Scholar] [CrossRef]
- Ducea, M.N.; Barton, M.D. Igniting flare-up events in Cordilleran arcs. Geology 2007, 35, 1047–1050. [Google Scholar] [CrossRef]
- Slovak, N.M.; Paytan, A. Application of Sr isotopes in archaeology. In Handbook of Environmental Isotope Geochemistry; Baskaran, M., Ed.; Springer: Berlin/Heidelberg, Gernmany, 2012; Volume 1, pp. 743–768. [Google Scholar]
- Font, L.; Jonker, G.; van Aalderen, P.A.; Schiltmans, E.F.; Davies, G.R. Provenancing of unidentified World War II casualties: Application of strontium and oxygen isotope analysis in tooth enamel. Sci. Justice 2015, 55, 10–17. [Google Scholar] [CrossRef]
- Coelho, I.; Castanheira, I.; Bordado, J.M.; Donard, O.; Silva, J.A.L. Recent developments and trends in the application of strontium and its isotopes in biological related fields. TrAC-Trends Anal. Chem. 2017, 90, 45–61. [Google Scholar] [CrossRef]
- Crowley, B.E.; Miller, J.H.; Bataille, C.P. Strontium isotopes (87Sr/86Sr) in terrestrial ecological and palaeoecological research: Empirical efforts and recent advances in continental-scale models. Biol. Rev. 2017, 92, 43–59. [Google Scholar] [CrossRef]
- Cheng, Y.; Zhang, R.; Li, T.; Zhang, F.; Russell, J.; Guan, M.; Han, Q.; Zhou, Y.; Xiao, X.; Wang, X. Spatial distributions and sources of heavy metals in sediments of the Changjiang Estuary and its adjacent coastal areas based on mercury, lead and strontium isotopic compositions. Catena 2019, 174, 154–163. [Google Scholar] [CrossRef]
- Nakano, T.; Yamashita, K.; Ando, A.; Kusaka, S.; Saitoh, Y. Geographic variation of Sr and S isotope ratios in bottled waters in Japan and sources of Sr and S. Sci. Total Environ. 2020, 704, 135449. [Google Scholar] [CrossRef] [PubMed]
- Lee, S.G.; Koh, D.C.; Ha, K.; Ko, K.S.; Lee, Y.S.; Jung, Y.Y.; Cheng, Z.; Chen, S.S. Geochemical Implication of Chemical Composition of Mineral Water (Bottled Water) Produced Near Mt. Baekdu (Changbai), Northeast China. Water 2021, 13, 2191. [Google Scholar] [CrossRef]
- Shirahata, H.; Ellias, R.W.; Patterson, C.C.; Koide, M. Chronological variations in concentrations and isotopic compositions of anthropogenic atmospheric lead in sediments of a remote subalpine pond. Geochim. Cosmochim. Acta 1980, 44, 149–162. [Google Scholar] [CrossRef]
- Elbaz-Poulichet, F.; Holliger, P.; Huang, W.W.; Martin, J.M. Lead cycling in estuaries, illustrated by the Gironde estuary, France. Nature 1984, 308, 409–411. [Google Scholar] [CrossRef]
- Farmer, J.G.; Eades, L.J.; Mackenzie, A.B.; Kirika, A.; Bailey-Watts, T.E. Stable lead isotope record of lead pollution in Loch Lomond sediments since 1630 AD. Environ. Sci. Technol. 1996, 30, 3080–3083. [Google Scholar] [CrossRef]
- Monna, F.; Dominik, J.; Loizeau, J.L.; Pardos, M.; Arpagaus, P. Origin and Evolution of Pb in Sediments of Lake Geneva (Switzerland-France). Establishing a Stable Pb Record. Environ. Sci. Technol. 1999, 33, 2850–2857. [Google Scholar] [CrossRef]
- Townsend, A.T.; Snape, I. The use of Pb isotope ratios determined by magnetic sector ICP-MS for tracing Pb pollution in marine sediments near Casey Station, East Antarctica. J. Anal. At. Spectrom. 2002, 17, 922–928. [Google Scholar] [CrossRef] [Green Version]
- Shotyk, W.; Weiss, D.J.; Appleby, P.G.; Cheburkin, A.K.; Frei, R.; Gloor, M.; Kramers, J.D.; Reese, S.; Van Der Knaap, W.O. History of atmospheric lead deposition since 12,370 14C yr BP from a peat bog, Jura Mountains, Switzerland. Science 1998, 281, 1635–1640. [Google Scholar] [CrossRef] [Green Version]
- Weiss, D.; Shotyk, W.; Appleby, P.G.; Kramers, J.D.; Cheburkin, A.K. Atmospheric Pb deposition since the industrial revolution recorded by five Swiss peat profiles: Enrichment factors, fluxes, isotopic composition, and sources. Environ. Sci. Technol. 1999, 33, 1340–1352. [Google Scholar] [CrossRef]
- Novák, M.; Emmanuel, S.; Vile, M.A.; Erel, Y.; Véron, A.; Paces, T.; Wieder, R.K.; Vanecek, M.; Stepanova, M.; Brizova, E.; et al. Origin of lead in eight Central European peat bogs determined from isotope ratios, strengths, and operation times of regional pollution sources. Environ. Sci. Technol. 2003, 37, 437–445. [Google Scholar] [CrossRef] [PubMed]
- Rosman, K.J.R.; Chisholm, W.; Boutron, C.F.; Candelone, J.P.; Goerlach, U. Isotopic evidence for the source of lead in Greenland snows since the late 1960s. Nature 1993, 362, 333–335. [Google Scholar] [CrossRef] [PubMed]
- Simonetti, A.; Gariépy, C.; Carignan, J. Pb and Sr isotopic compositions of snowpack from Québec, Canada: Inferences on the sources and deposition budgets of atmospheric heavy metals. Geochim. Cosmochim. Acta 2000, 64, 5–20. [Google Scholar] [CrossRef]
- Walraven, N.; van Os, B.J.H.; Klaver, G.T.; Baker, J.H.; Vriend, S.P. Trace element concentrations and stable lead isotopes in soils as tracers of lead pollution in Graft-De Rijp, The Netherlands. J. Geochem. Explor. 1997, 59, 47–58. [Google Scholar] [CrossRef]
- Hansmann, W.; Köppel, V. Lead-isotopes as tracers of pollutants in soils. Chem. Geol. 2000, 171, 123–144. [Google Scholar] [CrossRef]
- Marcantonio, F.; Flowers, G.; Thien, L.; Ellgaard, E. Lead isotopes in tree rings: Chronology of pollution in Bayou Trepagnier, Louisiana. Environ. Sci. Technol. 1998, 32, 2371–2376. [Google Scholar] [CrossRef]
- Watmough, S.A.; Hughes, R.J.; Hutchinson, T.C. 206Pb/207Pb Ratios in Tree Rings as Monitors of Environmental change. Environ. Sci. Technol. 1999, 33, 670–673. [Google Scholar] [CrossRef]
- Patrick, G.J.; Farmer, J.G. A stable lead isotopic investigation of the use of sycamore tree rings as a historical biomonitor of environmental lead contamination. Sci. Total Environ. 2006, 362, 278–291. [Google Scholar] [CrossRef]
- Carignan, J.; Gariépy, C. Isotopic composition of epiphytic lichens as a tracer of sources of atmospheric lead emissions in southern Québec, Canada. Geochim. Cosmochim. Acta 1995, 59, 4427–4433. [Google Scholar] [CrossRef]
- Monna, F.; Aiuppa, A.; Varrica, D.; Dongarra, G. Pb isotope composition in lichens and aerosols from eastern Sicily: Insights into the regional impact of volcanoes on the environment. Environ. Sci. Technol. 1999, 33, 2517–2523. [Google Scholar] [CrossRef]
- Doucet, F.J.; Carignan, J. Atmospheric Pb isotopic composition and trace metal concentration as revealed by epiphytic lichens: An investigation related to two altitudinal sections in Eastern France. Atmos. Environ. 2001, 35, 3681–3690. [Google Scholar] [CrossRef]
- Cloquet, C.; Carignan, J.; Libourel, G. Atmospheric pollutant dispersal around an urban area using trace metal concentrations and Pb isotopic compositions in epiphytic lichens. Atmos. Environ. 2006, 40, 574–587. [Google Scholar] [CrossRef]
- Kylander, M.E.; Weiss, D.J.; Jeffries, T.E.; Kober, B.; Dolgopolova, A.; Garcia-Sanchez, R.; Coles, B.J. A rapid and reliable method for Pb isotopic analysis of peat and lichens by laser ablation-quadrupole-inductively coupled plasma-mass spectrometry for biomonitoring and sample screening. Anal. Chim. Acta 2007, 582, 116–124. [Google Scholar] [CrossRef] [PubMed]
- Makishima, A. Thermal Ionization Mass Spectrometry (TIMS): Silicate Digestion, Separation, and Measurement; John Wiley & Sons, Inc: Weinheim, Germany, 2016; p. 339. [Google Scholar]
- Ehrlich, S.; Gavrieli, I.; Dor, L.B.; Halicz, L.J. Direct high-precision measurements of the 87Sr/86Sr isotope ratio in natural water, carbonates and related materials by multiple collector inductively coupled plasma mass spectrometry (MC-ICP-MS). J. Anal. At. Spectrom. 2001, 16, 1389–1392. [Google Scholar] [CrossRef]
- Yang, Y.H.; Wu, F.Y.; Xie, L.W.; Yang, J.H.; Zhang, Y.B. High-precision direct determination of the 87Sr/86Sr isotope ratio of bottled Sr-rich natural mineral drinking water using multiple collector inductively coupled plasma mass spectrometry. Spectrochim. Acta Part B 2011, 66, 656–660. [Google Scholar] [CrossRef]
- Li, C.F.; Guo, J.H.; Chu, Z.Y.; Feng, L.J.; Wang, X.C. Direct high-precision measurements of the 87Sr/86Sr isotope ratio in natural water without chemical separation using thermal ionization mass spectrometry equipped with 1012 Ω resistors. Anal. Chem. 2015, 87, 7426–7432. [Google Scholar] [CrossRef] [PubMed]
- Raczek, I.; Jochum, K.P.; Hofmann, A.W. Neodymium and strontium isotope data for USGS reference materials BCR-1, BCR-2, BHVO-1, BHVO-2, AGV-1, AGV-2, GSP-1, GSP-2 and eight MPI-DING reference glasses. Geostand. Geoanal. Res. 2003, 27, 173–179. [Google Scholar] [CrossRef]
- Lee, H.M.; Jo, H.J.; Kim, T.H. Lead isotope measurement of geological reference materials using thermal ionization mass spectrometry. Anal. Sci. Technol. 2020, 33, 245–251, (In Korean with English abstract). [Google Scholar]
- Yokoyama, T.; Makishima, A.; Nakamura, E. Evaluation of the coprecipitation of incompatible trace elements with fluoride during silicate rock dissolution by acid digestion. Chem. Geol. 1999, 157, 175–187. [Google Scholar] [CrossRef]
- Lee, H.M. Geochemical and isotopic characteristics of the Pirrit Hills granite in West Antarctica. Ph.D. Thesis, Kongju National University, South Korea, 2013. [Google Scholar]
- Lee, H.M.; Lee, S.G.; Tanaka, T. The effect of eluent concentration on the separation of Nd with Ln-resin method. J. Petrol. Soc. Korea 2015, 24, 365–371, (In Korean with English abstract). [Google Scholar] [CrossRef] [Green Version]
- Stein, M.; Starinsky, A.; Katz, A.; Glodstein, S.L.; Machlus, M.; Schramm, A. Strontium isotopic, chemical, and sedimentological evidence for the evolution of Lake Lisan and the Dead Sea. Geochim. Cosmochim. Acta 1997, 61, 3975–3992. [Google Scholar] [CrossRef]
- Yuan, H.; Yuan, W.; Cheng, C.; Liang, P.; Liu, X.; Dai, M.; Bao, Z.; Zong, C.; Chen, K.; Lai, S. Evaluation of lead isotope compositions of NIST NBS 981 measured by thermal ionization mass spectrometer and multiple-collector inductively coupled plasma mass spectrometer. Solid Earth Sci. 2016, 1, 74–78. [Google Scholar] [CrossRef] [Green Version]
- Tanaka, R.; Makishima, A.; Kitagawa, H.; Nakamura, E. Suppression of Zr, Nb, Hf and Ta coprecipitation in fluoride compounds for determination in Ca-rich materials. J. Anal. At. Spectrom. 2003, 18, 1458–1463. [Google Scholar] [CrossRef]
- Pretorius, W.; Weis, D.; Williams, G.; Hanano, D.; Kieffer, B.; Scoates, J. Complete trace elemental characterisation of granitoid (USGS G-2, GSP-2) reference materials by high resolution inductively coupled plasma-mass spectrometry. Geostand. Geoanal. Res. 2006, 30, 39–54. [Google Scholar] [CrossRef]
- Retzmann, A.; Zimmermann, T.; Pröfrock, D.; Prohaska, T.; Irrgeher, J. A fully automated simultaneous single-stage separation of Sr, Pb, and Nd using DGA Resin for the isotopic analysis of marine sediments. Anal. Bioanal. Chem. 2017, 409, 5463–5480. [Google Scholar] [CrossRef] [PubMed]
- Nath, B.N.; Makishima, A.; Noordmann, J.; Tanaka, R.; Nakamura, E. Comprehensive analysis for major, minor and trace element contents and Sr-Nd-Pb-Hf isotope ratios in sediment reference materials, JSd-1 and MAG-1. Geochem. J. 2009, 43, 207–216. [Google Scholar] [CrossRef] [Green Version]
- Chauvel, C.; Bureau, S.; Poggi, C. Comprehensive chemical and isotopic analyses of basalt and sediment reference materials. Geostand. Geoanal. Res. 2011, 35, 125–143. [Google Scholar] [CrossRef]
- Lee, H.M.; Lee, S.G.; Tanaka, T.; Lee, S.R. Determination of Sr, Nd isotope ratios of standard rock samples using thermal ionization mass spectrometer (TIMS). In Proceedings of the Fall Conference of the Korean Association of Analytical Sciences, JeJu, Korea, 20 November 2014. [Google Scholar]
- Klaver, M.; Djuly, T.; de Graaf, S.; Sakes, A.; Wijbrans, J.; Davies, G.; Vroon, P. Temporal and spatial variations in provenance of Eastern Mediterranean Sea: Implications for Aegean and Aeolian arc volcanism. Geochim. Cosmochim. Acta 2015, 153, 149–168. [Google Scholar] [CrossRef]
- Révillon, S.; Hureau-Mazaudier, D. Improvements in digestion protocols for trace element and isotope determinations in stream and lake sediment reference materials (JSd-1, JSd-2, JSd-3, JLk-1 and LKSD-1). Geoanal. Res. 2009, 33, 397–413. [Google Scholar] [CrossRef] [Green Version]
- Saitoh, Y.; Ishikawa, T.; Tanimizu, M.; Murayama, M.; Ujiie, Y.; Yamamoto, Y.; Ujiie, K.; Kanamatsu, T. Sr, Nd, and Pb isotope compositions of hemipelagic sediment in the Shikoku Basin: Implications for sediment transport by the Kuroshio and Philippine Sea plate motion in the late Cenozoic. Earth Planet. Sci. Lett. 2015, 421, 47–57. [Google Scholar] [CrossRef]
- Li, C.F.; Wang, X.C.; Guo, J.H.; Chu, Z.Y.; Feng, L.J. Rapid separation scheme of Sr, Nd, Pb, and Hf from a single rock digest using a tandem chromatography column prior to isotope ratio measurements by mass spectrometry. J. Anal. At. Spectrom. 2016, 31, 1150–1159. [Google Scholar] [CrossRef]
- Ackerman, L.; Magna, T.; Rapprich, V.; Upadhyay, D.; Krátký, O.; Čejková, B.; Erban, V.; Kochergina, Y.U.V.; Hrstka, T. Contrasting petrogenesis of spatially related carbonatites from Samalpatti and Sevattur, Tamil Nadu, India. Lithos 2017, 284–285, 257–275. [Google Scholar] [CrossRef]


| Step | Eluting Reagent | Eluting Volume (mL) |
|---|---|---|
| Sr, Pb, and rare earth elements (REEs) separation (4 mL of DOWEX 50WX8 resin) | ||
| Cleaning column | 2.5 M HCl | 4 × 2 |
| Loading sample 1 | 2.5 M HCl | 0.5 |
| Rinsing 1 | 2.5 M HCl | 0.5 |
| Eluting Pb | 2.5 M HCl | 9.5 |
| Rinsing | 2.5 M HCl | 13.5 |
| Eluting Sr | 2.5 M HCl | 5.5 |
| Rinsing | 2.5 M HCl | 2 |
| Rinsing | 6 M HCl | 1 |
| Eluting REEs | 6 M HCl | 10 |
| Cleaning column | 6 M HCl | 30 |
| Cleaning column | DIW | 30 |
| Cleaning column | 2.5 M HCl | 8 |
| Nd separation (2 mL of Ln resin) | ||
| Cleaning column | 0.25 M HCl | 2 × 2 |
| Loading sample | 0.25 M HCl | 0.2 |
| Rinsing | 0.25 M HCl | 0.2 |
| Rinsing | 0.25 M HCl | 7.5–7.3 |
| Eluting Nd | 0.25 M HCl | 3.5–3.7 |
| Cleaning column | 6 M HCl | 30 |
| Cleaning column | 0.25 M HCl | 30 |
| Element | L4 | L3 | L2 | L1 | Ax | H1 | H2 | H3 | H4 |
|---|---|---|---|---|---|---|---|---|---|
| Sr | 84Sr | 85Rb | 86Sr | 87Sr | 88Sr | ||||
| Nd | 140Ce | 142Nd | 143Nd | 144Nd | 145Nd | 146Nd | 147Sm | 148Nd | 150Nd |
| Pb | 204Pb | 206Pb | 207Pb | 208Pb |
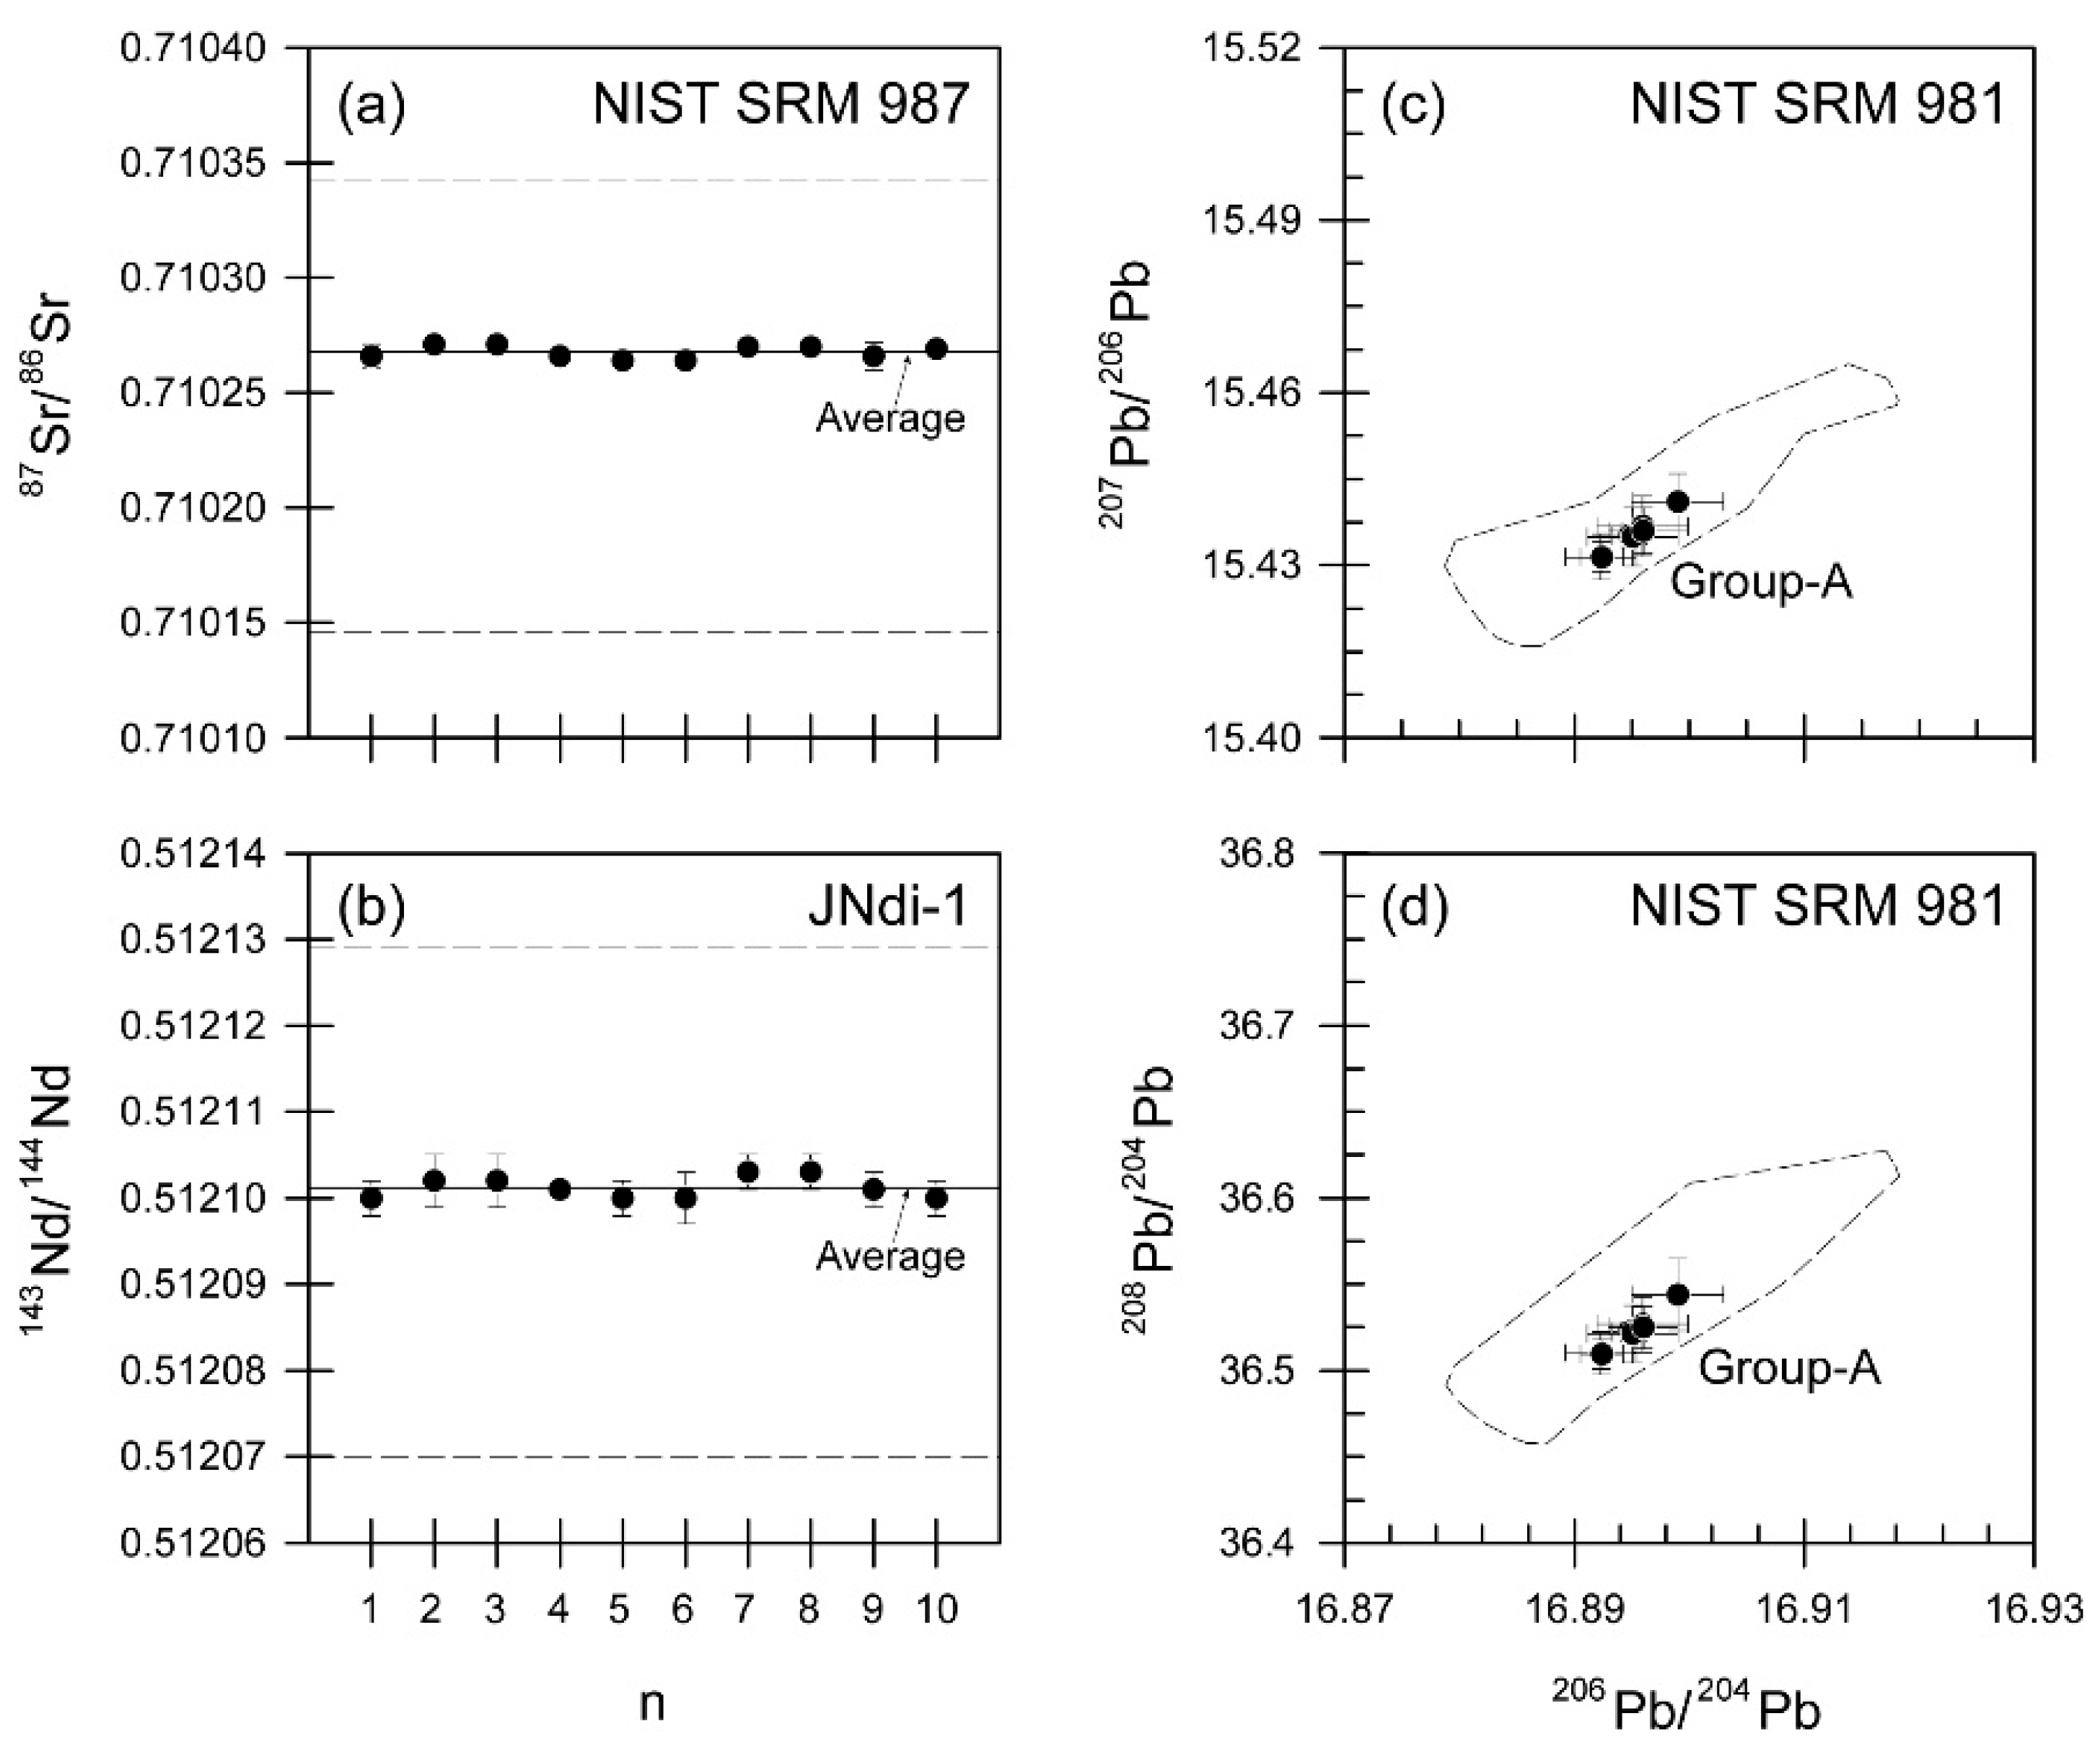
| Sample Number | 87Sr/86Sr | 2σ SE | n | 143Nd/144Nd | 2σ SE | n |
|---|---|---|---|---|---|---|
| NIST SRM 987 | JNdi-1 | |||||
| 190723 | 0.710266 | 0.000005 | 20 | 0.512100 | 0.000002 | 20 |
| 191111 | 0.710271 | 0.000003 | 20 | 0.512102 | 0.000003 | 20 |
| 191212 | 0.710271 | 0.000003 | 20 | 0.512102 | 0.000003 | 20 |
| 200520 | 0.710266 | 0.000003 | 20 | 0.512101 | 0.000001 | 20 |
| 200716 | 0.710264 | 0.000003 | 20 | 0.512100 | 0.000002 | 20 |
| 200806 | 0.710264 | 0.000003 | 20 | 0.512100 | 0.000003 | 20 |
| 210415 | 0.710270 | 0.000003 | 20 | 0.512103 | 0.000002 | 20 |
| 210512 | 0.710270 | 0.000003 | 20 | 0.512103 | 0.000002 | 20 |
| 210628 | 0.710266 | 0.000006 | 20 | 0.512101 | 0.000002 | 20 |
| 210911 | 0.710269 | 0.000003 | 20 | 0.512100 | 0.000002 | 20 |
| Sample Number | 206Pb/204Pb | 2σ SE | 207Pb/204Pb | 2σ SE | 208Pb/204Pb | 2σ SE | n |
|---|---|---|---|---|---|---|---|
| 200716 | 16.895 | 0.001 | 15.435 | 0.002 | 36.522 | 0.005 | 5 |
| 200806 | 16.895 | 0.004 | 15.435 | 0.005 | 36.521 | 0.017 | 5 |
| 210512 | 16.892 | 0.003 | 15.431 | 0.004 | 36.510 | 0.012 | 10 |
| 210628 | 16.892 | 0.002 | 15.431 | 0.003 | 36.510 | 0.008 | 10 |
| 210911 | 16.896 | 0.004 | 15.437 | 0.005 | 36.527 | 0.016 | 10 |
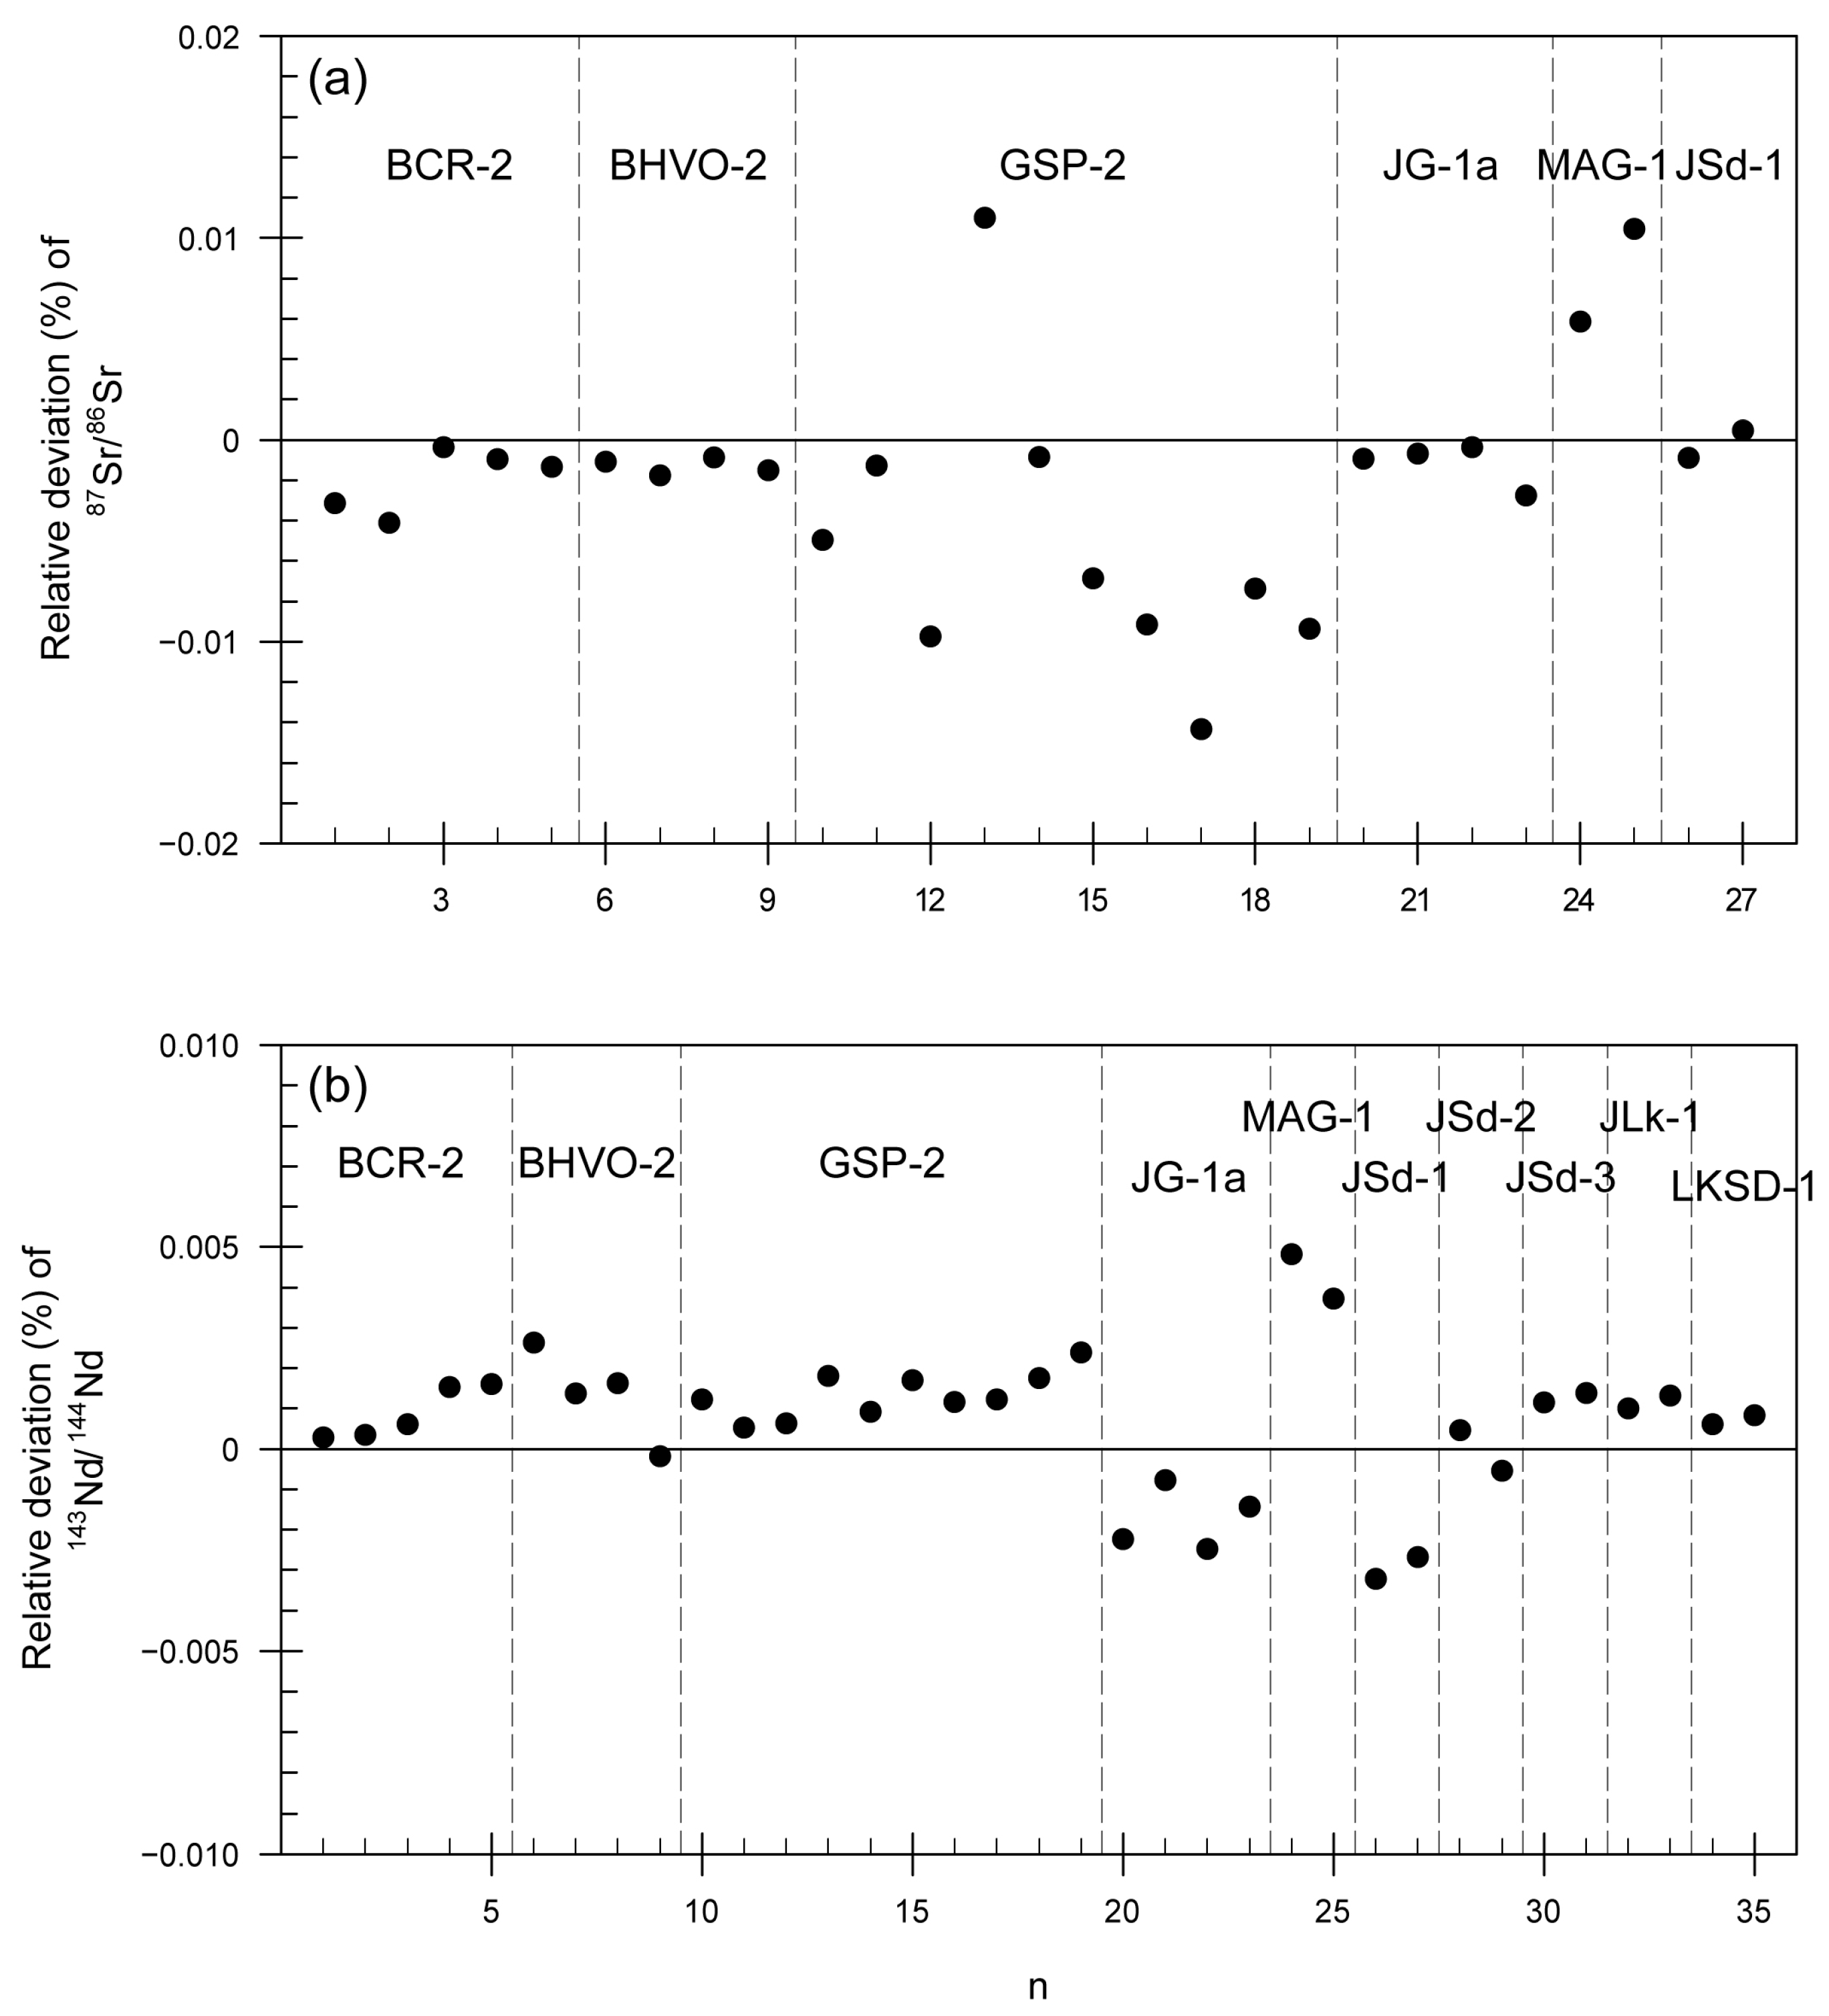
| Sample Number 1 | 87Sr/86Sr | 2σ SE | 143Nd/144Nd | 2σ SE |
|---|---|---|---|---|
| BCR-2 (xxx) | ||||
| 1911 | 0.705030 | 0.000011 | 0.512631 | 0.000005 |
| 2005 | 0.705037 | 0.000010 | 0.512631 | 0.000008 |
| 2007 | 0.705011 | 0.000011 | 0.512629 | 0.000006 |
| 2008-1 | 0.705015 | 0.000009 | 0.512624 | 0.000007 |
| 2008-2 | 0.705018 | 0.000009 | 0.512624 | 0.000008 |
| BHVO-2 (xxx) | ||||
| 1411 2 | 0.703485 | 0.000014 | 0.512968 | 0.000012 |
| 1911 | 0.703490 | 0.000010 | 0.512974 | 0.000007 |
| 2008 | 0.703484 | 0.000010 | 0.512973 | 0.000007 |
| 2108 | 0.703488 | 0.000010 | 0.512982 | 0.000007 |
| GSP-2 (xxx) | ||||
| 1907 | 0.765141 | 0.000010 | 0.511360 | 0.000006 |
| 1911 | 0.765113 | 0.000010 | 0.511364 | 0.000006 |
| 1912 | 0.765177 | 0.000009 | 0.511363 | 0.000006 |
| 2005 | 0.765019 | 0.000009 | 0.511357 | 0.000006 |
| 2007 | 0.765109 | 0.000009 | 0.511362 | 0.000006 |
| 2008 | 0.765155 | 0.000011 | 0.511358 | 0.000008 |
| GSP-2 (599) | ||||
| 2005 | 0.765173 | 0.000010 | 0.511360 | 0.000007 |
| 2007 | 0.765212 | 0.000011 | 0.511360 | 0.000006 |
| GSP-2 (1273) | ||||
| 2005 | 0.765159 | 0.000009 | 0.511357 | 0.000006 |
| 2007 | 0.765174 | 0.000010 | 0.511354 | 0.000007 |
| JG-1a (xxx) | ||||
| 1907 | 0.710982 | 0.000010 | 0.512375 | 0.000007 |
| 1911 | 0.710981 | 0.000010 | 0.512368 | 0.000007 |
| 2008 | 0.710978 | 0.000009 | 0.512376 | 0.000007 |
| 2103-1 | 0.710995 | 0.000009 | 0.512371 | 0.000006 |
| HISS-1 (xxx) | ||||
| 2108 | 0.712681 | 0.000009 | 0.511844 | 0.000006 |
| MAG-1 (16) | ||||
| 2106 | 0.722763 | 0.000008 | 0.512056 | 0.000006 |
| 2108 | 0.722730 | 0.000009 | 0.512061 | 0.000007 |
| JSd-1 (xxx) | ||||
| 2106 | 0.705741 | 0.000009 | 0.512581 | 0.000005 |
| 2108 | 0.705732 | 0.000009 | 0.512578 | 0.000007 |
| JSd-2 (xxx) | ||||
| 2106 | 0.706929 | 0.000010 | 0.512635 | 0.000007 |
| 2108 | 0.706926 | 0.000009 | 0.512640 | 0.000007 |
| JSd-3 (xxx) | ||||
| 2106 | 0.731407 | 0.000009 | 0.511971 | 0.000007 |
| 2108 | 0.731228 | 0.000010 | 0.511970 | 0.000007 |
| 2109 | 0.731294 | 0.000018 | ||
| JLk-1 (8) | ||||
| 2106 | 0.721840 | 0.000009 | 0.512135 | 0.000006 |
| 2108 | 0.721863 | 0.000009 | 0.512134 | 0.000006 |
| LKSD-1 (1549) | ||||
| 2106 | 0.709773 | 0.000013 | 0.512173 | 0.000008 |
| 2108 | 0.709806 | 0.000009 | 0.512172 | 0.000007 |
| 2109 | 0.709780 | 0.000009 | ||
| SGR-1 (10) | ||||
| 2106 | 0.712139 | 0.000011 | 0.512003 | 0.000005 |
| 4353A (xxx) | ||||
| 2106 | 0.730460 | 0.000008 | 0.511776 | 0.000006 |
| 2108-1 | 0.730415 | 0.000010 | 0.511793 | 0.000007 |
| 2108-2 | 0.730460 | 0.000010 | 0.511780 | 0.000007 |
| 2109-1 | 0.730451 | 0.000008 | 0.511783 | 0.000008 |
| 2109-2 | 0.730438 | 0.000010 | 0.511780 | 0.000007 |
| 2109-3 | 0.730432 | 0.000010 | 0.511778 | 0.000008 |
| 2109-4 | 0.730439 | 0.000010 | 0.511784 | 0.000008 |
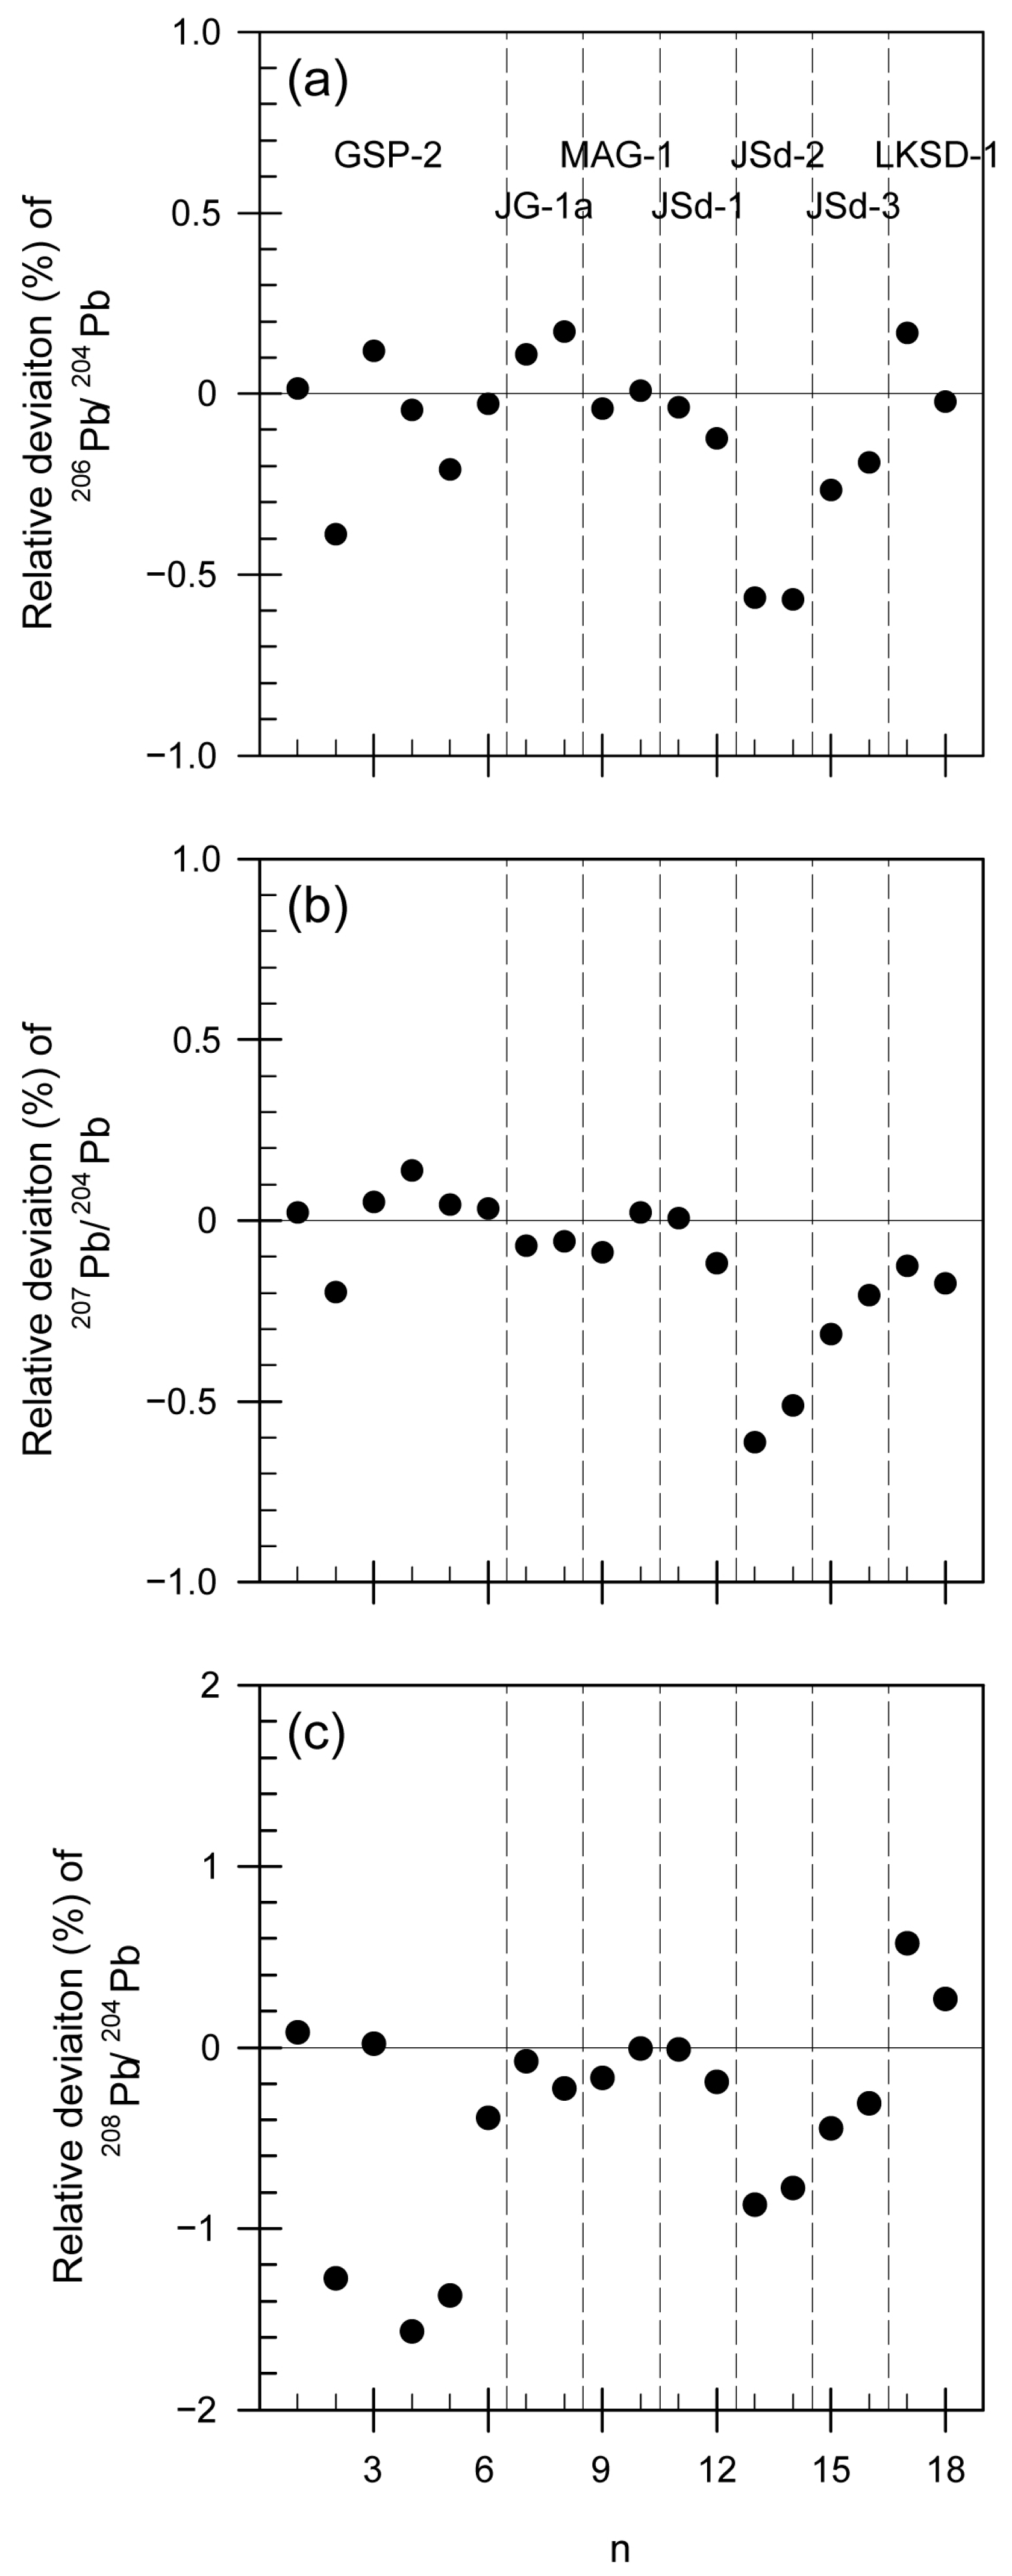
| Sample Number | 206Pb/204Pb | 2σ SE | 207Pb/204Pb | 2σ SE | 208Pb/204Pb | 2σ SE |
|---|---|---|---|---|---|---|
| GSP-2 (xxx) | ||||||
| 2005 | 17.576 | 0.001 | 15.507 | 0.001 | 50.837 | 0.002 |
| 2007 | 17.647 | 0.001 | 15.541 | 0.001 | 51.528 | 0.003 |
| GSP-2 (599) | ||||||
| 2005 | 17.558 | 0.001 | 15.503 | 0.001 | 50.870 | 0.002 |
| 2007 | 17.587 | 0.001 | 15.489 | 0.001 | 51.677 | 0.003 |
| GSP-2 (1273) | ||||||
| 2005 | 17.616 | 0.001 | 15.504 | 0.001 | 51.576 | 0.003 |
| 2007 | 17.584 | 0.001 | 15.506 | 0.001 | 51.078 | 0.003 |
| JG-1a (xxx) | ||||||
| 2103-1 | 18.619 | 0.001 | 15.625 | 0.001 | 38.753 | 0.002 |
| 2103-2 | 18.607 | 0.002 | 15.623 | 0.002 | 38.811 | 0.004 |
| MAG-1 (16) | ||||||
| 2106 | 18.871 | 0.002 | 15.668 | 0.002 | 38.867 | 0.007 |
| 2109 | 18.862 | 0.002 | 15.650 | 0.002 | 38.804 | 0.004 |
| JSd-1 (xxx) | ||||||
| 2106 | 18.480 | 0.003 | 15.614 | 0.002 | 38.597 | 0.006 |
| 2109 | 18.496 | 0.002 | 15.634 | 0.002 | 38.665 | 0.004 |
| JSd-2 (xxx) | ||||||
| 2106 | 18.162 | 0.003 | 15.681 | 0.003 | 38.447 | 0.007 |
| 2109 | 18.163 | 0.009 | 15.665 | 0.008 | 38.412 | 0.019 |
| JSd-3 (xxx) | ||||||
| 2106 | 18.418 | 0.003 | 15.697 | 0.003 | 39.054 | 0.007 |
| 2109 | 18.404 | 0.003 | 15.680 | 0.002 | 38.999 | 0.006 |
| LKSD-1 (1549) | ||||||
| 2106 | 18.326 | 0.001 | 15.640 | 0.001 | 38.102 | 0.004 |
| 2109 | 18.361 | 0.011 | 15.647 | 0.010 | 38.220 | 0.023 |
| 4353A (xxx) | ||||||
| 2106 | 19.089 | 0.001 | 15.681 | 0.001 | 39.721 | 0.003 |
| 2109-1 | 19.070 | 0.002 | 15.658 | 0.001 | 39.638 | 0.003 |
| 2109-2 | 19.105 | 0.003 | 15.693 | 0.002 | 39.768 | 0.006 |
| 2109-3 | 19.106 | 0.002 | 15.694 | 0.002 | 39.764 | 0.005 |
| 2109-4 | 19.100 | 0.002 | 15.679 | 0.002 | 39.717 | 0.004 |
Publisher’s Note: MDPI stays neutral with regard to jurisdictional claims in published maps and institutional affiliations. |
© 2021 by the authors. Licensee MDPI, Basel, Switzerland. This article is an open access article distributed under the terms and conditions of the Creative Commons Attribution (CC BY) license (https://creativecommons.org/licenses/by/4.0/).
Share and Cite
Jo, H.J.; Lee, H.M.; Kim, G.-E.; Choi, W.M.; Kim, T. Determination of Sr–Nd–Pb Isotopic Ratios of Rock Reference Materials Using Column Separation Techniques and TIMS. Separations 2021, 8, 213. https://0-doi-org.brum.beds.ac.uk/10.3390/separations8110213
Jo HJ, Lee HM, Kim G-E, Choi WM, Kim T. Determination of Sr–Nd–Pb Isotopic Ratios of Rock Reference Materials Using Column Separation Techniques and TIMS. Separations. 2021; 8(11):213. https://0-doi-org.brum.beds.ac.uk/10.3390/separations8110213
Chicago/Turabian StyleJo, Hui Je, Hyo Min Lee, Go-Eun Kim, Won Myung Choi, and Taehoon Kim. 2021. "Determination of Sr–Nd–Pb Isotopic Ratios of Rock Reference Materials Using Column Separation Techniques and TIMS" Separations 8, no. 11: 213. https://0-doi-org.brum.beds.ac.uk/10.3390/separations8110213