Article

An HPLC-DAD Method to Quantify Flavonoids in Sonchus arvensis and Able to Classify the Plant Parts and Their Geographical Area through Principal Component Analysis

1
Departement of Chemistry, Faculty of Mathematics and Natural Science, IPB University, Jalan Tanjung Kampus IPB Dramaga, Bogor 16680, Indonesia
2
Tropical Biopharmaca Research Center, Research and Community Empowerment Institute, IPB University, Jalan Taman Kencana No. 3 Kampus IPB Taman Kencana, Bogor 16128, Indonesia
3
Department of Statistics, Faculty of Mathematics and Natural Science, IPB University, Jalan Meranti Kampus IPB Dramaga, Bogor 16680, Indonesia
4
Department of Chemistry Education, Faculty of Education, Riau University, Jalan Pekanbaru-Bangkinang KM 12.5 Kampus Bina Widya, Pekanbaru 28293, Indonesia
5
Department of Chemistry and Biomolecular Science, Faculty of Engineering, Gifu University, 1-1 Yanagido, Gifu 501-1193, Japan
*
Author to whom correspondence should be addressed.
Submission received: 27 December 2020 / Revised: 20 January 2021 / Accepted: 20 January 2021 / Published: 23 January 2021

Abstract

:
A simple and efficient method has been developed for the simultaneous determination of eight flavonoids (orientin, hyperoside, rutin, myricetin, luteolin, quercetin, kaempferol, and apigenin) in Sonchus arvensis by high-performance liquid chromatography diode array detector (HPLC-DAD). This method was utilized to differentiate S. arvensis samples based on the plant parts (leaves, stems, and roots) and the plant’s geographical origin. The chromatographic separation was carried out on a reverse-phase C18 column by eluting at a flow rate of 1 mL/min using a gradient with methanol and 0.2% aqueous formic acid. In the optimum conditions, the developed method’s system suitability has met the criteria of good separation. The calibration curve shows a linear relationship between the peak area and analyte concentration with a correlation coefficient (r2) > 0.9990. The ranges for the analytes’ limits of detection and quantitation were 0.006–0.015 and 0.020–0.052 µg/mL, respectively. Intra-day and inter-day precision expressed in terms of RSD values were <2%, and the accuracy range based on recovery was 97–105%. The stability of all analytes within 48 h was about 2%. By combining HPLC-DAD fingerprint analysis with chemometrics, the developed method can classify S. arvensis samples based on the plant parts and geographical origin.

1. Introduction

Indonesia is known as one of the countries with the highest biodiversity level. The organisms found in it include food and medicinal plants, which can be used for dietary supplements and herbal medicines to prevent or treat diseases. Sonchus arvensis, known as perennial sowthistle and tempuyung in Indonesia, has been used in commercial functional drinks and herbal medicines. In European countries, S. arvensis leaves have been used as a salad [1]. This plant is also used in traditional medicine to treat inflammation, coughing, bronchitis, gallstones, and asthma [2]. For medicinal purposes, the leaves are commonly used [3]. S. arvensis tissues are rich in flavonoids like kaempferol, luteolin-7-O-glucoside, and apigenin-7-O-glucoside. They also contain coumarin (scopoletin), taraxasterol, inositol, and phenolic acids (e.g., cinnamic acid, coumaric acid, and vanillic acid) [4]. Besides that, Sonchus arvensis also have essential oil [5], sesquiterpenes [6], and quinic acid esters [7]. The mentioned flavonoids and other secondary metabolites found in S. arvensis have an essential role in its biological activity.
Flavonoids are a large group of plant polyphenols found in many medicinal plants, vegetables, fruits, and crop products, mainly in flowers and leaves. These compounds play an important role in the human diet and have a beneficial effect on human health, showing antioxidants [8], anticancer [9], anti-inflammatory, antiviral, and antimicrobial [10] activities. Considering the importance of these biological activities of flavonoids, the identification and quantification of these compounds in plant tissues must be carried out by employing methods that can be used to certify the plant’s quality and safety containing the mentioned flavonoids.
Several analytical methods have been developed to identify flavonoids in some medicinal plants. They are based on thin-layer chromatography, high-performance liquid chromatography (HPLC) with ultraviolet or fluorescence detectors [11], UV-Vis spectrophotometry [12], and capillary electrophoresis [13]. High-performance liquid chromatography (HPLC) is one of the most common and efficient chromatographic methods used to separate flavonoids from each other. In particular, silica-based stationary phases are the most popular and commonly used in HPLC procedures to achieve the separation of flavonoids. This stationary phase is widely used, providing high separation efficiency and excellent mechanical stability. In addition, silica stationary phases modified by several types of bound phases using C4–C30 alkyl groups, such as octadecyl or C18, have been widely used in HPLC [14]. The stationary phase is used to produce more efficient separation results in combination with good selectivity.
In recent years, many studies have been published on the separation of the flavonoids present in medicinal plants, including studies conducted on Lycium barbarum [15], Nelumbo nucifera [16], and Scutellaria species [17]. In general, the flavonoids present in these plants can be separated well by HPLC by employing different compositions of the mobile phase. Khan [18] reported the separation of flavonoids like rutin, kaempferol, quercetin, myricetin, and hyperoside extracted from S. arvensis. Seal [19] only detected the presence of catechin, quercetin, and kaempferol in S. arvensis. On the other hand, Hua and Qin [20] reported the presence of luteolin and apigenin in S. arvensis. Both luteolin and apigenin compounds are typical compounds in S. arvensis [21]. Therefore, these two flavonoids should be quantified in S. arvensis. Furthermore, no analytical approach has been reported, enabling users to discriminate between plant parts to obtain the sample or predict the S. arvensis sample’s geographical origin.
This study aimed to develop a method for the simultaneous identification and quantification of flavonoids in S. arvensis, namely orientin, hyperoside, rutin, myricetin, luteolin, quercetin, kaempferol, and apigenin. We also applied the developed method for discrimination of geographical origin and plant parts used from S. arvensis. Thus, in the present study, a combination of chromatographic fingerprint and chemometric analysis was used as a powerful tool for discriminating between plant parts used to prepare the samples and identify the S. arvensis sample’s geographical origin.

2. Materials and Methods

2.1. Chemicals and Reagents

All solvents were obtained from Kanto Chemicals (Tokyo, Japan) in an analytical or HPLC grade. These include methanol, hydrochloric acid 6M (HCl), tertiary butyl hydroxyquinoline (TBHQ) solutions (prepare by dissolving 0.05 g TBHQ in methanol 62.5%), and 0.2% formic acid in distilled water. Purified water was produced in the laboratory using a water distillation system GS-590 device (Advantec, Tokyo, Japan). All pure standard solutions used in this work were prepared with methanol. The standard solutions used in this work are apigenin (purity ≥ 95.0%), myricetin (purity ≥ 96.0%), kaempferol (purity ≥ 97.0%), luteolin (purity ≥ 97.0%), rutin (purity ≥ 94.0%), and quercetin (purity ≥ 95.0%), which were obtained from Cayman Chemical (Ann, Arbor, MI, USA), whereas orientin (purity ≥ 97.0%) and hyperoside (purity ≥ 97.0%) were obtained from Toronto Research Chemical (Canada).

2.2. Plant Materials

Plant samples were collected from two regions (May 2018), characterized by low- and high-altitude. The low-altitude samples were collected in Dramaga, Bogor, West Java, whereas the high-altitude samples were collected in Lembang, West Bandung, West Java, Indonesia. We separated and investigated S. arvensis roots, stems, and leaves samples. All samples were cut into small pieces, dried at room temperature, and milled to a 60-mesh size. Mr. Taopik Ridwan performed the sample’s identification, and the voucher specimen was stored at the Tropical Biopharmaca Research Center of IPB University, Indonesia.

2.3. Sample Preparation and Standard Solutions

Accurately weighed powdered samples (1 g) were sonicated in the presence of HCl 6M (5 mL) and TBHQ solutions (20 mL) for one hour at room temperature. The sample extracts obtained following sonication were filtered through a 0.45-mm membrane filter before being injected into the HPLC-DAD device. Standard stock solutions of apigenin, kaempferol, luteolin, myricetin, rutin, orientin, hyperoside, and quercetin were prepared in methanol at 1000 µg/mL concentrations. An appropriate amount of each standard stock solution was mixed and diluted with methanol to obtain eight concentrations of the working standard solutions of the eight analytes for constructing the relevant calibration curves.

2.4. Chromatography Conditions

An HPLC LC-20 AD equipped with a diode array detector (Shimadzu, Kyoto, Japan) and Zorbax Eclipse Plus C18 column (150 mm × 4.6 mm i.d., 5-μm particle size) was used to separate the compounds. The mobile phase consisted of methanol (A) and 0.2% formic acid in water (B), with the following gradient elution program: 15–30% A at 0–10 min, 30–50% A at 10–45 min, 50–80% A at 45–50 min, 80–95% A at 50–55 min, and 100% A at 55–60 min. After each run, the chromatographic system is set to 0% B for 5 min and balanced for 5 min with a flow rate of 1 mL/min. A diode-array detector monitors the column eluate. The quantification of flavonoids is based on a standard comparison of 270 nm for rutin and hyperoside, 330 nm for kaempferol, and 340 nm for orientin, myricetin, luteolin, quercetin, and apigenin. We used an injection volume of standard and sample solutions of about 10 µL.

2.5. Analytical Performance

The analytical performance of our approach was evaluated by following the guidelines of the International Conference on Harmonization (ICH) [22] by determining system suitability, curve calibration linearity, the limit of detection (LOD), the limit of quantitation (LOQ), precision, accuracy, and stability, expressed as a relative standard derivation (RSD) from each of the analyte levels (µg/g) obtained from the characteristic chromatogram peaks. Notably, the samples utilized to determine the analytical performance were S. arvensis leaves.

2.6. Data Analysis

Principal component analysis (PCA) was used to classify the different plant parts and the geographical origin of S. arvensis samples. For this purpose, we used HPLC-DAD chromatogram data of S. arvensis. Before being subjected to the PCA, the chromatogram was aligned using correlation optimized warping (COW). PCA and COW were performed using the Unscrambler X software version 10.1 from Camo (Oslo, Norway).

3. Results and Discussion

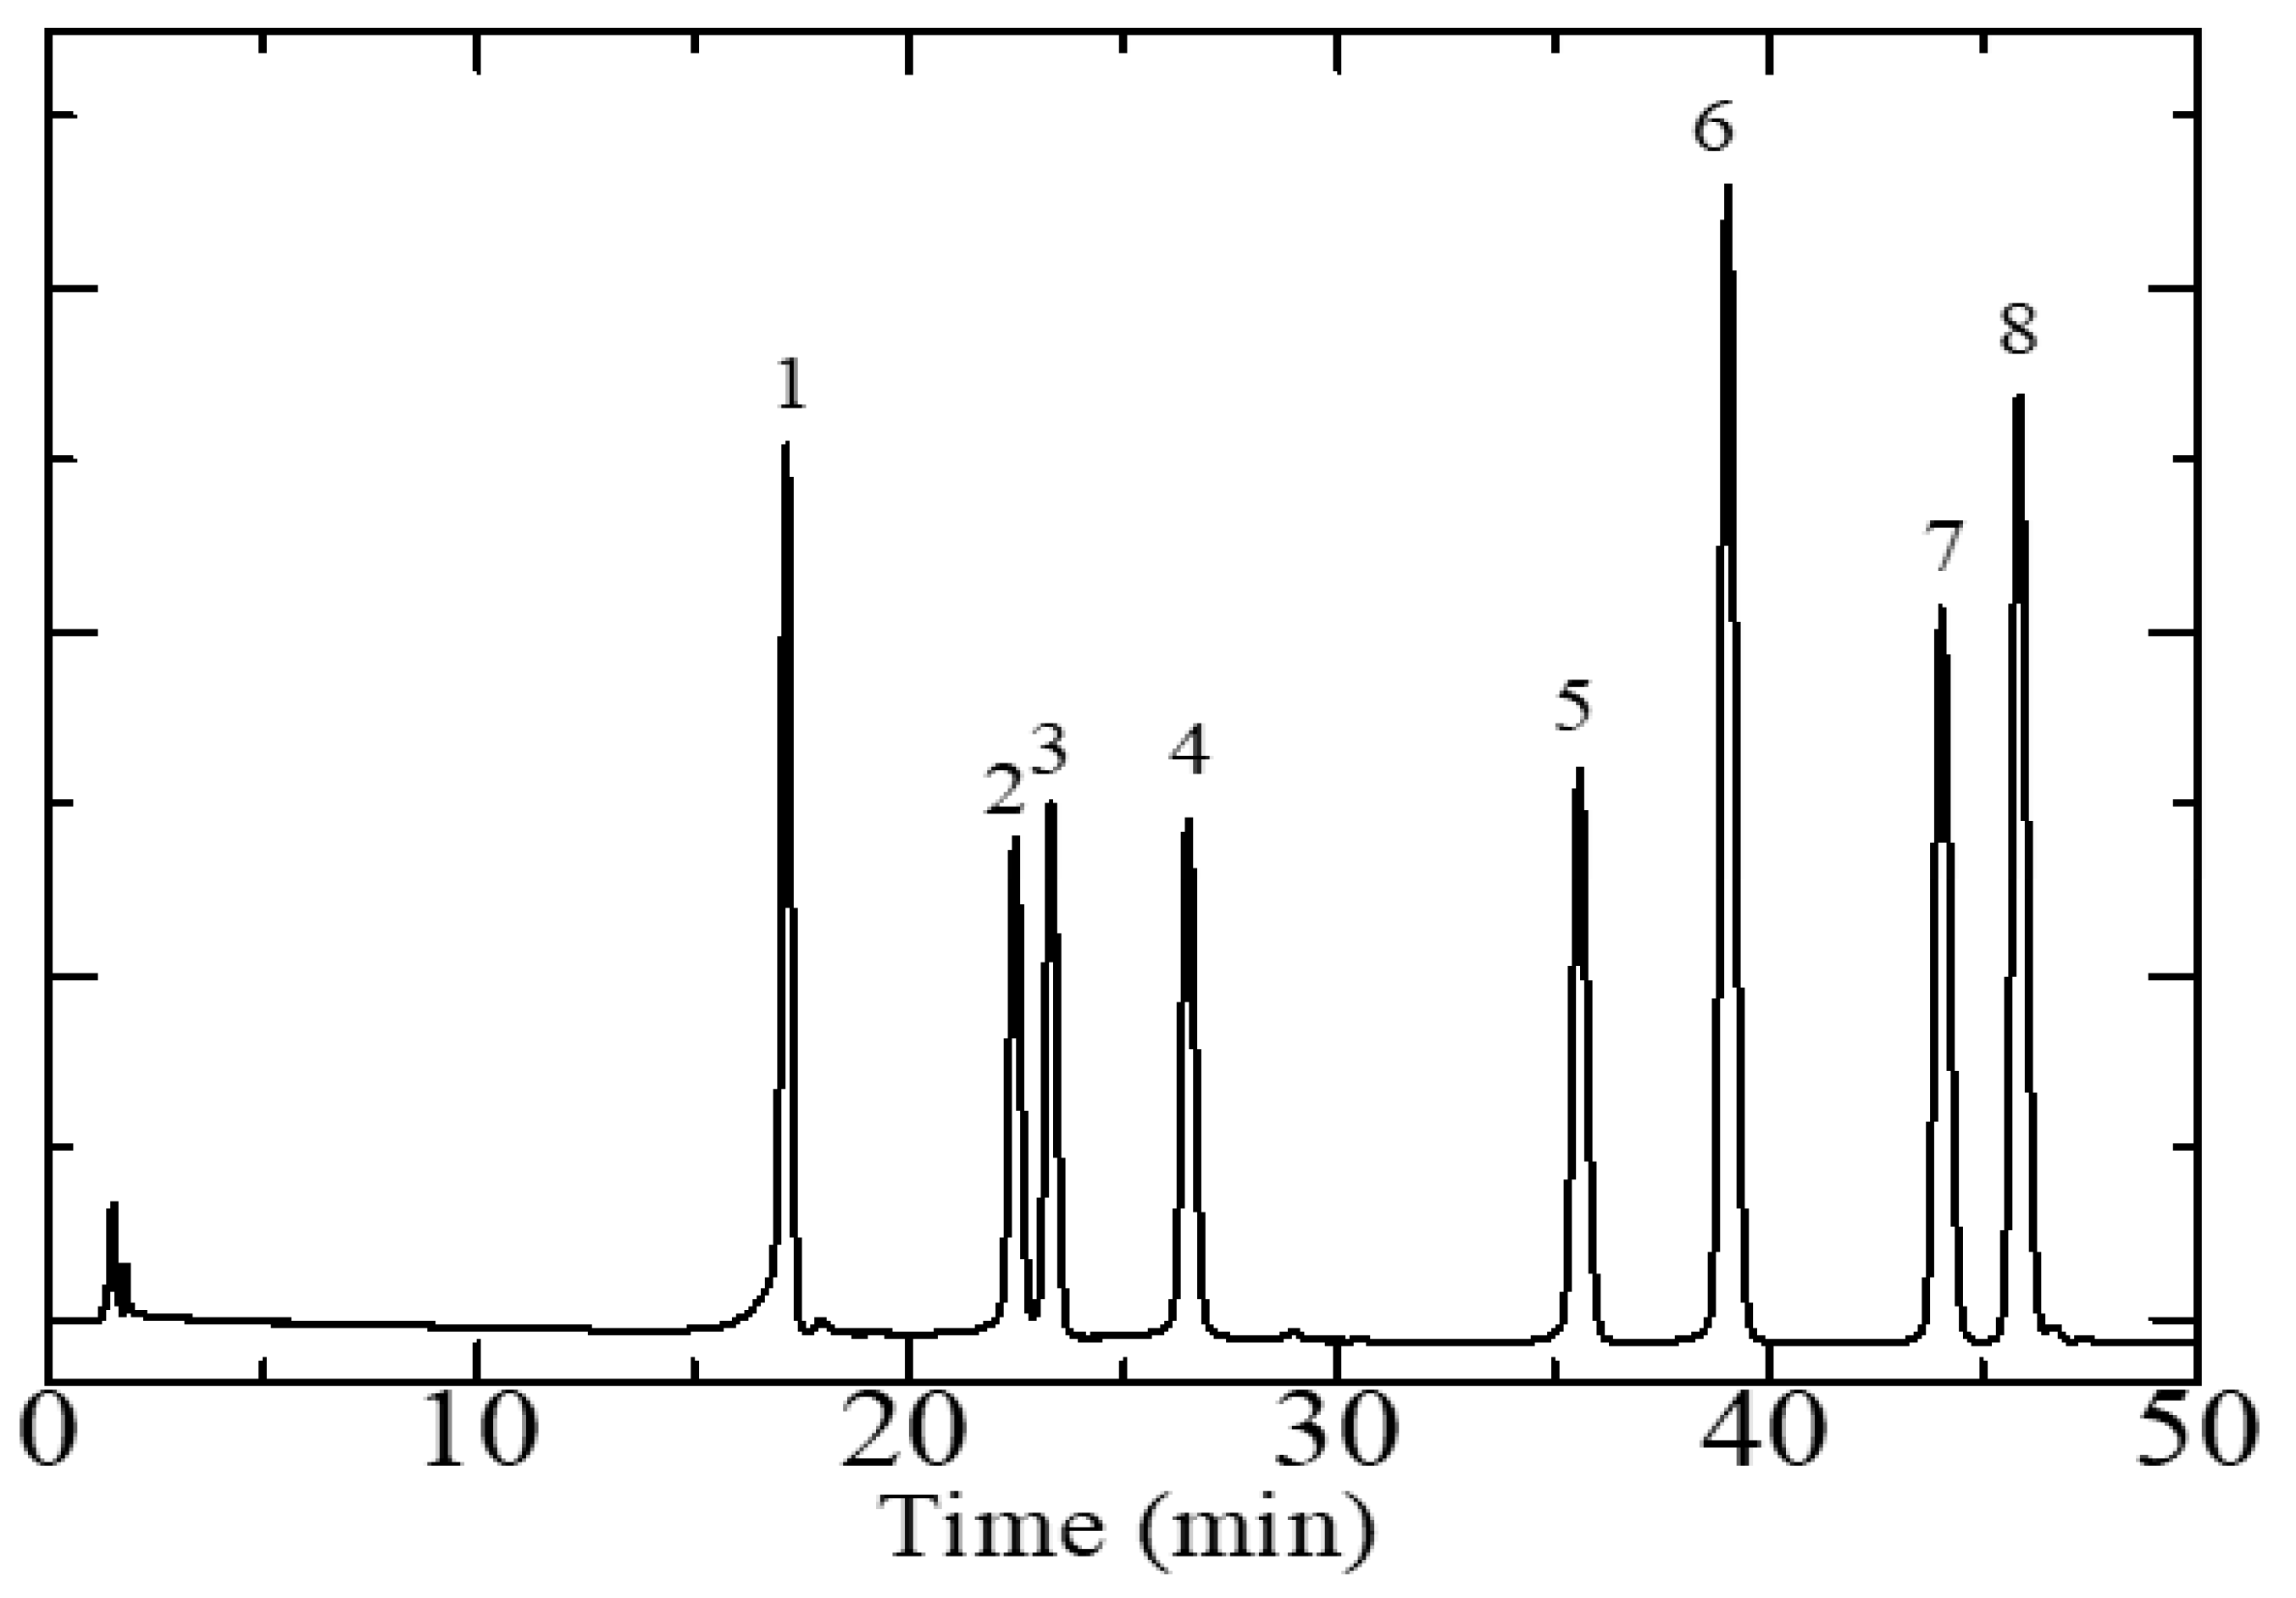
3.1. Optimization of HPLC-DAD Conditions

In order to meet the best separation condition for quantitative analysis and a chromatographic fingerprint, the effect of the composition of the mobile phase was investigated, and the detection wavelength was optimized. The resolution of each analyte and the total analysis time were the parameters used to optimize the chromatographic conditions. Representative chromatograms of the standard solutions of flavonoids are reported in Figure 1. The optimal chromatographic separation was achieved using a gradient elution of phase A, methanol, and an elution of phase B, 0.2% formic acid in the water, as described in the Materials and Methods section.
A satisfactory separation was achieved for all analytes with a separation factor of each peak being greater than 1.5 and the total time to perform the quantitative flavonoid analysis is 60 min. The wavelengths chosen for analytes quantification (corresponding to the absorption maxima of the analytes) were 270 nm in the case of rutin and hyperoside, 330 nm for kaempferol, and 340 nm for orientin, myricetin, luteolin, quercetin, and apigenin. These wavelengths were chosen because they afforded high sensitivity and signal intensities concerning the alternatives for each separated compound.

3.2. Evaluation of the Analytical Performance of the Developed Method

An analytical performance test is a process aimed at proving that a given analytical procedure provides satisfactory results in terms of its stated intent and purpose. This evaluation can provide information on the goodness, quality, reliability, and consistency of the analytical results. The parameters defining the outcome of the analytic performance test include system suitability, linearity, LOD, LOQ, accuracy, and stability.
System suitability was assessed, performing five replicate analyses of a mixed standard solution of orientin, hyperoside, rutin, myricetin, luteolin, quercetin, kaempferol, and apigenin. The relative standard deviation (RSD) values of the retention time, peak area, capacity factor, tailing factor, and theoretical plate number were calculated to evaluate the system suitability (Table 1). The RSD values for all the parameters quantified in the system suitability tests were found to be less than 2%, which indicates that this method is very well suited for achieving the target separation of flavonoids.
The calibration curves were performed at eight concentration levels in the 0.078–10 µg/mL range with three replicate injections for each concentration level by plotting the peak areas versus each analyte’s concentration (Table 2). The linearity of the calibration curves was determined based on the value of the correlation coefficient (r2). Good linearity was obtained with a mean correlation coefficient value greater than 0.9995 for all analytes within the concentration levels. The LOD (S/N = 3.3) and LOQ (S/N = 10) were observed in the range of concentration levels of the calibration curve between 0.006–0.015 and 0.020–0.052 µg/mL, respectively. These results indicated that the proposed analytical method is characterized by good sensitivity.
The precision of the method was determined by measuring the intra-day and inter-day repeatability of six individual sample analyses performed every day over three consecutive days. The method precision was expressed in terms of RSD, and the RSD values obtained for intra-day and inter-day analysis results were found to be less than 3%, confirming the good repeatability of the method. The accuracy of the method was evaluated by carrying out a recovery test that consisted of spiking known amounts of standard solutions of flavonoids into a test sample with three different levels of added standard solutions and triplicate measurements at each level. The average percentages of recovery for all analytes were observed in the 97–105% range, with relevant RSD values below 4%. These results demonstrated that the developed analytical method was reliable and accurate.
The analytes stability in the sample solution was evaluated by performing analytes of the sample solution after 0, 4, 8, 12, 24, and 48 h of incubation at room temperature. The analytes were stable in the sample solution with RSD values ranging between 0.7% and 2.0% for all compounds. Analytical data for the LOD, LOQ, precision, accuracy, and stability are reported in Table 2.

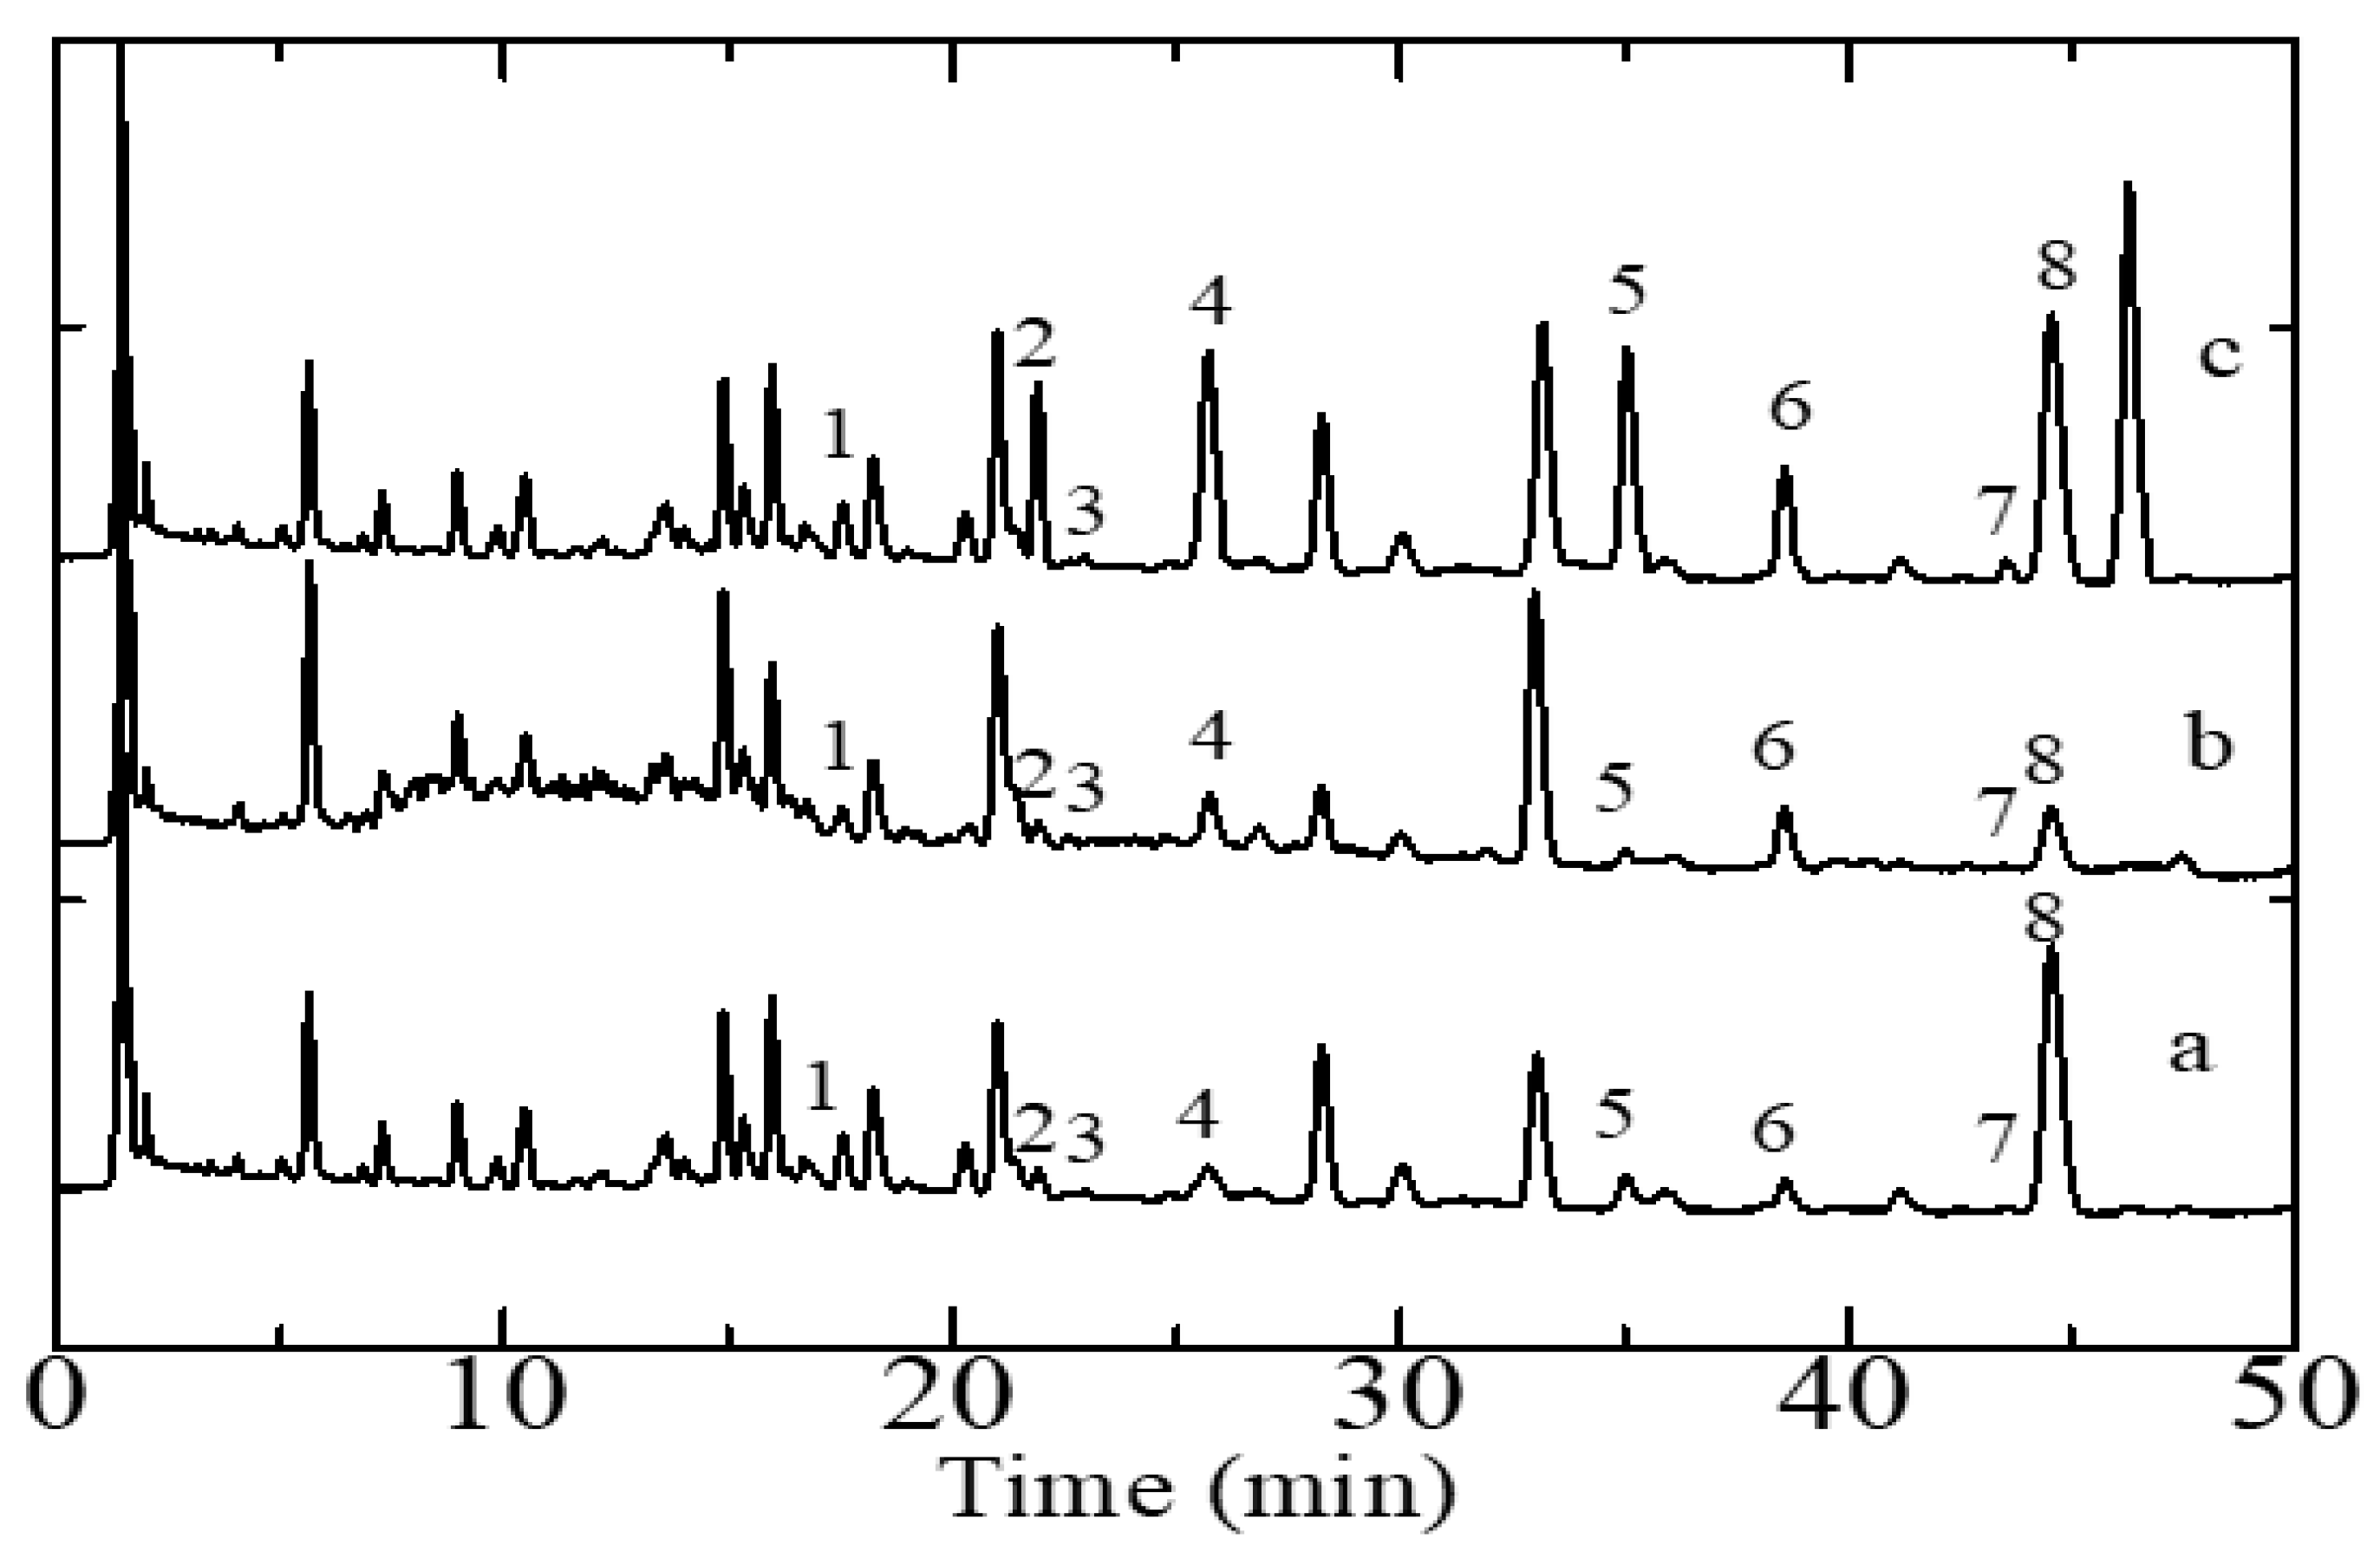
3.3. Determination of Flavonoid Content in S. arvensis

The HPLC-DAD-based method for quantitative flavonoid analysis described above was applied for the simultaneous determination of flavonoids in six samples of S. arvensis consisting of several parts of the plant, namely two samples of roots, stems, and leaves from two plants collected in geographically distinct areas. Each sample analysis consisted of five replicate measurements of the amount of each analyte. Figure 2 show representative chromatograms of S. arvensis extracts whereby the peaks associated with specific target analytes are labeled as such. It can be seen that the eight target analytes contained in S. arvensis are well separated. The peaks of the flavonoid compounds were identified by two methods. The first method includes comparing the retention times of the peak samples with those of the reference compounds eluted under the same conditions and the second method includes spiking the sample with a standard solution of analytes.
In addition to the eight peaks that have identified flavonoids, from the results obtained, there are still other peaks that have not been identified. The peak is likely another compound, such as other flavonoids. Then, from the results of these measurements, we analyzed the content of eight flavonoids using a calibration curve from the optimum condition of HPLC-DAD to see the sample difference based on the concentration levels obtained (Table 3).
As can be seen in Table 4, flavonoid levels did not differ significantly due to either the geographical origin or type (roots versus stems versus leaves) of the sample. The amount of orientin, hyperoside, rutin, myricetin, luteolin, quercetin, kaempferol, and apigenin observed to be present across all samples fell in the following ranges, respectively: 16.36–24.91, 1.34–39.34, 1.73–46.59, 18.00–313.97, 4.03–91.87, 2.27–31.64, 0.91–1.27, and 123.22–272.34 µg/g. Apigenin was found to be the dominant compound concentration-wise, whereas kaempferol was the flavonoid characterized by the lowest concentration in most of the samples investigated. Evidence indicated that the concentrations of flavonoids present in S. arvensis samples originating from the Bogor area were generally higher than those observed in West Bandung samples.
The flavonoids were also found in very high concentrations in leaves samples, whereas their concentrations were very low in the plant stem samples. Based on these results, we could not discriminate them only on the amount of these eight bioactive compounds. For this purpose, therefore, we relied on the chemometric method, which is widely employed to discriminate between the different plant parts and the plant samples’ geographical origin based on the samples’ contents of suitable chemical compounds.

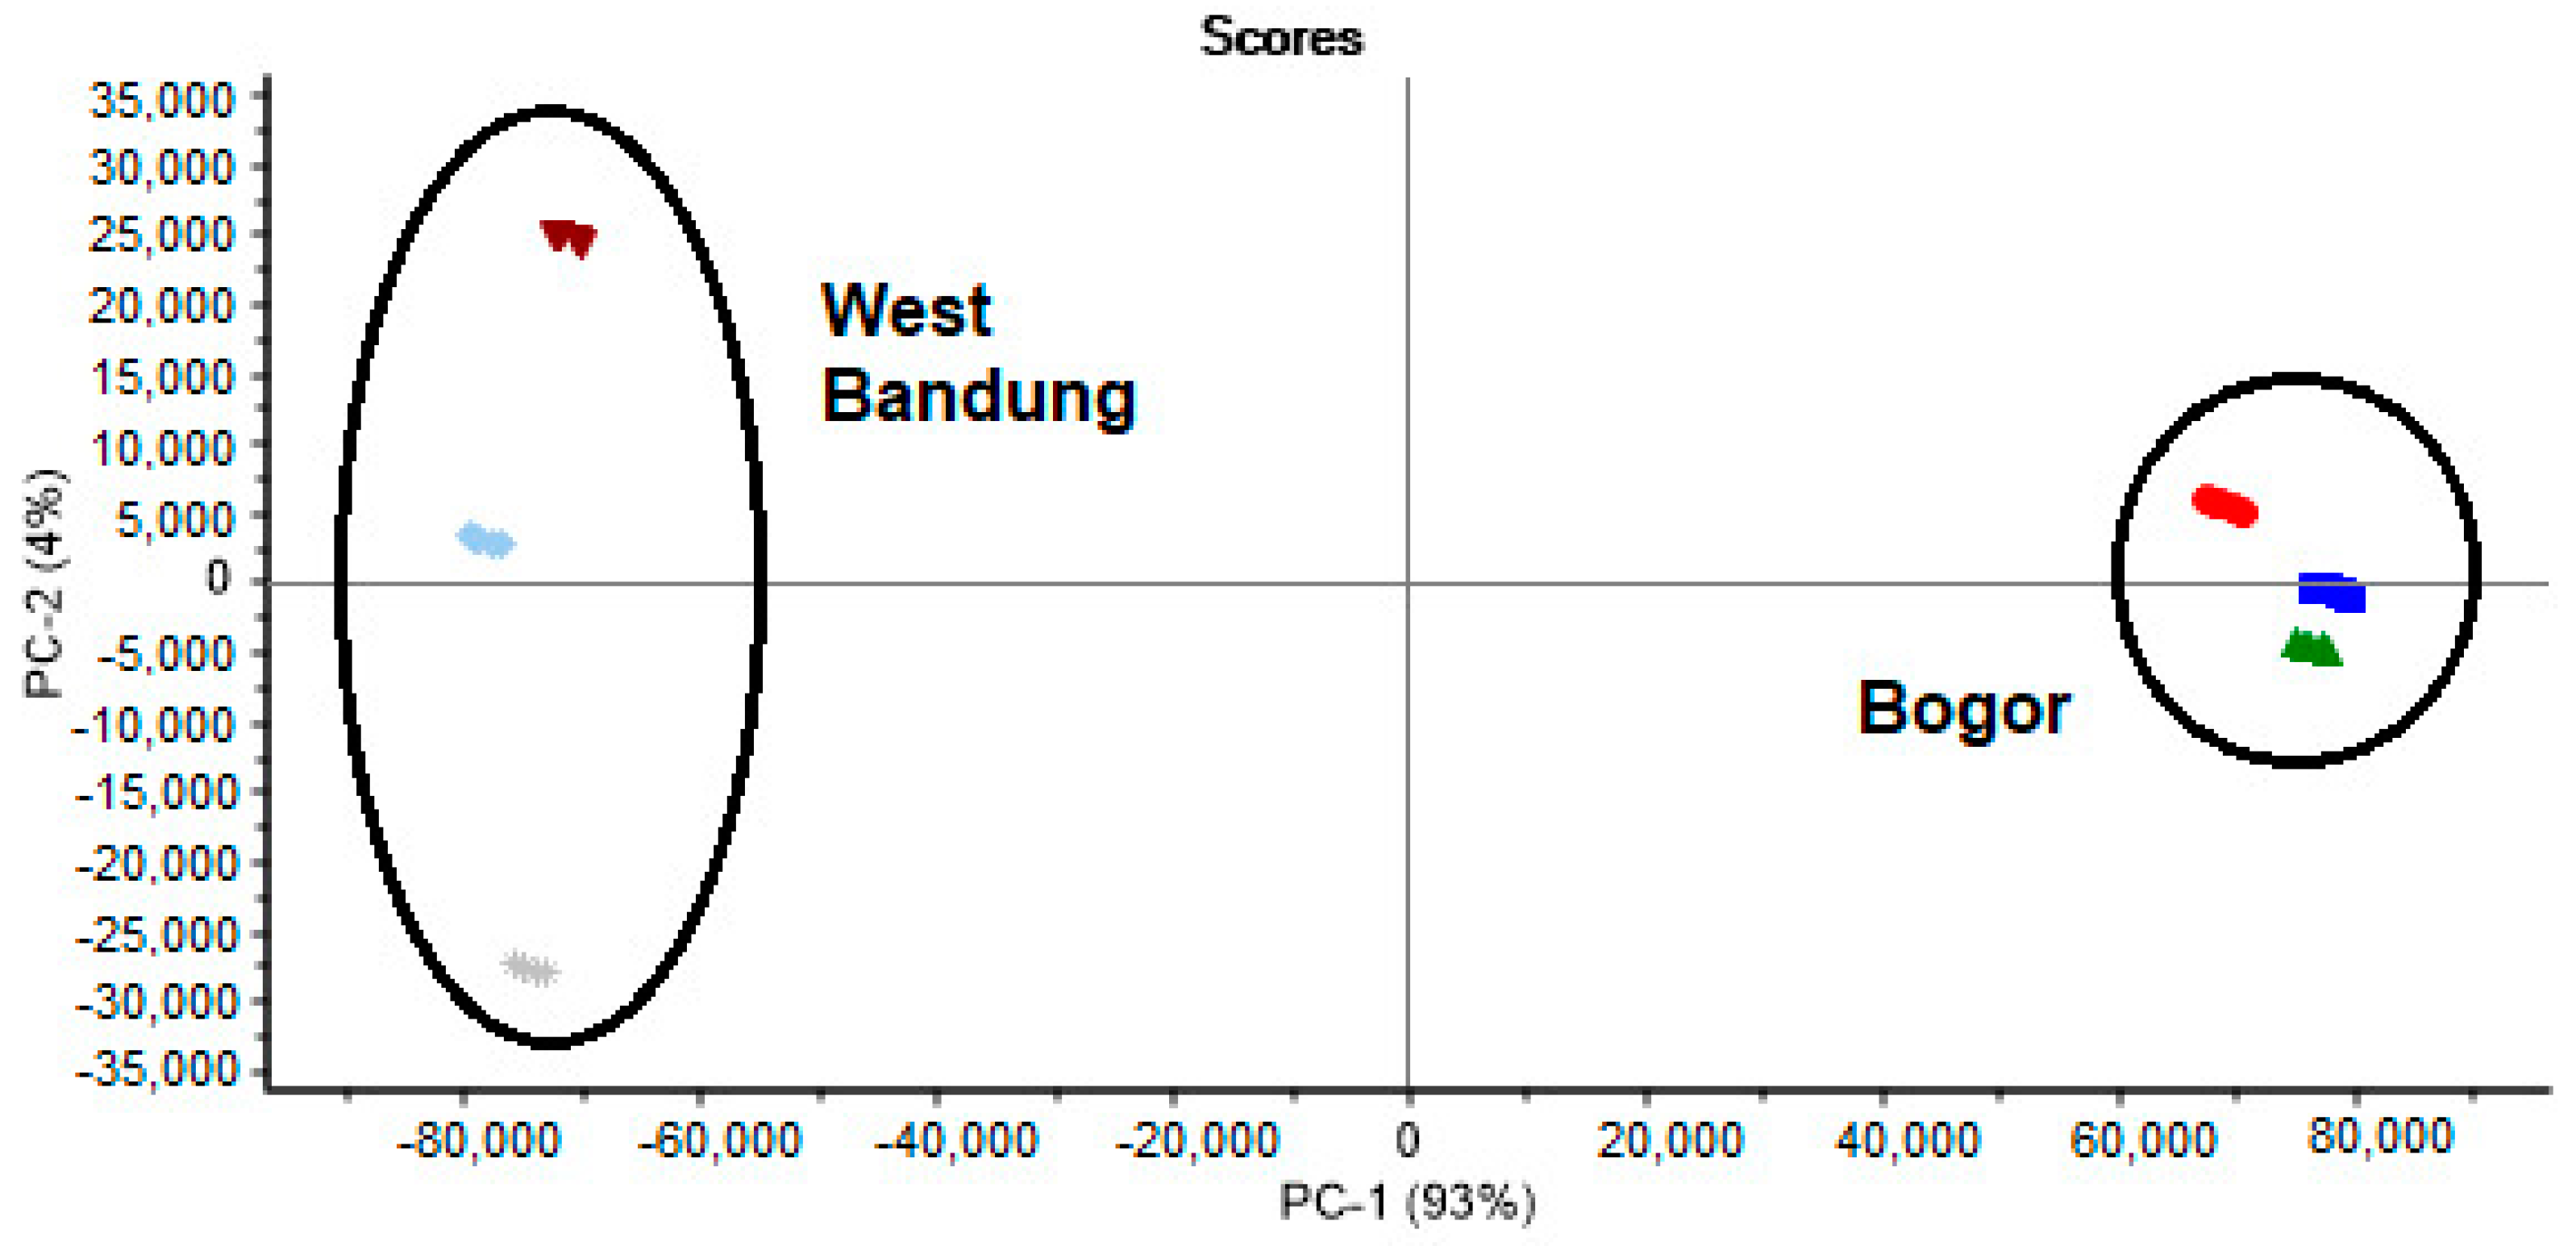
3.4. Clustering of S. arvensis Samples from the Different Geographical Origin and Plant Parts

In developing a method for distinguishing between S. arvensis samples based on the plant part they originated from and on the geographical origin of the plant, we employed a combination of HPLC-DAD fingerprint analysis and the chemometric method. This combination has become one of the most used approaches to the classification, authentication, and discrimination of medicinal plants to recognize the plant’s geographical origin, the detection of adulteration, and the discrimination of closely related species. One of the multivariate analysis techniques we used in this study was PCA, which is a well-known unattended pattern recognition method. PCA is useful for reducing data and extracting information to find combinations of variables to describe the data set [23]. The original variable is transformed into a new and uncorrelated variable called the principal component (PC) [24].
As a variable, we used the HPLC-DAD fingerprint chromatogram data and preprocessed first by alignment using correlation optimized warping (COW). COW is a transformation to align chromatogram data that has an x-axis misalignment between one sample and another. The COW method works by aligning the sample chromatogram to the reference chromatogram using dynamic programming by stretching or compressing the sample segments using linear interpolation [25,26]. Segment length and slack size are two parameters optimized by the COW automated algorithm [27]. The segment length parameter determines the number of segments, while the slack parameter controls how these segments can be expanded or compressed [26]. When the number of time points in the sample and reference segment is different, the first to be linearly interpolated to make the segment length the same is the slack parameter [28]. The optimal slack size and segment length obtained were 70 and 14, respectively.
In this study, PCA was used to group samples based on differences associated with geographical origin. The score plot for the first two principal components (PC1 and PC2) is usually used most in the analysis because these two PCs contain the most data variations. The results of the score plots used the first two PCs originating from PCA. These components accounted for 97% of the total variance (PC1 = 93% and PC2 = 4%) (Figure 3). The PCA score plot explains that all samples can be classified into their respective groups based on their geographic origin and plant part. In this case, based on the results described above, the HPLC-DAD fingerprint chromatogram data combined with PCA can be reliably used to infer what plant part was utilized to prepare the sample and the geographical origin of the S. arvensis sample.

4. Conclusions

In this study, the simultaneous quantification of eight flavonoids in different S. arvensis samples originating from different plant parts and geographical areas was achieved by employing an HPLC-DAD-based methodology, which was successfully developed a high-accuracy and high-reliability qualitative and quantitative analysis of the mentioned compounds. Evidence indicated that flavonoid content in the leaves of S. arvensis was higher than in the plant’s roots and stem. A combination of HPLC-DAD fingerprint analysis and the chemometric method enabled us to group the samples into six groups successfully. Therefore, the developed method could be used for the quality control of S. arvensis.

Author Contributions

Conceptualization, R.H.K., E.R., R.L., L.W.L., T.T., and M.R. Methodology, R.H.K., E.R., U.D.S., R.L., L.W.L., T.T., and M.R. Software, M.R. Validation, R.H.K., E.R., and M.R. Formal analysis, R.H.K., A.Y., and U.D.S. Investigation, R.H.K. and A.Y. Resources, E.R., L.W.L., T.T., and M.R. Data curation, R.H.K. Writing—original draft preparation, R.H.K. and A.Y. Writing—review and editing, E.R., U.D.S., R.L., L.W.L., T.T., and M.R. Visualization, R.H.K. and A.Y. Supervision, E.R., U.D.S., R.L., L.W.L., T.T., and M.R. Project administration, E.R. Funding acquisition, E.R. and M.R. All authors have read and agreed to the published version of the manuscript.

Funding

This research was funded by the Directorate of Research and Community Service, Ministry of Research and Technology/National Agency for Research and Innovation, the Republic of Indonesia, Penelitian Dasar Unggulan Perguruan Tinggi, grant No. 4016/IT3.L1/PN/2020.

Institutional Review Board Statement

Not applicable.

Informed Consent Statement

Not applicable.

Data Availability Statement

No new data were created or analyzed in this study. Data sharing is not applicable in this article.

Conflicts of Interest

The authors declare no conflict of interest.

References

  1. Holm, L.; Doll, J.; Holm, E.; Pancho, J.; Herberger, J. World Weeds: Natural Histories and Distribution; John Wiley and Sons Inc: New York, NY, USA, 1997. [Google Scholar]
  2. Li, X.M.; Yang, P.L. Research progress of Sonchus species. Int. J. Food Prop. 2018, 21, 147–157. [Google Scholar] [CrossRef] [Green Version]
  3. Ministry of Health Republic of Indonesia. Indonesia Herbal Pharmacopoeia, 1st ed.; Ministry of Health Republic of Indonesia: Jakarta, Indonesia, 2010; pp. 138–140.
  4. Manoi, F. Effect fineness extraction of materials and old quality extract (Sonchus arvensis L.). J. Appl. Agric. Res. 2015, 15, 156–161. [Google Scholar]
  5. Kanaani, S.; Sani, A.M. Chemical composition of essential oils and in vitro antibacterial activity of methanolic extract of Sonchus arvensis and Eremurus spectabilis against food-borne pathogenic bacteria. J. Essent Oil-Bear Plants 2015, 18, 1093–1099. [Google Scholar] [CrossRef]
  6. Xia, Z.; Yao, J.; Liang, J. Two new sesquiterpene lactones from Sonchus arvensis. Chem. Nat. Compd. 2012, 48, 47–50. [Google Scholar] [CrossRef]
  7. Xu, Y.J.; Sun, S.B.; Sun, L.M.; Qiu, D.F.; Liu, X.J.; Jiang, Z.B.; Yuan, C.S. Quinic acid esters and sesquiterpenes from Sonchus arvensis. Food Chem. 2008, 111, 92–97. [Google Scholar] [CrossRef]
  8. Karamian, K.; Asadbegy, M. Antioxidant activity, total phenolic and flavonoid contents of three Onobrychis species from Iran. J. Pharm. Sci. 2016, 22, 112–119. [Google Scholar] [CrossRef] [Green Version]
  9. Raffa, D.; Maggio, B.; Raimondi, M.V.; Plescia, F.; Daidone, G. Recent discoveries of anticancer flavonoids. Eur. J. Med. Chem. 2017, 142, 213–228. [Google Scholar] [CrossRef] [PubMed]
  10. Wang, T.Y.; Li, Q.; Bi, K.S. Bioactive flavonoids in medicinal plants: Structure, activity and biological fate. Asian J. Pharm. Sci. 2018, 13, 12–23. [Google Scholar] [CrossRef] [PubMed]
  11. Hajimehdipoor, H.; Kondari, B.M.; Amin, G.R.; Adib, N.; Rastegar, H.; Shekarchi, M. Development of a validated HPLC method for the simultaneous determination of flavonoid in Cuscuta chinesis L. by ultra-violet detection. Daru J. Pharm. Sci. 2012, 20, 57–62. [Google Scholar] [CrossRef] [PubMed] [Green Version]
  12. Ramos, R.T.M.; Bezerra, I.C.F.; Ferreira, M.R.A.; Soares, L.A.L. Spectrophotometric quantification of flavonoids in herbal material, crude extract, and fractions from leaves of Eugenia uniflora Linn. Pharm. Res. 2017, 9, 253–260. [Google Scholar]
  13. Wang, W.; Lin, P.; Ma, L.; Xu, K.; Lin, X. Separation and determination of flavonoids in three traditional Chinese medicines by capillary electrophoresis with amperometric detection. J. Sep. Sci. 2016, 39, 1357–1362. [Google Scholar] [CrossRef] [PubMed]
  14. Zhao, L.; Liu, L.; Li, J. Qualitative and quantitative analysis of five bioactive flavonoids in Salix bordensis turcz. by HPLC-DAD and HPLC-ESI-MS. Am. J. Anal. Chem. 2014, 5, 851–860. [Google Scholar] [CrossRef] [Green Version]
  15. Magiera, S.; Zareba, M. Chromatographic determination of phenolic acids and flavonoids in Lycium barbarum L. and evaluation of antioxidant activity. Food Anal. Methods 2015, 8, 2665–2674. [Google Scholar] [CrossRef] [Green Version]
  16. Naveen, P.; Lingaraju, H.B.; Anitha; Prasad, K.S. Simultaneous determination of rutin, isoquercetin, and quercetin flavonoids in Nelumbo nucifera by high-performance liquid chromatography method. Int. J. Pharm. Investig. 2017, 7, 94–100. [Google Scholar] [CrossRef] [PubMed] [Green Version]
  17. Gharari, Z.; Bagheri, K.; Danafar, H.; Sharafi, A. Simultaneous determination of baicalein, chrysin and wogonin in four Iranian Scutellaria species by high performance liquid chromatography. J. Appl. Res. Med. Aromat. Plants 2019, 16, 100232. [Google Scholar] [CrossRef]
  18. Khan, R.A. Evaluation of flavonoids and diverse antioxidant activities of Sonchus arvensis. Chem. Cent. J. 2012, 6, 126–132. [Google Scholar] [CrossRef] [Green Version]
  19. Seal, T. Quantitative HPLC analysis of phenolic acids, flavonoids and ascorbic acid in four different solvent extracts of two wild edible leaves, Sonchus arvensis and Oenanthe linearis of North-Eastern region in India. J. Appl. Pharm. Sci. 2016, 6, 157–166. [Google Scholar] [CrossRef] [Green Version]
  20. Huo, B.S.; Qin, M.J. Content analysis of flavonoids in five species of Sonchus L. Zhiwu Ziyuan Yu Huanjing Xuebao 2008, 17, 77–78. [Google Scholar]
  21. BPOM (Badan Pengawasan Obat dan Makanan) RI. Fingerprint of Sonchus arvensis Leaf as the Basis of Standardization of Natural Medicinal Plant Extracts. 2010. Available online: http://www.pom.go.id/ppid/2016/ringkasan_riset2010.pdf (accessed on 14 August 2020).
  22. ICH (International Conference on Harmonization). Validation of Analytical Procedures: Methodology Q2 (R1); ICH: Geneva, Switzerland, 2005. Available online: http://www.ich.org/fileadmin/Public_Web_Site/ICH_Products/Guidelines/Quality/Q2_R1/Step4/Q2_R1__Guideline.pdf (accessed on 14 August 2020).
  23. Liu, X.; Wu, Z.; Yang, K.; Ding, H.; Wu, Y. Quantitative analysis combined with chromatographic fingerprint for comprehensive evaluation of Danhong injection using HPLC DAD. J. Pharm. Biomed. 2013, 76, 70–74. [Google Scholar] [CrossRef]
  24. Xu, X.; Jiang, J.; Liang, Y.; Yia, L.; Cheng, J. Chemical fingerprint analysis for quality control of Fructus Aurantii Immaturus based on HPLC-DAD combined with chemometric methods. Anal. Methods 2010, 2, 1–9. [Google Scholar] [CrossRef]
  25. Skov, T.; Berg, F.V.D.; Tomasi, G.; Bro, R. Automated alignment of chromatographic data. J. Chemom. 2006, 20, 484–497. [Google Scholar] [CrossRef]
  26. Kumar, K. Chemometric assisted correlation optimized warping of chromatograms: Optimizing the computational time for correcting the drifts in chromatographic peak positions. Anal. Methods 2018, 10, 1006–1014. [Google Scholar] [CrossRef]
  27. Jiao, L.; Bing, S.; Wang, X.; Xue, Z.; Li, H. The application of automated correlation optimized warping to the quality evaluation of Radix Puerariae thomsonii: Correcting retention time shift in the chromatographic fingerprints. Quim. Nova 2015, 38, 8–13. [Google Scholar]
  28. Ni, Y.; Song, R.; Kokot, S. Analysis of HPLC fingerprints: Discrimination of raw and processed Rhubarb samples with the aid of chemometrics. Anal. Methods 2012, 4, 171–176. [Google Scholar] [CrossRef]
Figure 1. High-performance liquid chromatography chromatogram of a standard 10 µg/mL flavonoid solution obtained using a Zorbax Eclipse Plus C18 column. Mobile phase composition program: 0–10 min, 15–30% A, 10–45 min, 30–50% A, 45–50 min, 50–80% A, 50–55 min, 80–95% A, 55–60 min, 100% A. Flowrate: 1 mL/min. Analyte-associated peaks: 1, orientin, 2, hyperoside, 3, rutin, 4, myricetin, 5, luteolin, 6, quercetin, 7, kaempferol, 8, apigenin. Sample injection volume: 10 µL. Ultraviolet (UV) wavelength for analyte detection: 340 nm. Phase A: methanol. Phase B: 0.2% formic acid in water.
Separations 08 00012 g001
Figure 2. Representative HPLC-DAD chromatograms of Sonchus arvensis extracts. (a) Root sample, (b) stem sample, and (c) leaf sample. Analyte-associated peaks: 1, orientin, 2, hyperoside, 3, rutin, 4, myricetin, 5, luteolin, 6, quercetin, 7, kaempferol, 8, apigenin. Operating conditions are the same as those detailed in the legend of Figure 1.
Separations 08 00012 g002
Figure 3. Principal component analysis (PCA) score plot of S. arvensis extract: root ( Separations 08 00012 i001), stem ( Separations 08 00012 i002), and leaves ( Separations 08 00012 i003) from Bogor and root ( Separations 08 00012 i004), stem ( Separations 08 00012 i005), and leaves ( Separations 08 00012 i006) from West Bandung.
Separations 08 00012 g003
Table 1. Result of the system suitability test performed on the analytical method employed for the separation and quantification of flavonoids in a mixed standard solution of orientin (OR), hyperoside (HP), rutin (RT), myricetin (MR), luteolin (LT), quercetin (QR), kaempferol (KM), and apigenin (AG).
Analyte aORHPRTMRLTQRKMAG
Retention time (min)
Mean16.91221.95222.99626.22435.05738.45143.33445.136
RSD (%)0.030.210.050.240.030.030.10.06
Peak area
Mean276,0871,769,818275,124246,515247,129454,891331,047373,706
RSD (%)0.310.420.220.340.620.410.130.46
Capacity factor
Mean10.95614.68415.25814.45323.77926.19739.68532.605
RSD (%)0.140.170.070.440.120.040.130.51
Tailing factor
Mean0.8191.0361.0141.1410.9720.9341.2911.125
RSD (%)0.650.750.630.930.560.750.420.36
Theoretical plate number
Mean21,38323,82127,75627,33642,39352,96363,70673,598
RSD (%)0.380.321.831.921.222.171.782.01
a The concentration of each analyte was 10 µg/mL (n = 5). RSD: relative standard deviation.
Table 2. Analytical data of calibration curves.
AnalyteRegression Equation aCorrelation Coefficient (r2)Standard Deviation
InterceptSlope
ORy = 27480x + 171.660.9991193.74264.86
HPy = 35146x + 924.740.9998249.50135.91
RTy = 17497x + 445.460.9996547.45197.55
MRy = 24911x + 113.630.9994304.4894.98
LTy = 25092x + 28.2960.9995113.34217.54
QRy = 45521x + 750.850.9997184.52746.81
KMy = 33302x + 43.6740.999619.4386.88
AGy = 36866x + 863.50.9992128.96166.70
a Concentration range for all analytes for calibration curve: 0.078–10 µg/mL. AG: apigenin. HP: hyperoside. KM: kaempferol. LT: luteolin. MR: myricetin. OR: orientin. QR: quercetin. RT: rutin. SD: standard deviation.
Table 3. Analytical data of LOD, LOQ, precision, accuracy, and analyte stability for determination of eight flavonoids.
AnalytePrecision (RSD, %)Accuracy aStability b (n = 6)
Intra-Day (n = 6)Inter-Day (n = 3)Average Recovery (%)RSD (%) (n = 3)
ORDay 1: 2.231.3297.842.81.6
Day 2: 1.41
Day 3: 1.54
HPDay 1: 0.940.93103.62.311.38
Day 2: 1.07
Day 3: 0.92
RTDay 1: 1.601.4497.792.421.03
Day 2: 1.12
Day 3: 1.03
MRDay 1: 0.900.81104.51.341.47
Day 2: 1.00
Day 3: 0.96
LTDay 1: 1.090.99105.871.741.08
Day 2: 1.28
Day 3: 1.18
QRDay 1: 0.870.8799.221.391.15
Day 2: 0.76
Day 3: 1.89
KMDay 1: 0.510.9197.172.071.29
Day 2: 0.61
Day 3: 0.84
AGDay 1: 0.690.75105.10.890.99
Day 2: 0.98
Day 3: 0.65
a Three levels of added standard compounds (0.078, 0.625, 10 µg/mL) in the sample solution with each level measured in triplicate. b Five measurements performed 0, 4, 8, 12, and 24 h after sample preparation by extraction. AG: apigenin. HP: hyperoside. KM: kaempferol. LT: luteolin. MR: myricetin. OR: orientin. QR: quercetin. RT: rutin. RSD: relative standard deviation.
Table 4. Concentration of eight flavonoids detected in Sonchus arvensis samples.
AnalyteGeographical Origin of Sample
BogorWest Bandung
Sampel Type
RootStemLeavesRootStemLeaves
Concentration (µg/g ± SD), n = 5
OR22.70 ± 0.3517.89 ± 0.1024.91 ± 0.3517.80 ± 0.3516.99 ± 0.3516.36 ± 0.45
HP83.40 ± 0.151.83 ± 0.2239.34 ± 0.191.38 ± 0.221.34 ± 0.2518.64 ± 0.18
RT46.59 ± 1.031.75 ± 0.0340.01 ± 0.302.72 ± 0.041.73 ± 0.0122.03 ± 0.15
MR35.55 ± 0.3727.63 ± 0.4243.07 ± 0.2218.00 ± 0.2820.57 ± 0.26313.97 ± 0.15
LT91.87 ± 2.0382.65 ± 1.5212.57 ± 0.1912.79 ± 0.104.03 ± 0.0632.68 ± 1.67
QR9.77 ± 0.2115.88 ± 0.2331.64 ± 0.222.27 ± 0.0312.41 ± 0.1821.60 ± 0.31
KM0.91 ± 0.521.10 ± 0.671.24 ± 0.710.97 ± 0.811.19 ± 0.511.27 ± 0.22
AG157.22 ± 2.02234.58 ± 1.57255.39 ± 1.26272.34 ± 1.76123.22 ± 1.31206.65 ± 1.16
AG: apigenin. HP: hyperoside. KM: kaempferol. LT: luteolin. MR: myricetin. OR: orientin. QR: quercetin. RT: rutin. SD: standard deviation.
Publisher’s Note: MDPI stays neutral with regard to jurisdictional claims in published maps and institutional affiliations.

