1. Introduction
The dissociation constant (pK
a) of a drug molecule affects its adsorption, distribution, and metabolism. Therefore, pK
a data are important data for drug molecules. The liquid–liquid extraction [
1], precipitation [
2], adsorption [
3], or percolation of drug compounds [
4] are methods where the dissociation constants can be used in the process design and optimization. Accordingly, pK
a data are useful for the pharmaceutical industry. The determination of pK
a values is of great significance for the research and development of new drugs, production processes, and clinical pharmaceuticals.
Commonly used methods for determining pK
a values include potentiometric titration [
5], ultraviolet spectrophotometry [
6], capillary electrophoresis [
7], liquid chromatography [
8], and conductivity methods [
9]. The liquid–liquid equilibrium method can simultaneously determine the pK
a and distribution coefficient (
Dapp) values of multiple active ingredients in a complex mixture [
10], such as an herbal extract. The
Dapp data are useful for the selection of an extractant [
11]. When 1-octanol is used as the extractant to reach the liquid–liquid equilibrium, the log
P data of the active ingredients can also be calibrated.
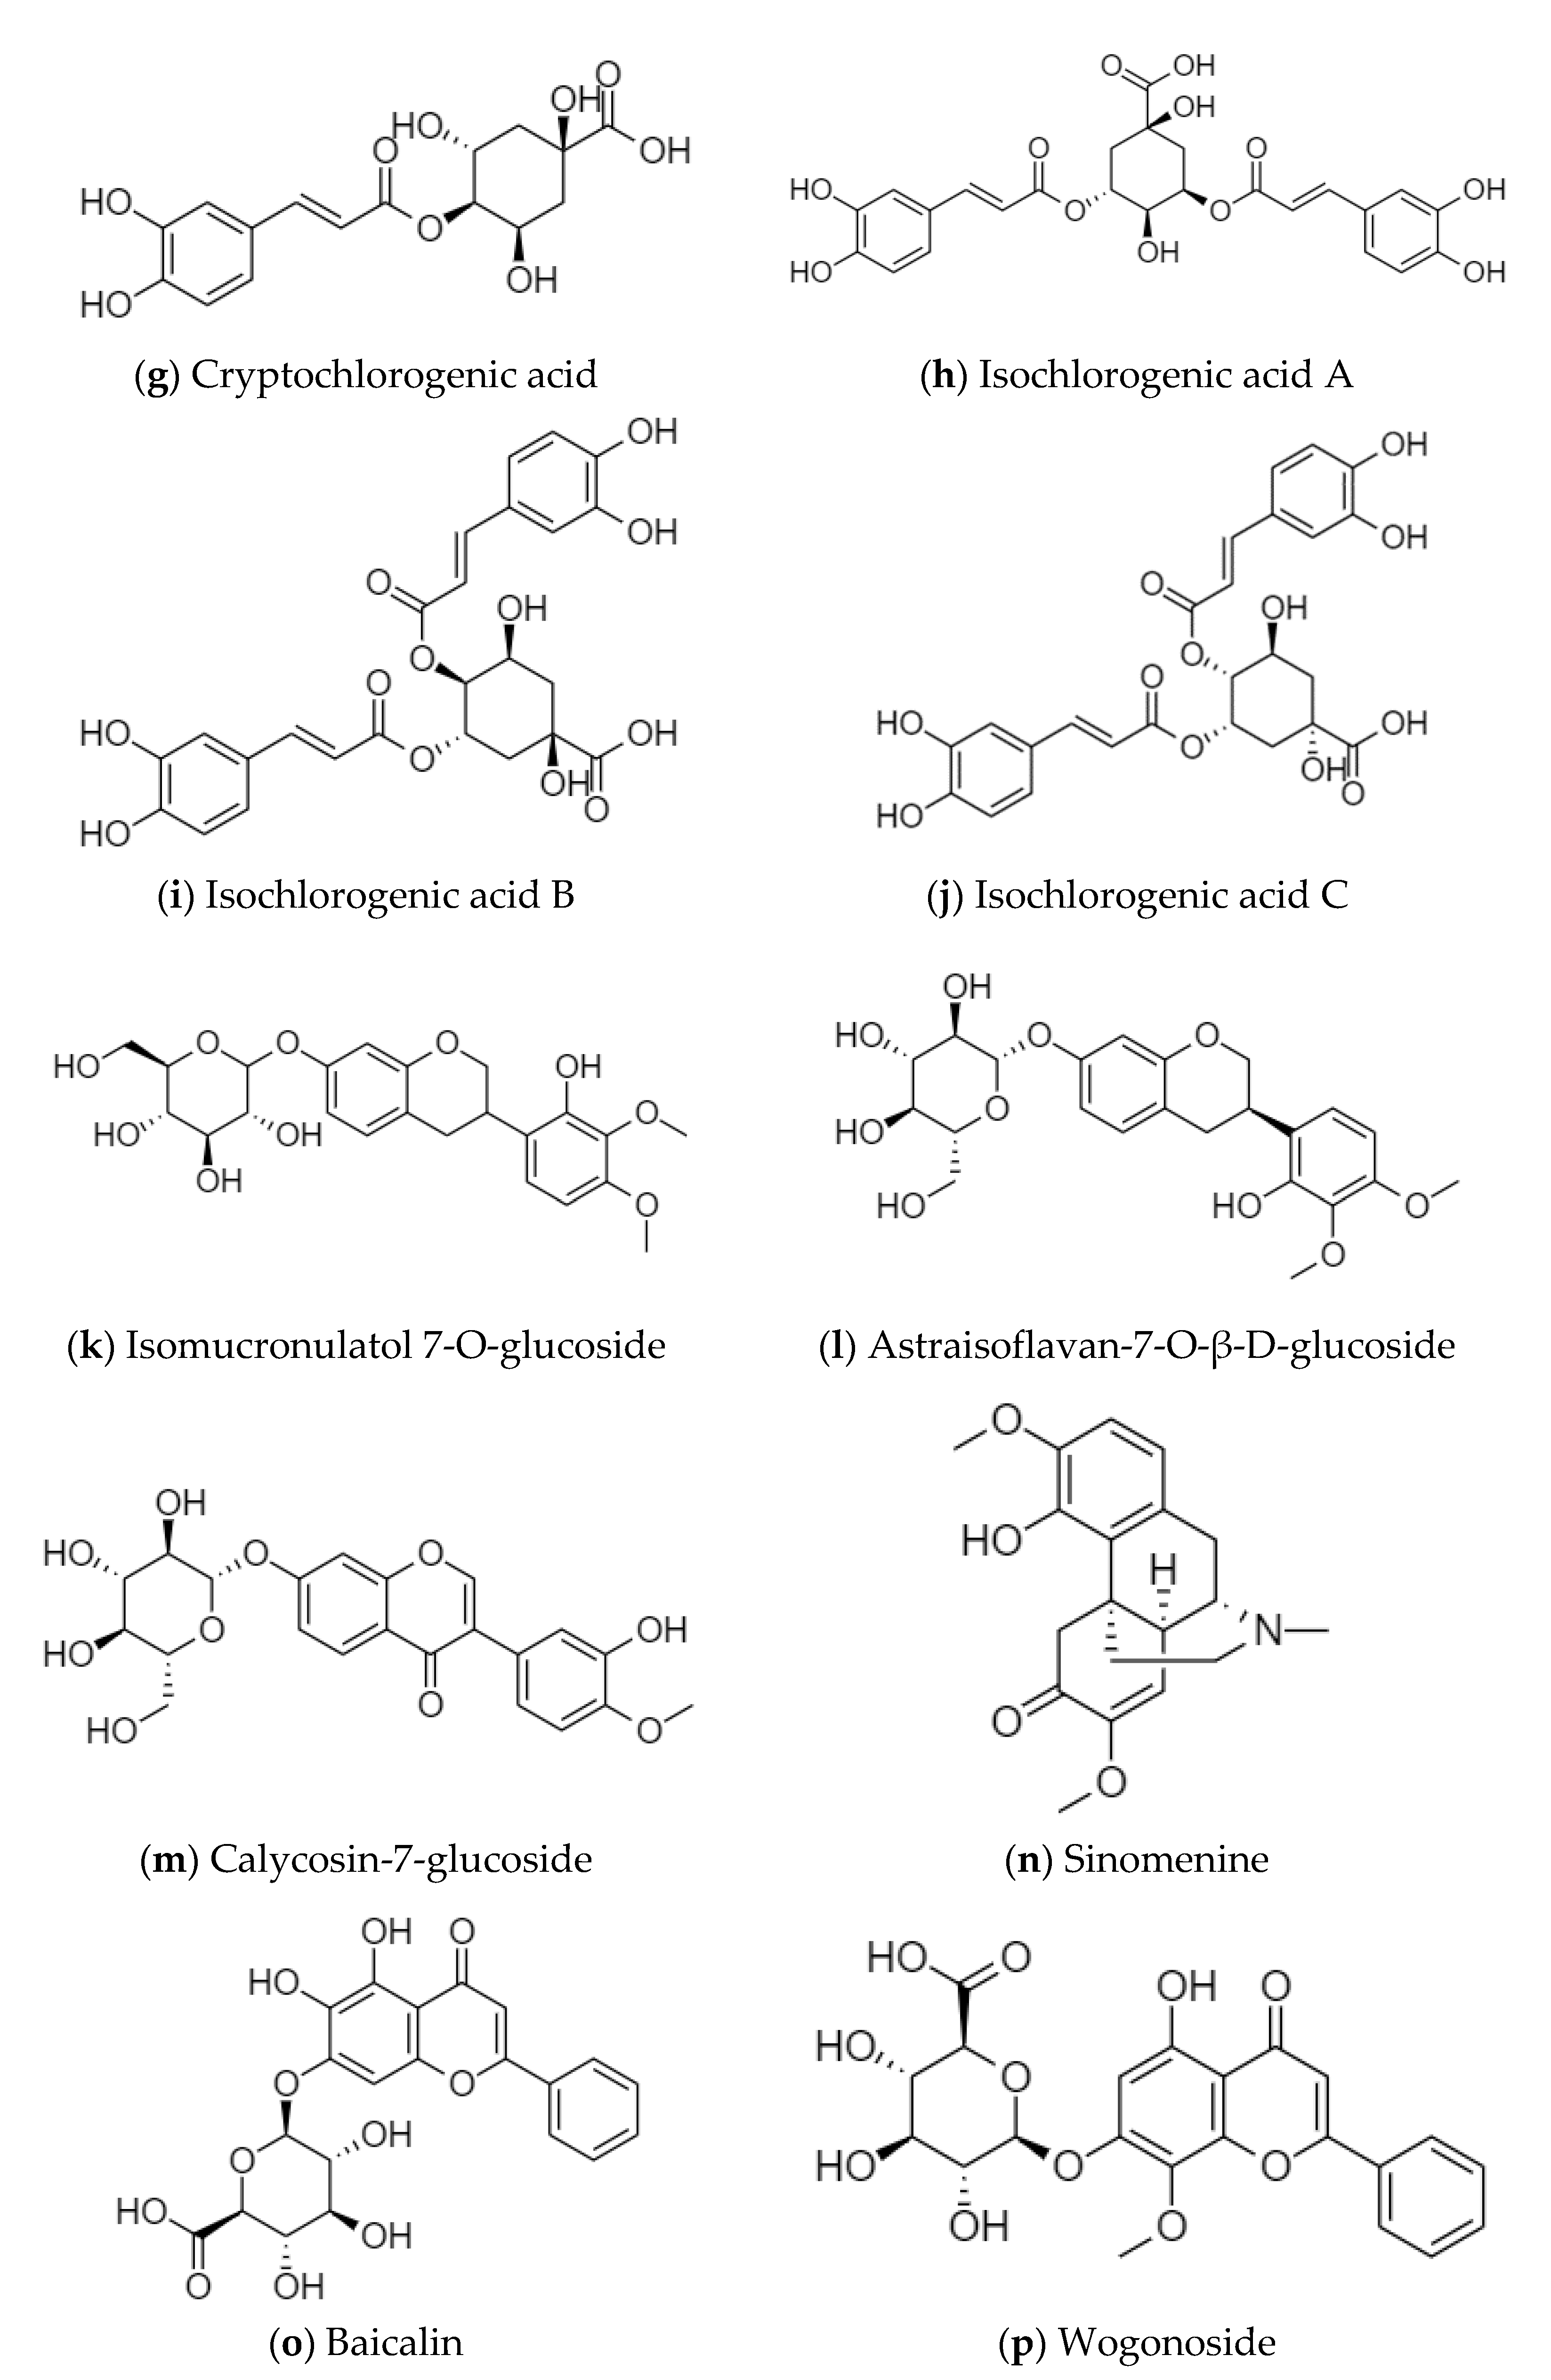
Sinomenine is the main active ingredient of Caulis Sinomenii, which has anti-inflammatory and immunosuppressive, analgesic and sedative, anti-arrhythmic, and antitumor activities [
12]. Aescins are the main active ingredients of Semen Aesculi, which have various activities, such as anti-inflammatory, anti-swelling, anti-exudation, improving microcirculation, antioxidation, and antitumor activities [
13]. Organic acids, such as chlorogenic acid and isochlorogenic acid, are the main active ingredients of Flos Lonicerae, which have antibacterial, anti-inflammatory, antiviral, hemostatic, and immune regulation activities [
14]. Flavonoids, such as baicalin and wogonoside, are the main active ingredients of Radix Scutellariae. Baicalin has the effect of scavenging superoxide free radicals, and wogonoside plays a role in protecting the cardiovascular and cerebrovascular systems [
15]. Calycosin-7-glucoside, astraisoflavan-7-O-β-D-glucoside, and isomucronulatol 7-O-glucoside are the main active ingredients of Radix Astragali. They have the functions of strengthening the exterior, an antiperspirant, promoting diuresis and detumescence, improving body fluid and blood circulation, clearing stagnation and unblocking arthralgia, preventing soreness, and promoting muscle regeneration [
16]. The structural formulas of the active ingredients in the above-mentioned medicinal herbs are shown in
Figure 1.
However, there are few reports on the pKa value and Dapp of these active ingredients. In this work, the liquid–liquid equilibrium method was used to determine their pKa and Dapp data, which can be used to optimize the conditions for the extraction or analysis of these active ingredients.
2. Material and Methods
2.1. Reagents and Materials
Semen Aesculi was provided by the Harbin Sanctity Biological Pharmaceutical Co., Ltd. (Harbin, China). Flos Lonicerae was provided by Shanghai Kaibao Pharmaceutical Co., Ltd. (Shanghai, China). Caulis Sinomenii was purchased from Bozhou Yonggang Decoction Pieces Co., Ltd. (Bozhou, China). Radix Astragali was provided by Limin Pharmaceutical Factory of Livzon Group (Zhuhai, China). Radix Scutellariae was purchased from Gudun Chinese Medicine Clinic of Baozhentang (Hangzhou, China).
Methanol (purity ≥ 99.5%, analytically pure), ethanol (purity ≥ 99.5%, analytically pure), 1-butanol (purity ≥ 99.5%, analytically pure), ethyl acetate (purity ≥ 99.5%, analytically pure), and trichloromethane (purity ≥ 99.5%, analytical purity) were purchased from the Sinopharm Chemical Reagent Co., Ltd. (Shanghai, China). Methyl isobutyl ketone (purity ≥ 99.5%, analytical purity) and ethylenediamine (purity ≥ 99%, chromatographic purity) were purchased from the Aladdin Chemical Reagent Co., Ltd. (Shanghai, China). Methanol (purity ≥ 99.9%, chromatographic purity) was purchased from Merck Chemical Technology Co., Ltd. (Darmstadt, Germany). 1-Octanol (purity ≥ 99.5%, analytical purity) was purchased from Shanghai Rhawn Chemical Technology Co., Ltd. (Shanghai, China). Sodium aescinate (33.5% aescin A, 31.4% aescin B, 17.8% aescin C, 14.2% aescin D) was purchased from the China Institute for Food and Drug Control. Sinomenine (≥98%), neochlorogenic acid (>99%), chlorogenic acid (>99%), cryptochlorogenic acid (>99%), isochlorogenic acid B (>99%), isochlorogenic acid A (>99%), isochlorogenic acid C (>99%), isomucronulatol 7-O-glucoside (>99%), astraisoflavan-7-O-β-D-glucoside (>99%), calycosin-7-glucoside (>99%), baicalin (>99%), and wogonoside (>99%) were purchased from the Shanghai Winherb Medical Technology Co., Ltd. (Shanghai, China).
2.2. Preparation of Medicinal Material Extract
2.2.1. Preparation of Caulis Sinomenii Extract
A total of 100.0 g of Caulis Sinomenii medicinal powder and a certain amount of 0.3 mol/L of hydrochloric acid were placed into a beaker to swell for 1 h. Then the mixture was transferred into a percolation tube to immerse for 12 h. Finally, about 800 mL Caulis Sinomenii extract was obtained using a percolation process with 0.3 mol/L of hydrochloric acid as the solvent solution at a flow rate of 4 mL/min.
2.2.2. Preparation of Semen Aesculi Extract
About 100.0 g of Semen Aesculi powder was extracted using 200.0 g of ether at room temperature with stirring for 3 h. After filtration, 200.0 g of ether was added to the filter residue to continue the extraction with stirring for 3 h. After filtration, 300.0 g of 60% ethanol was added to the filter residue to allow for extraction with stirring for 12 h. After filtration, the filtrates were concentrated to an appropriate amount at 40 °C. The Semen Aesculi extract was obtained via drying in a vacuum drying oven at 65 °C.
2.2.3. Preparation of the Flos Lonicerae, Radix Scutellariae, and Radix Astragali Extracts
A total of 40.0 g of Flos Lonicerae and 500 mL of water were mixed to allow for reflux extraction for 3 h at room temperature. The Flos Lonicerae extract was obtained after filtration. A total of 40.0 g of Radix Scutellariae and 1000 mL of water were mixed to allow for boiling extraction for 2 h. The Radix Scutellariae extract was obtained after filtration. A total of 50.0 g of Radix Astragali and 800 mL of water were mixed and decocted for 4 h. The Radix Astragali extract was obtained after filtration.
2.3. Liquid–Liquid Equilibrium Extraction Experiment
2.3.1. Liquid–Liquid Equilibrium Experiment of Caulis Sinomenii
About 30 g of Caulis Sinomenii extract and 30 g of organic extractant were placed into each Erlenmeyer flask with different amounts of NaOH solution being added to adjust the pH value, which was measured using a pH meter (S40, Mettler-Toledo Instruments Co., Ltd., Shanghai, China). Erlenmeyer flasks were placed in a constant temperature water bath oscillator (DSHZ-300, Taicang City Experimental Equipment Factory, Taicang, China) at 30 °C and shaken at 110 rpm for 12 h. Then, the organic and aqueous phases in the mixed solution were separated using a centrifuge (5804R, Eppendorf, Shanghai, China) at 4200 rpm for 15 min. The pH value of the aqueous phase was then measured. The aqueous phase was diluted with 0.3 mol/L of hydrochloric acid and the organic phase was diluted with methanol. After filtering with a 0.22 μm microporous membrane (Fitmax Syringe Filter 13 mm 0.22 μm Nylon 100/pk, Dikma, Beijing, China), the subsequent filtrate was taken out for high-performance liquid chromatography (HPLC) (FL5090, Zhejiang Fuli Analytical Instrument Co., Ltd., Taizhou, China) analysis. Experiments were carried out in different extraction systems, where the experimental conditions are shown in
Table 1.
2.3.2. Liquid–Liquid Equilibrium Experiment Using Semen Aesculi
About 0.25 g of Semen Aesculi extract, 30.0 g of water, and 30 g of 1-butanol were added to each Erlenmeyer flask with different amounts of 1% hydrochloric acid and 1% NaOH solution added to adjust the pH value. Then, Erlenmeyer flasks were placed in a constant-temperature water bath oscillator at 30 °C and shaken at 140 rpm for 12 h. After centrifugation, the organic and aqueous phases in the mixture were separated, and the pH value of the aqueous phase was measured. The two phases were diluted with methanol separately. These solutions were filtered through a 0.22 μm filter membrane and analyzed using HPLC.
2.3.3. Liquid–Liquid Equilibrium Experiment Using Flos Lonicerae
A total of 15 mL of Flos Lonicerae extract and 10 mL of 1-octanol were placed into each Erlenmeyer flask. Different amounts of 1% hydrochloric acid solution were used to adjust the pH value. Then, Erlenmeyer flasks were placed in a constant temperature water bath oscillator at 30 °C and shaken at 140 rpm for 12 h. The solution was centrifuged at 3000 rpm for 20 min to separate the two-phase solution, and the pH value of the aqueous phase was measured. The concentrations of the neochlorogenic acid, chlorogenic acid, cryptochlorogenic acid, isochlorogenic acid B, isochlorogenic acid A, and isochlorogenic acid C in each phase were determined using HPLC (1100, Agilent Technology, Beijing, China).
2.3.4. Liquid–Liquid Equilibrium Experiment Using Radix Scutellariae
A total of 15 mL of the Radix Scutellariae extract and 10 mL of 1-octanol were added to each Erlenmeyer flask, and different amounts of 1% hydrochloric acid solution were used to adjust the pH value. Then, Erlenmeyer flasks were shaken for 10 h at 140 rpm at 30 °C. The aqueous and organic phases were separated via centrifugation at 3000 rpm for 20 min. After being filtered with a 0.22 μm microporous membrane, the solution was analyzed using HPLC to determine the concentrations of baicalin and wogonoside in each phase.
2.3.5. Liquid–Liquid Equilibrium Experiment Using Radix Astragali
A total of 15 mL of Radix Astragali extract and 10 mL of 1-octanol were added to each Erlenmeyer flask. Different amounts of 1% hydrochloric acid solution or 0.02 g/mL of NaOH solution were used to adjust the pH value. The Erlenmeyer flasks were shaken for 10 h at 140 rpm in a 30 °C constant-temperature oscillator. The aqueous and organic phases were separated via centrifugation at 3000 rpm for 20 min. After being filtered with a 0.22 μm microporous membrane, the solution was analyzed using HPLC to determine the concentrations of isomucronulatol 7-O-glucoside, astraisoflavan-7-O-β-D-glucoside, and calycosin-7-glucoside in each phase.
2.4. Analysis Method
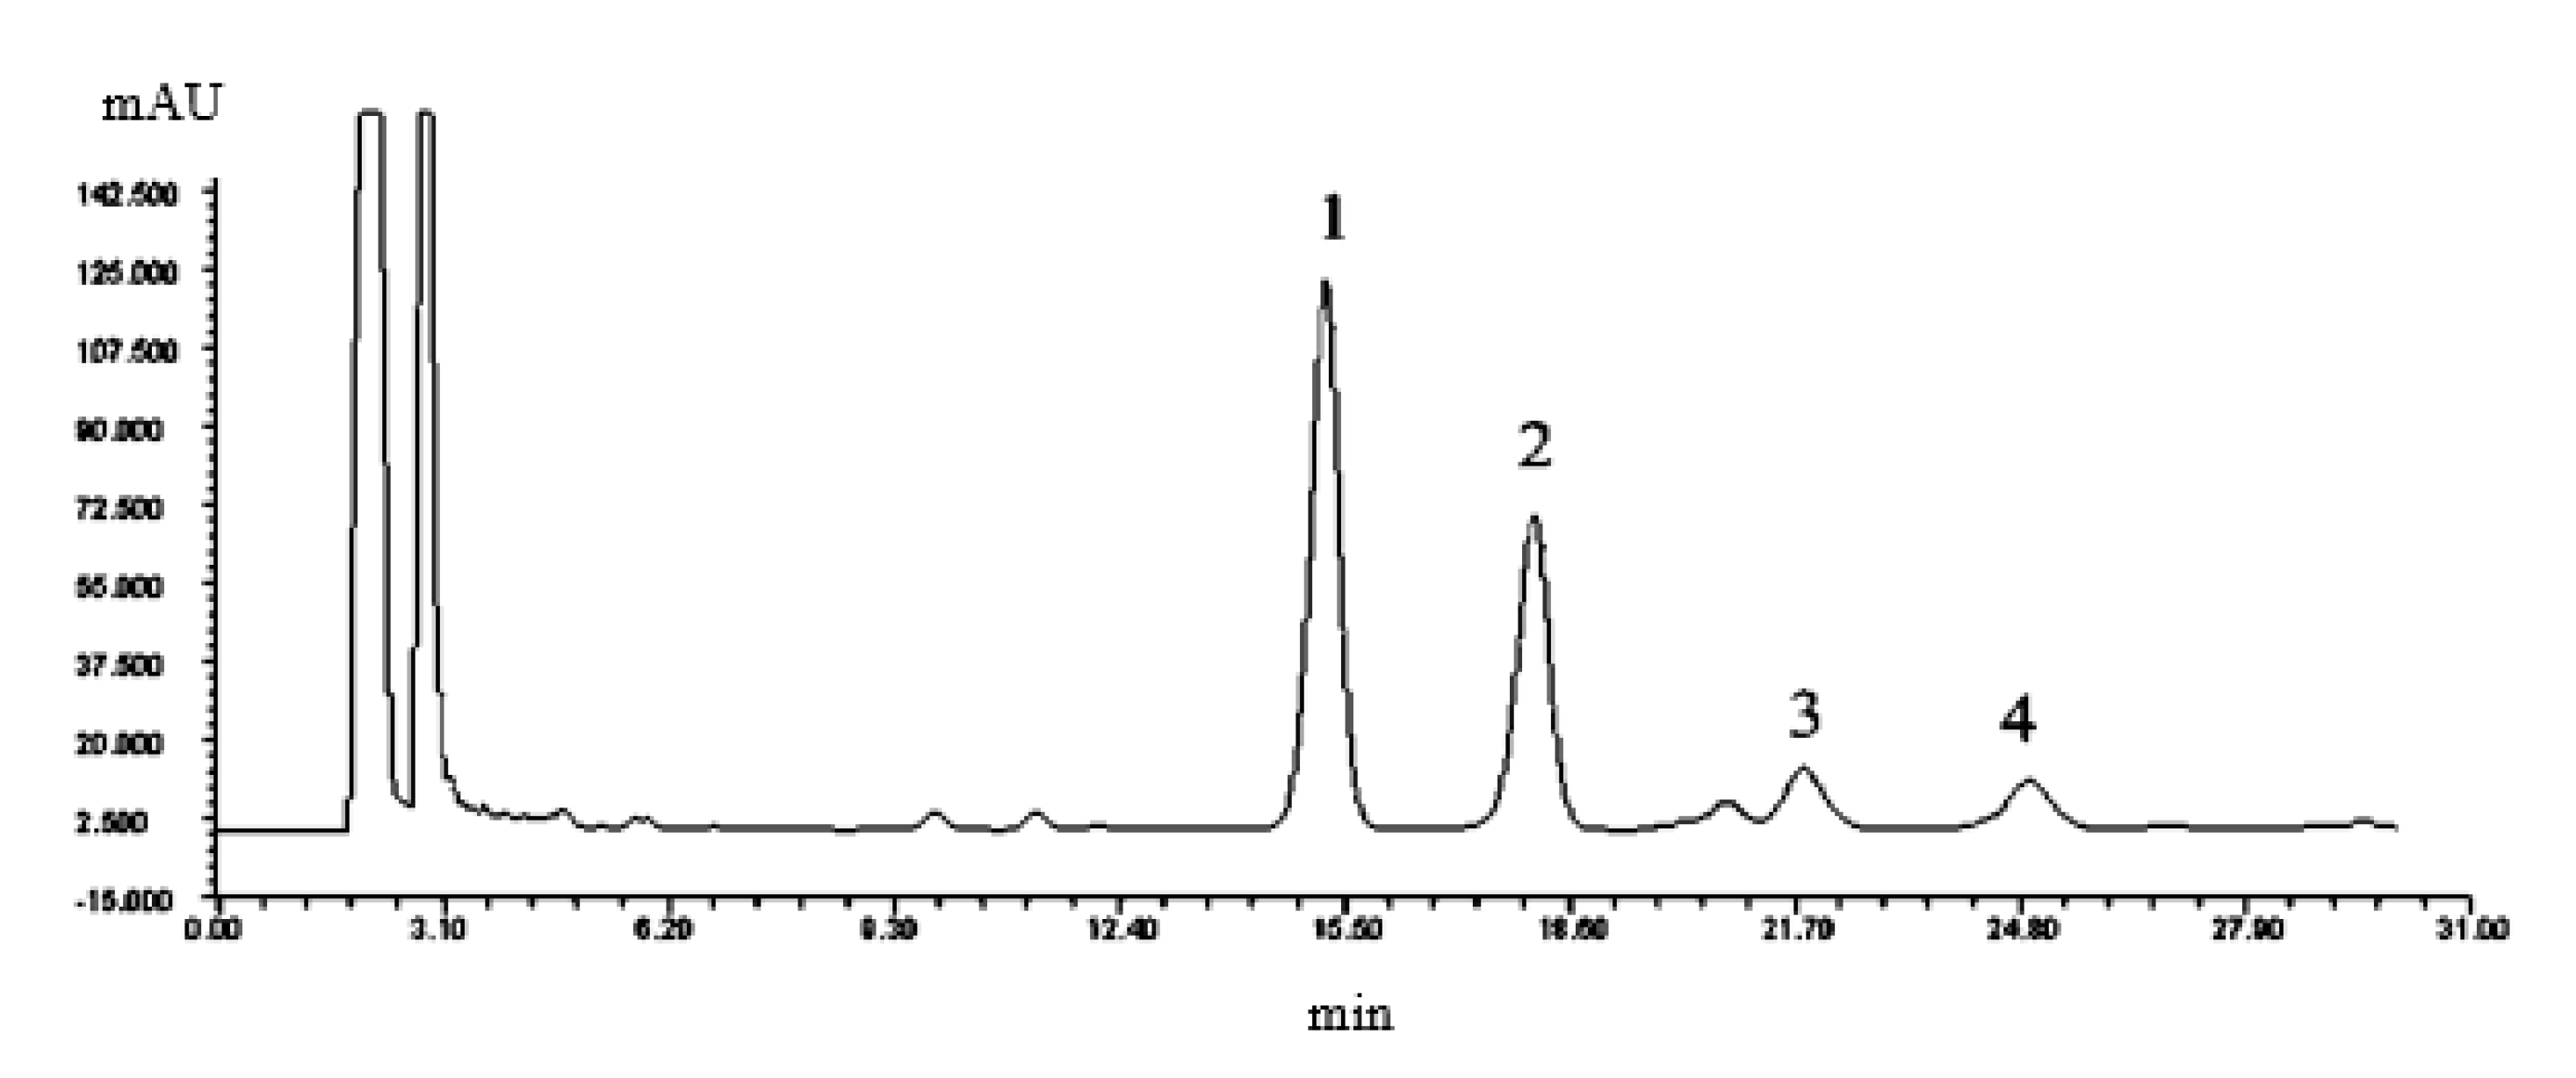
2.4.1. Analysis Method of Sinomenine in Caulis Sinomenii
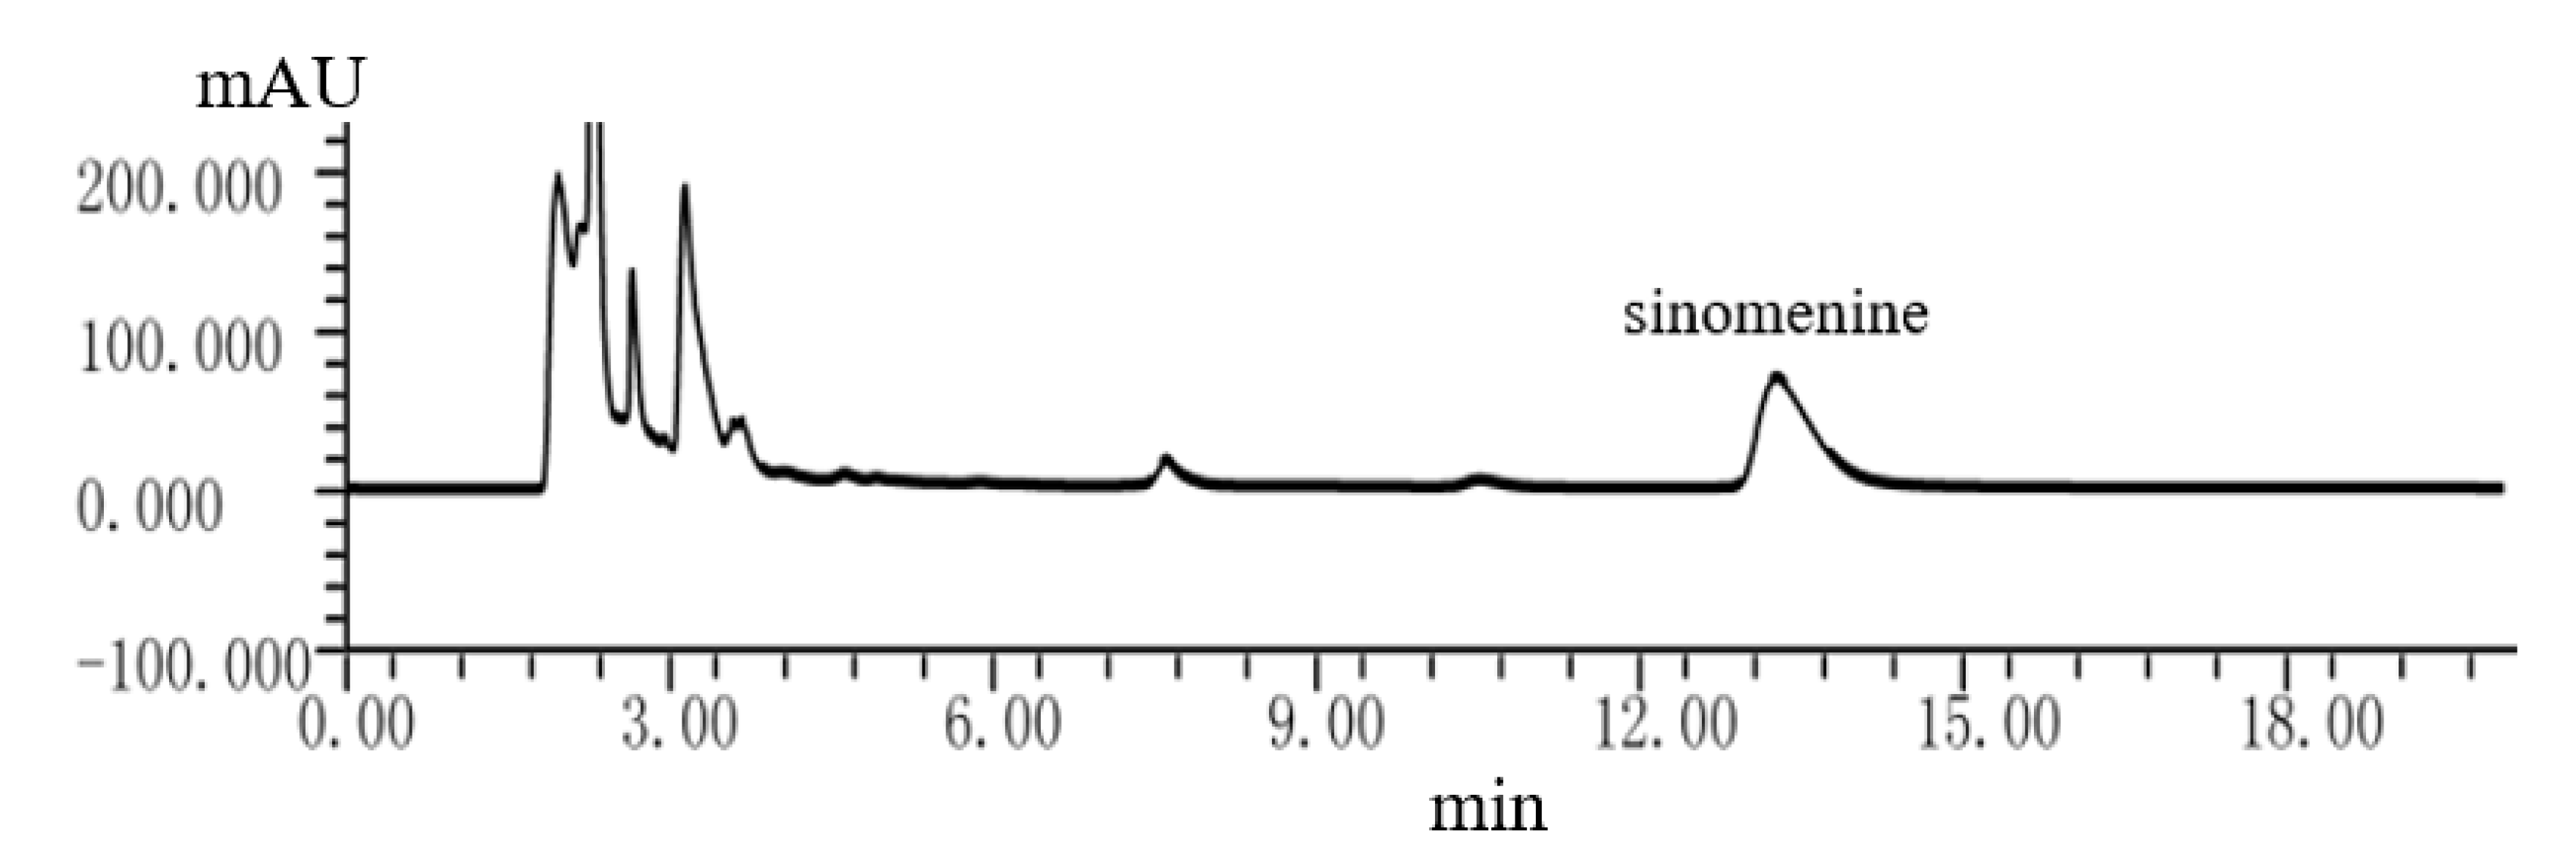
The method was performed on a Fuli HPLC system using an Agilent ZORBAX SB-C18 column (250 mm × 4.6 mm, 5 μm) at 25 °C. The mobile phase consisted of 0.25% ethylenediamine–water (A) and 0.25% ethylenediamine–methanol (B) using (50/50,
v/
v) gradient program. The flow rate was 1 mL/min and the volume of the sample injection was 10 μL. The detector wavelength was set to 262 nm. The detection time was 30 min. A typical chromatogram of the Caulis Sinomenii system is shown in
Figure A1 in the
Appendix A.
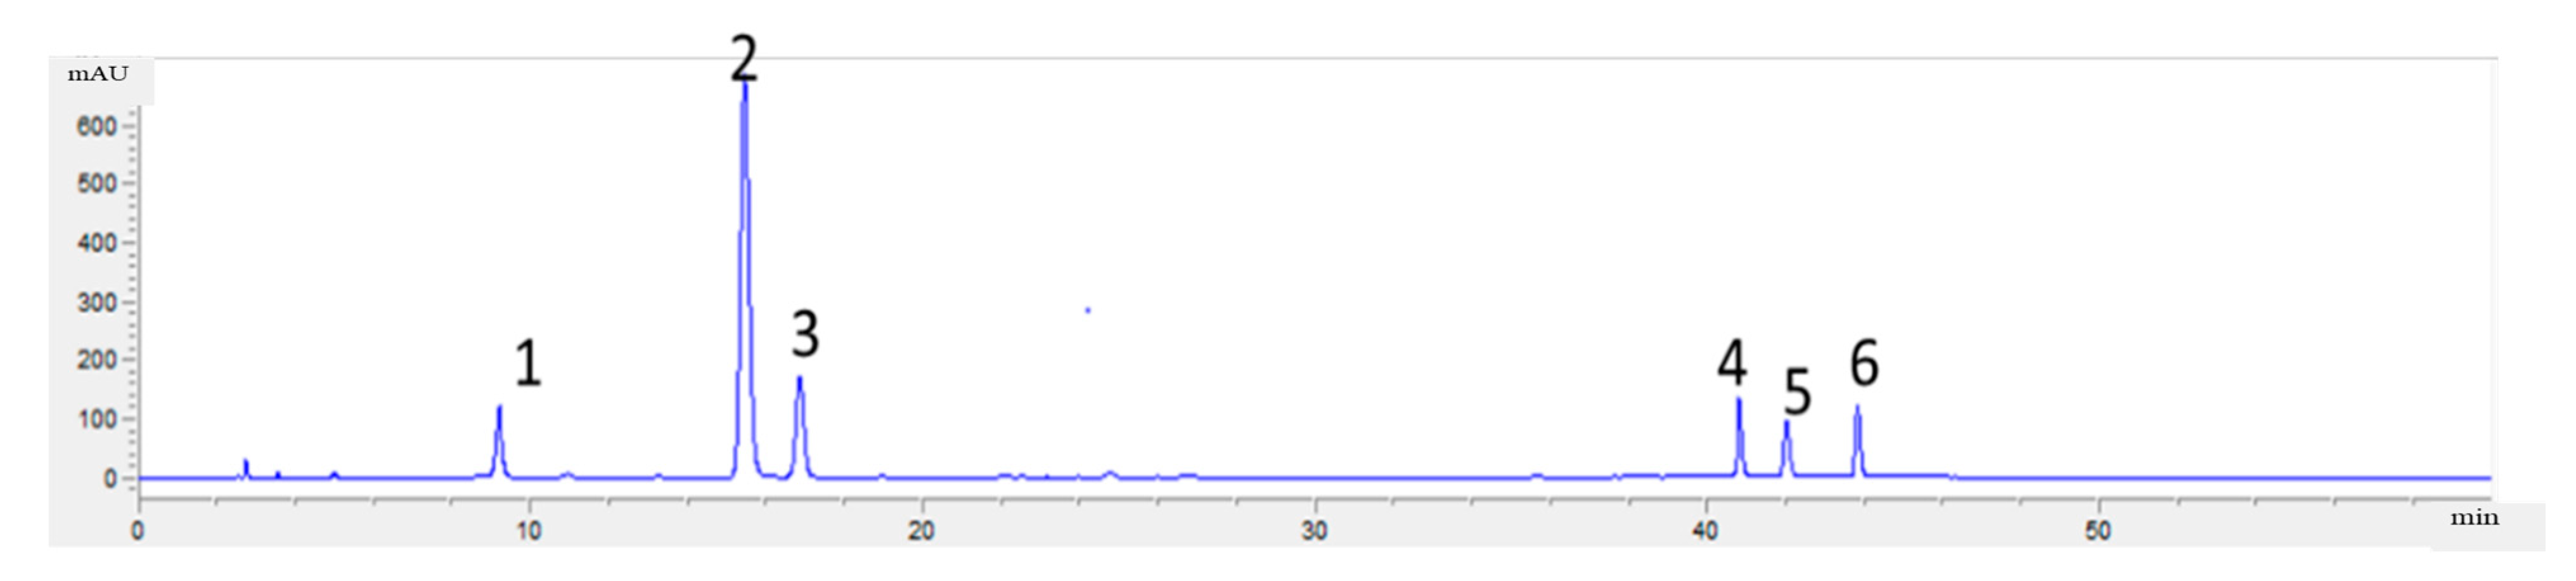
2.4.2. Analysis Method of Aescins in Semen Aesculi
The concentrations of aescin A, aescin B, aescin C, and aescin D were determined using HPLC analysis according to the method published by Cao et al. [
17]. The method was performed on a Fuli HPLC system using an Agilent ZORBAX SB-C18 column (250 mm × 4.6 mm, 5 μm) at 35 °C. The mobile phase consisted of 0.2% phosphoric acid–water (A) and acetonitrile (B) using a 63/37 (
v/
v) gradient program. The flow rate was 1 mL/min, and the injection volume was 10 μL. The detector wavelength was set to 220 nm. The detection time was 30 min. A typical chromatogram of Semen Aesculi is shown in
Figure A2 in the
Appendix A.
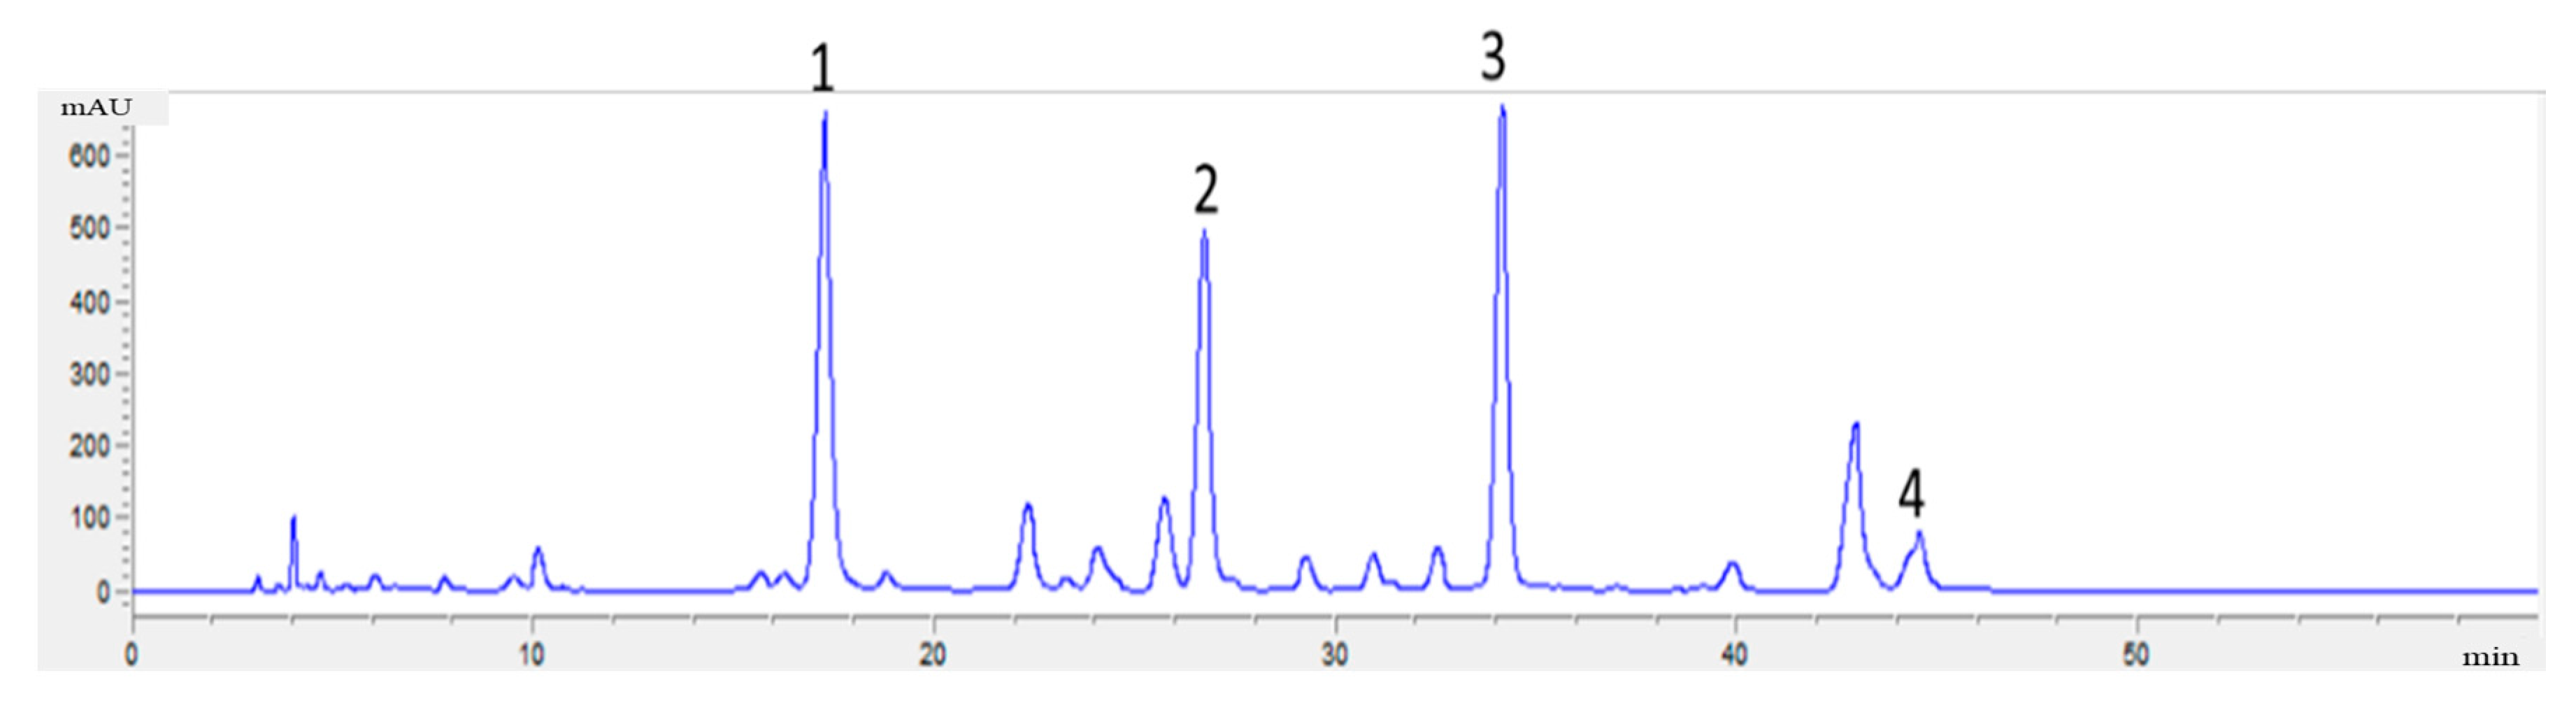
2.4.3. Analysis Method of Phenolic Acids in Flos Lonicerae
The concentrations of chlorogenic acid, neochlorogenic acid, isochlorogenic acids A, B, and C, and cryptochlorogenic acid were determined using HPLC analysis according to the method published by Wang et al. [
18]. The method was performed on an Agilent HPLC system using an Agilent ZORBAX SB-C18 column (250 mm × 4.6 mm, 5 μm) at 30 °C. The mobile phase consisted of 0.1% phosphoric acid–water (A) and acetonitrile (B) using the following gradient program: 8–10% B from 0 to 10 min, 10–15% B from 10 to 20 min, 15–15% B from 20 to 30 min, 15–25% B from 30 to 40 min, and 25–100% B from 40 to 60 min. The flow rate was 1 mL/min and the volume of the sample injection was 10 μL. The detector wavelength was set to 325 nm. The detection time was 30 min. A typical chromatogram of Flos Lonicerae is shown in
Figure A3 in the
Appendix A.
2.4.4. Analysis Method of Flavonoids in Radix Scutellariae
The concentrations of baicalin and wogonoside were determined using HPLC analysis according to the method published by Zhu et al. [
19]. The method was performed on an Agilent HPLC system using an Agilent ZORBAX SB-C18 column (250 mm × 4.6 mm, 5 μm) at 25 °C. The mobile phase consisted of 0.2% phosphoric acid–water(A) and methanol (B) using the following gradient program: 45–45% B from 0 to 10 min and 45–70% B from 10 to 55 min. The flow rate was 1 mL/min and the injection volume was 10 μL. The detector wavelength was set to 274 nm. The detection time was 30 min. A typical chromatogram of Radix Scutellariae is shown in
Figure A4 in the
Appendix A.
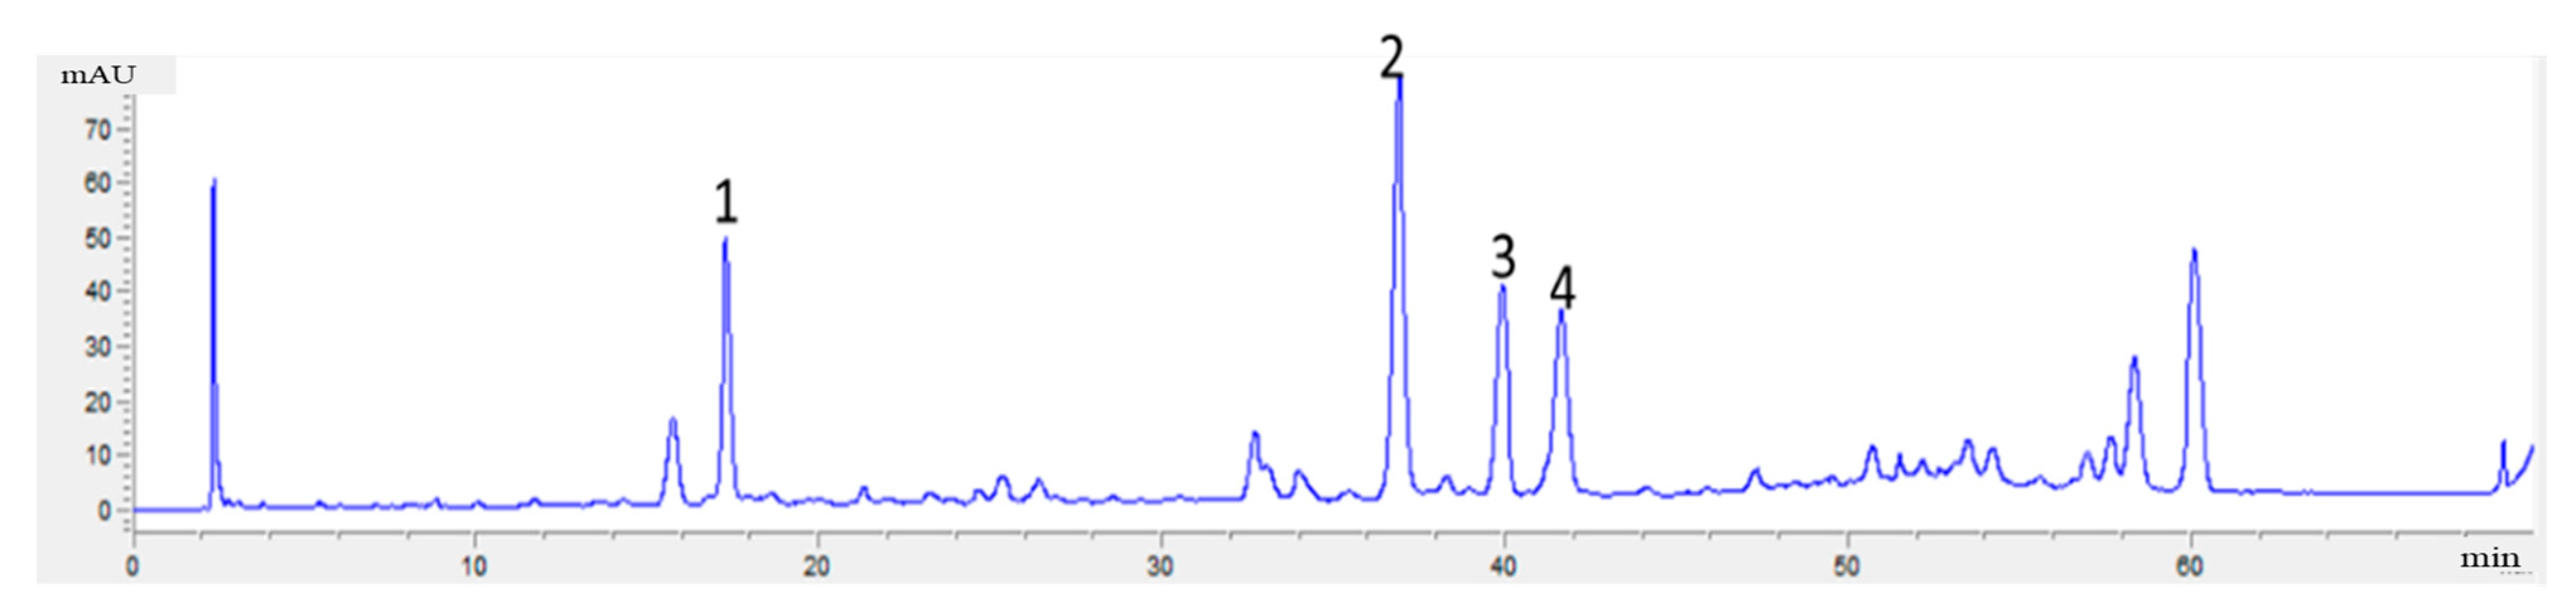
2.4.5. Analysis Method of Flavonoids in Radix Astragali
The concentrations of calycosin-7-glucoside, astraisoflavan-7-O-β-D-glucoside, and isomucronulatol 7-O-glucoside were determined using HPLC analysis according to the method published by Chen et al. [
20]. The method was performed on an Agilent HPLC system using a Diamonsil C18 column (250 mm × 4.6 mm, 5 μm) at 35 °C. The mobile phase consisted of 0.05% formic acid–water (A) and acetonitrile (B) using the following gradient program: 15–29% B from 0 to 40 min, 29–40% B from 40 to 50 min, 40–40% B from 50 to 60 min, and 40–90% B from 60 to 70 min. The flow rate was 1 mL/min and the volume of the sample injection was 10 μL. The detector wavelength was set to 210 nm. The detection time was 30 min. A typical chromatogram of Radix Astragali is shown in
Figure A5 in the
Appendix A.
2.5. Data Processing
2.5.1. pKa Fitting of the Active Ingredients in Semen Aesculi, Flos Lonicerae, Radix Scutellariae, and Radix Astragali
For active ingredients in Semen Aesculi, Flos Lonicerae, Radix Scutellariae, and Radix Astragali, the nonlinear fitting formulas for
and
derived by Gong et al. [
10] were used to fit the
, as shown in Formulas (1)–(3).
where
is the apparent distribution coefficient,
(mg/L) refers to the concentration of the target component, and the subscripts org and aq refer to the organic phase and the water phase, respectively.
where
is the distribution coefficient of the molecule, and
is the distribution coefficient of the first-order dissociated ion. When fitting, the logarithms of both sides of the formula were taken to get the following formula:
where
and
are the base 10 logarithms of
and
, respectively.
2.5.2. pKa Fitting of Sinomenine
Sinomenine is an alkaloid and its structural formula is shown in
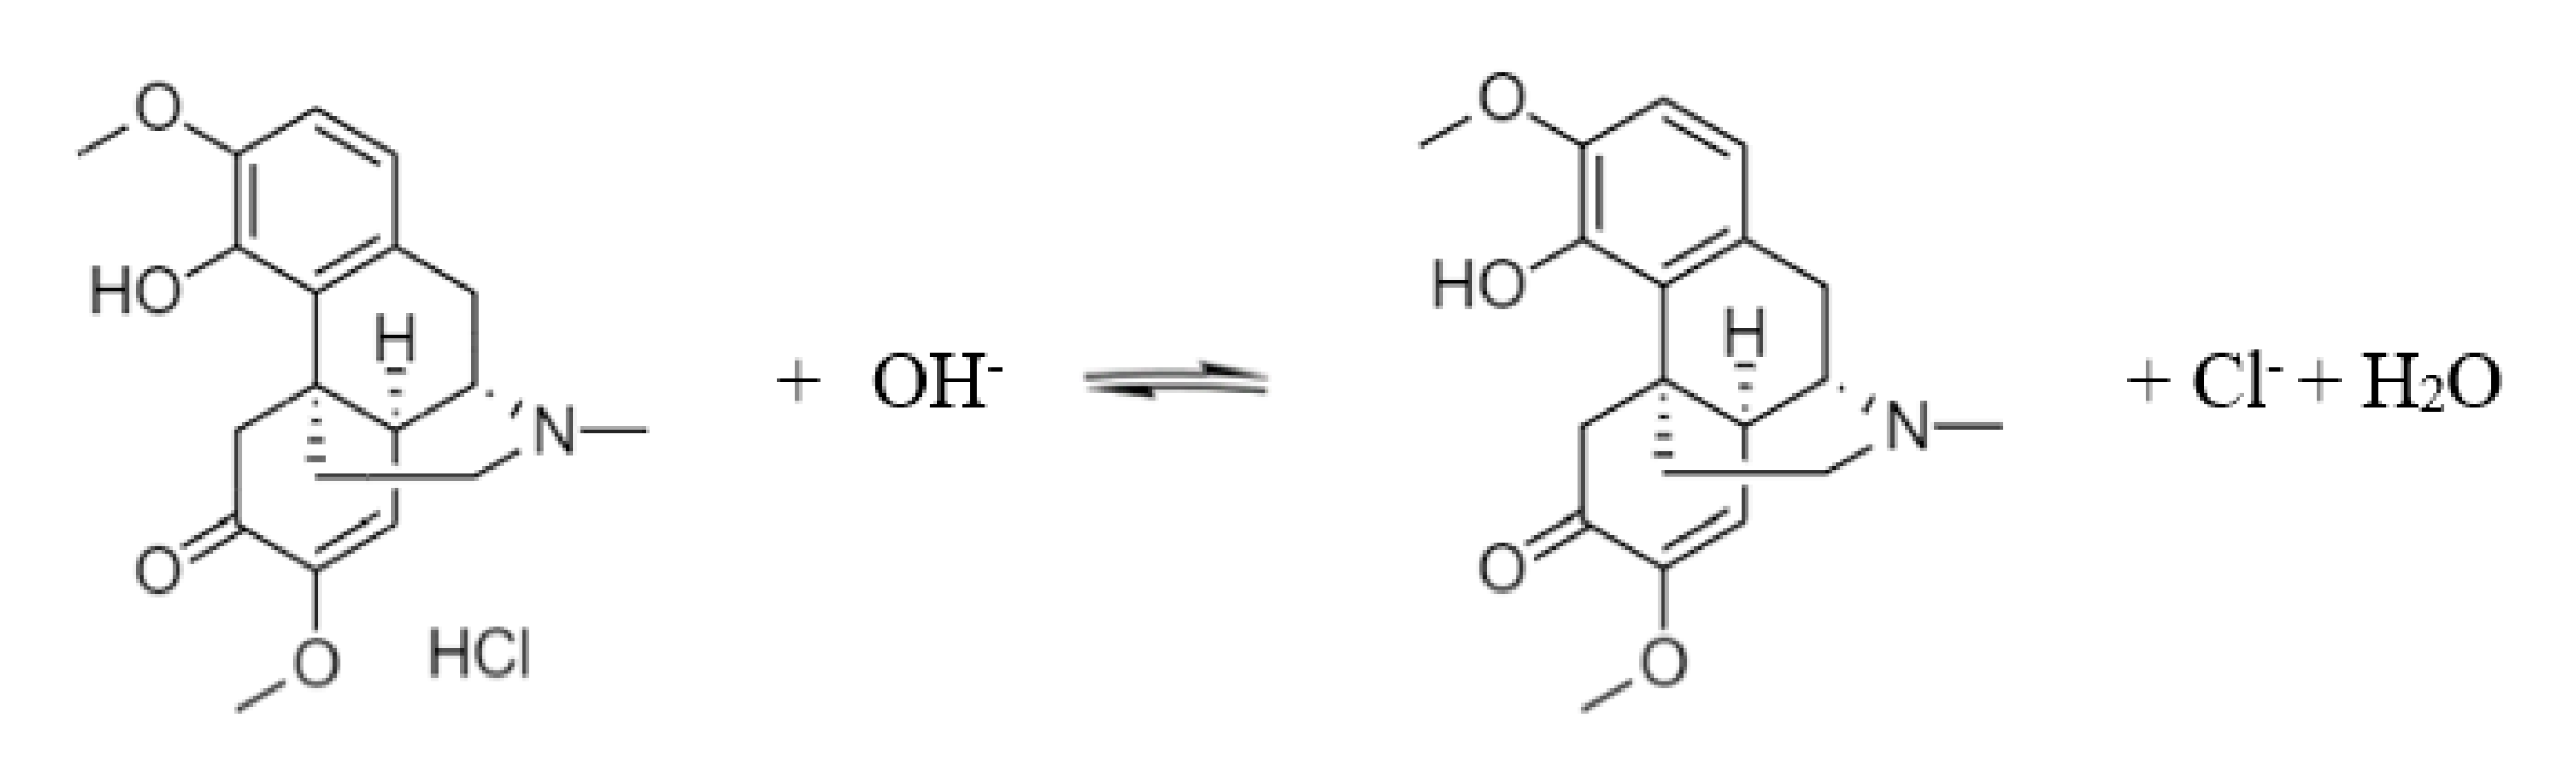
Figure 1. It shows that the dissociable groups of sinomenine are mainly tertiary amino groups and phenolic hydroxyl groups. When 0.3 mol/L of hydrochloric acid was used to extract Caulis Sinomenii, the tertiary amino group on sinomenine reacted with hydrochloric acid to form sinomenine hydrochloride salt. When exposed to alkali, the sinomenine hydrochloride salt removes the hydrochloric acid to generate sinomenine molecules. The reaction equation is shown in
Scheme 1.
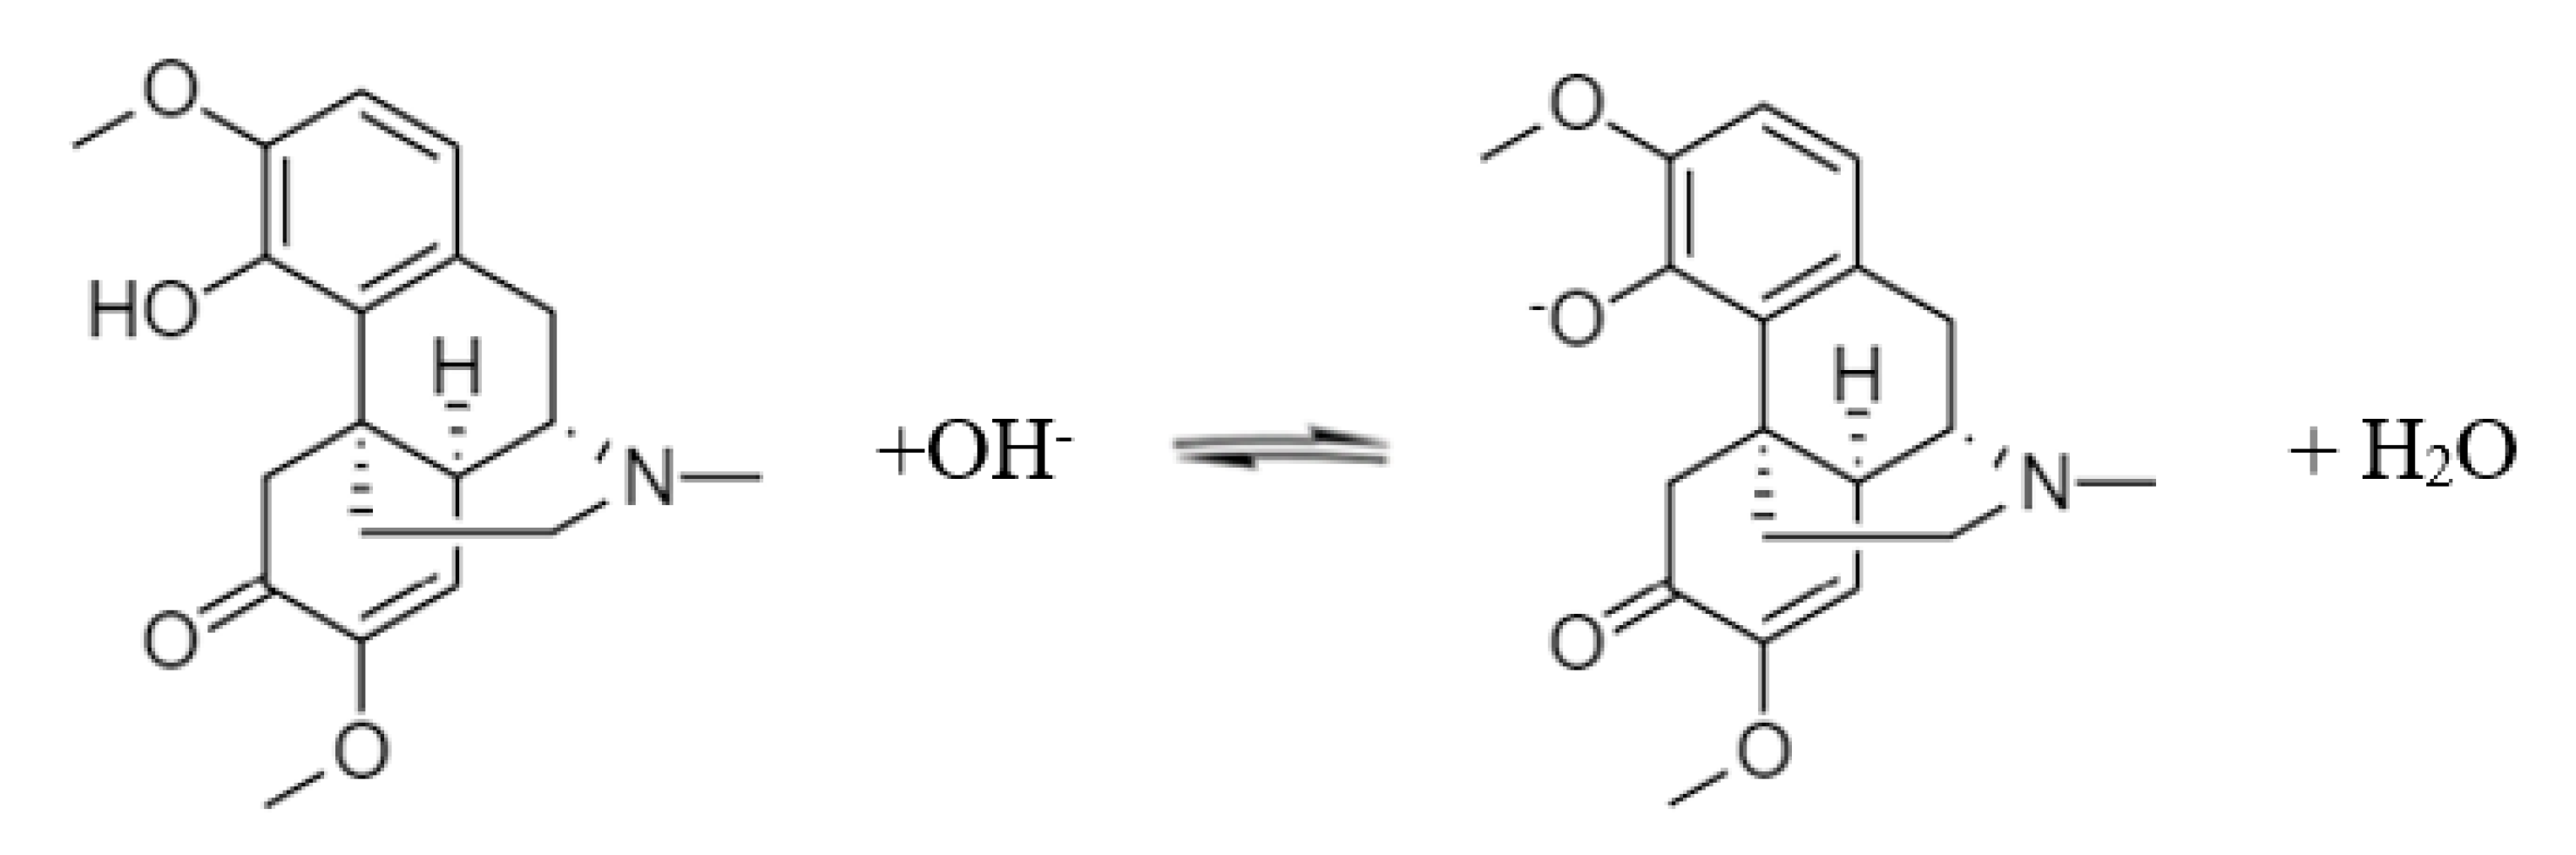
With further exposure to an alkali, the phenolic hydroxyl group on the sinomenine molecule ionizes to form a salt. The sodium salt of sinomenine is soluble in water. The reaction equation is shown in
Scheme 2.
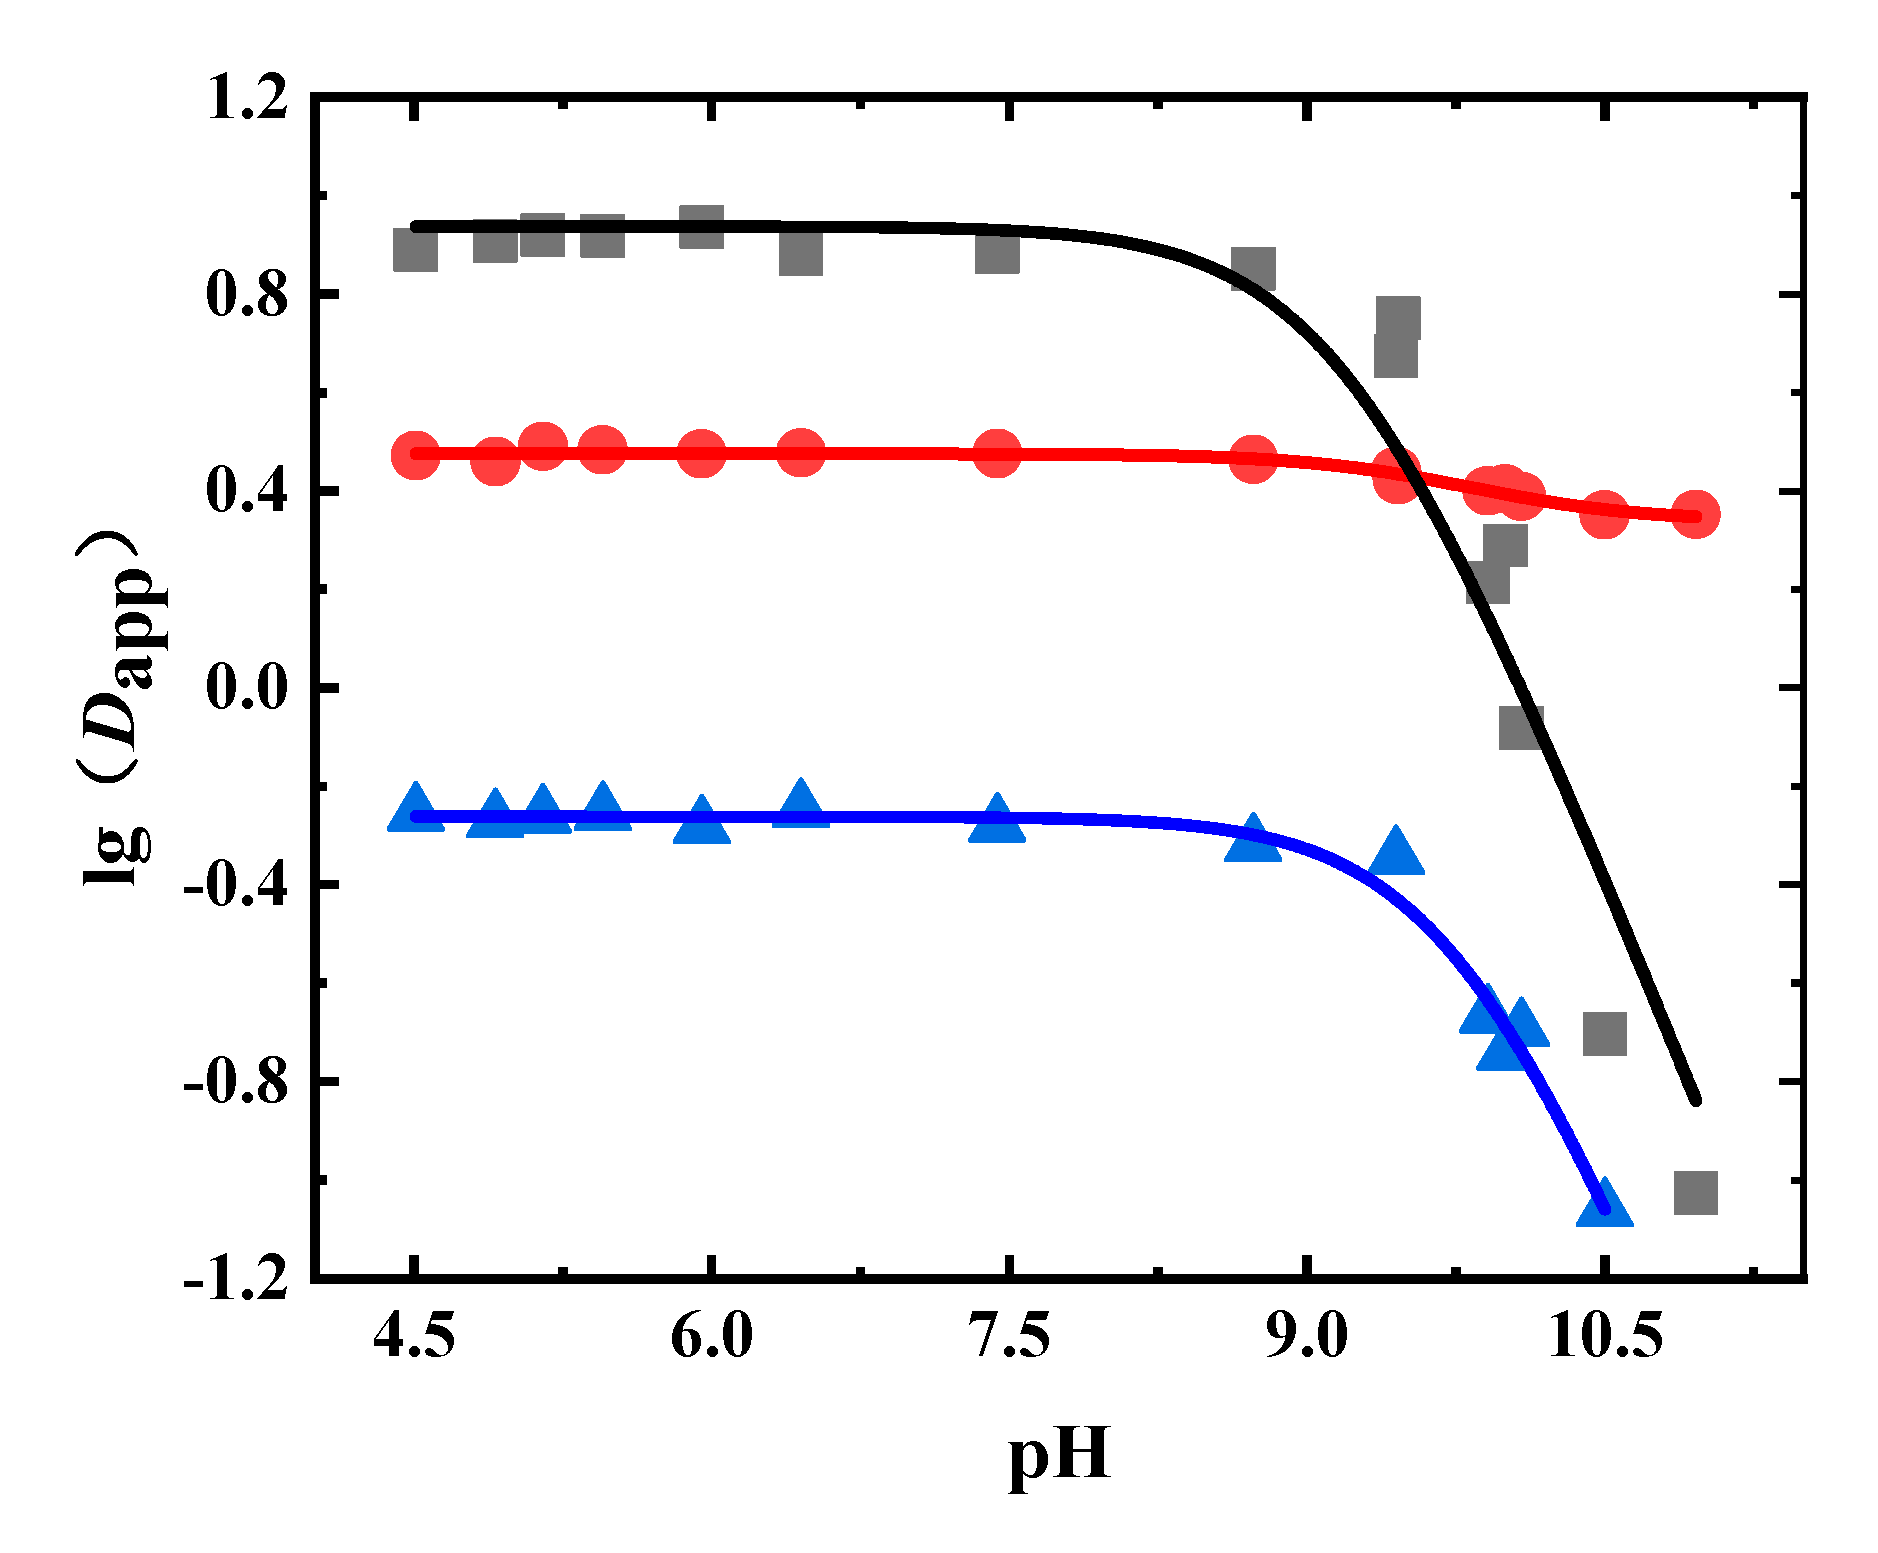
Sinomenine hydrochloride can be regarded as a dibasic acid when the two pK
a values of sinomenine were fitted simultaneously. The hydrochloric acid is completely removed during the first dissociation, and the phenolic hydroxyl group is ionized during the second dissociation. Based on Gong et al. [
10], Formula (4) was used for the data fitting:
where
is the distribution coefficient of sinomenine after the secondary dissociation,
is the first dissociated
(the
of sinomenine hydrochloride), and
is the
of the secondary dissociation (the
of the phenolic hydroxyl group). When fitting, the logarithm of both sides of the formula was also taken to obtain Formula (5):
where
is the base 10 logarithm of
. If a value of
,
, or
was less than −20, the corresponding distribution coefficient was considered to be extremely small. In order to facilitate the fitting of other parameters, the value of the extremely small
,
, or
was set to −20.
4. Conclusions
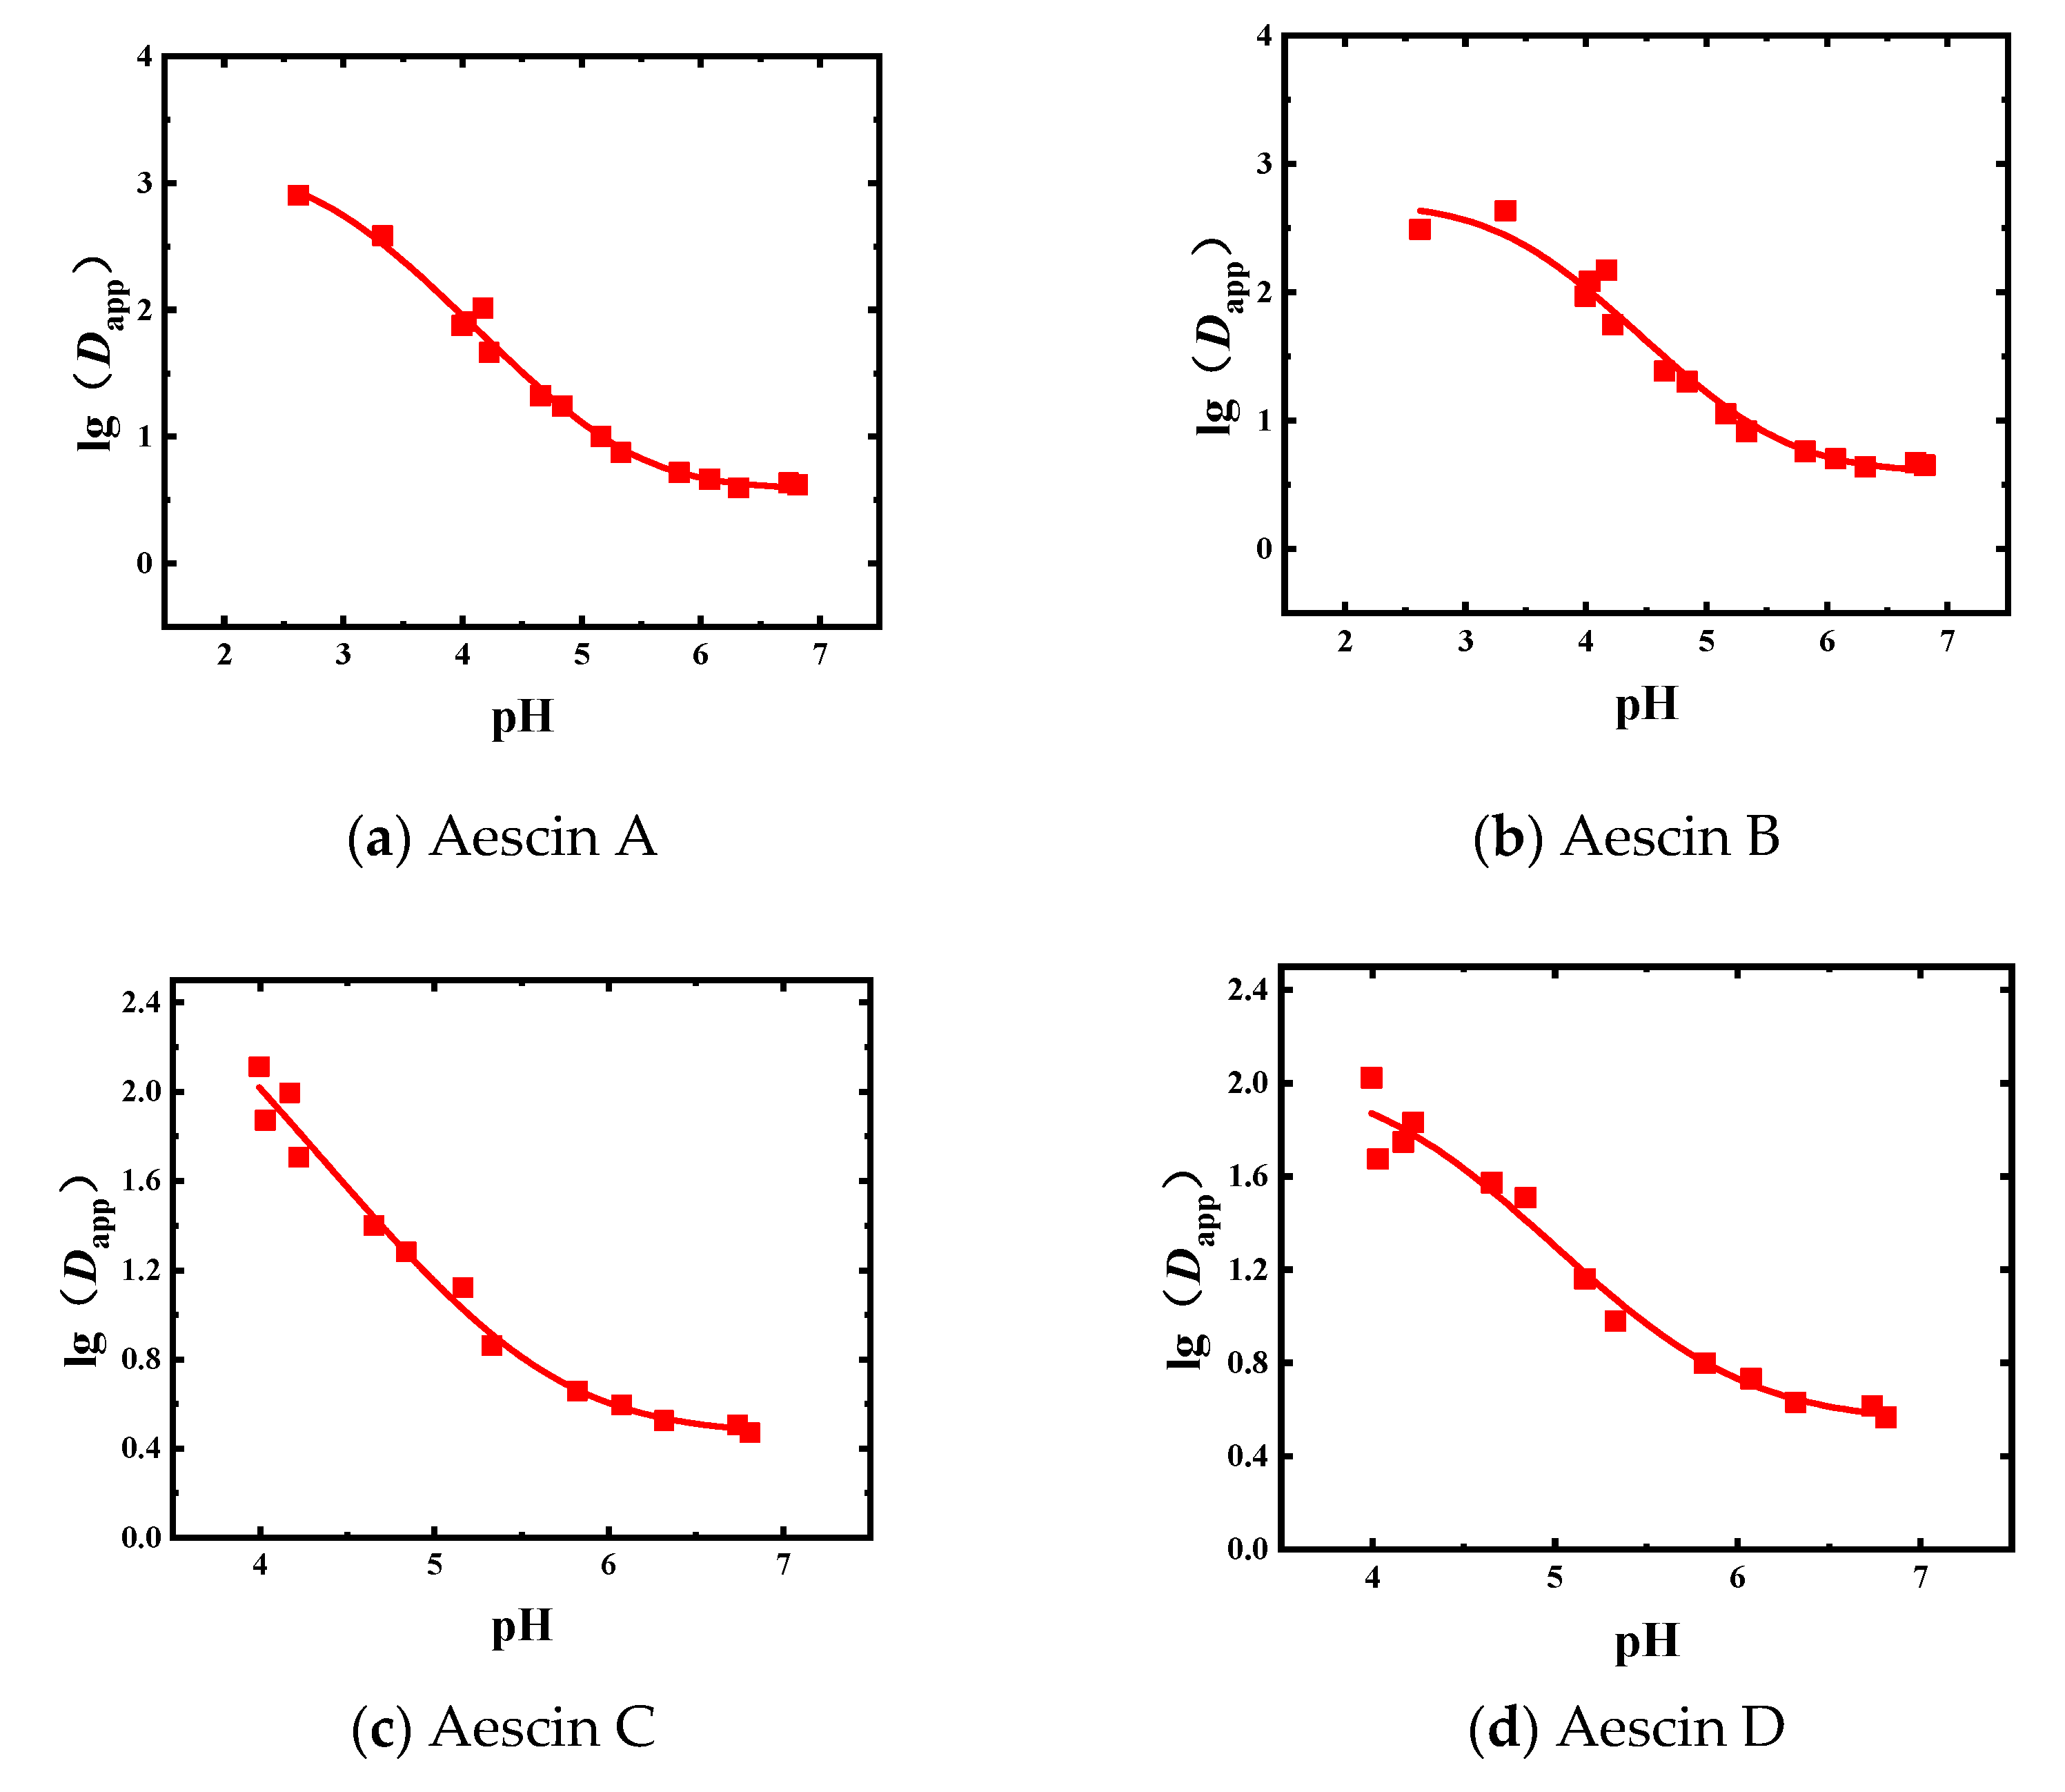
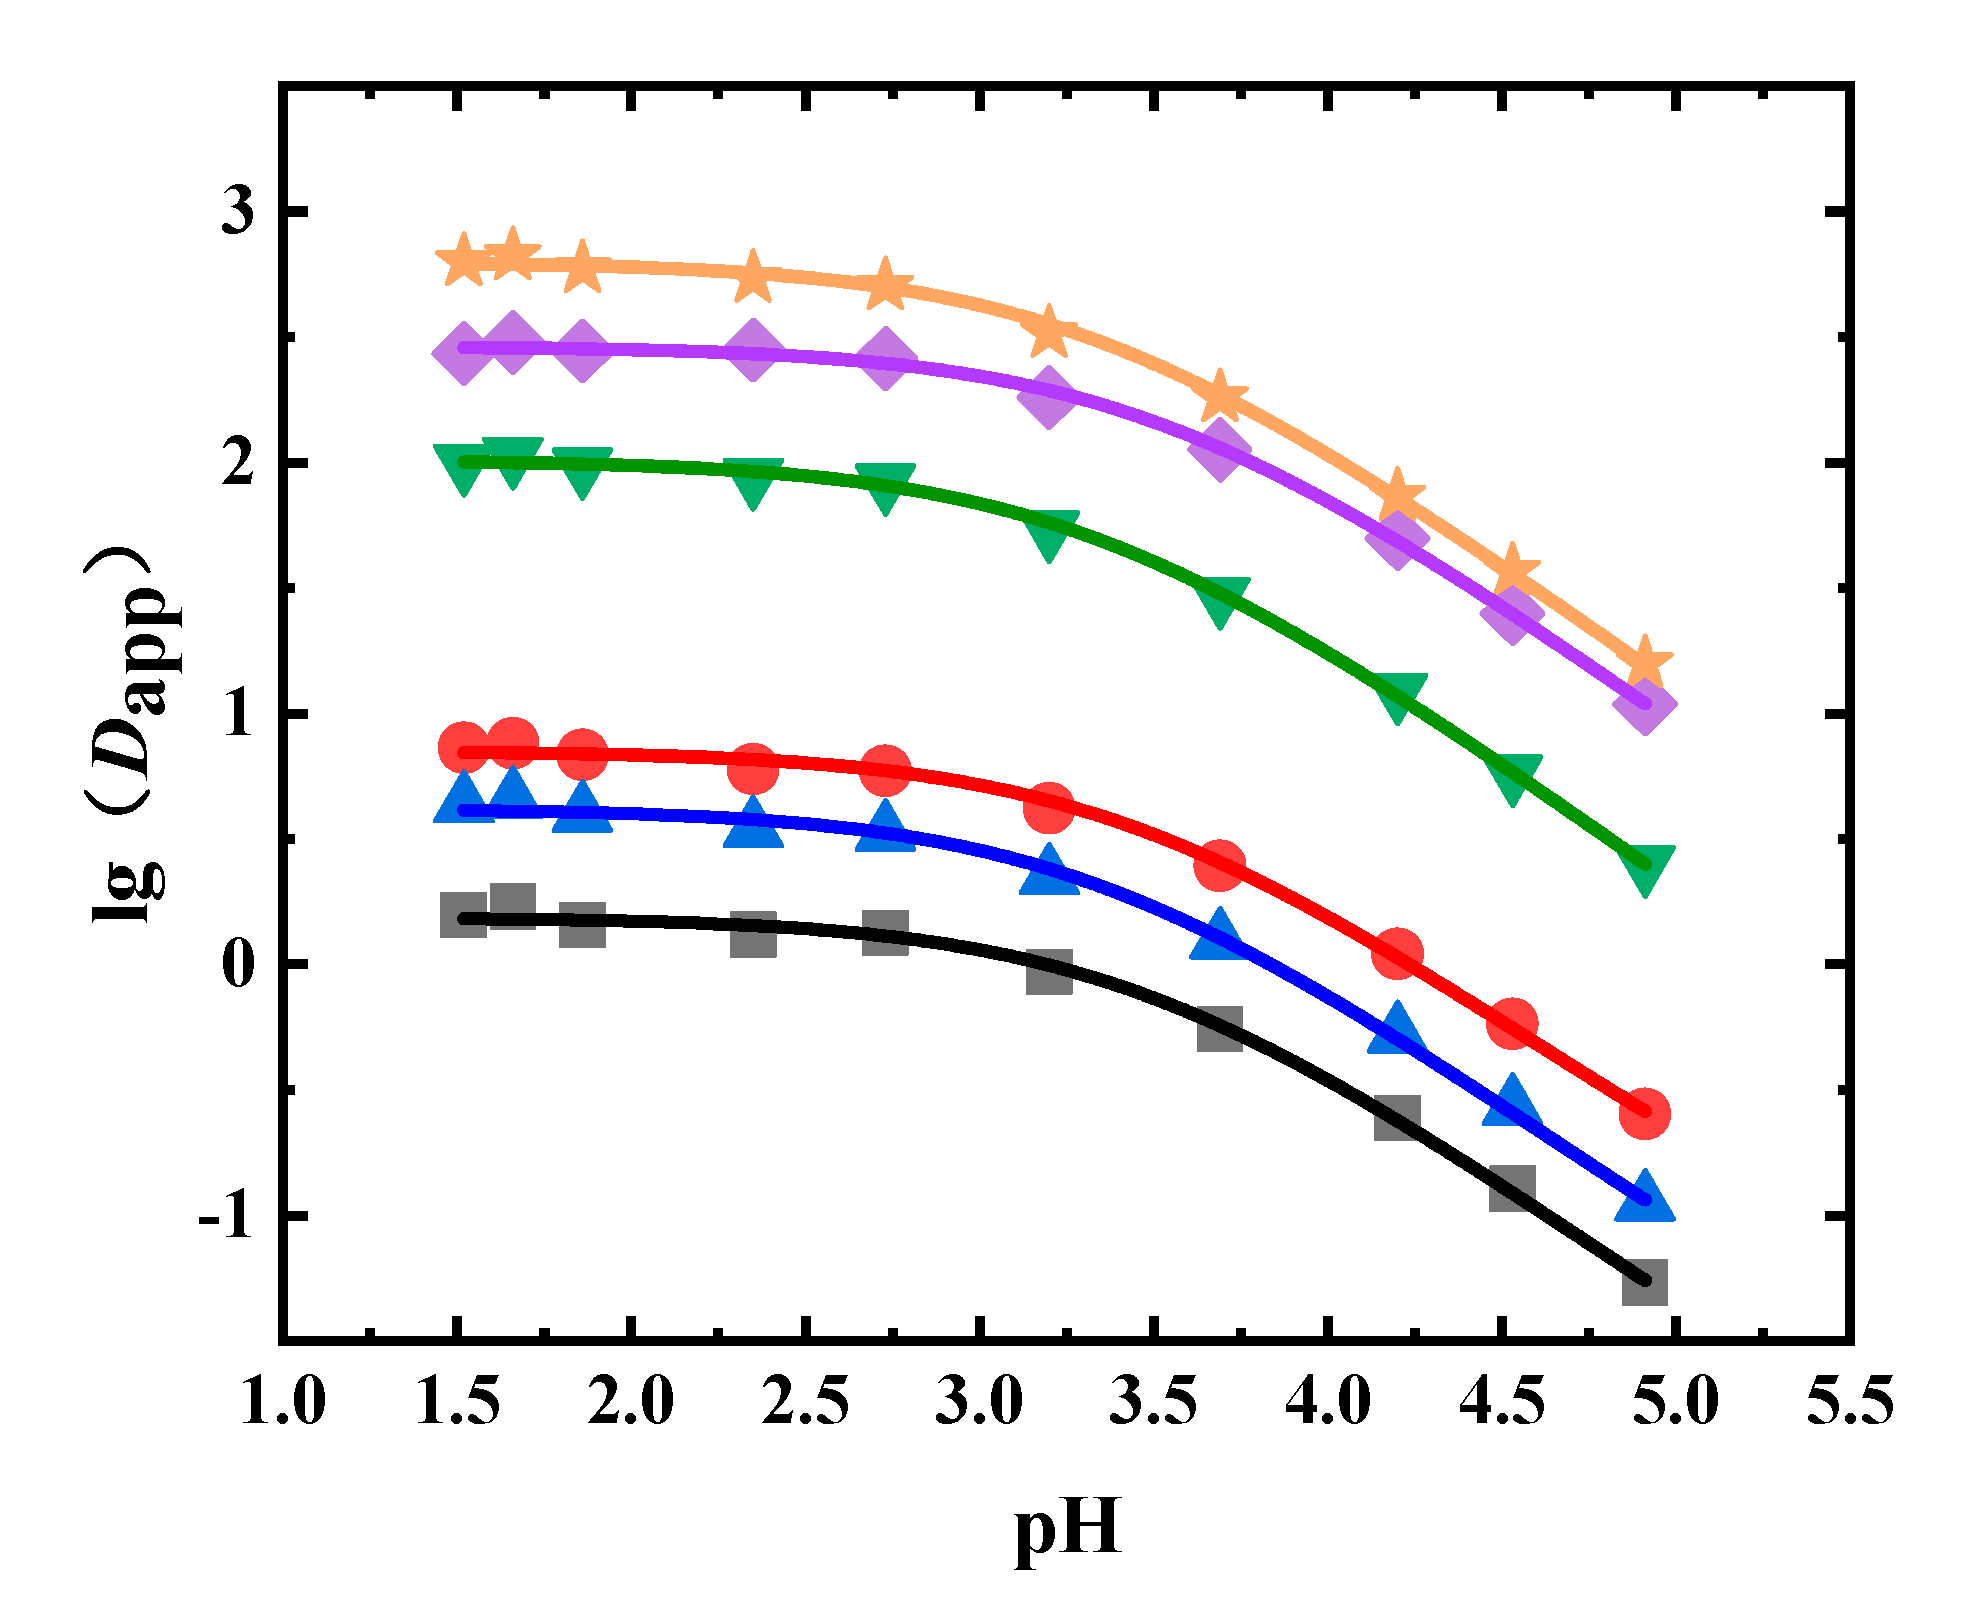
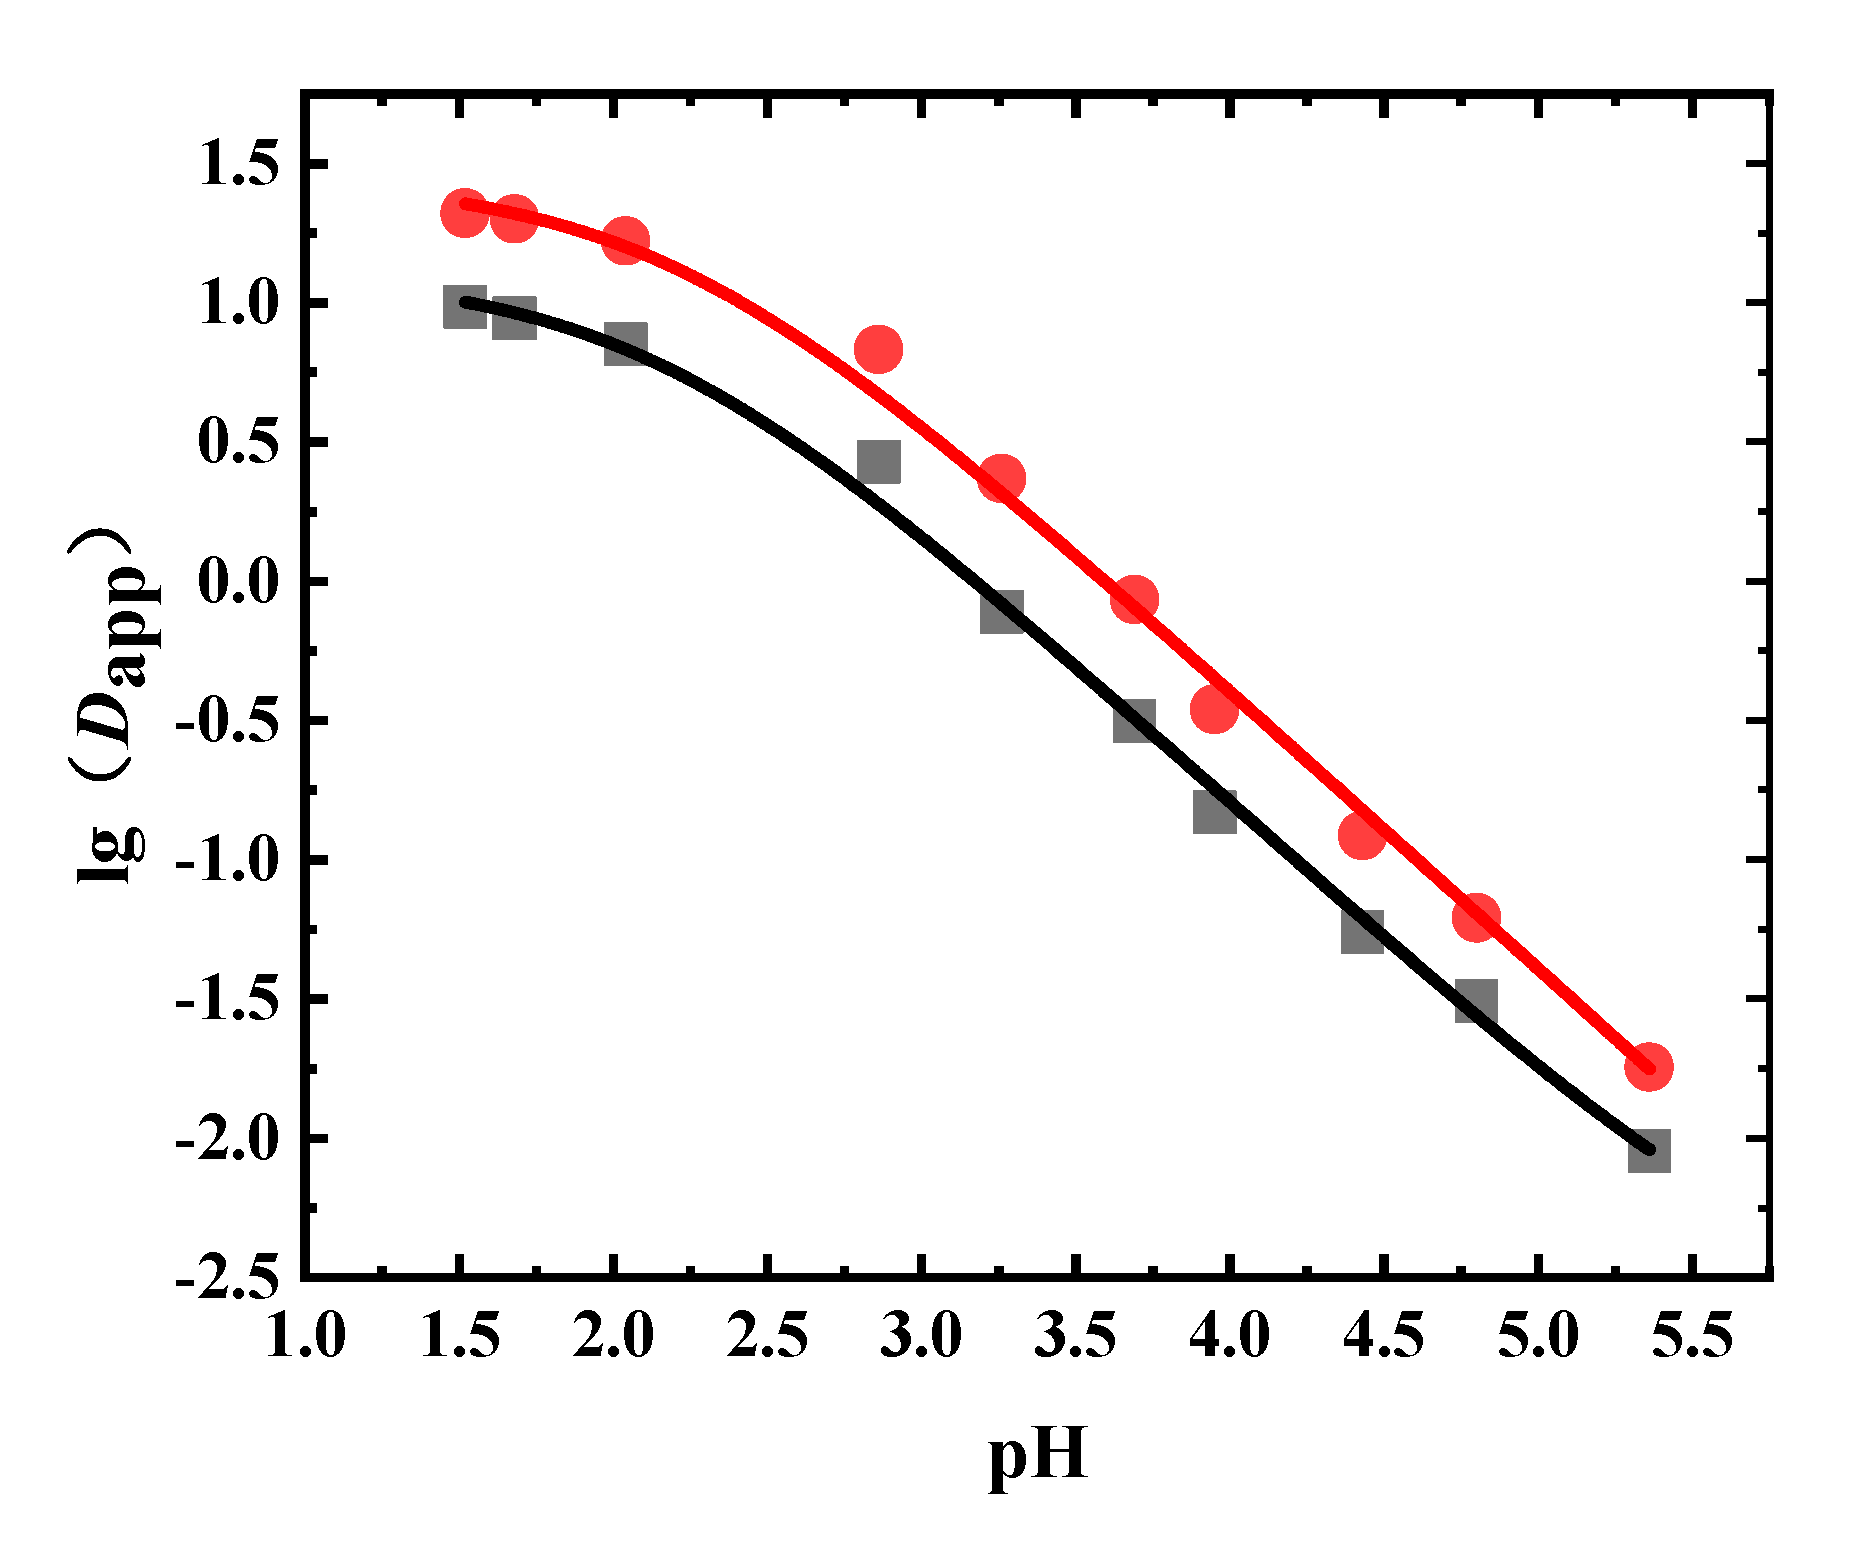
This study mainly determined the Dapp and pKa of 16 active ingredients in medicinal herbs, namely, sinomenine in Caulis Sinomenii, aescins in Semen Aesculi, phenolic acids in Flos Lonicerae, flavonoids in Radix Scutellariae, and glycosides in Radix Astragali. The pKa,1 value of sinomenine was between 8.0 and 8.6, while the pKa,2 value was between 10.8 and 11.6. Trichloromethane had the largest extraction capacity for sinomenine, with a maximum Dapp of more than 500. The pKa values of aescins A, B, C, and D were similar, which were all between 2.8 and 4.3. The pKa values of six phenolic acids in Flos Lonicerae were all in the range of 3.3–3.5. The Dapp values of isochlorogenic acids A, B, and C in 1-octanol could reach more than 100, while the Dapp values of neochlorogenic acid, chlorogenic acid, and cryptochlorogenic acid were below 10. The pKa of baicalin and wogonoside in Radix Scutellariae were both about 2.1. The pKa values obtained by fitting the three ingredients of isomucronulatol 7-O-glucoside, astraisoflavan-7-O-β-D-glucoside, and calycosin-7-glucoside in Radix Astragalus were all between 9.10 and 9.80. The pKa and Dapp values of the 16 active ingredients examined in this work can be used in the development of the extraction process and analytical methods for these ingredients.


