
Detailed Group-Type Characterization of Plastic-Waste Pyrolysis Oils: By Comprehensive Two-Dimensional Gas Chromatography Including Linear, Branched, and Di-Olefins


Abstract
:
1. Introduction
2. Materials and Methods
2.1. Chemicals and Standards
2.2. Sample Preparation
2.3. Elemental Analyzer Setup
2.4. GC × GC-FID/SCD/NCD/MS Setup
2.5. Data Acquisition and Quantification
3. Results and Discussion
3.1. Column Combination Selection and Evaluation
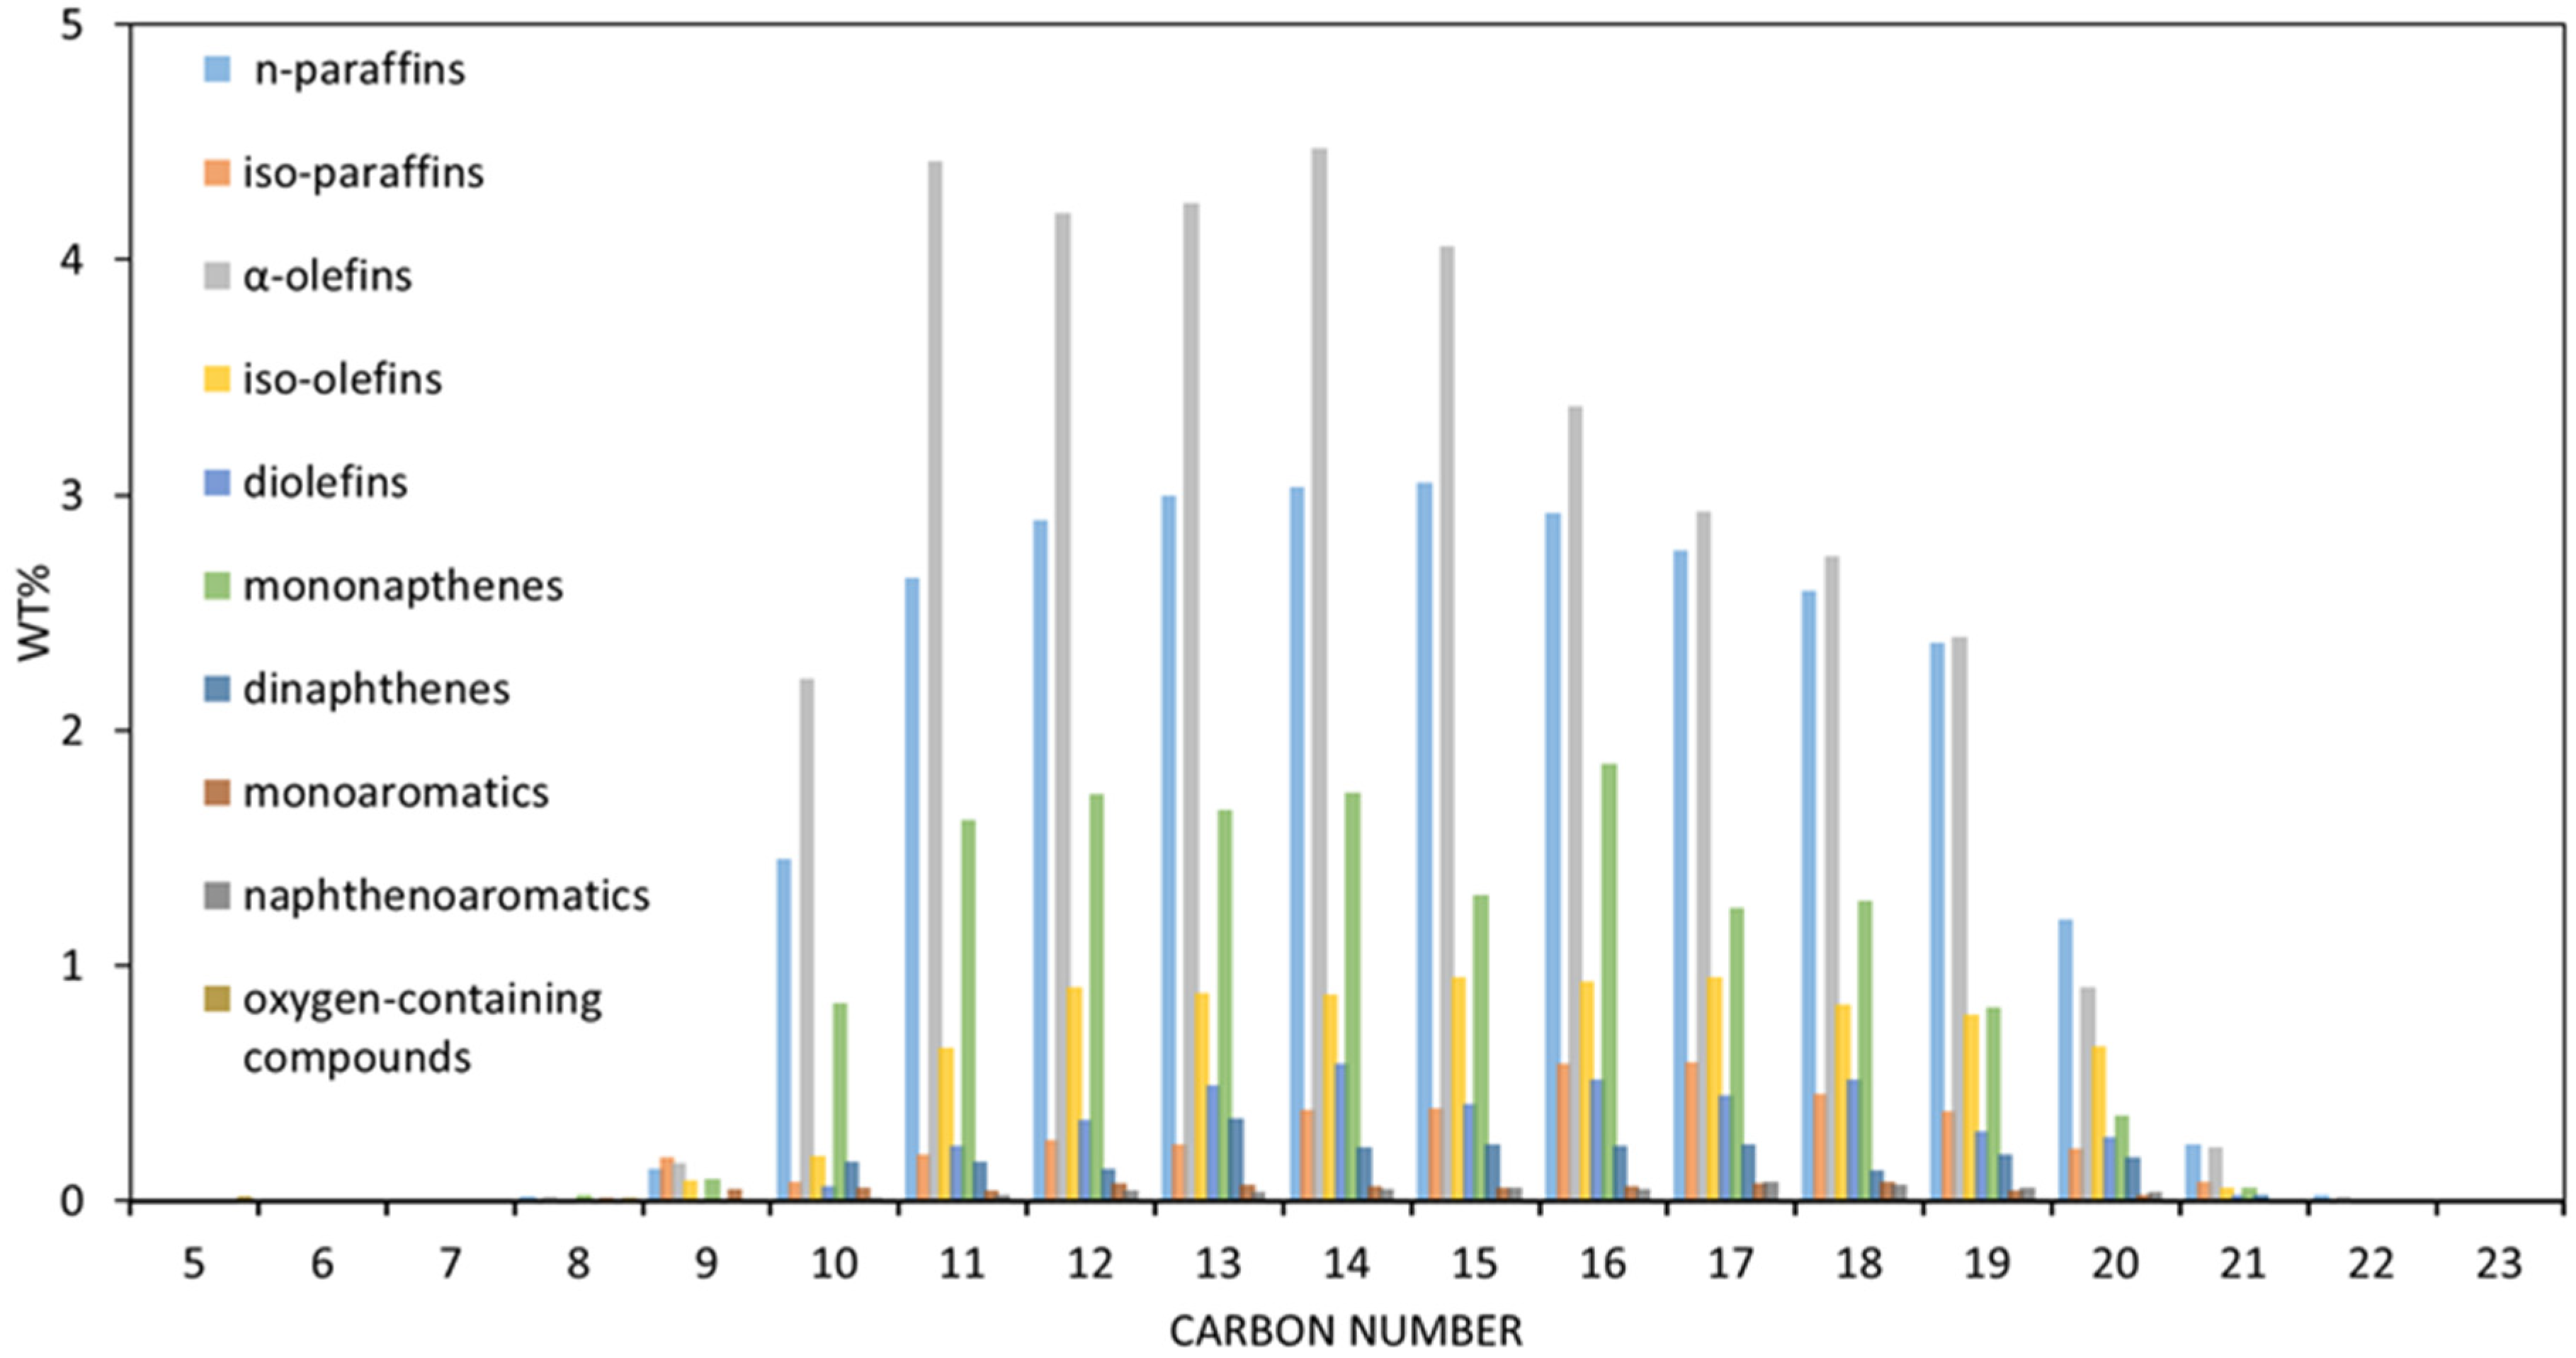
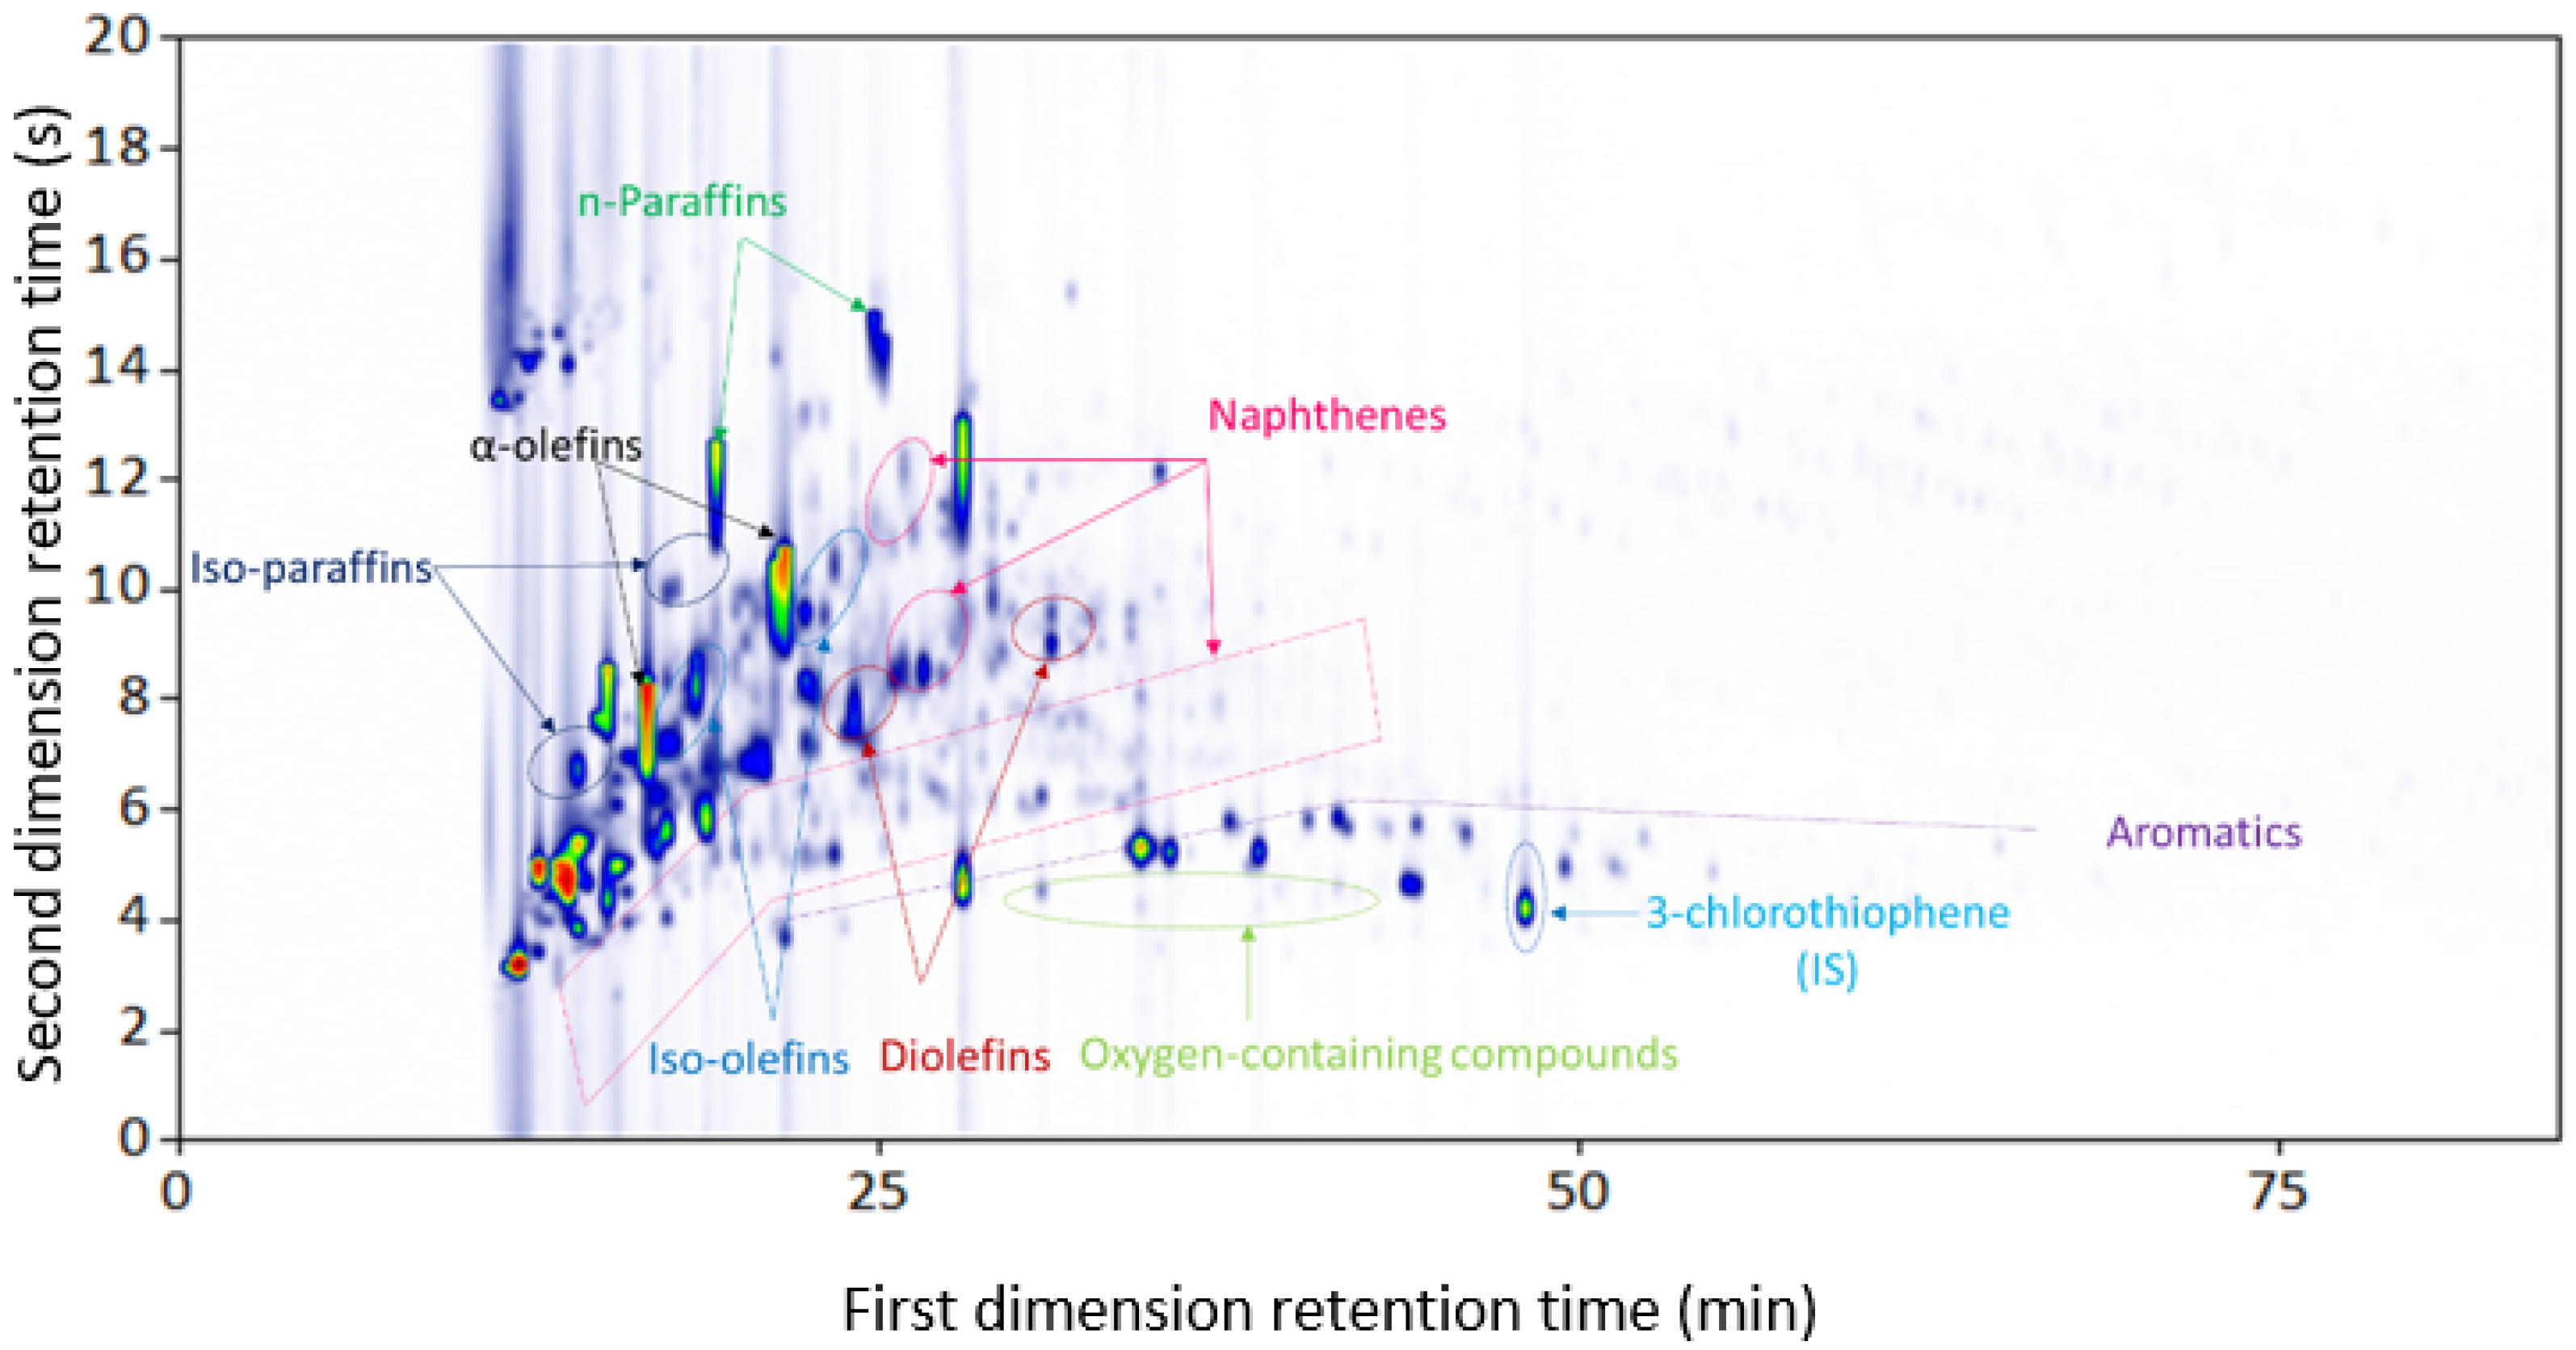
3.1.1. Plastic-Waste Diesel Pyrolysis Oil
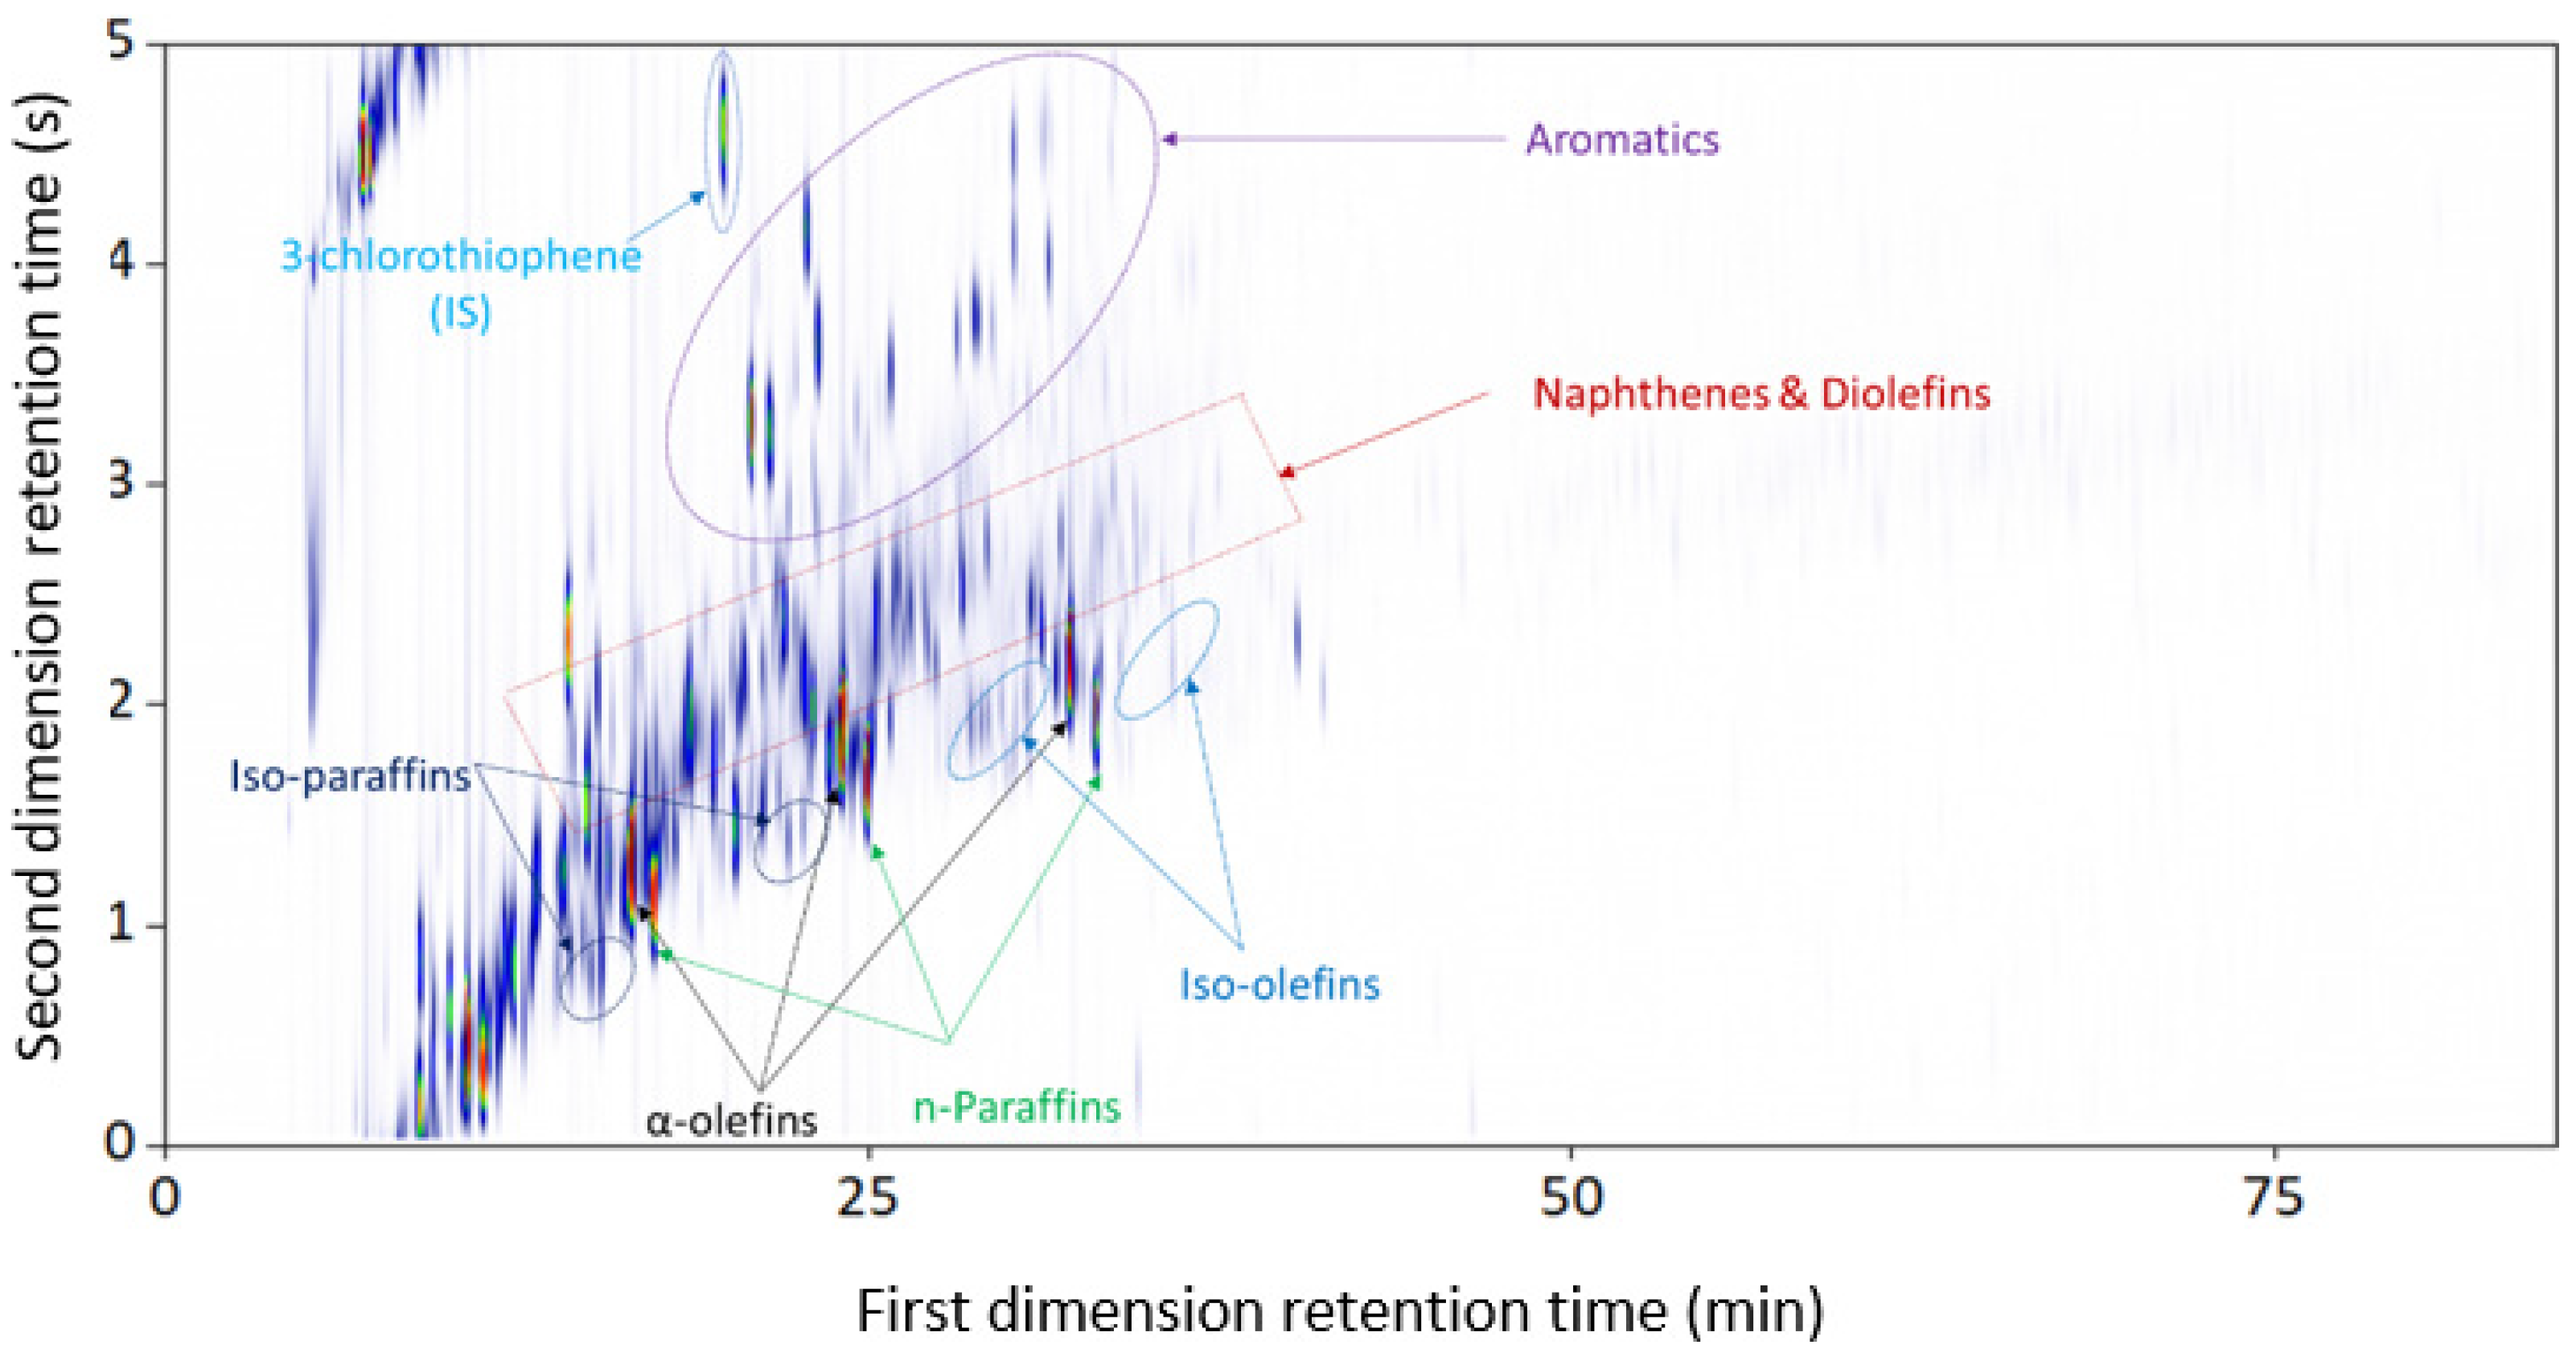
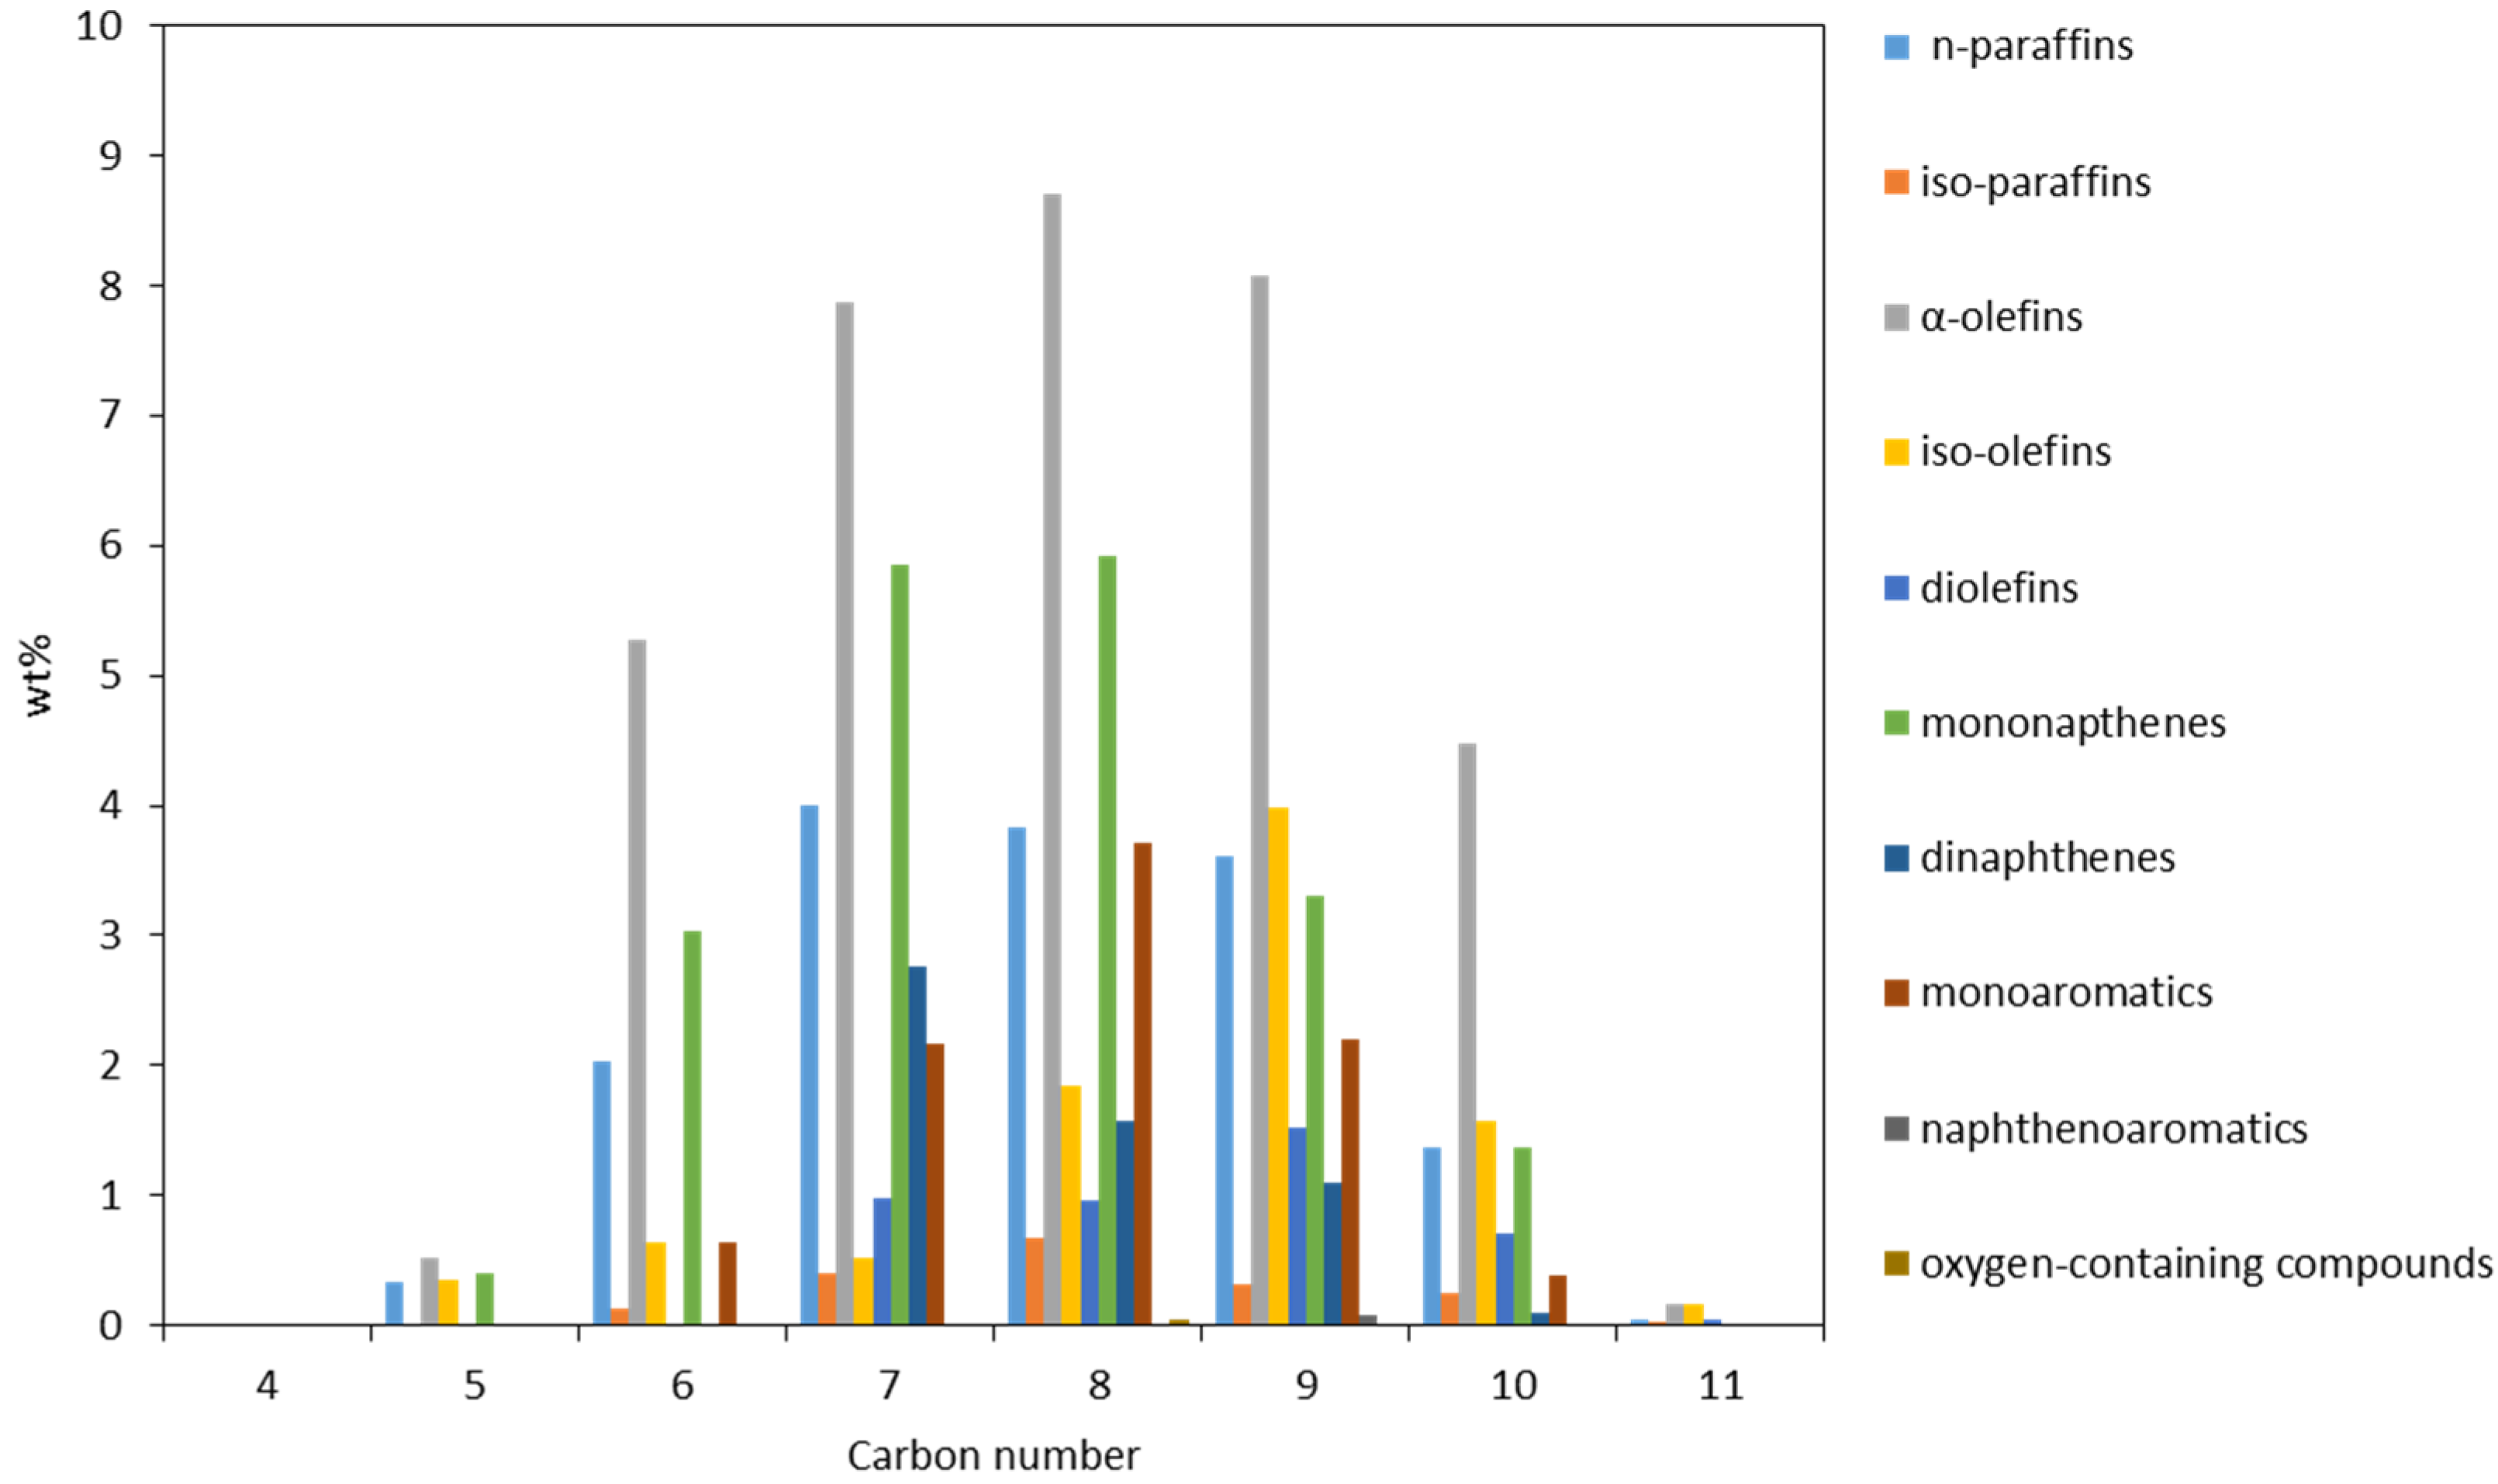
3.1.2. Plastic-Waste Naphtha Pyrolysis Oil
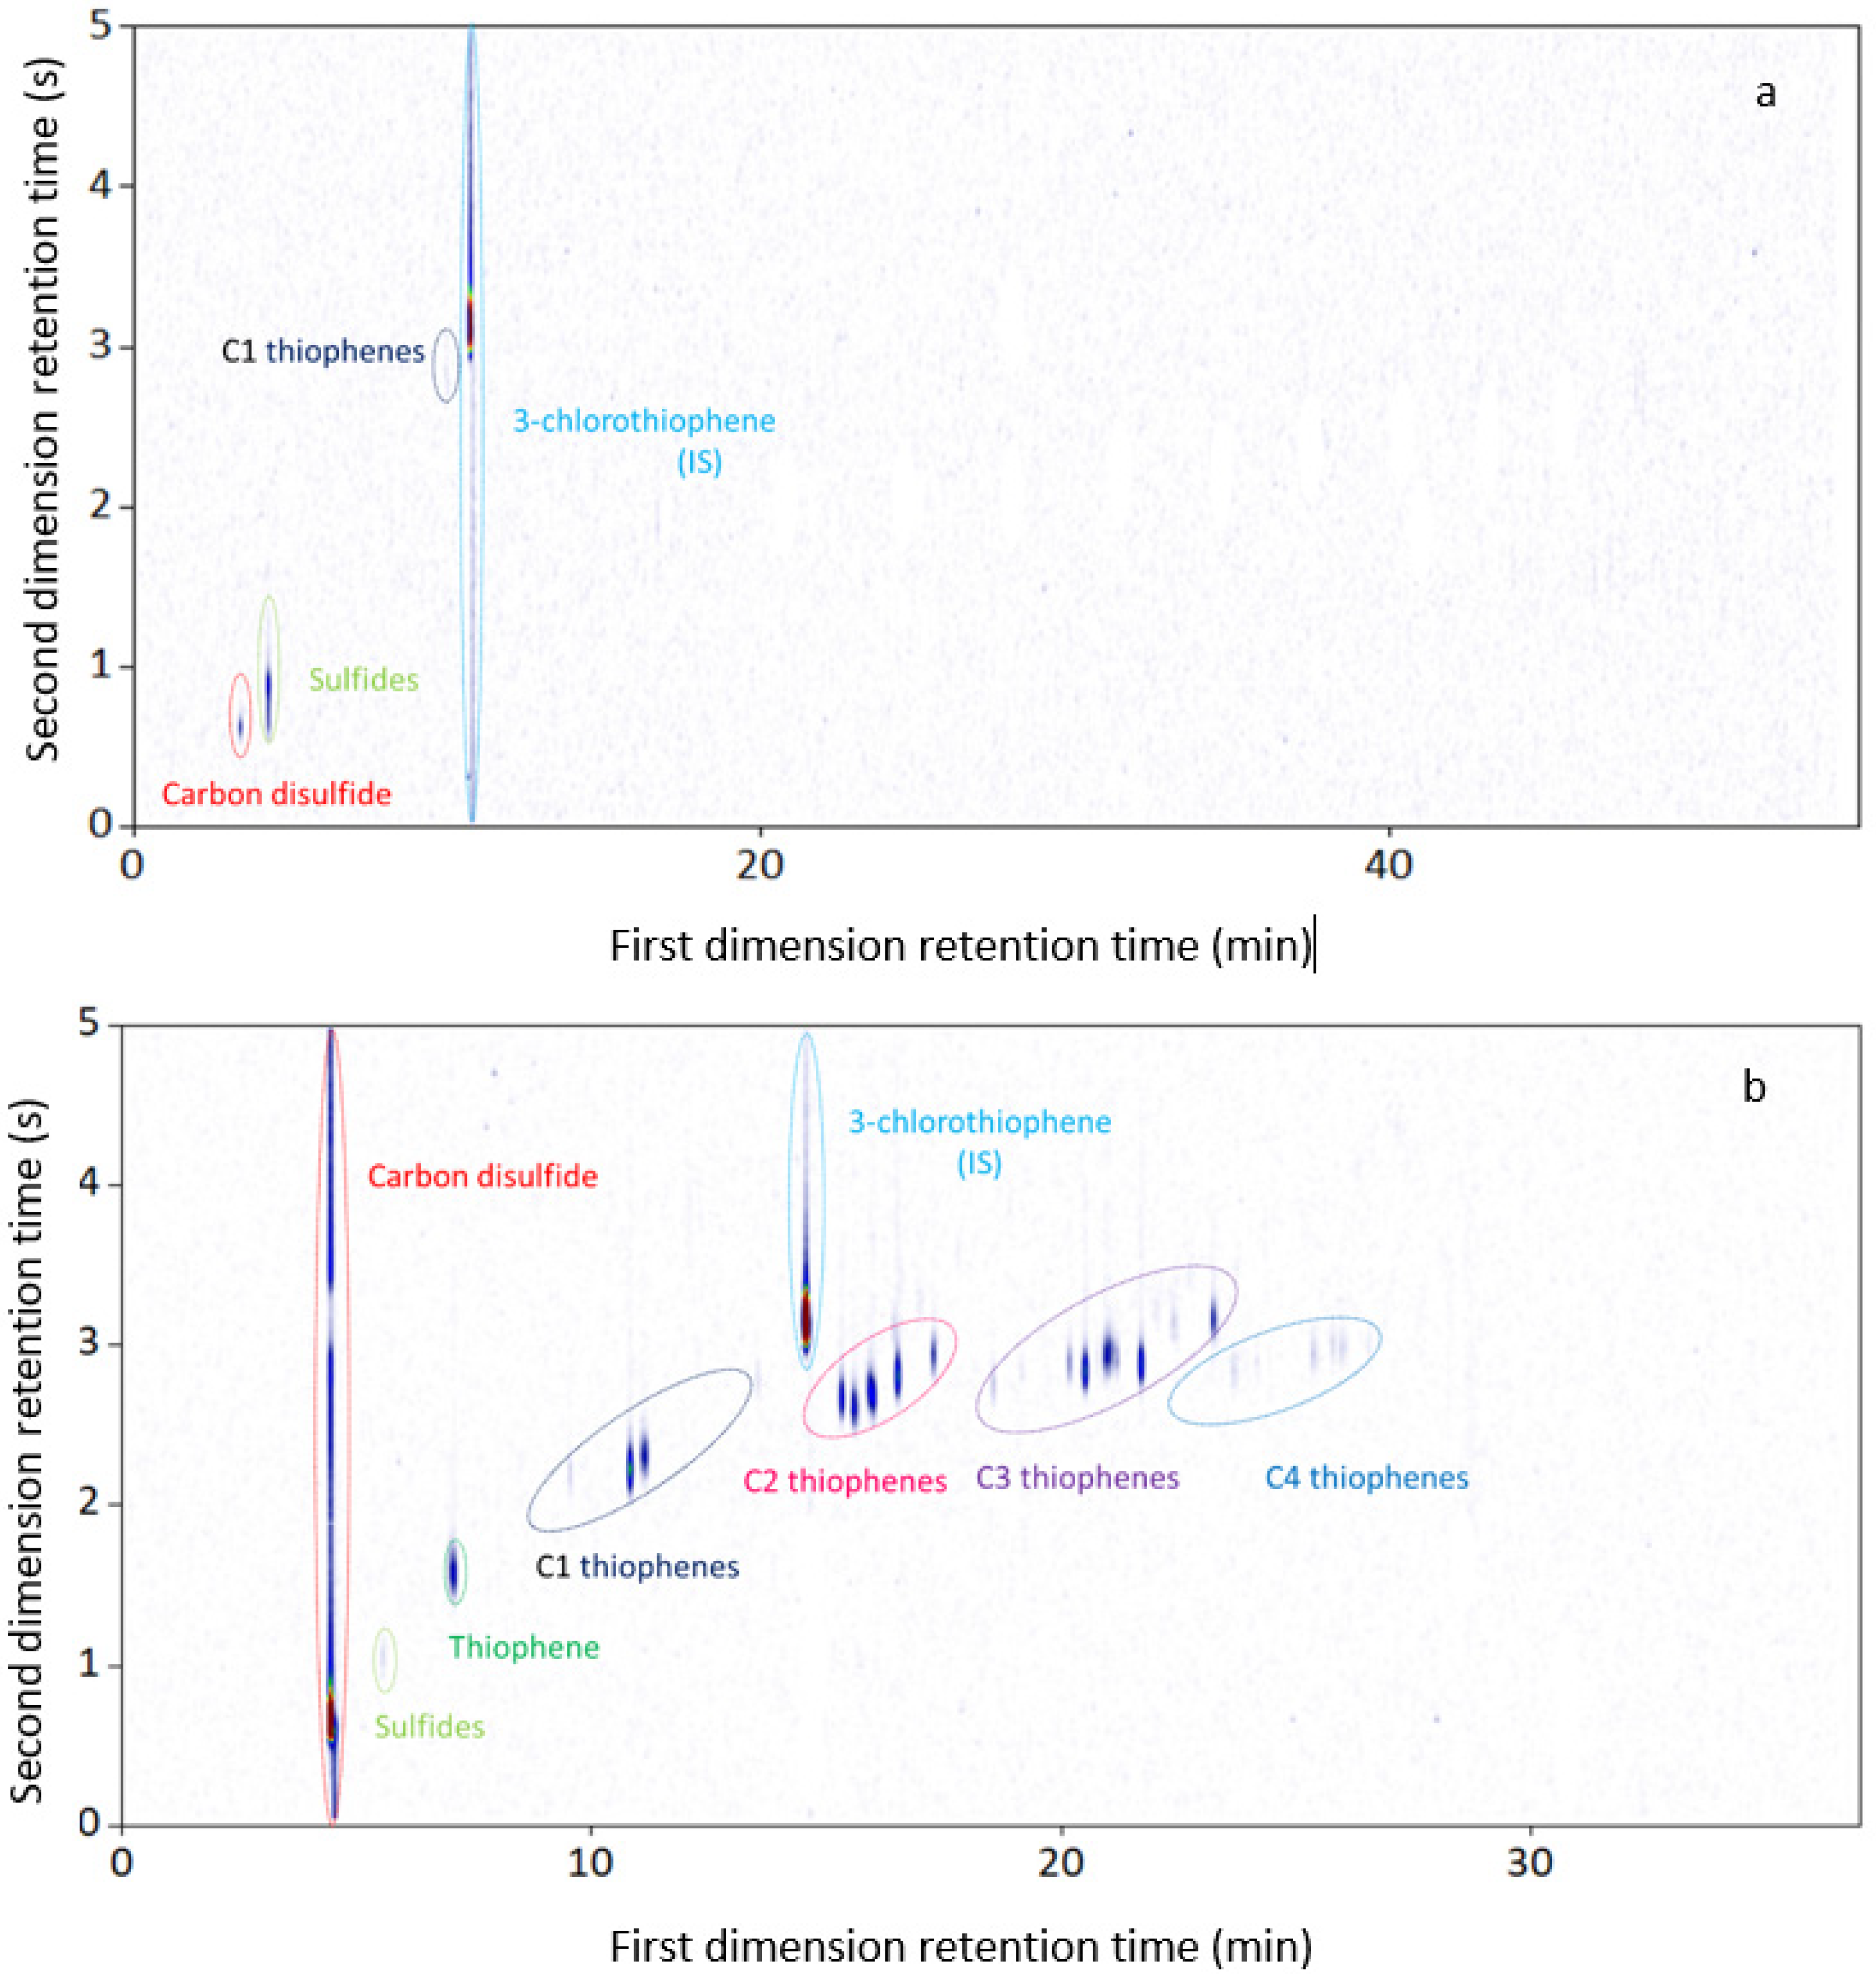
3.2. GC × GC-SCD
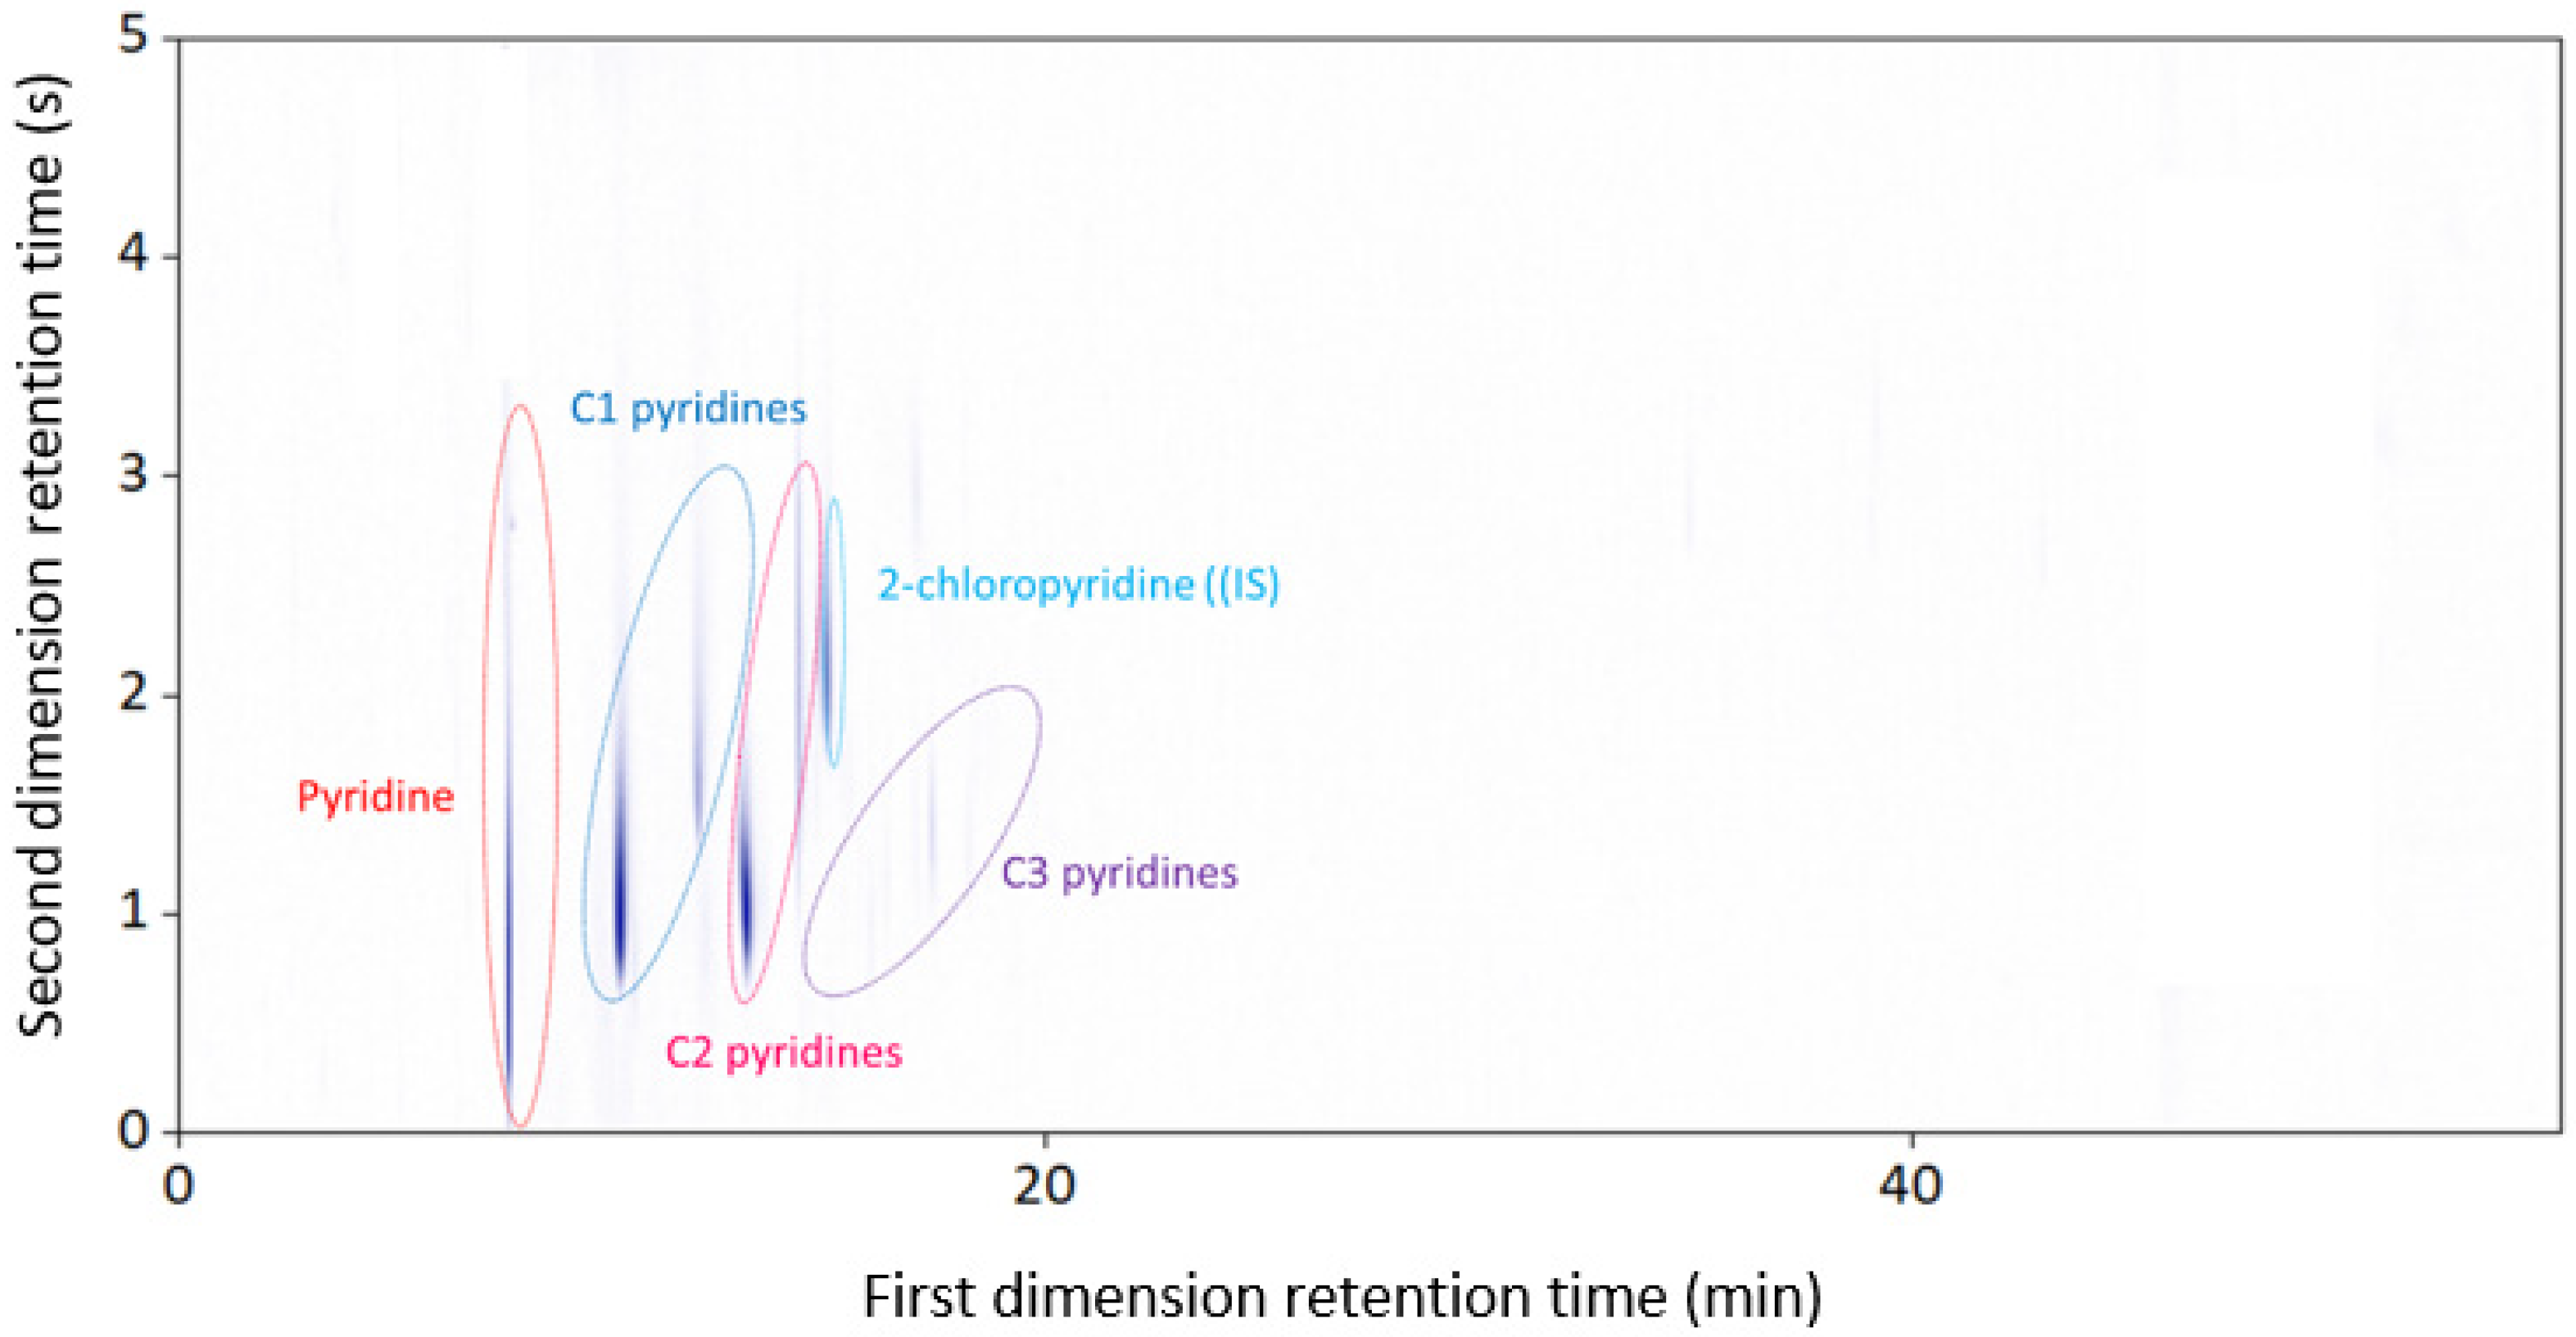
3.3. GC × GC-NCD
3.4. Elemental Analysis
4. Conclusions
Supplementary Materials
Author Contributions
Funding
Acknowledgments
Conflicts of Interest
Nomenclature
| GC × GC: | comprehensive two-Dimensional gas chromatography |
| HPLC: | High-Performance Liquid Chromatography |
| FID: | flame ionization detector |
| MS: | mass spectrometer |
| TCD: | Thermal Conductivity Detector |
| ESI: | electrospray ionization |
| FPD: | flame photometric detection |
| NP: | non-polar × polar column combination |
| PN: | polar × non-polar column combination |
| PM: | polar × mid-polar column combination |
| SCD: | sulfur chemiluminescence detector |
| NCD: | nitrogen chemiluminescence detector |
| EA: | elemental analyzer |
| CHNSO: | carbon, hydrogen, nitrogen, sulfur, and oxygen |
| PTV: | programmable temperature vaporization |
| SSL: | split/splitless |
References
- Ganesh, A.K.; Anjana, K.; Hinduja, M.; Sujitha, K.; Dharani, G. Review on plastic wastes in marine environment—Biodegradation and biotechnological solutions. Mar. Pollut. Bull. 2020, 150, 110733. [Google Scholar]
- Ilyas, M.; Ahmad, W.; Khan, H.; Yousaf, S.; Khan, K.; Nazir, S. Plastic waste as a significant threat to environment—A systematic literature review. Rev. Environ. Health 2018, 33, 383. [Google Scholar] [CrossRef]
- Kalargaris, I.; Tian, G.; Gu, S. Investigation on the long-term effects of plastic pyrolysis oil usage in a diesel engine. Energy Procedia 2017, 142, 49–54. [Google Scholar] [CrossRef]
- Tulashie, S.K.; Boadu, E.K.; Dapaah, S. Plastic waste to fuel via pyrolysis: A key way to solving the severe plastic waste problem in Ghana. Therm. Sci. Eng. Prog. 2019, 11, 417–424. [Google Scholar] [CrossRef]
- Quesada, L.; Calero, M.; Martín-Lara, M.Á.; Pérez, A.; Blázquez, G. Production of an Alternative Fuel by Pyrolysis of Plastic Wastes Mixtures. Energy Fuels 2020, 34, 1781–1790. [Google Scholar] [CrossRef]
- De Smet, M.; Linder, M.; Koopmans, R.; Doorsselaer, K.V.; Velis, C.; De Wilde, B.; Ritschkoff, A.-C.; Crippa, M.; Leyssens, J.; Wagner, M.; et al. A Circular Economy for Plastic—Insights from Research and Innovation to Inform Policy and Funding Decisions; European Commission: Brussels, Belgium, 2019. [Google Scholar]
- Lahtela, V.; Hyvärinen, M.; Kärki, T. Composition of Plastic Fractions in Waste Streams: Toward More Efficient Recycling and Utilization. Polymers 2019, 11, 69. [Google Scholar] [CrossRef] [PubMed] [Green Version]
- Bagheri, M.; Esfilar, R.; Sina Golchi, M.; Kennedy, C.A. Towards a circular economy: A comprehensive study of higher heat values and emission potential of various municipal solid wastes. Waste Manag. 2020, 101, 210–221. [Google Scholar] [CrossRef]
- Miandad, R.; Rehan, M.; Barakat, M.A.; Aburiazaiza, A.S.; Khan, H.; Ismail, I.M.I.; Dhavamani, J.; Gardy, J.; Hassanpour, A.; Nizami, A.-S. Catalytic Pyrolysis of Plastic Waste: Moving Toward Pyrolysis Based Biorefineries. Front. Energy Res. 2019, 7. [Google Scholar] [CrossRef] [Green Version]
- Pradeep, P.A.; Gowthaman, S. Combustion and emission characteristics of diesel engine fuelled with waste plastic oil—A review. Int. J. Ambient. Energy 2019, 1–19. [Google Scholar] [CrossRef]
- Thahir, R.; Altway, A.; Juliastuti, S.R.; Susianto. Production of liquid fuel from plastic waste using integrated pyrolysis method with refinery distillation bubble cap plate column. Energy Rep. 2019, 5, 70–77. [Google Scholar] [CrossRef]
- Gracida-Alvarez, U.R.; Mitchell, M.K.; Sacramento-Rivero, J.C.; Shonnard, D.R. Effect of Temperature and Vapor Residence Time on the Micropyrolysis Products of Waste High Density Polyethylene. Ind. Eng. Chem. Res. 2018, 57, 1912–1923. [Google Scholar] [CrossRef]
- Sharma, B.K.; Moser, B.R.; Vermillion, K.E.; Doll, K.M.; Rajagopalan, N. Production, characterization and fuel properties of alternative diesel fuel from pyrolysis of waste plastic grocery bags. Fuel Process. Technol. 2014, 122, 79–90. [Google Scholar] [CrossRef]
- Singh, M.V.; Kumar, S.; Sarker, M. Waste HD-PE plastic, deformation into liquid hydrocarbon fuel using pyrolysis-catalytic cracking with a CuCO3 catalyst. Sustain. Energy Fuels 2018, 2, 1057–1068. [Google Scholar] [CrossRef]
- Mangesh, V.L.; Padmanabhan, S.; Ganesan, S.; PrabhudevRahul, D.; Kumar Reddy, T.D. Prospects of pyrolysis oil from plastic waste as fuel for diesel engines: A review. IOP Conf. Ser. Mater. Sci. Eng. 2017, 197, 012027. [Google Scholar] [CrossRef] [Green Version]
- Toraman, H.E.; Dijkmans, T.; Djokic, M.R.; Van Geem, K.M.; Marin, G.B. Detailed compositional characterization of plastic waste pyrolysis oil by comprehensive two-dimensional gas-chromatography coupled to multiple detectors. J. Chromatogr. A 2014, 1359, 237–246. [Google Scholar] [CrossRef] [PubMed]
- Mastral, J.F.; Berrueco, C.; Ceamanos, J. Theoretical prediction of product distribution of the pyrolysis of high density polyethylene. J. Anal. Appl. Pyrolysis 2007, 80, 427–438. [Google Scholar] [CrossRef]
- Kusch, P. Application of Pyrolysis-Gas Chromatography/Mass Spectrometry (Py-GC/MS). In Comprehensive Analytical Chemistry; Rocha-Santos, T.A.P., Duarte, A.C., Eds.; Elsevier: Amsterdam, The Netherlands, 2017; Chapter 7; pp. 169–207. [Google Scholar]
- Punkkinen, H.; Oasmaa, A.; Luntama, J.L.; Nieminen, M.; Laine-Ylijoki, J. Thermal conversion of plasticcontaining waste: A review. Res. Rep. 2017, D4, 1–22. [Google Scholar]
- Damodharan, D.; Kumar, B.R.; Gopal, K.; De Poures, M.V.; Sethuramasamyraja, B. Utilization of waste plastic oil in diesel engines: A review. Rev. Environ. Sci. Bio Technol. 2019, 18, 681–697. [Google Scholar] [CrossRef]
- Singh, R.K.; Ruj, B.; Sadhukhan, A.K.; Gupta, P. Impact of fast and slow pyrolysis on the degradation of mixed plastic waste: Product yield analysis and their characterization. J. Energy Inst. 2019, 92, 1647–1657. [Google Scholar] [CrossRef]
- Baumgartner, A.J.; Blaschke, M.W.; Coleman, S.T.; Kohler, R.; Paxson, T.E. Feedstock Contaminants in Ethylene Plants—An Update. In Proceedings of the 2004 Spring AIChE National Meeting, New Orleans, LA, USA, 25–29 April 2004. [Google Scholar]
- Dijkmans, T.; Djokic, M.R.; Van Geem, K.M.; Marin, G.B. Comprehensive compositional analysis of sulfur and nitrogen containing compounds in shale oil using GC × GC-FID/SCD/NCD/TOF-MS. Fuel 2015, 140, 398–406. [Google Scholar] [CrossRef]
- Al-Hajji, A.A.; Muller, H.; Koseoglu, O.R. Characterization of Nitrogen and Sulfur Compounds in Hydrocracking Feedstocks by Fourier Transform Ion Cyclotron Mass Spectrometry. Oil Gas Sci. Technol. 2008, 63, 115–128. [Google Scholar] [CrossRef]
- Cullis, C.F.; Hirschler, M.M.; Wall, S.W. The combined effect of sulphur and nitrogen compounds on alkane combustion. Symp. Combust. Proc. 1988, 21, 1223–1230. [Google Scholar] [CrossRef]
- Lebedeva, O.; Root, N.; Kultin, D.; Moiseeva, A.; Kustov, L. Focus on Fuel Quality: Removal of Sulfur-, Nitrogen-, and Oxygen-Containing Aromatic Compounds by Extraction from Hydrocarbons into the Regenerable Ionic Liquid. Energy Fuels 2015, 29, 5253–5258. [Google Scholar] [CrossRef]
- Ristic, N.D.; Djokic, M.R.; Konist, A.; Van Geem, K.M.; Marin, G.B. Quantitative compositional analysis of Estonian shale oil using comprehensive two dimensional gas chromatography. Fuel Process. Technol. 2017, 167, 241–249. [Google Scholar] [CrossRef]
- Song, H.; Quinton, K.S.; Peng, Z.; Zhao, H.; Ladommatos, N. Effects of Oxygen Content of Fuels on Combustion and Emissions of Diesel Engines. Energies 2016, 9, 28. [Google Scholar] [CrossRef] [Green Version]
- Bezergianni, S.; Dimitriadis, A.; Faussone, G.-C.; Karonis, D. Alternative Diesel from Waste Plastics. Energies 2017, 10, 1750. [Google Scholar] [CrossRef] [Green Version]
- Käfer, U.; Gröger, T.; Rohbogner, C.J.; Struckmeier, D.; Saraji-Bozorgzad, M.R.; Wilharm, T.; Zimmermann, R. Detailed Chemical Characterization of Bunker Fuels by High-Resolution Time-of-Flight Mass Spectrometry Hyphenated to GC × GC and Thermal Analysis. Energy Fuels 2019, 33, 10745–10755. [Google Scholar] [CrossRef]
- Van der Westhuizen, R.; Crouch, A.; Sandra, P. The use of GC × GC with time-of-flight mass spectrometry to investigate dienes and Diels–Alder polymerisation products in high-temperature Fischer-Tropsch-based fuels. J. Sep. Sci. 2008, 31, 3423–3428. [Google Scholar] [CrossRef]
- Heshka, N.E.; Baltazar, M.; Chen, J. Separation and quantification of olefins and diolefins in cracked petroleum fractions using silver-ion high performance liquid chromatography. Pet. Sci. Technol. 2019, 37, 1808–1816. [Google Scholar] [CrossRef]
- Pereira, R.C.C.; Pasa, V.M.D. Effect of mono-olefins and diolefins on the stability of automotive gasoline. Fuel 2006, 85, 1860–1865. [Google Scholar] [CrossRef]
- Asomaning, S. The Role of Olefins in Fouling of Heat Exchangers. Master’s Thesis, The University of British Columbia, Vancouver, BC, Canada, May 1990. [Google Scholar]
- Kulkarni, S.R.; Verhees, P.; Akhras, A.R.; Van Geem, K.M.; Heynderickx, G.J. Fouling in a Steam Cracker Convection Section Part 2: Coupled Tube Bank Simulation using an Improved Hybrid CFD-1D Model. Heat Transf. Eng. 2019, 41, 1–21. [Google Scholar] [CrossRef]
- Sharuddin, S.D.A.; Abnisa, F.; Wan Daud, W.M.A.; Aroua, M.K. Energy recovery from pyrolysis of plastic waste: Study on non-recycled plastics (NRP) data as the real measure of plastic waste. Energy Convers. Manag. 2017, 148, 925–934. [Google Scholar] [CrossRef]
- Lee, K.-H. Pyrolysis of municipal plastic wastes separated by difference of specific gravity. J. Anal. Appl. Pyrolysis 2007, 79, 362–367. [Google Scholar] [CrossRef]
- Seo, Y.-H.; Lee, K.-H.; Shin, D.-H. Investigation of catalytic degradation of high-density polyethylene by hydrocarbon group type analysis. J. Anal. Appl. Pyrolysis 2003, 70, 383–398. [Google Scholar] [CrossRef]
- Lee, K.-H.; Jeon, S.-G.; Kim, K.-H.; Noh, N.-S.; Shin, D.-H.; Park, J.; Seo, Y.; Yee, J.-J.; Kim, G.-T. Thermal and catalytic degradation of waste high-density polyethylene (HDPE) using spent FCC catalyst. Korean J. Chem. Eng. 2003, 20, 693–697. [Google Scholar] [CrossRef]
- Miranda, R.; Pakdel, H.; Roy, C.; Vasile, C. Vacuum pyrolysis of commingled plastics containing PVC II. Product analysis. Polym. Degrad. Stab. 2001, 73, 47–67. [Google Scholar] [CrossRef]
- Miskolczi, N.; Ateş, F. Thermo-catalytic co-pyrolysis of recovered heavy oil and municipal plastic wastes. J. Anal. Appl. Pyrolysis 2016, 117, 273–281. [Google Scholar] [CrossRef]
- Park, J.J.; Park, K.; Kim, J.-S.; Maken, S.; Song, H.; Shin, H.; Park, J.-W.; Choi, M.-J. Characterization of Styrene Recovery from the Pyrolysis of Waste Expandable Polystyrene. Energy Fuels 2003, 17, 1576–1582. [Google Scholar] [CrossRef]
- Kim, Y.S.; Hwang, G.C.; Bae, S.Y.; Yi, S.C.; Moon, S.K.; Kumazawa, H. Pyrolysis of polystyrene in a batch-type stirred vessel. Korean J. Chem. Eng. 1999, 16, 161–165. [Google Scholar] [CrossRef]
- Williams, P.T.; Williams, E.A. Product Composition from the Fast Pyrolysis of Polystyrene. Environ. Technol. 1999, 20, 1109–1118. [Google Scholar] [CrossRef]
- Ogino, H.; Nagy, B. Pyrolysis of Transvaal kerogens. II. An evaluation of vacuum pyrolysis with polyethylene, polystyrene and their mixtures with minerals. Precambrian Res. 1981, 15, 113–130. [Google Scholar] [CrossRef]
- Park, K.-B.; Jeong, Y.-S.; Guzelciftci, B.; Kim, J.-S. Two-stage pyrolysis of polystyrene: Pyrolysis oil as a source of fuels or benzene, toluene, ethylbenzene, and xylenes. Appl. Energy 2020, 259, 114240. [Google Scholar] [CrossRef]
- Kaminsky, W.; Franck, J. Monomer recovery by pyrolysis of poly(methyl methacrylate) (PMMA). J. Anal. Appl. Pyrolysis 1991, 19, 311–318. [Google Scholar] [CrossRef]
- Shin, T.; Hajime, O.; Chuichi, W. Pyrolysis-Gc/Ms Data Book of Synthetic Polymers Pyrograms, Thermograms and Ms of Pyrolyzates; Elsevier: Amsterdam, The Netherlands, 2011. [Google Scholar]
- Uzumkesici, E.S.; Casal-Banciella, M.D.; McRae, C.; Snape, C.E.; Taylor, D. Co-processing of single plastic waste streams in low temperature carbonisation. Fuel 1999, 78, 1697–1702. [Google Scholar] [CrossRef]
- Ladislav, S.; Kubinec, R.; Jurdáková, H.; Hájeková, E.; Martin, B. GC-MS of polyethylene and polypropylene thermal cracking products. Pet. Coal 2006, 48, 1–14. [Google Scholar]
- Kiran, N.; Ekinci, E.; Snape, C.E. Recyling of plastic wastes via pyrolysis. Resour. Conserv. Recycl. 2000, 29, 273–283. [Google Scholar] [CrossRef]
- Demirbas, A. Pyrolysis of municipal plastic wastes for recovery of gasoline-range hydrocarbons. J. Anal. Appl. Pyrolysis 2004, 72, 97–102. [Google Scholar] [CrossRef]
- Almeida, D.; Marques, M.D.F. Thermal and catalytic pyrolysis of plastic waste. Polímeros 2016, 26, 44–51. [Google Scholar] [CrossRef]
- Toraman, H.E.; Franz, K.; Ronsse, F.; Van Geem, K.M.; Marin, G.B. Quantitative analysis of nitrogen containing compounds in microalgae based bio-oils using comprehensive two-dimensional gas-chromatography coupled to nitrogen chemiluminescence detector and time of flight mass spectrometer. J. Chromatogr. A 2016, 1460, 135–146. [Google Scholar] [CrossRef] [PubMed]
- Luong, J.; Hua, Y.; Gras, R.; Shellie, R.A. Uniformity and Sensitivity Improvements in Comprehensive Two-Dimensional Gas Chromatography Using Flame Ionization Detection with Post-Column Reaction. Anal. Chem. 2019, 91, 11223–11230. [Google Scholar] [CrossRef]
- Djokic, M.R.; Dijkmans, T.; Yildiz, G.; Prins, W.; Van Geem, K.M. Quantitative analysis of crude and stabilized bio-oils by comprehensive two-dimensional gas-chromatography. J. Chromatogr. A 2012, 1257, 131–140. [Google Scholar] [CrossRef]
- Dijkmans, T.; Van Geem, K.M.; Djokic, M.R.; Marin, G.B. Combined Comprehensive Two-Dimensional Gas Chromatography Analysis of Polyaromatic Hydrocarbons/Polyaromatic Sulfur-Containing Hydrocarbons (PAH/PASH) in Complex Matrices. Ind. Eng. Chem. Res. 2014, 53, 15436–15446. [Google Scholar] [CrossRef]
- Schofield, K. The enigmatic mechanism of the flame ionization detector: Its overlooked implications for fossil fuel combustion modeling. Prog. Energy Combust. Sci. 2008, 34, 330–350. [Google Scholar] [CrossRef]
- Giddings, J.C. Concepts and comparisons in multidimensional separation. J. High Resolut. Chromatogr. 1987, 10, 319–323. [Google Scholar] [CrossRef]
- Dutriez, T.; Borras, J.; Courtiade, M.; Thiébaut, D.; Dulot, H.; Bertoncini, F.; Hennion, M.-C. Challenge in the speciation of nitrogen-containing compounds in heavy petroleum fractions by high temperature comprehensive two-dimensional gas chromatography. J. Chromatogr. A 2011, 1218, 3190–3199. [Google Scholar] [CrossRef] [PubMed]
- Van Geem, K.M.; Pyl, S.P.; Reyniers, M.-F.; Vercammen, J.; Beens, J.; Marin, G.B. On-line analysis of complex hydrocarbon mixtures using comprehensive two-dimensional gas chromatography. J. Chromatogr. A 2010, 1217, 6623–6633. [Google Scholar] [CrossRef] [PubMed]
- Beens, J.; Janssen, H.-G.; Adahchour, M.; Brinkman, U.A.T. Flow regime at ambient outlet pressure and its influence in comprehensive two-dimensional gas chromatography. J. Chromatogr. A 2005, 1086, 141–150. [Google Scholar] [CrossRef]
- Gray, M.R.; McCaffrey, W.C. Role of Chain Reactions and Olefin Formation in Cracking, Hydroconversion, and Coking of Petroleum and Bitumen Fractions. Energy Fuels 2002, 16, 756–766. [Google Scholar] [CrossRef]
- Karisathan Sundararajan, N.; Ramachandran Bhagavathi, A. Experimental Investigation on Thermocatalytic Pyrolysis of HDPE Plastic Waste and the Effects of Its Liquid Yield over the Performance, Emission, and Combustion Characteristics of CI Engine. Energy Fuels 2016, 30, 5379–5390. [Google Scholar] [CrossRef]
- Hu, S.Z.; Li, S.F.; Cao, J.; Zhang, D.M.; Ma, J.; He, S.; Wang, X.L.; Wu, M. A Comparison of Normal and Reversed Phase Columns in Oil Analysis by Comprehensive Two-dimensional Gas Chromatography With Time-of-flight Mass Spectrometry. Pet. Sci. Technol. 2014, 32, 565–574. [Google Scholar] [CrossRef]
- Burnes, D.; Camou, A. Impact of Fuel Composition on Gas Turbine Engine Performance. J. Eng. Gas. Turb. Power 2019, 141, 101006. [Google Scholar] [CrossRef] [Green Version]
- Fang, X.; Huang, X.; Chen, W.; Qiao, X.; Ju, D. Development of a skeletal surrogate mechanism for emulating combustion characteristics of diesel from direct coal liquefaction. Combust. Flame 2020, 218, 84–97. [Google Scholar] [CrossRef]


| Combination | Configuration | First Dimension Column | Second Dimension Column |
|---|---|---|---|
| 1 | NP | RTX-1 PONA a (50 m × 0.25 mm × 0.25 μm) | BPX-50 b (2 m × 0.18 mm × 0.18 μm) |
| 2 | PN | Stabilwax c (60 m × 0.25 mm × 0.25 μm) | Rxi-5ms d (2 m × 0.1 mm × 0.1 μm) |
| 3 | MDP | IL-59 e (30 m × 0.25 mm × 0.25 μm) | Rxi-5ms d (2 m × 0.1 mm × 0.1 μm) |
| 4 | MDP | BPX-50 b (60 m × 0.25 mm × 0.25 μm) | Rxi-5ms d (2 m × 0.1 mm × 0.1 μm) |
| Sample | Plastic Waste Diesel | Plastic Waste Naphtha | ||||||
|---|---|---|---|---|---|---|---|---|
| Detector | FID | NCD | SCD | MS | FID | NCD | SCD | MS |
| Column combination | 1 2 | 1 | 1 | 1 2 | 1 2 | 1 | 1 | 1 2 |
|
Injector Temperature (°C) Split flow (ml.min−1) |
PTV * 370 60 |
SSL 300 10 |
PTV 370 10 |
SSL 300 60 |
PTV 300 101 |
SSL 300 10 |
PTV 300 10 |
SSL 300 101 |
| Carrier gas (ml.min−1) | 2.1 1.4 | 2.1 | 2.1 | 2.3 2.1 | 2.1 1.4 | 2.1 | 2.1 | 2.3 2.1 |
| Oven start (°C) Oven end (°C) Ramp (°C) |
40 33 260 2 |
40 200 3 |
40 200 3 |
40 33 260 2 |
30 30 200 2 |
40 200 3 |
40 150 3 |
30 30 200 2 |
| Modulation time (s) | 5 18 | 5 | 5 | 5 18 | 5 20 | 5 | 5 | 5 20 |
|
Detector temperature (°C) Detector range (-) Detector acquisition rate (Hz) |
300 10 100 |
920 1 100 |
800 1 100 |
300 - 30 |
300 10 100 |
920 1 100 |
800 1 100 |
300 - 30 |
| Chemical Class | RTX-1 PONA × BPX-50 (NP) | Stabilwax × Rxi-5-ms (RP) | ||
|---|---|---|---|---|
| Average R2D | Average Intraclass R2D | Average R2D | Average Intraclass R2D | |
| n-Paraffins | 1.25 ± 0.10 | 8.24 ± 0.24 | 5.54 ± 0.10 | 12.77 ± 0.13 |
| α-Olefins | 1.34 ± 0.12 | 8.22 ± 0.01 | 2.09 ± 0.27 | 8.20 ± 0.61 |
| Iso-olefins | 0.64 ± 0.01 | 3.04 ± 0.46 | 1.24 ± 0.04 | 4.66 ± 0.16 |
| Iso-paraffins | 0.79 ± 0.04 | 2.81 ± 0.25 | 1.22 ± 0.26 | 4.36 ± 0.29 |
| Naphthenes | 0.72 ± 0.05 | 6.73 ± 0.25 | 0.70 ± 0.03 | 3.17 ± 0.16 |
| Diolefins | 1.20 ± 0.05 | 7.13 ± 0.15 | 1.61 ± 0.25 | 5.54 ± 0.12 |
| Monoaromatics | 0.57 ± 0.05 | 5.06 ± 0.13 | 1.54 ± 0.26 | 6.56 ± 0.99 |
| Chemical Class | RTX-1 PONA × BPX-50 | Stabilwax × Rxi-5-ms | ||
|---|---|---|---|---|
| Average R2D | Average Intraclass R2D | Average R2D | Average Intraclass R2D | |
| n-Paraffins | 2.74 ± 0.25 | 8.16 ± 0.76 | 1.87 ± 0.17 | 5.92 ± 0.15 |
| α-Olefins | 2.51 ± 0.07 | 7.04 ± 0.47 | 1.35 ± 0.18 | 3.76 ± 0.01 |
| Iso-olefins | 1.12 ± 0.07 | 3.57 ± 0.30 | 1.36 ± 0.08 | 6.52 ± 0.45 |
| Iso-paraffins | 5.41 ± 0.31 | 12.70 ± 0.47 | 1.92 ± 0.11 | 11.77 ± 0.25 |
| Naphthenes | 0.97 ± 0.11 | 5.40 ± 0.49 | 1.14 ± 0.17 | 2.52 ± 0.49 |
| Dioleffins | 1.62 ± 0.03 | 8.21 ± 0.57 | 1.87 ± 0.17 | 4.78 ± 0.05 |
| Monoaromatics | 3.00 ± 0.13 | 11.03 ± 0.33 | 1.62 ± 0.06 | 6.82 ± 0.50 |
| Diesel Fraction | Naphtha Fraction | ||
|---|---|---|---|
| Compound Name | wt% Sulfur | Compound Name | wt% Sulfur |
| Carbon disulfide | 1.15 ± 0.003 | Carbon disulfide | 142.45 ± 1.337 |
| C3H8S sulfides | 4.66 ± 0.014 | C3H8S sulfides | 1.06 ± 0.010 |
| C1 thiophenes | 1.02 ± 0.003 | Thiophene | 4.96 ± 0.047 |
| Total | 6.83 ± 0.021 | C1 thiophenes | 11.49 ± 0.108 |
| C2 thiophenes | 25.48 ± 0.239 | ||
| C3 thiophenes | 22.65 ± 0.213 | ||
| C4 thiophenes | 2.65 ± 0.025 | ||
| Total | 210.74 ± 1.978 |
| Naphtha Fraction | Nitrogen Content |
|---|---|
| Compound Name | wt% Nitrogen |
| Pyridine | 8.10 ± 0.001 |
| Methylpyridine | 11.53 ± 0.001 |
| Ethylpyridine | 9.28 ± 0.001 |
| C3 pyridine | 1.56 ± 0.0001 |
| Total | 30.46 ± 0.002 |
| Elemental Composition | Diesel Fraction | Naphtha Fraction | Plastic-Waste Pyrolysis Oil [16] | |||
|---|---|---|---|---|---|---|
| EA | GC × GC | EA | GC × GC | EA | GC × GC | |
| C (wt%) | 85.19 ± 0.39 | 85.51 | 85.52 ± 0.14 | 85.93 | 88.4 | 88 |
| H (wt%) | 14.26 ± 0.39 | 14.49 | 13.84 ± 0.17 | 13.93 | 9.6 | 10.9 |
| S (wt%) | <MDL | 0.001 | <MDL | 0.021 | 0.17 | 0.17 |
| N (wt%) | <MDL | <MDL | <MDL | 0.003 | 1.08 | 1.06 |
| O (wt%) | 0.55 ± 0.04 | 0.01 a | 0.64 ± 0.01 | 0.14 b | 0.99 | 0.35 |
Publisher’s Note: MDPI stays neutral with regard to jurisdictional claims in published maps and institutional affiliations. |
© 2021 by the authors. Licensee MDPI, Basel, Switzerland. This article is an open access article distributed under the terms and conditions of the Creative Commons Attribution (CC BY) license (https://creativecommons.org/licenses/by/4.0/).
Share and Cite
Dao Thi, H.; Djokic, M.R.; Van Geem, K.M. Detailed Group-Type Characterization of Plastic-Waste Pyrolysis Oils: By Comprehensive Two-Dimensional Gas Chromatography Including Linear, Branched, and Di-Olefins. Separations 2021, 8, 103. https://0-doi-org.brum.beds.ac.uk/10.3390/separations8070103
Dao Thi H, Djokic MR, Van Geem KM. Detailed Group-Type Characterization of Plastic-Waste Pyrolysis Oils: By Comprehensive Two-Dimensional Gas Chromatography Including Linear, Branched, and Di-Olefins. Separations. 2021; 8(7):103. https://0-doi-org.brum.beds.ac.uk/10.3390/separations8070103
Chicago/Turabian StyleDao Thi, Hang, Marko R. Djokic, and Kevin M. Van Geem. 2021. "Detailed Group-Type Characterization of Plastic-Waste Pyrolysis Oils: By Comprehensive Two-Dimensional Gas Chromatography Including Linear, Branched, and Di-Olefins" Separations 8, no. 7: 103. https://0-doi-org.brum.beds.ac.uk/10.3390/separations8070103