
Characterization of Moravian Wines by Selected Chemical Parameters
by
 , , and
Jan Javorský
1, 
Martin Král
1,
Marek Šnirc
2,
Július Árvay
2,
Bohuslava Tremlová
1,* and
Dani Dordević
1 1
Department of Plant Origin Food Sciences, Faculty of Veterinary Hygiene and Ecology, University of Veterinary Sciences Brno, Palackeho tr. 1946/1, 61242 Brno, Czech Republic
2
Department of Chemistry, Faculty of Biotechnology and Food Sciences, Slovak University of Agriculture in Nitra, Tr. A. Hlinku 2, 94976 Nitra, Slovakia
*
Author to whom correspondence should be addressed.
Separations 2021, 8(7), 89; https://0-doi-org.brum.beds.ac.uk/10.3390/separations8070089
Submission received: 20 May 2021
/
Revised: 15 June 2021
/
Accepted: 17 June 2021
/
Published: 22 June 2021
(This article belongs to the Special Issue Separation and Quantitative Analysis of Natural Product Extracts)
Abstract
:Knowledge of analytical values in wines is essential to ensure product safety and compliance with legislation, and it is also essential to understand the various technologies in wine production. The aim of this work was to evaluate the analytical parameters of bottled Moravian wines from the Znojmo sub-region, from harvests 2015 and 2016. Basic oenological parameters and biologically active substances were evaluated. Moreover, we evaluated conditions during bottle aging in wines from harvest 2016. The results of the basic analytical values such as total phenolic acid (TPA), total sulfur dioxide (SO2), pH, actual alcohol content (EtOH), and titratable acidity (TA) were in accordance with generally known values in wines and met the legislative requirements within oenological practices. Biologically active substances, such as gallic acid, trans-caffeic acid (TCA), trans-p-coumaric acid (TPCA), rutin, ferulic acid (FA), myricetin, resveratrol, and quercetin were identified. Comparing the analytical values of individual types of wine leads to a better understanding of winemaking technology and the development of wine as such. The subject of the study was also the monitoring of produced grape pomace incurred during wine production harvest 2015 with the indication of possibilities of its further use.
1. Introduction
Wine is one of the most frequently consumed beverages in many parts of the world, and it has been known since the early days of civilization [1]. The medical use of wine dates back to 2400 BC [2] when it was applied mainly as an antiseptic, a painkiller, and for digestive disorders [2,3]. In general, alcohol consumption can have both beneficial and detrimental effects on human health, depending on the amount consumed and the profile of the consumer. The positive effects of wine—when consumed moderately—on human health have been described by many authors. The most common effects include the reduction in the risk of cardiovascular diseases and mortality [4,5], and the decrease in blood pressure in patients with hypertension [6], antitumor [7], antiatherogenic, anti-inflammatory, antiviral, and antibacterial activity [8,9]. However, other authors have not found any effects on human health at all [10,11], while the last group of authors have even found negative effects [12].
Wine quality is defined by its sensory attributes, which are determined by its physical and chemical properties [13]. An important factor is the quality of wine grapes, which is influenced by: geographical origin, variety, ripening phase, harvesting, horticultural, and oenological practices, as well as chemical and textural parameters [14], and by the technological process of wine production and storage. Positive health effects are attributed to biologically active substances contained in wine. Wine is a rich source of polyphenols, such as flavanols (catechin, epicatechin, etc.), flavonols (quercetin, rutin, myricetin, etc.), anthocyanins (the most abundant is malvidin-3-O-glucoside), phenolic acids (gallic acid, caffeic acid, p-coumaric acid, etc.), stilbenes (trans-resveratrol), and many other polyphenols [15,16].
Grapes are among the most economically valued horticultural fruits globally [17]. More than two-thirds of the global grape production of 73.3 metric tons [18] are destined for the wine industry, generating substantial quantities of byproducts, including pomace, which subsequently pose serious economic, environmental, and social challenges [19].
Grape consumption was found to be beneficial for human health due to the large content of bioactive substances. Approximately 75% of produced grapes is intended for wine production, out of which 20–30% represents waste products. This waste is also called grape pomace and consists of skins, remaining pulp, seeds, and stalks. These byproducts represent waste disposal or they are used for wine alcohol production, or they serve as fertilizer or as animal feed [20].
The South Moravian Region (Czech Republic) with an area of 7188 km is mostly flat and consists of fields, meadows, vineyards, and floodplain forests. Agricultural land represents up to 60% of the region’s area, and agriculture has a long tradition here. The region has excellent conditions for activities focused on viticulture, fruit, and vegetables. Vineyards in this region make up 90% of the entire wine-growing area of the Czech Republic [21]. With its location, climate, and soil properties, the region gives Moravian wines their typical characteristics.
In the wine sector, the term terroir is used to define and identify a specific area of production of wine that indicates a typicality of the product. The terroir is a term of French origin that identifies the environmental conditions, the characteristics of the soil, the terrain, and the wine making tradition of a specific geographical area that determine the organoleptic characteristics and the typicality of the wine [22,23].
The Znojmo subregion is smallest in terms of area of vineyards, as it occupies only 3530 hectares of land. Nevertheless, it belongs to about 91 wine villages [24]. It is located in the rain shadow, which forms the foothills of the Českomoravská vrchovina. This massif gave rise to stony soils in many places, mostly in the northern part of the area. Today, they form an ideal subsoil for growing varieties Riesling or Frankovka. As in other places in Moravia, in this part, we can find vineyards with loess or gravel. However, Veltlínské zelené and Müller Thurgau remain important varieties for this area [25].
At present, there are several works that have evaluated the quality of Moravian wines, but due to the popularity and growing interest of consumers in the quality of wines, further research is important.
The aim of this work was to evaluate the oenological parameters and biologically active substances of Moravian wines commonly available on the market. Furthermore, the aim of the study was to estimate the amount of grape pomace produced during the production of the wine harvest 2015 and to evaluate of evolution of analytical parameters from the wine harvest 2016 under two different storage conditions.
2. Materials and Methods
2.1. Wine Harvest 2015
With regard to the most commonly available types on the Czech market, seven types of wine samples (dry, medium dry, sweet, and medium sweet) were purchased from a medium-sized producer whose production corresponds to approximately 3.5% of the total wine consumption in the Czech Republic. The following Moravian wines harvested in 2015 were evaluated for the purpose of comparing analytical parameters. The information on samples of wine harvest 2015 is shown in Table 1.
Wine grapes were harvested from the South Moravian region and processed according to the producer standards. The wines (final products) were separately stored in large-capacity stainless-steel tanks according to the batch type. Samples were taken directly from the producers’ tanks into the hermetically sealed glass containers.
The producer of the collected wine samples gave information about the results of the yield of byproducts from the record book of the producer. According to Act No. 321/2004 Coll. in the Czech Republic, the producers of wine are obligated to keep records about each step of the wine production in the evidence book.
2.2. Wine Harvest 2016
The same producer provided wines of the year 2016, which were used to monitor the development of analytical parameters over time under two different storage conditions. The information on samples of wine harvest 2016 is shown in Table 2.
2.3. Oenological Parameters Measurement
Ethanol (EtOH) as actual alcohol content, pH, titratable acidity (TA), total phenols (TPA), and total sulfur dioxide (SO2) were evaluated according to Regulation (EU) No. 2019/934. Each wine sample was evaluated three times.
Actual alcohol content was determined with an ebulliometer, model EBULLIOTRONIC Ref.160450. The measurement of pH was performed using a combined pH Electrode GRYF 259 from the manufacturer GRYF HB, spol. s r.o. (Prague, Czech Republic). The total acid content is the sum of the titratable free volatile and nonvolatile acids when neutralizing the wine with an alkali hydroxide solution to pH = 7.0, and the equivalence point was determined potentiometrically. The method of the calculation of titratable acidity was expressed by Method OIV-MA-AS313-01 in grams of tartaric acid per liter given by: A’ = 0.075 × A. The total polyphenol content was determined spectrophotometrically using gallic acid as standard (ISO) 14502-1. The determination of total sulfur dioxide was performed volumetrically.
2.4. Measurement of Biologically Active Substances
Analyses of biologically active substances were carried out for each wine by the high-performance liquid chromatography coupled with diode array detection (HPLC-DAD) method. Wine samples’ evaluations were triplicated. The content of individual biologically active substances was determined using an Agilent 1260 Infinity HPLC (Agilent Technologies GmbH, Wäldbronn, Germany) with a quaternary solvent manager coupled with a degasser (Cat. No. G1311B), sampler manager (Cat. No. G1329B), column manager (Cat. No. G1316A), and diode array detector (Cat. No. G1315C). The HPLC analyses were performed on a Purosphere® reversed-phase C18 column (250 mm × 4 mm × 5 μm) (Merck KGaA, Darmstadt, Germany). The mobile phase consisted of gradient acetonitrile (A) and 0.1% phosphoric acid in ddH2O (B). The gradient elution was as follows: 0–1 min isocratic elution (20% A and 80% B), 1–5 min linear gradient elution (25% A and 75% B), 5–15 min (30% A and 70% B), and 15–25 min (40% A and 60% B). The post-run was 3 min. The flow rate was 1 mL/min and the injection volume was 5 μL. A column thermostat was set-up to 30 °C and the samples were kept at 4 °C in the sampler manager. The detection wavelengths were set-up at 265 nm (4-OH benzoic acid, vanillic acid, and gallic acid), 320 nm (vitexin, transp-coumaric acid, and trans-ferulic acid), and 372 nm (iso-quercitrin, quercetin, and rutin). Gallic acid (GA), trans-caffeic acid (TCA), trans-p-coumaric acid (TPCA), rutin, ferulic acid (FA), myricetin, resveratrol, and quercetin were determined. Compounds were identified and quantified by comparing the retention times of standard substances and comparing the run of the spectral UV lines of the analytes. Data were collected and processed using the Agilent Open Lab Chem Station software for LC 3D systems.
2.5. Statistical Analysis
All the data obtained were analyzed by the descriptive statistic for minimum and maximum values, arithmetic average, and standard deviation. Then, all the variables were tested for normality. Tested variables followed the Gaussian distribution according to the Kolmogorov–Smirnov test and the Shapiro–Wilk test. The Pearson correlation test at significance level alpha 0.05 was used to analyze the relationships between the variables. No significant differences were removed from the correlation matrices. A multivariate statistical technique, principal component analysis (PCA), was used to find the pattern of similarity of the observations and the variables by displaying them as points on a map. Analysis of variance was performed to find the significant differences between the tested variables. The correlation test and analysis of variance were performed using the Rstudio software (version 1.2.5033, Vienna, Austria) [26], and descriptive statistics, normality tests, and PCA analysis were performed using MS Excel and the XLSTAT package program [27].
3. Results and Discussion
3.1. Analytical Parameters of Moravian Wines, Harvest 2015
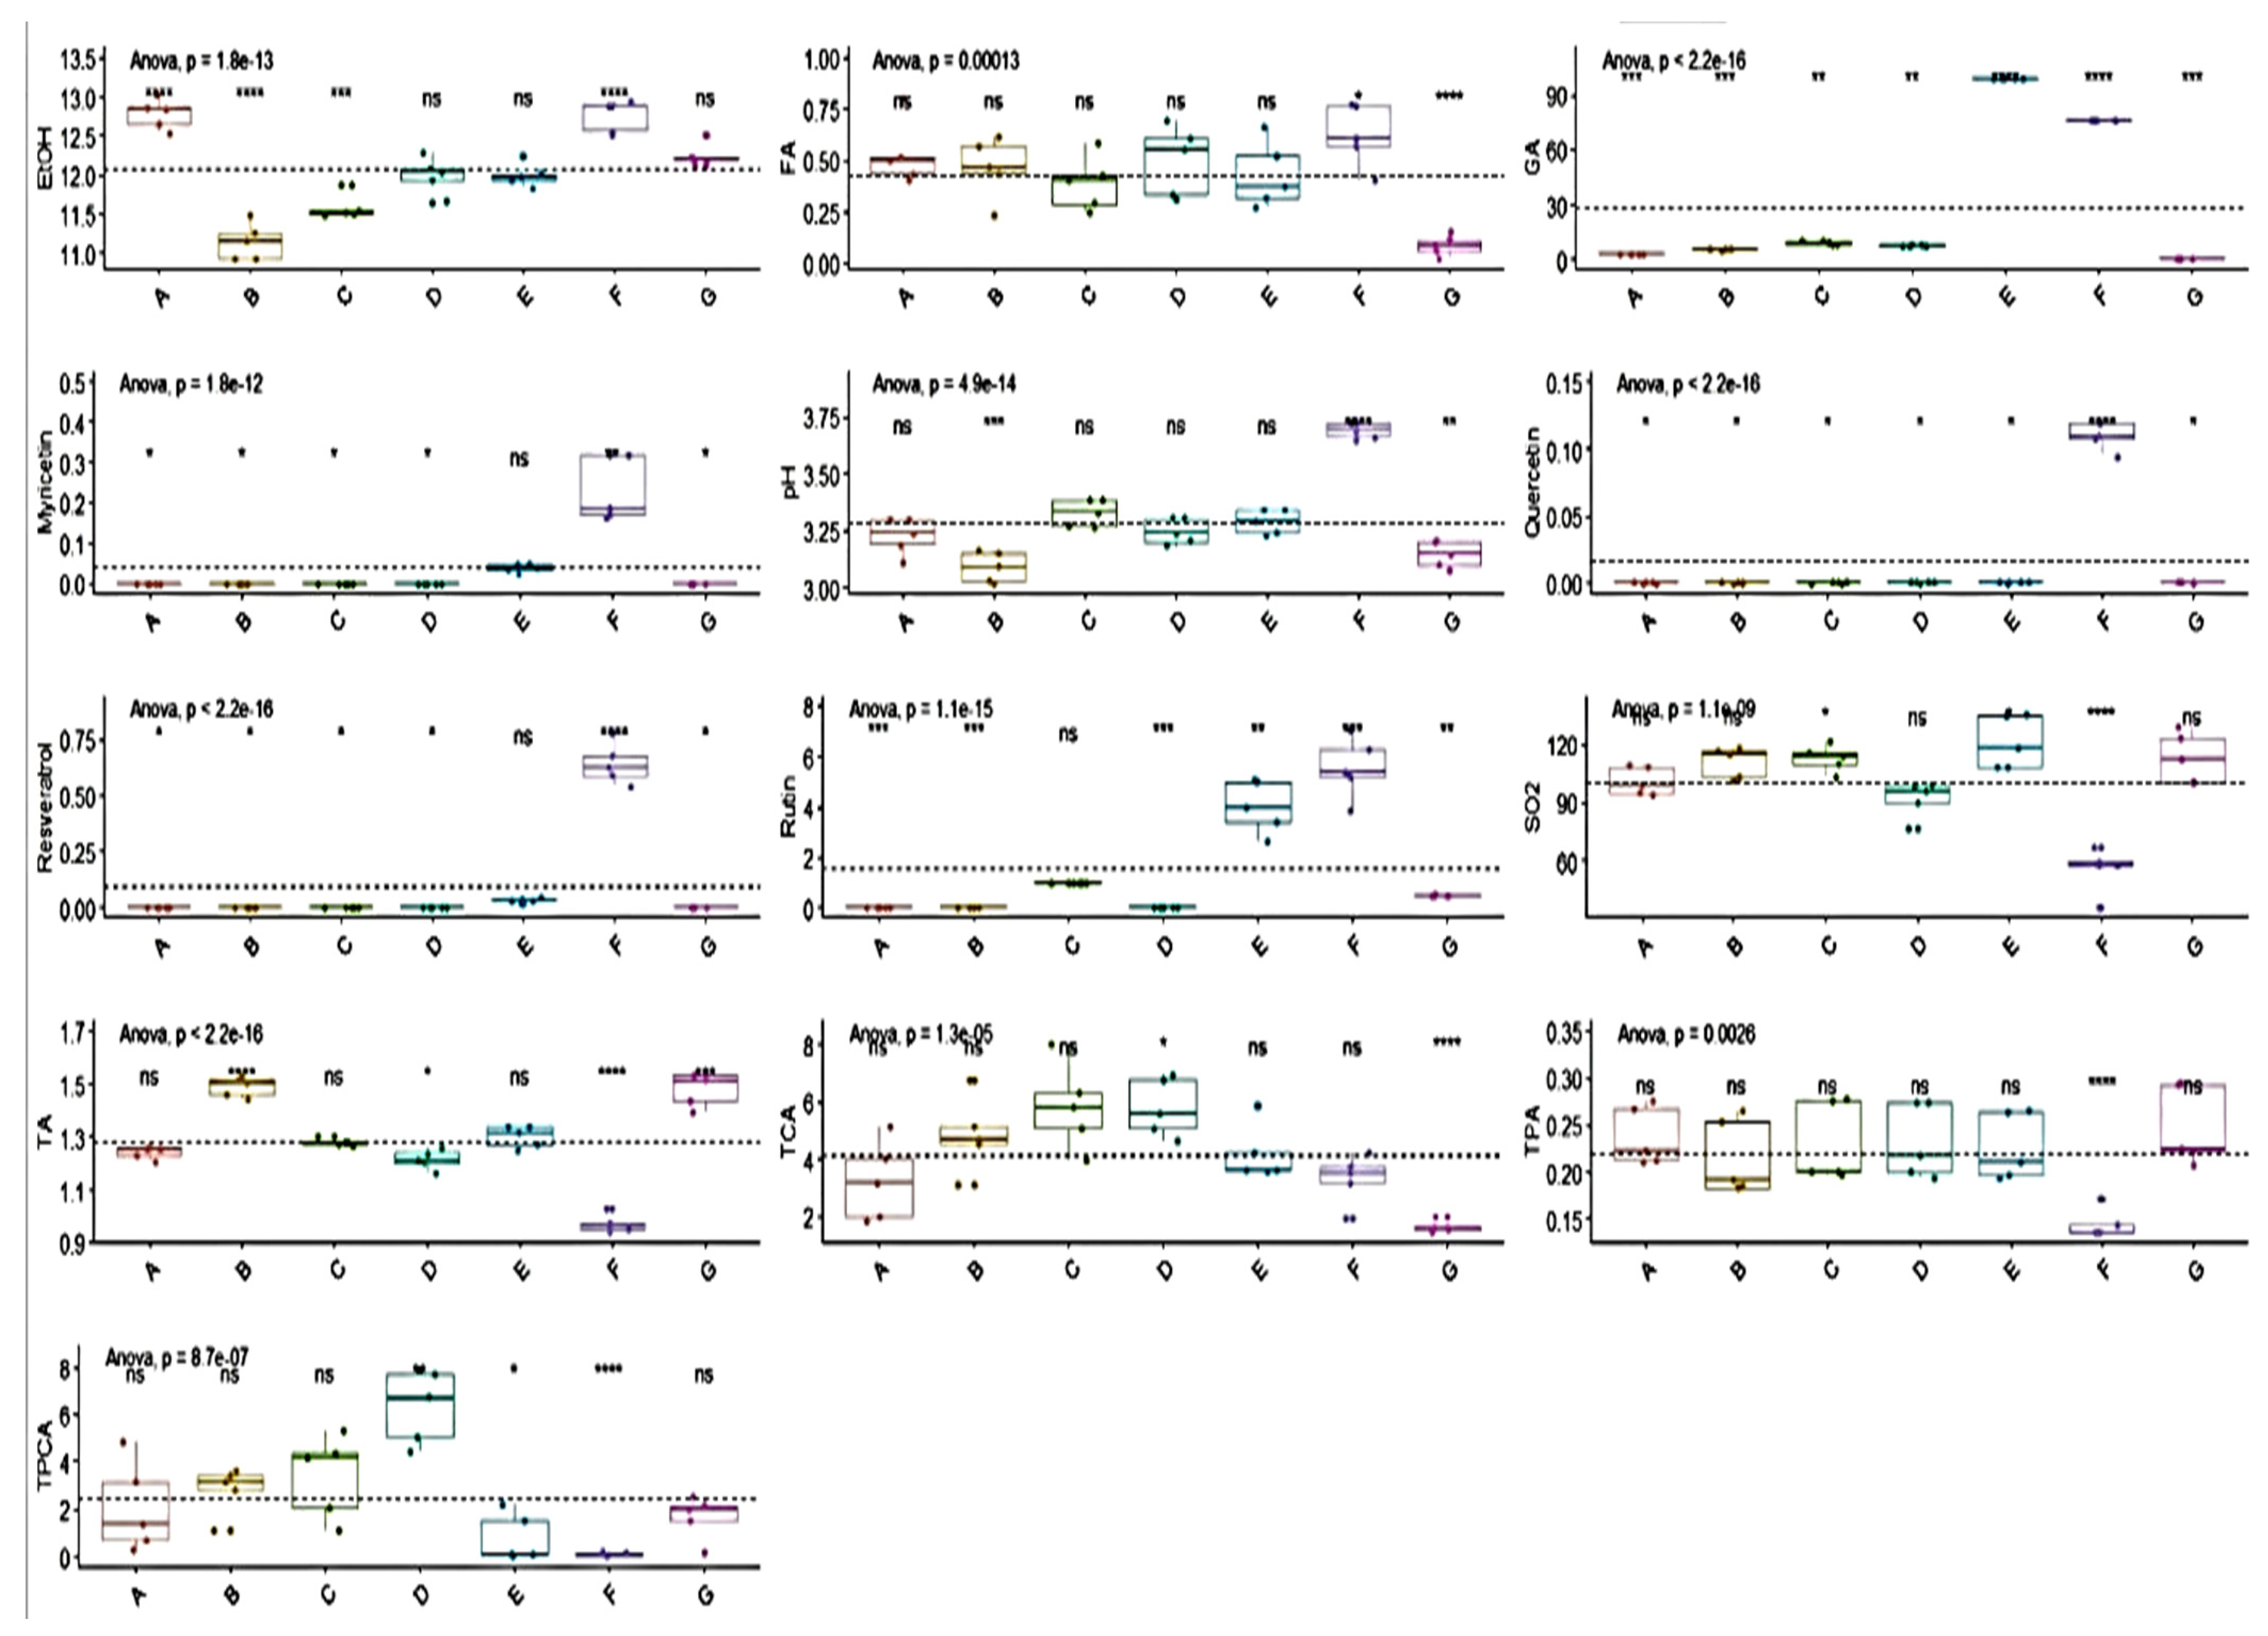
The results of the determination of oenological parameters and biologically active substances are shown in the charts of Figure 1. The pH values ranged from 3.05 to 3.76, which is consistent with the statement by Robinson [28] that the pH of wine is usually between 2.9 and 4.2. Chira et al. [29] measured slightly higher values for Cabernet Sauvignon samples. The ethanol levels in their wine samples ranged between 10.53% and 13.16% and the values measured by us were also within this range. The presence of total SO2 in our samples is important for preservation. It has been used as a preservative in winemaking for centuries [30]. The content of total polyphenols is affected by the terrain, processing technique, climate, and harvest year [31,32,33,34,35]. The content of total polyphenols in our samples was relatively consistent, with the exception of sample F. The results of the basic analytical values such as total phenolic acid (TPA), total sulfur dioxide (SO2), pH, actual alcohol content (EtOH), and titratable acidity (TA) were in accordance with generally known values in wines and met the legislative requirements within oenological practices. These results may be due to the fact that all the tested wines were harvested in 2015, from a single producer, as well as from a single region of the South Moravian area. They are associated with properties such as appearance, taste, mouth-feel, fragrance to a certain extent, and antimicrobial activity [36]. A significant group of phenols is formed by flavonoids. As reported by Ali et al. [37], the most common flavonoids in wine are flavonols (quercetin, kaempferol, myricetin, etc.), flavan-3-ols (catechin and epicatechin), and anthocyanins. Polymerization of polyhydroxy flavan-3-ol units, (+)-catechin and (−)-epicatechin, and their gallate esters produces oligomers and polymers called proanthocyanidins (often referred to as procyanidins).
In our study, we successfully identified some of the biologically active substances, such as gallic acid, trans-caffeic acid, trans-p-coumaric acid, rutin, ferulic acid, myricetin, resveratrol, and quercetin.
The occurrence of substances, such as myricetin, quercetin, resveratrol, and rutin, in red wines has been described by many authors. The average value of resveratrol in sample F was almost six times higher than those in other wines, where it was found in low concentrations. This parameter attracts a lot of attention for its positive effects on human health. It is generally found in wines in relatively low concentrations compared to other phenols [38]. As argued by García-Puente Rivas et al. [39], Monagas et al. [40], and Parpinello et al. [41], phenolic compounds are a crucial factor in the quality of red wine, as they are responsible for the color, bitterness, and astringency, which are the key sensory attributes of the consumer’s acceptability of wine.
Higher values of GA, rutin, and total SO2 were measured in sample E (Pinot Noir—claret, medium dry). As stated by Pozo-Bayon et al. [42], GA is one of the most common hydroxybenzoic acids and it occurs in wines in lower concentrations. This statement is consistent with the results of our samples with the exception of samples E and F. Interesting results were found for sample F (Pinot Noir—red, dry), where higher values of GA, myricetin, pH, quercetin, resveratrol, and rutin and, on the other hand, lower values of total SO2, TA, TPA, and TPCA were measured compared to other tested wines. In general, low FA, GA, and TCA values were measured in sample G. Higher TCA and TPCA values were detected in wine sample D.
The oenological parameters and biologically active substances determined in our experiment were statistically evaluated by Levene and Barlett tests. The results of the statistical tests are shown in Table 3.
Statistically significant differences are highlighted in bold. Using the Levene test (<0.01), statistically significant differences were found between the tested wine varieties for the parameters of TPA, TA, gallic acid, trans-p-coumaric acid, rutin, myricetin, resveratrol, and quercetin. The Barlett test showed statistically significant differences (<0.01) between the tested wines in the parameters of gallic acid, trans-p-coumaric acid, rutin, myricetin, resveratrol, and quercetin.
Despite the diversity of the wines tested, no statistically significant differences were found using both tests for total SO2, pH, EtOH, trans-caffeic acid, and ferulic acid.
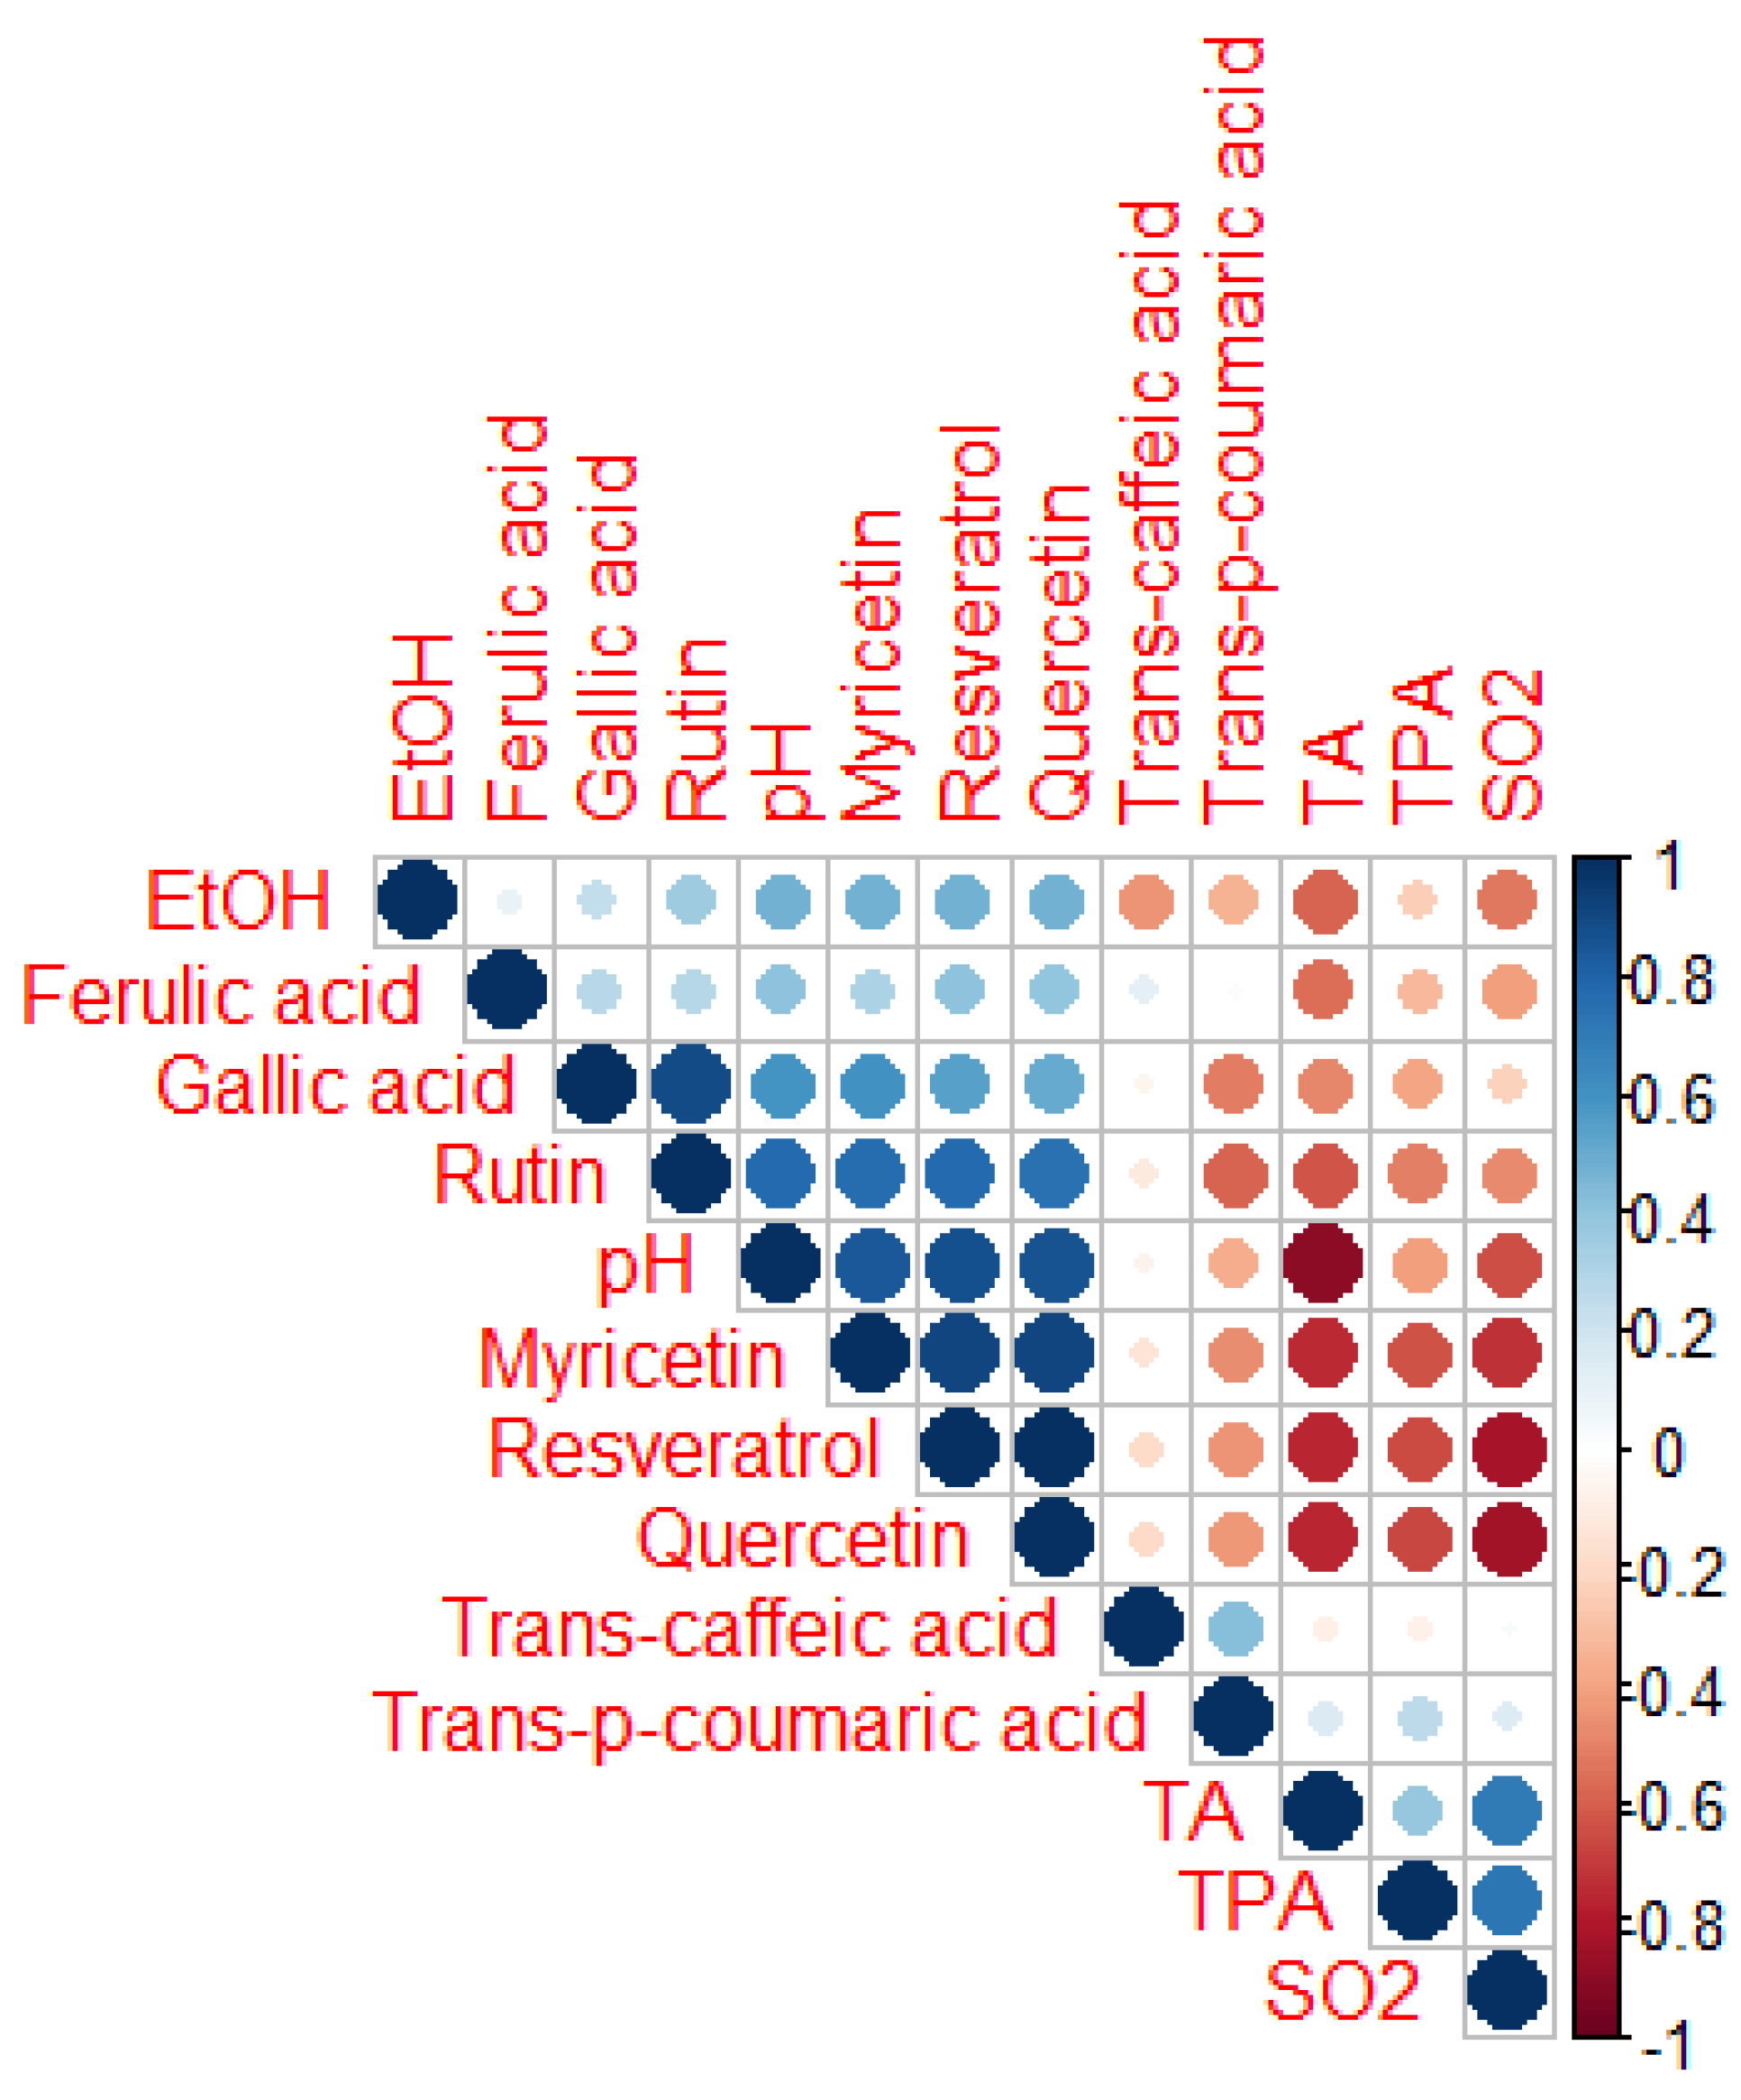
The results shown in Figure 2 clearly demonstrate that the most statistically significant correlations were for the parameters of quercetin, resveratrol, and pH, which correlated with all parameters except trans-caffeic acid. A similar result was observed for myricetin and rutin that did not significantly correlate only with trans-caffeic acid and also with ferulic acid. TA significantly correlated with all the parameters tested except trans-caffeic acid and trans-p-coumaric acid.
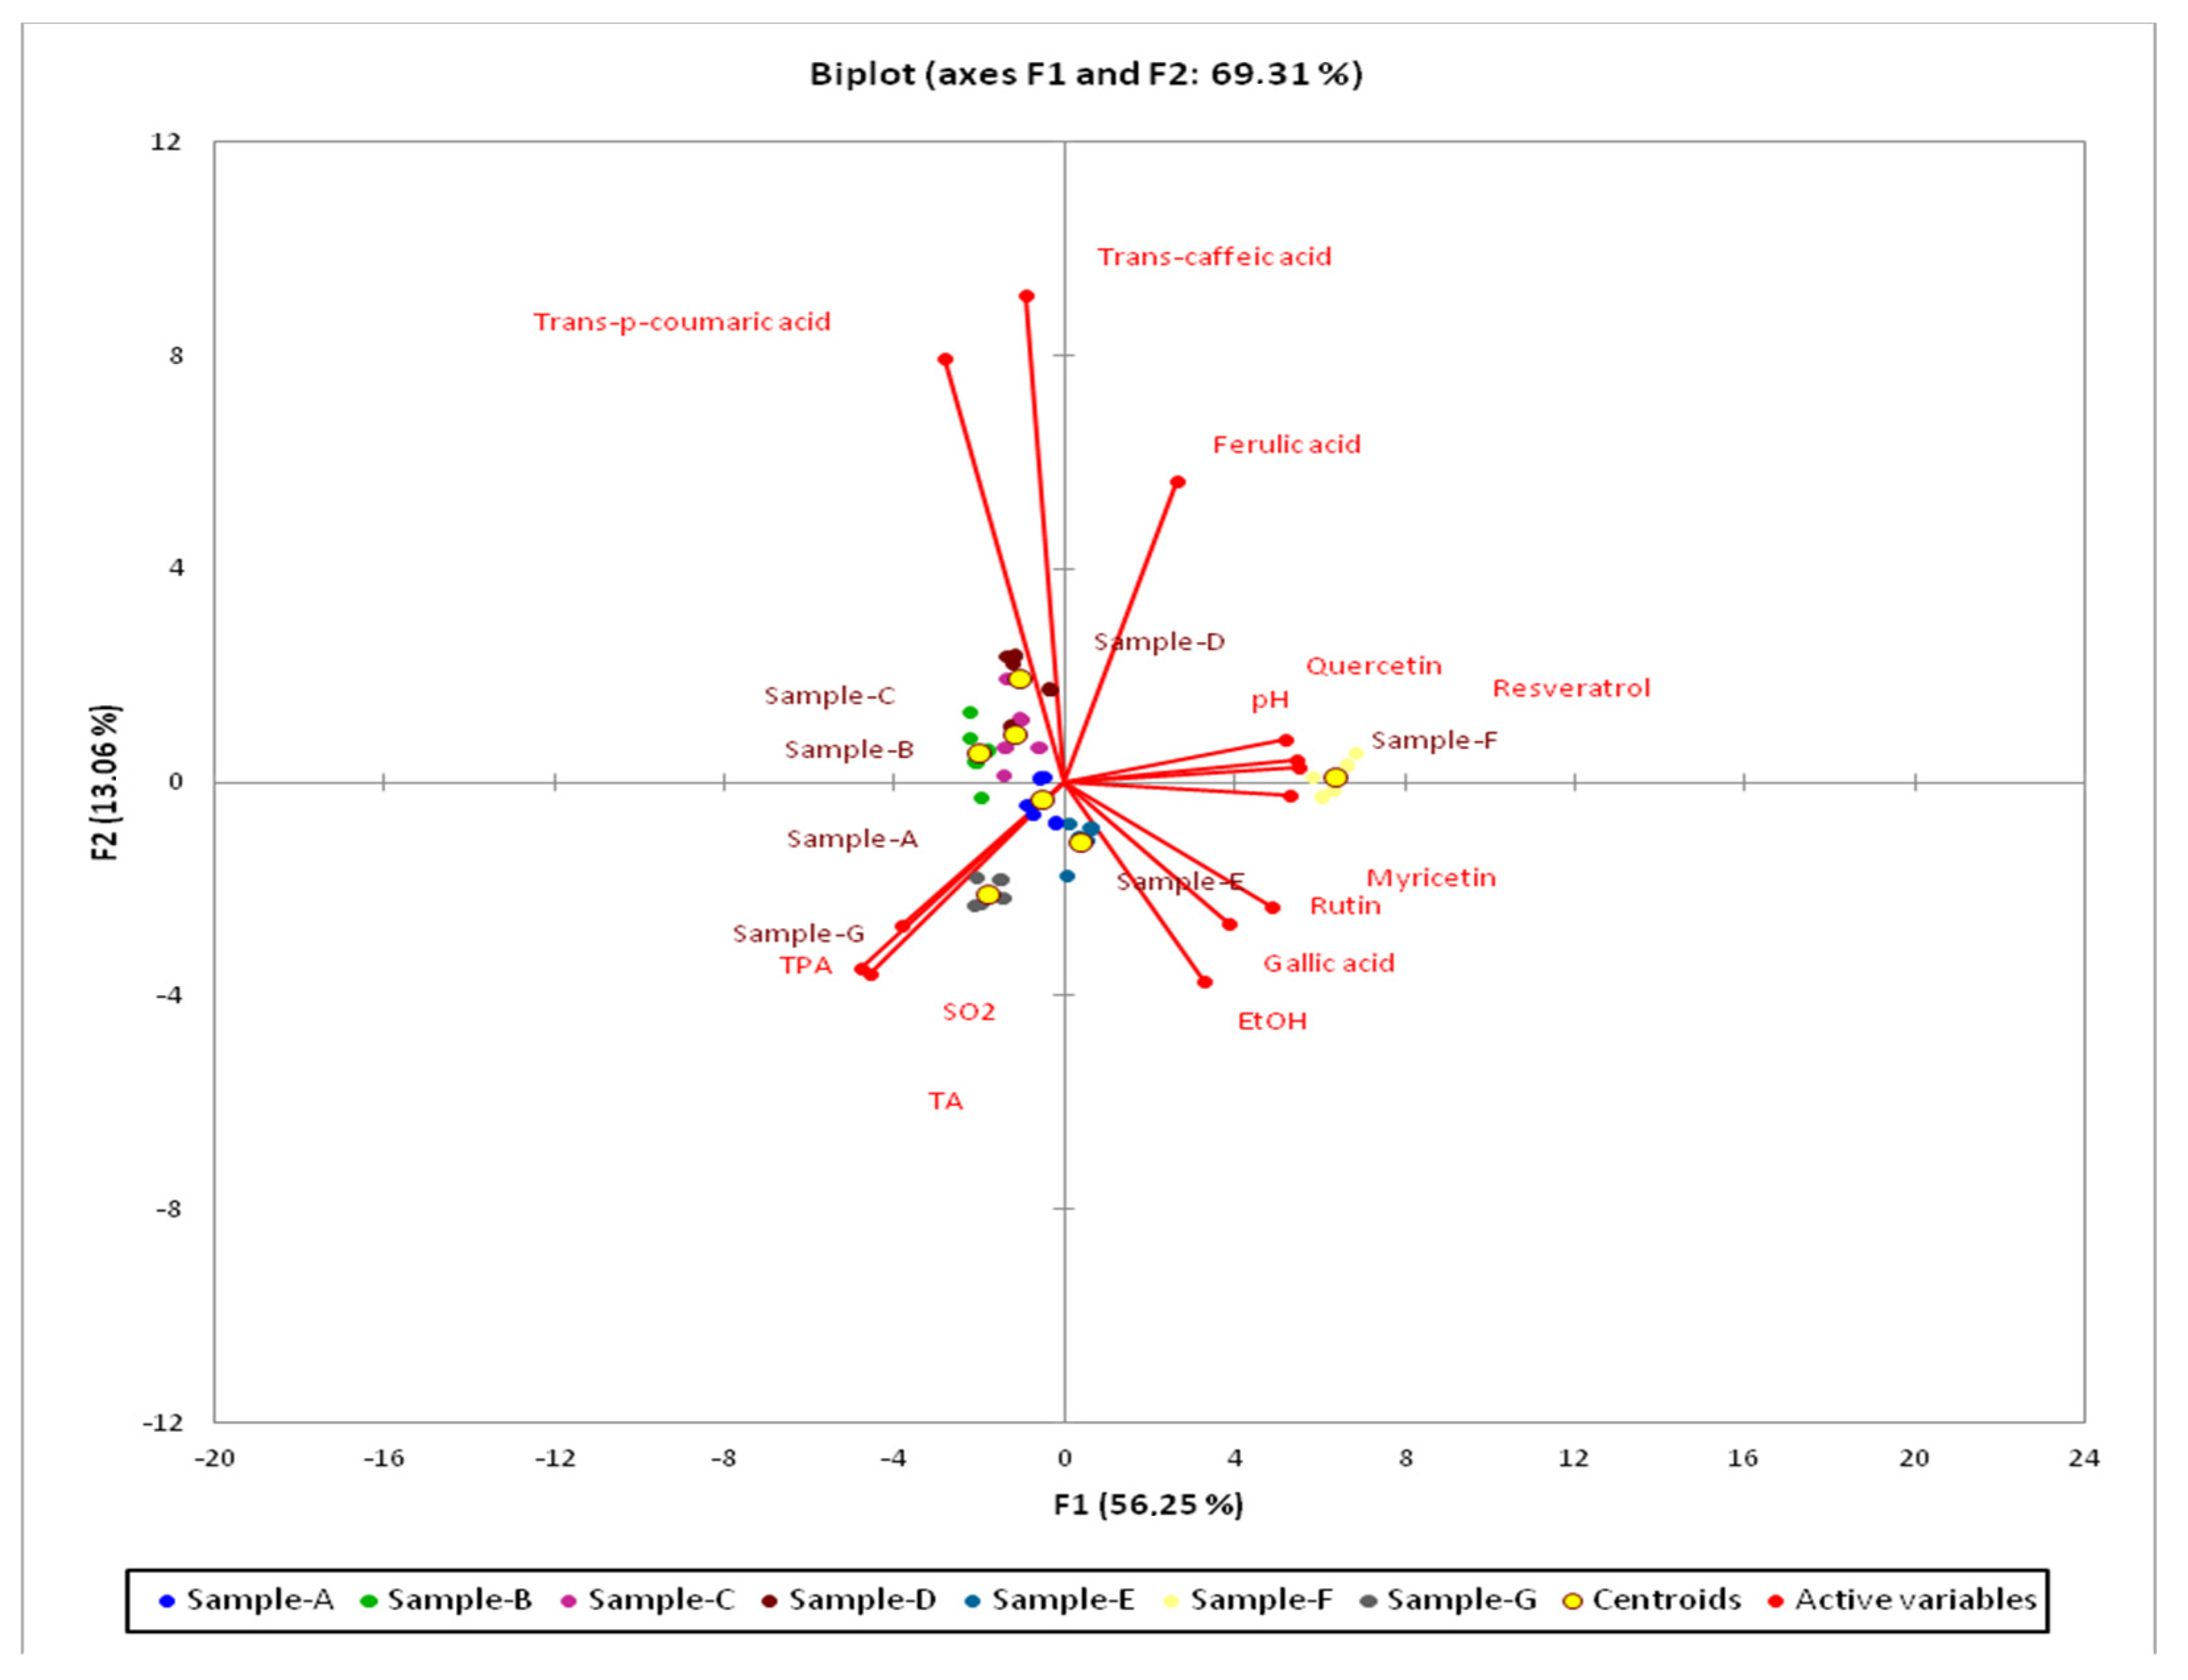
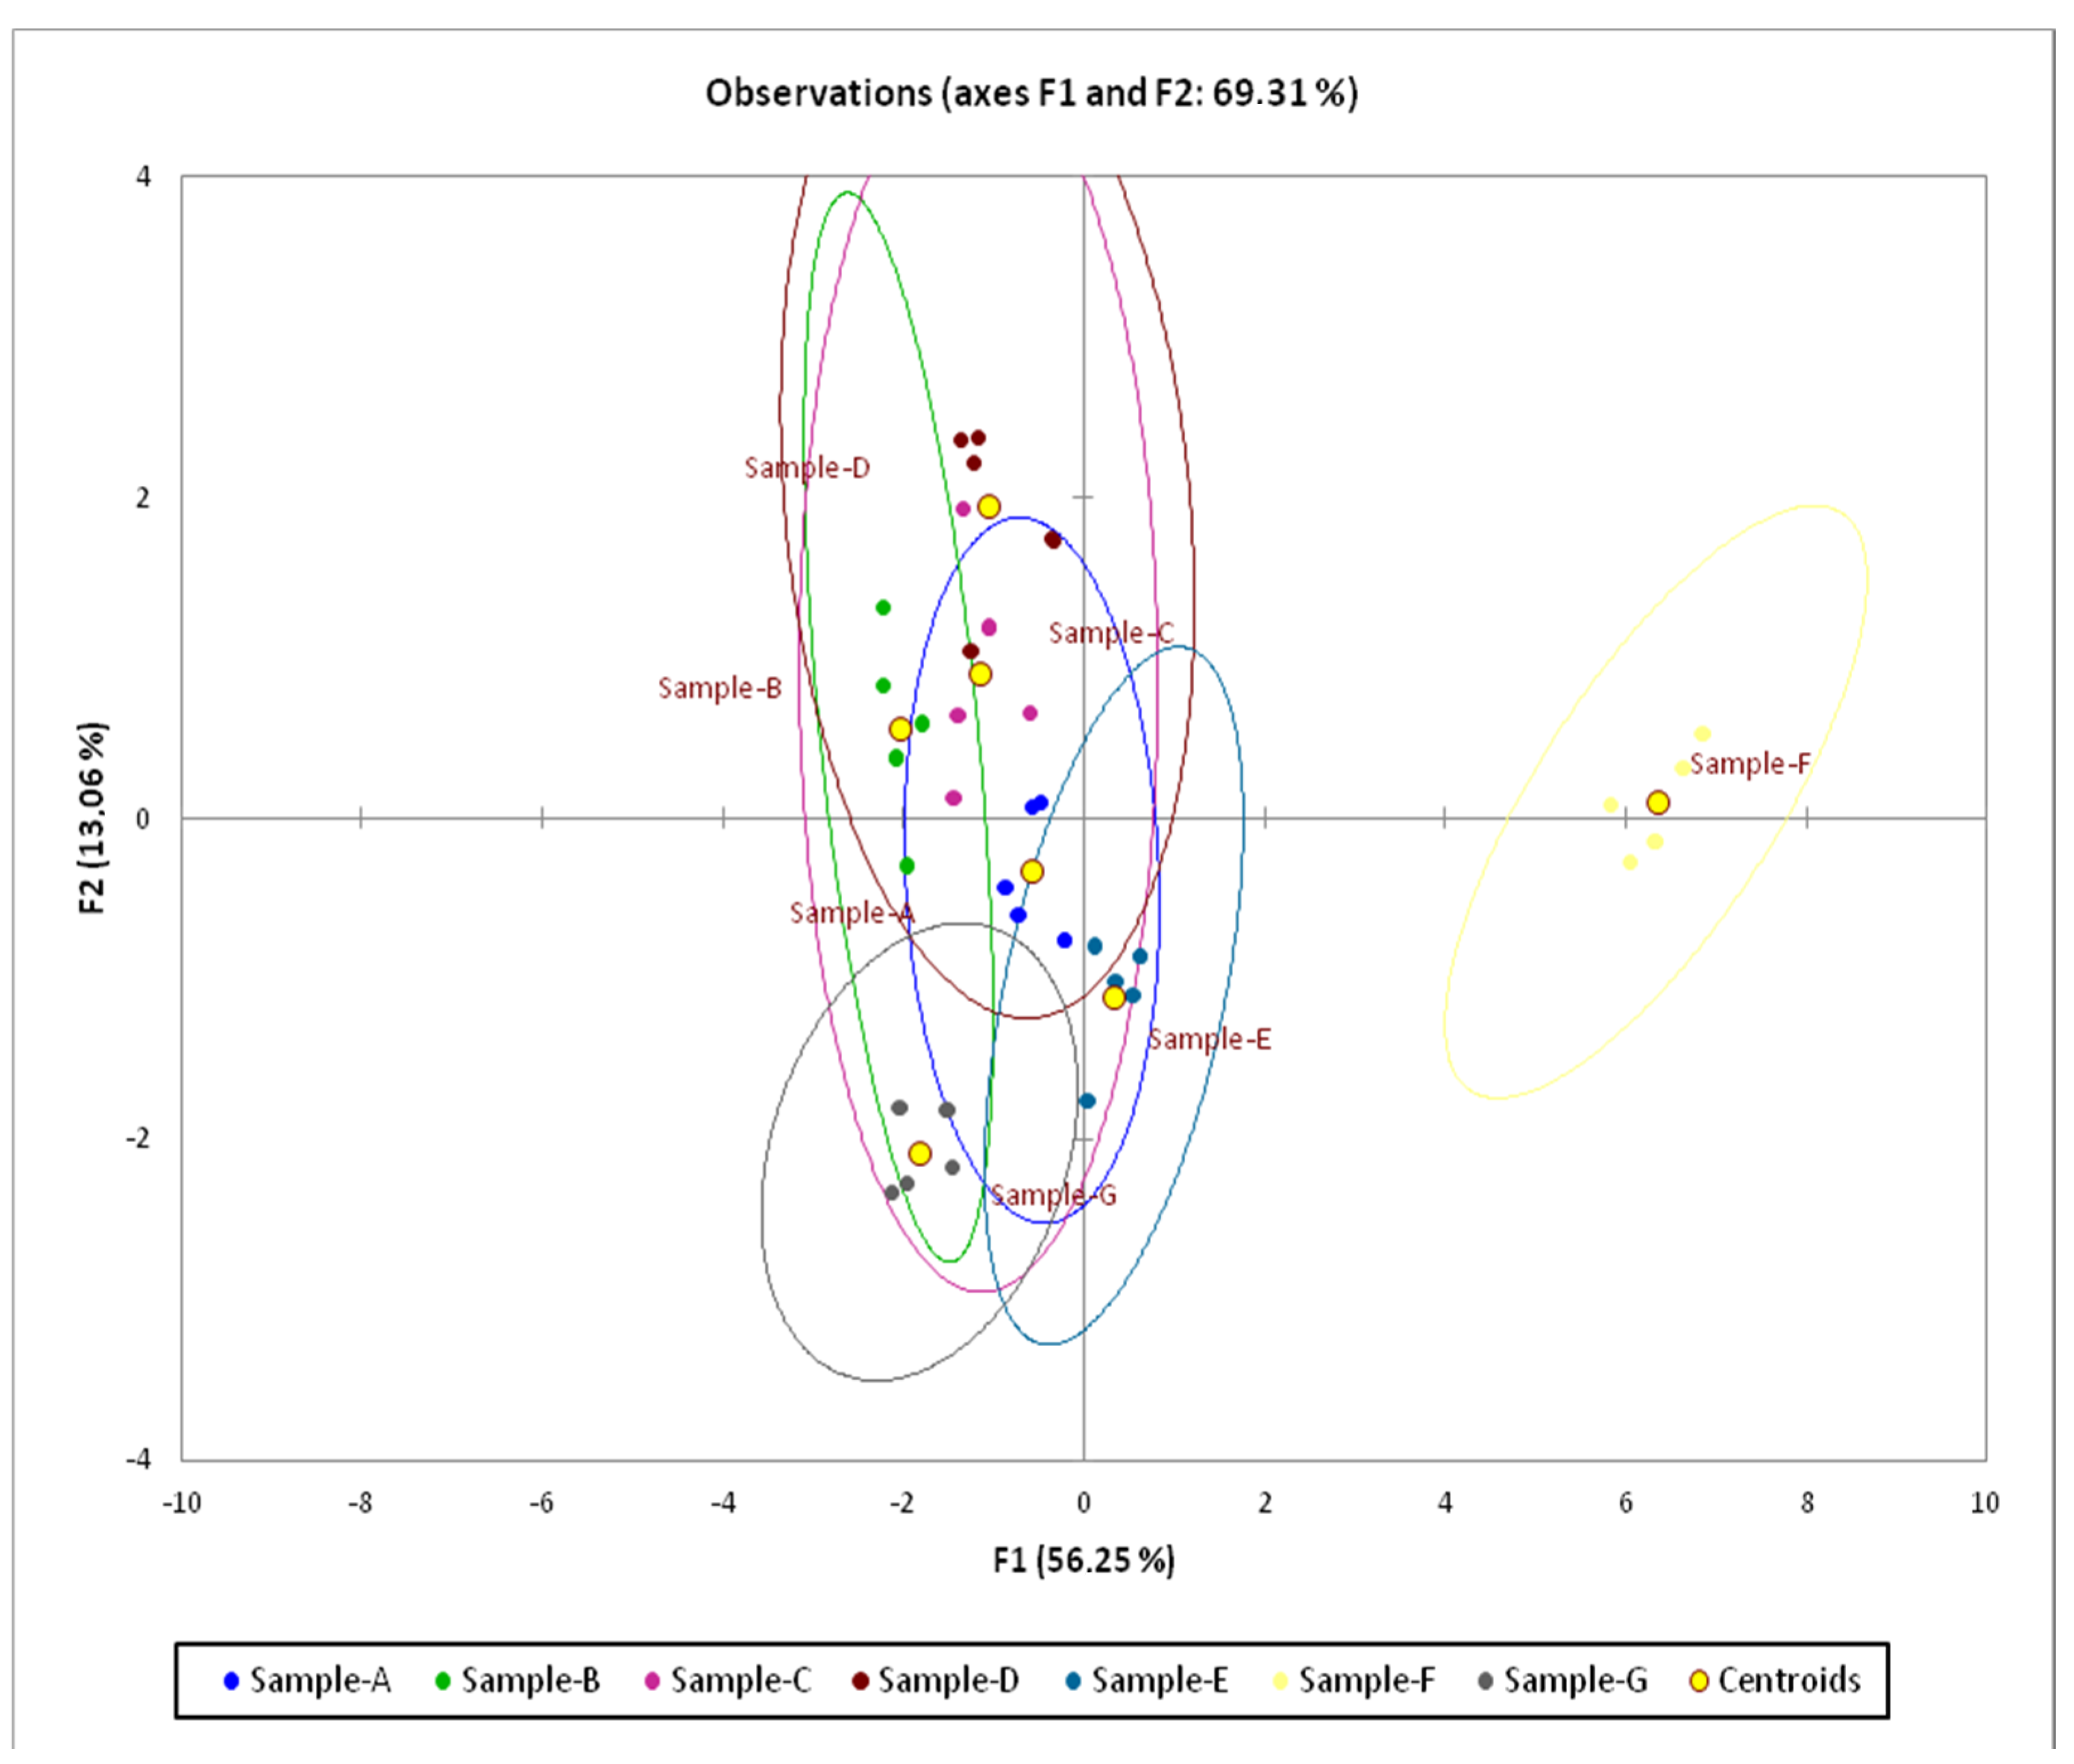
The Kaiser–Meyer–Olkin (KMO) test of sampling adequacy showed middling suitability of the data for the complete model (KMO = 0.67). Bartlett’s test of sphericity was significant (chi-square (observed) = 574, chi-square (critical) = 99.6, p ≤ 0.0001), indicating that the data were likely factorizable. The PCA revealed that 69.31% of the total variation embodied in 13 variables could be effectively condensed into and explained by the first two principal components (PCs), with eigenvalues of 7.31 and 1.69, respectively. PC1, accounting for 56.25% of the inertia, and PC2, explaining 13.06% of the inertia, clearly reflected the content of trans-caffeic acid and trans-p-coumaric acid. Figure 3 and Figure 4 show 2-D maps for PC1 and PC2 in which the tested variables are clustered around the centroids. The centroids present factor scores and squared cosines that are the coordinates and representation qualities, respectively. The most important variables for F1 were resveratrol, quercetin, myricetin, pH, and TA. The most important variables for F2 were trans-caffeic acid and trans-p-coumaric acid. Only the F variety was clearly separated from the other localities (Figure 3). The F variety was characterized by pH, myricetin, quercetin, and resveratrol. The B, C, and D varieties were characterized by trans-caffeic acid and trans-p-coumaric acid, while the A and G samples were characterized by total SO2, TPA, and TA. The E sample was characterized mostly by EtOH (Figure 4).
3.2. Waste Treatment in the Production of Wines Harvest 2015
A partial study of the wines of the year 2015 was also the monitoring of the grape pomace produced during the production of wine with the indication of the possibilities of their further use. Due to the dates from the evidence book of the producer, it is clear that, in the production of wine, there are losses of around 30% from the process of processing grapes to the production of wine intended for bottling. Losses in production are mostly grape pomace. According to the literature data, the amount of grape pomace accumulated during wine production is about 20–30% [20,43].
Grape pomace includes the skins and the pulp, usually the seeds, and, in some cases, the stems. Leaving the stems with the grapes during crushing, pressing and fermentation used to be the traditional practice. The tannin-rich stems give the wine a more bitter, astringent, and herbaceous taste. However, as this type of wine has become less popular, current wine-making practices favor destemming, and many wines are made with grapes crushed after the removal of the stems [44]. The producer supplies grape marc originated during wine production to another company in the South Moravian Region. Grape marc is processed in such a way that the present grape seeds stays intact. Grape seeds are dried, cleaned, and crushed, and grape oil is produced from them by cold pressing. The oil produced in this way is 100% extra virgin, without direct and preservative substances.
Grape seed represents the valuable byproduct of the wine production. Recently, the use of grape seeds has been increasing worldwide. They are used to produce nutritionally valuable oil with a high proportion of polyunsaturated fatty acids [45]. Compared with other vegetable oils, grape seed oil has low quantities of linolenic acid, which increases the oxidative stability and can represent an advantage in terms of human consumption and shelf life of the oil [46]. The oil represents a valuable source of bioactive substances beneficial to the human body. However, although consumers perceive grape seed oil as a healthier alternative than other oils, this product is not widely used, probably because of its high price, and it is not extensively utilized by the food industry [43].
Wine lees is a sludge material mainly composed of dead yeast precipitated at the bottom of wine tanks. Along with grape pomace and grape stalks, it is one of the main by-products of the winemaking industry [47]. Yeast as another waste generated during wine production is taken from another company in the South Moravian Region, where it is processed for isolation and subsequent sale in order to increase the sensory properties of wine for use in the production.
Other wastes from wine production are used, where necessary, to enrich the soil in the vineyards of the producer.
Most wine producers in the Czech Republic use marc, sludge, pomace, and other grape byproducts in other productions, especially to enrich the soil.
Fresh marc from ripe grapes is suitable for the production of distillate, often so-called pomace brandy. White varieties are usually used in the process of pomace brandy production; the marc is not pressed too much. The process of pomace brandy includes the squeezing of grape pomace, and about 20% water is added. It is important that the material is fermented rapidly and distilled immediately after fermentation [48].
It is also possible to produce flour (gluten-free alternative) from seeds. Grape seed flour (GSF), a byproduct of grape seed in the wine-making process, contains 60–70% of the extractable flavonoids of the grape, including catechin, epicatechin, and epigallocatechin, as well as procyanidin dimers and trimers. Studies have shown that the antioxidant activities of GSF play major roles in the attenuation of high-fat diet-induced oxidative stress, resulting in beneficial health effects on hepatic steatosis [49].
Pressed products of grapes can be a starting material for the extraction of anthocyanin dyes, used as a natural variant for dyeing in the food industry and natural textiles. From the growing popularity of waste-free management, the processing of various parts of the wine production byproducts as a bioenergy raw material is an interesting issue too from an ecological point of view. Wood chips or even pulp can be used as an alternative source of heating. Waste composting, if done correctly, produces material very rich in organic matter and is completely reusable in accordance with the ecology of the processing. Subsequently, it is also possible to use other parts of plants, such as wine leaves, where extracts from them are used in the production of cosmetic or medicinal preparations [45].
3.3. Evaluation of Selected Biological Compounds of Moravian Wines, Harvest 2016
Wine aging is the period that starts at the end of winemaking (after different processing depending on the wine variety and the vineries common practice) and continues after bottling until consumption. The aging of wine in the bottle, where contact with oxygen is minimal, consists of its evolution under reduced conditions and results, besides the color change, in an improvement of the sensory (olfactory and tasteful) characteristics. The speed of such a transformation is not the same for all wines: it depends on their initial composition and cellar conditions. Redox potential, pH, and humidity, together with temperature, determine the evolutionary conditions during bottle aging. During this process, wine is particularly sensitive to storage temperature and light radiation [50]. The predominant changes occurring during bottle-ageing involve the transformation of volatile constituents as wines re-establish a chemical equilibrium between acids, alcohols, and corresponding esters—reactions that have temperature-dependent rates [51].
The research also evaluated the wines from the year 2016 stored under two different storage conditions. Part of the wines were stored in a climatic chamber at the temperature of 12 °C; the same part of the wines was stored at room temperature (21 ± 3 °C). Basic analytical parameters such as total phenolic acid (TPA) of total sulfur dioxide (SO2), pH, actual alcohol content (EtOH), and titratable acidity (TA) were evaluated. Further, we identified and monitored biologically active substances, such as gallic acid, trans-caffeic acid (TCA), trans-p-coumaric acid (TPCA), rutin, ferulic acid (FA), myricetin, resveratrol, and quercetin.
Due to the measured values, a slight increase in TPA under both storage conditions can be observed in Table 6 and Table 7 (Basic oenological parameters) for white wines with a lower sugar content. The development of total SO2 is insignificant due to the measurement in individual stages of storage also due to the permitted limits according to part B Regulation (EU) No. 2019/934. Especially for white wines (Table 6, Table 7 and Table 8) and rosé wine (Table 9) we can observe a decrease in alcohol content depending on the length of storage. At the end of the storage, TA values were lower for white wines with a lower sugar content (Table 6 and Table 7) and also for rosé wine (Table 9). Oenological parameters of red wines (Table 10 and Table 11) were within the normal range for the given types of wines. In Table 12 and Table 13 (Biologically active substances) we can observe higher values of biologically active substances measured in dry white wine (Sauvignon: sample A) compared to semi-dry wine (Chardonnay: sample B). The development of gallic acid was not significant for any wine under the given storage conditions. TPCA values had a decreasing tendency especially at room temperature except for white wine with a higher sugar content after 14 months of storage, as can be seen from Table 14 (Biologically active substances). For sample C and sample D in Table 14 and Table 15 (Biologically active substances), white wine with a higher sugar content and rosé wine with a higher sugar content, a slight decrease in ferulic acid was observed after 14 months of storage. In contrast, for sample F (red sweet wine), a slight increase in ferulic acid can be observed from Table 16 (Biologically active substances) after storage at climatic chamber. The development of rutin had a slight decrease after 14 months of storage at room temperature in sample E (red dry wine, Table 17); however, in sample F (red sweet wine, Table 16), a slight increase in rutin was observed under the same conditions. Quercetin and myricetin, two flavonoids belonging to the flavonol class [52], were detected in red dry wine.
4. Conclusions
Knowledge of the analytical values of wines is essential for understanding wine technology. The measurement in this study was divided into two stages. Wines of the year 2015 were evaluated for the first stage of measurement, and wines of the year 2016 were evaluated for the second stage. Furthermore, the aim of the study was to estimate the amount of grape pomace produced during the production of wine harvest 2015 and to evaluate of evolution of analytical parameters of wine harvest 2016 under two different storage conditions.
The wine harvest 2015 evaluated in this study met the expected basic parameters, where the measured values of actual alcohol content (EtOH), pH, titratable acidity (TA), total phenols (TPA), and sulfur dioxide (SO2) were within the normal range for the given types of wines. Higher values of GA, rutin, and SO2 were measured for red wine. The evaluation of rosé wine revealed lower FA, GA, and TCA levels. Higher levels of TCA and TPCA were detected for white dry wine. The Levene test showed significant statistical differences in the evaluation of TPA, TA, gallic acid, trans-p-coumaric acid, rutin, myricetin, resveratrol, and quercetin. The Barlett test showed statistically significant differences (<0.01) between the tested wines in the parameters of gallic acid, trans-p-coumaric acid, rutin, myricetin, resveratrol, and quercetin. Comparing the analytical values of individual types of wine leads to a better understanding of winemaking technology and the development of wine as such.
As the study included the experiment of wine samples harvest 2016 storage under different conditions, the presented results give a clear picture about processes in wines during 9 and 14 months of storage. However, it cannot be stated that these two types of storage (room temperature and climatic chamber) during 14 months did not significantly affect the main wine samples properties. Otherwise, the following slight changes were observed: (a) white wines with lower sugar content had a slight TPA increase during both storage conditions; (b) SO2 content was not influenced by storage conditions; (c) alcohol content decreased during storage in white and rose wines; (d) TA levels at the end of the storage periods (9 and 14 months) were lowered in white and rose wines; (e) TPCA contents were constantly lowering at room temperature; (f) rutin content slightly decreased after 14 months of storage at room temperature in red dry wine, though rutin content increased in the samples of red sweet wine.
Besides these findings, the study also emphasized the importance of grape pomace as a byproduct obtained during wine production, as it represents a valuable source of important nutrients. The estimated amount of grape pomace obtained from the included producer highlighted the possibility to use grape pomace not only for soil enrichment, but also as a valuable source of bioactive substances that can serve as the fortification element in different food commodities. These statements and findings given by the study can represent a good direction toward wine storage issues, as well as better sustainability of wine production.
Author Contributions
Conceptualization, J.J., M.K., D.D., B.T.; methodology, J.J.; software, J.J.; validation, J.J., M.K. and B.T.; formal analysis, J.J., M.Š., J.Á.; investigation, J.J.; resources, B.T.; data curation, J.J.; writing—original draft preparation, J.J., M.K., B.T. and D.D.; writing—review and editing, J.J., D.D.; visualization, J.J.; supervision, B.T.; project administration, B.T.; funding acquisition, B.T. All authors have read and agreed to the published version of the manuscript.
Funding
Supported by funds from the Ministry of Education, Youth and Sports for institutional support of long-term conceptual development of research organizations.
Institutional Review Board Statement
Not applicable.
Informed Consent Statement
Not applicable.
Data Availability Statement
Not applicable.
Conflicts of Interest
The authors declare no conflict of interest.
References
- Tariba, B. Metals in wine—Impact on wine quality and health outcomes. Biol. Trace Elem. Res. 2011, 144, 143–156. [Google Scholar] [CrossRef]
- Robinson, J. The Oxford Companion to Wine; Oxford University Press: New York, NY, USA, 2006. [Google Scholar]
- Feher, J.; Lengyel, G.; Lugasi, A. Cultural history of wine, the theoretical background of wine therapy. Orv. Hetil. 2005, 146, 2635–2639. [Google Scholar] [CrossRef]
- Artero, A.; Artero, A.; Tarín, J.J.; Cano, A. The impact of moderate wine consumption on health. Maturitas 2015, 80, 3–13. [Google Scholar] [CrossRef]
- Avellone, G.; Di Garbo, V.; Campisi, D.; De Simone, R.; Raneli, G.; Scaglione, R.; Licata, G. Effects of moderate Sicilian red wine consumption on inflammatory biomarkers of atherosclerosis. Eur. J. Clin. Nutr. 2006, 60, 41. [Google Scholar] [CrossRef] [Green Version]
- Cavallini, G.; Straniero, S.; Donati, A.; Bergamini, E. Resveratrol requires red wine polyphenols for optimum antioxidant activity. J. Nutr. Health Aging 2016, 20, 540–545. [Google Scholar] [CrossRef] [PubMed]
- Platz, E.A.; Leitzmann, M.F.; Rimm, E.B.; Willett, W.C.; Giovannucci, E. Alcohol intake, drinking patterns, and risk of prostate cancer in a large prospective cohort study. Am. J. Epidemiol. 2004, 159, 444–453. [Google Scholar] [CrossRef] [Green Version]
- Aleixandre, J.L.; Aleixandre-Tudό, J.L.; Bolaños-Pizzaro, M.; Aleixandre-Benavent, R. Mapping the scientific research on wine and health (2001–2011). J. Agric. Food Chem. 2013, 61, 11871–11880. [Google Scholar] [CrossRef]
- Banc, R.; Socaciu, C.; Miere, D.; Filip, L.; Cozma, A.; Stanciu, O.; Loghin, F. Benefits of wine polyphenols on human health: A review. Bull. UASVM Food Sci. Technol. 2014, 71, 79–87. [Google Scholar] [CrossRef] [Green Version]
- Bessaoud, F.; Daures, J.P. Patterns of alcohol (especially wine) consumption and breast cancer risk: A case-control study among a population in Southern France. Ann. Epidemiol. 2008, 18, 467–475. [Google Scholar] [CrossRef]
- Sutcliffe, S.; Giovannucci, E.; Leitzmann, M.F.; Rimm, E.B.; Stampfer, M.J.; Willett, W.C.; Platz, E.A. A prospective cohort study of red wine consumption and risk of prostate cancer. Int. J. Cancer 2007, 120, 1529–1535. [Google Scholar] [CrossRef]
- Longnecker, M.P.; Orza, M.J.; Adams, M.E.; Vioque, J.; Chalmers, T.C. A meta-analysis of alcoholic beverage consumption in relation to risk of colorectal cancer. Cancer Causes Control 1990, 1, 59–68. [Google Scholar] [CrossRef] [PubMed]
- Raposo, R.; Chinnici, F.; Ruiz-Moreno, M.J.; Puertas, B.; Cuevas, F.J.; Carbú, M.; Cantos-Villar, E. Sulfur free red wines through the use of grapevine shoots: Impact on the wine quality. Food Chem. 2018, 243, 453–460. [Google Scholar] [CrossRef] [PubMed]
- Král, M.; Ošťádalová, M.; Pokorná, J.; Tremlová, B.; Rohrerová, E.; Šnirc, M.; Fekete, T. Quality of Wine Grape Cultivars Grown in Czech Republic. Erwerbs-Obstbau 2018, 60, 29–35. [Google Scholar] [CrossRef]
- King, R.E.; Bomser, J.A.; Min, D.B. Bioactivity of resveratrol. Comprehensive Reviews. Food Sci. Food Saf. 2006, 5, 65–70. [Google Scholar] [CrossRef]
- Şanli, S.; Şanli, N.; Ozkan, S.A.; Lunte, C. Development and validation of a green capillary electrophoretic method for determination of polyphenolic compounds in red wine samples. Chromatographia 2016, 79, 1351–1358. [Google Scholar] [CrossRef]
- Food and Agriculture Organization. Food and Agriculture Organization FAOSTAT Data: Crops. 2018. Available online: http://www.fao.org/faostat/en/#data/QC (accessed on 23 January 2021).
- International Organisation of Vine and Wine. 2018 International Organisation of Vine and Wine 2018 World Vitiviniculture Situation: OIV Statistical Report on World Vitiviniculture. 2018. Available online: http://www.oiv.int/public/medias/6371/oiv-statistical-report-on-world-vitiviniculture-2018.pdf (accessed on 22 January 2021).
- Beres, C.; Costa, G.N.S.; Cabezudo, I.; da Silva-James, N.K.; Teles, A.S.C.; Cruz, A.P.G.; Mellinger, C.; Tonon, R.V.; Cabral, L.M.C.; Freitas, S.P. Towards integral utilization of grape pomace from winemaking process: A review. Waste Manag. 2017, 68, 581–594. [Google Scholar] [CrossRef]
- Antonić, B.; Jančíková, S.; Dordević, D.; Tremlová, B. Grape Pomace Valorization: A Systematic Review and Meta-Analysis. Foods 2020, 9, 1627. [Google Scholar] [CrossRef]
- URL. 2. Charakteristika Jihomoravského Kraje. Available online: https://www.czso.cz/csu/xb/charakteristika_jihomoravskeho_kraje (accessed on 1 February 2021).
- Jankovičová, M. Význam “Terroir” ve Vinařství a Vinohradnictví. Bachelor’s Thesis, Mendel University in Brno, Brno, Czech Republic, 2010. [Google Scholar]
- Terroir. In Wikipedia: The Free Encyclopedia; Wikimedia Foundation: San Francisco, CA, USA, 2001; Available online: https://cs.wikipedia.org/wiki/Terroir (accessed on 25 March 2021).
- Vinařské Oblasti, Podoblasti a Vinařské Obce Moravy a Čech. Evinice. Česká Republika: NET21. 2019. Available online: http://www.evinice.cz/ovine/vinarske-oblasti-cr (accessed on 25 March 2021).
- Znojemská Podoblast. O Víně. Česká Republika: ISSA Czech. 2009. Available online: http://www.ovine.cz/web/structure/podoblasti51.html?do[loadData]=1&itemKey=cz_366 (accessed on 25 March 2021).
- RStudio Team. RStudio: Integrated Development for R; RStudio, Inc.: Boston, MA, USA, 2015; Available online: http://www.rstudio.com/ (accessed on 26 February 2021).
- Addinsoft. XLSTAT, Analyse de Données et Statistique Avec MS Excel; Addinsoft: New York, NY, USA, 2014. [Google Scholar]
- Robinson, J. Das Oxford Weinlexikon, 2 Bd; Hallwag: Ostfildern, Germany, 1995. [Google Scholar]
- Chira, K.; Jourdes, M.; Teissedre, P.L. Cabernet sauvignon red wine astringency quality control by tannin characterization and polymerization during storage. Eur. Food Res. Technol. 2012, 234, 253–261. [Google Scholar] [CrossRef]
- Doyle, M.P.; Beuchat, L.R. Food Microbiology: Fundamentals and Frontiers; ASM Press: Washington, DC, USA, 2007. [Google Scholar]
- Jiang, B.; Zhang, Z.W.; Zhang, X.Z. Influence of terrain on phenolic compounds and antioxidant activities of cabernet sauvignon wines in loess plateau region of China. J. Chem. Soc. Pak. 2011, 33, 900–904. [Google Scholar]
- Li, Z.; Pan, Q.; Jin, Z.; Mu, L.; Duan, C. Comparison on phenolic compounds in Vitis vinifera cv. Cabernet Sauvignon wines from five wine-growing regions in China. Food Chem. 2011, 125, 77–83. [Google Scholar] [CrossRef]
- Porgalı, E.; Büyüktuncel, E. Determination of phenolic composition and antioxidant capacity of native red wines by high performance liquid chromatography and spectrophotometric methods. Food Res. Int. 2012, 45, 145–154. [Google Scholar] [CrossRef]
- Heras-Roger, J.; Pomposo-Medina, M.; Díaz-Romero, C.; Darias-Martín, J. Copigmentation colour and antioxidant activity of single cultivar red wines. Eur. Food Res. Technol. 2014, 239, 13–19. [Google Scholar] [CrossRef]
- Hosu, A.; Cristea, V.M.; Cimpoiu, C. Analysis of total phenolic, flavonoids, anthocyanins and tannins content in Romanian red wines: Prediction of antioxidant activities and classification of wines using artificial neural networks. Food Chem. 2014, 150, 113–118. [Google Scholar] [CrossRef]
- Kennedy, J.A. Grape and wine phenolics: Observations and recent findings. Cienc. Investig. Agrar. 2008, 35, 107–120. [Google Scholar] [CrossRef]
- Ali, K.; Maltese, F.; Toepfer, R.; Choi, Y.H.; Verpoorte, R. Metabolic characterization of Palatinate German white wines according to sensory attributes, varieties, and vintages using NMR spectroscopy and multivariate data analyses. J. Biomol. NMR 2011, 49, 255–266. [Google Scholar] [CrossRef] [Green Version]
- Guebaila, H.A.; Chira, K.; Richard, T.; Mabrouk, T.; Furiga, A.; Vitrac, X.; Monti, J.P.; Delaunay, J.C.; Merillon, J.M. Hopeaphenol: The first resveratrol tetramer in wines from North Africa. J. Agric. Food Chem. 2006, 54, 9559–9564. [Google Scholar] [CrossRef]
- García-Puente Rivas, E.; Alcalde-Eon, C.; Santos-Buelga, C.; Rivas-Gonzalo, J.C.; Escribano-Bailón, M.T. Behaviour and characterisation of the colour during red wine making and maturation. Anal. Chim. Acta 2006, 563, 215–222. [Google Scholar] [CrossRef]
- Monagas, M.; Martín-Álvarez, P.J.; Bartolomé, B.; Gómez-Cordovés, C. Statistical interpretation of the colour parameters of red wines in function of their phenolic composition during aging in bottle. Eur. Food Res. Technol. 2006, 222, 702–709. [Google Scholar] [CrossRef]
- Parpinello, G.P.; Versari, A.; Chinnici, F.; Galassi, S. Relationship among sensory descriptors, consumer preference and color parameters of Italian Novello red wines. Food Res. Int. 2009, 42, 1389–1395. [Google Scholar] [CrossRef]
- Pozo-Bayon, M.A.; Hernandez, M.T.; Martin-Alvarez, P.J.; Polo, M.C. Study of low molecular weight phenolic compounds during the aging of sparkling wines manufactured with red and white grape varieties. J. Agric. Food Chem. 2003, 51, 2089–2095. [Google Scholar] [CrossRef] [PubMed]
- García-Lomillo, J.; González-SanJosé, M.L. Applications of wine pomace in the food industry: Approaches and functions. Compr. Rev. Food Sci. Food Saf. 2017, 16, 3–22. [Google Scholar] [CrossRef] [PubMed]
- Balbinoti, T.C.V.; Stafussa, A.P.; Haminiuk, C.W.I.; Maciel, G.M.; Sassaki, G.L.; Jorge, L.M.D.M.; Jorge, R.M.M. Addition of grape pomace in the hydration step of parboiling increases the antioxidant properties of rice. Int. J. Food Sci. Technol. 2020, 55, 2370–2380. [Google Scholar] [CrossRef]
- Pavlisová, H. Zpracování Odpadů Vznikajících při Výrobě Vína a Části Rostlin Révy Vinné. Bachelor’s Thesis, Mendel University in Brno, Brno, Czech Republic, 2015. [Google Scholar]
- Iuga, M.; Mironeasa, S. Potential of grape byproducts as functional ingredients in baked goods and pasta. Compr. Rev. Food Sci. Food Saf. 2020, 19, 2473–2505. [Google Scholar] [CrossRef] [PubMed]
- De Iseppi, A.; Lomolino, G.; Marangon, M.; Curioni, A. Curent and future strategies for wine yeast lees valorization. Food Res. Int. 2020, 137, 109352. [Google Scholar] [CrossRef]
- Steidl, R.; Schödl, H.; Sedlo, J. Sklepní Hospodářství, 2nd ed.; Národní Vinařské Centrum: Valtice, Czech Republic, 2010; 309p, ISBN 978-80-903201-9-2. [Google Scholar]
- Cho, Y.-J.; Kim, D.-H.; Jeong, D.; Seo, K.H.; Jeong, H.S.; Lee, H.G.; Kim, H. Characterization of yeasts isolated from kefir as a probiotic and its synergic interaction with the wine byproduct grape seed flour/extract. LWT 2018, 90, 535–539. [Google Scholar] [CrossRef]
- Cassino, C.; Tsolakis, C.; Bonello, F.; Gianotti, V.; Osella, D. Wine evolution during bottle aging, studied by 1H NMR spectroscopy and multivariete statistical analysis. Food Res. Int. 2019, 116, 566–577. [Google Scholar] [CrossRef]
- Marais, J.; Pool, H. Effects of storage time and temperature on the volatile composition and quality of dry white table wines. Vitis 1980, 19, 151–164. [Google Scholar]
- Angelone, T.; Pasqua, T.; Di Majo, D.; Quintieri, A.M.; Filice, E.; Amodio, N.; Tota, B.; Giammanco, M.; Cerra, M.C. Distinct signalling mechanisms are involved in the dissimilar myocardial and coronary effects elicited by quercetin and myricetin, two red wine flavonols. Nutr. Metab. Cardiovasc. Dis. 2011, 21, 362–371. [Google Scholar] [CrossRef] [PubMed]
Figure 1.
Oenological parameters and biologically active substances. TPA: total phenolic acid; SO2: total sulfur dioxide; EtOH: actual alcohol; TA: titratable acid. TCA: trans-caffeic acid; TPCA: trans-p-coumaric acid.
Figure 1.
Oenological parameters and biologically active substances. TPA: total phenolic acid; SO2: total sulfur dioxide; EtOH: actual alcohol; TA: titratable acid. TCA: trans-caffeic acid; TPCA: trans-p-coumaric acid.

Figure 2.
Visual processing of the Pearson correlation of the tested parameters. Visual processing of the Pearson correlation of the tested parameters is shown in Figure 2. Positive correlations are shown in blue, while negative correlations are shown in red. The following applies to the size of circular objects—the larger the object, the higher the correlation.

Figure 3.
PCA plot of the parameters tested.

Figure 4.
PCA plot of the wines tested.


Table 1.
Samples’ description, harvest 2015.
| Samples | Variety | Sugar Content * |
|---|---|---|
| Sample A | Grüner Veltliner | medium dry (4–12 g/L) |
| Sample B | Kerner | sweet (more than 45 g/L) |
| Sample C | Pálava | medium sweet (less than 45 g/L) |
| Sample D | Grüner Veltliner | dry (0–4 g/L) |
| Sample E | Pinot Noir—claret | medium dry (4–12 g/L) |
| Sample F | Pinot Noir—red | dry (0–4 g/L) |
| Sample G | Cabernet Sauvignon—rosé | medium sweet (less than 45 g/L) |
* Sugar content according to Regulation (EU) No. 2019/33.
Table 2.
Samples’ description, harvest 2016.
| Samples | Variety | Sugar Content * |
|---|---|---|
| Sample A | Sauvignon | dry (0–4 g/L) |
| Sample B | Chardonnay | medium dry (4–12 g/L) |
| Sample C | Pálava | medium sweet (less than 45 g/L) |
| Sample D | Cabernet Sauvignon rosé | medium sweet (less than 45 g/L) |
| Sample E | Pinot Noir | dry (0–4 g/L) |
| Sample F | Pinot Noir | sweet (more than 45 g/L) |
* Sugar content according to Regulation (EU) No. 2019/33.
Table 3.
Statistical evaluation of oenological parameters and biologically active substances.
| Variable\Test | Levene | Bartlett |
|---|---|---|
| TPA | 0.0026 | 0.6799 |
| SO2 | 0.3522 | 0.7200 |
| pH | 0.6371 | 0.8782 |
| EtOH | 0.8078 | 0.9595 |
| TA | 0.0092 | 0.1950 |
| Gallic acid | <0.0001 | <0.0001 |
| Trans-caffeic acid | 0.3030 | 0.0933 |
| Trans-p-coumaric acid | 0.0026 | 0.0022 |
| Rutin | <0.0001 | <0.0001 |
| Ferulic acid | 0.4494 | 0.5289 |
| Myricetin | <0.0001 | <0.0001 |
| Resveratrol | <0.0001 | <0.0001 |
| Quercetin | <0.0001 | <0.0001 |
Table 4.
Information in wine production of samples.
| Samples | Variety, Sugar Content | Description |
|---|---|---|
| A | Grüner Veltliner—medium dry | 34,500 kg of harvested grapes, 24,830 L of finished wine. The potential of usable waste generated in wine production is around 28% at maximum yield. |
| B | Kerner—sweet | 21,780 kg of harvested grapes, 15,230 L of finished wine. The potential of usable waste generated in wine production is around 30% at maximum yield. |
| C | Pálava—medium sweet | 17,400 kg of harvested grapes, 12,300 L of finished wine. The potential of usable waste generated in wine production is around 29.5% at maximum yield. |
| D | Grüner Veltliner—dry | 17,500 kg of harvested grapes, 12,300 L of finished wine. The potential of usable waste generated in wine production is around 30% at maximum yield. |
| E | Pinot Noir—claret, medium dry | 17,500 kg of harvested grapes, 12,000 L of finished wine. The potential of usable waste generated in wine production is around 31.5% at maximum yield. |
| F | Pinot Noir—red, dry | 12,500 kg of harvested grapes, 8000 L of finished wine. The potential of usable waste generated in wine production is around 36% at maximum yield. |
| G | Cabernet Sauvignon rosé—medium sweet | 17,000 kg of harvested grapes, 12,000 L of finished wine. The potential of usable waste generated in wine production is around 29.5% at maximum yield. |
Table 5.
Overview of the processed amount of grape pomace.
| Samples | The Amount of Grapes (kg) | The Amount of Wine (L) | Production Losses (%) |
|---|---|---|---|
| A | 34,500 | 24,830 | 28 |
| B | 21,780 | 15,230 | 30 |
| C | 17,400 | 12,300 | 29.5 |
| D | 17,500 | 12,300 | 30 |
| E | 17,500 | 12,000 | 31.5 |
| F | 12,500 | 8000 | 36 |
| G | 17,000 | 12,000 | 29.5 |
Table 6.
Basic oenological parameters. Biologically active substances. Sauvignon. Basic oenological parameters. Sample A—Sauvignon, wine harvest 2016.
Table 6.
Basic oenological parameters. Biologically active substances. Sauvignon. Basic oenological parameters. Sample A—Sauvignon, wine harvest 2016.
| Analytes | TPA mg·g−1 | SO2 mg/L | pH | EtOH % | TA g/L |
|---|---|---|---|---|---|
| Zero measurement | 0.2 | 76.61 | 3.18 | 12.28 | 1.21 |
| 9 months climatic chamber | 0.19 | 99.07 | 3.2 | 11.65 | 1.26 |
| 9 months room temperature | 0.22 | 89.86 | 3.24 | 11.93 | 1.24 |
| 14 months climatic chamber | 0.27 | 98 | 3.3 | 12.07 | 1.2 |
| 14 months room temperature | 0.27 | 96 | 3.3 | 12.04 | 1.16 |
TPA: total phenolic acid; SO2: total sulfur dioxide; EtOH: actual alcohol; TA: titratable acid.
Table 7.
Basic oenological parameters. Biologically active substances. Chardonnay. Basic oenological parameters. Sample B—Chardonnay, harvest 2016.
Table 7.
Basic oenological parameters. Biologically active substances. Chardonnay. Basic oenological parameters. Sample B—Chardonnay, harvest 2016.
| Analytes | TPA mg·g−1 | SO2 mg/L | pH | EtOH % | TA g/L |
|---|---|---|---|---|---|
| Zero measurement | 0.21 | 95.05 | 3.19 | 13.03 | 1.25 |
| 9 months climatic chamber | 0.22 | 99.07 | 3.11 | 12.66 | 1.26 |
| 9 months room temperature | 0.21 | 94.46 | 3.24 | 12.54 | 1.26 |
| 14 months climatic chamber | 0.27 | 109 | 3.3 | 12.85 | 1.23 |
| 14 months room temperature | 0.27 | 108 | 3.3 | 12.83 | 1.20 |
TPA: total phenolic acid; SO2: total sulfur dioxide; EtOH: actual alcohol; TA: titratable acid.
Table 8.
Basic oenological parameters. Biologically active substances. Pálava. Basic oenological parameters. Sample C—Pálava, harvest 2016.
Table 8.
Basic oenological parameters. Biologically active substances. Pálava. Basic oenological parameters. Sample C—Pálava, harvest 2016.
| Analytes | TPA mg·g−1 | SO2 mg/L | pH | EtOH % | TA g/L |
|---|---|---|---|---|---|
| Zero measurement | 0.2 | 103.1 | 3.26 | 11.87 | 1.28 |
| 9 months climatic chamber | 0.2 | 115.78 | 3.27 | 11.47 | 1.3 |
| 9 months room temperature | 0.2 | 110.02 | 3.33 | 11.49 | 1.28 |
| 14 months climatic chamber | 0.28 | 122 | 3.38 | 11.51 | 1.27 |
| 14 months room temperature | 0.28 | 114 | 3.38 | 11.53 | 1.26 |
TPA: total phenolic acid; SO2: total sulfur dioxide; EtOH: actual alcohol; TA: titratable acid.
Table 9.
Basic oenological parameters. Biologically active substances. Cabernet Sauvignon rosé. Basic oenological parameters. Sample D—Cabernet Sauvignon rosé, harvest 2016.
Table 9.
Basic oenological parameters. Biologically active substances. Cabernet Sauvignon rosé. Basic oenological parameters. Sample D—Cabernet Sauvignon rosé, harvest 2016.
| Analytes | TPA mg·g−1 | SO2 mg/L | pH | EtOH % | TA g/L |
|---|---|---|---|---|---|
| Zero measurement | 0.21 | 99.65 | 3.07 | 12.5 | 1.51 |
| 9 months climatic chamber | 0.23 | 112.32 | 3.1 | 12.11 | 1.53 |
| 9 months room temperature | 0.22 | 100.8 | 3.15 | 12.19 | 1.54 |
| 14 months climatic chamber | 0.29 | 129 | 3.2 | 12.21 | 1.44 |
| 14 months room temperature | 0.29 | 123 | 3.2 | 12.2 | 1.39 |
TPA: total phenolic acid; SO2: total sulfur dioxide; EtOH: actual alcohol; TA: titratable acid.
Table 10.
Basic oenological parameters. Biologically active substances. Pinot Noir dry. Basic oenological parameters. Sample E—Pinot noir dry, harvest 2016.
Table 10.
Basic oenological parameters. Biologically active substances. Pinot Noir dry. Basic oenological parameters. Sample E—Pinot noir dry, harvest 2016.
| Analytes | TPA mg·g−1 | SO2 mg/L | pH | EtOH % | TA g/L |
|---|---|---|---|---|---|
| Zero measurement | 0.14 | 57.6 | 3.66 | 12.94 | 0.95 |
| 9 months climatic chamber | 0.14 | 57.6 | 3.64 | 12.51 | 0.98 |
| 9 months room temperature | 0.17 | 35.71 | 3.69 | 12.56 | 0.96 |
| 14 months climatic chamber | 0.14 | 67 | 3.72 | 12.88 | 1.03 |
| 14 months room temperature | 0.14 | 59 | 3.72 | 12.87 | 0.94 |
TPA: total phenolic acid; SO2: total sulfur dioxide; EtOH: actual alcohol; TA: titratable acid.
Table 11.
Basic oenological parameters. Biologically active substances. Pinot noir sweet. Basic oenological parameters. Sample F—Pinot noir sweet, harvest 2016.
Table 11.
Basic oenological parameters. Biologically active substances. Pinot noir sweet. Basic oenological parameters. Sample F—Pinot noir sweet, harvest 2016.
| Analytes | TPA mg·g−1 | SO2 mg/L | pH | EtOH % | TA g/L |
|---|---|---|---|---|---|
| Zero measurement | 0.2 | 108.29 | 3.23 | 12.24 | 1.37 |
| 9 months climatic chamber | 0.21 | 118.08 | 3.24 | 11.83 | 1.34 |
| 9 months room temperature | 0.19 | 108.29 | 3.29 | 11.93 | 1.34 |
| 14 months climatic chamber | 0.27 | 136 | 3.34 | 12 | 1.27 |
| 14 months room temperature | 0.26 | 135 | 3.34 | 11.98 | 1.25 |
TPA: total phenolic acid; SO2: total sulfur dioxide; EtOH: actual alcohol; TA: titratable acid.
Table 12.
Biologically active substances. Sample A—Sauvignon, wine harvest 2016.
| Analytes | Gallic Acid mg/L | TCA mg/L | TPCA mg/L | Rutin mg/L | Ferulic Acid mg/L | Myricetin mg/L | Resveratrol mg/L | Quercetin mg/L |
|---|---|---|---|---|---|---|---|---|
| Zero measurement | 7.83 | 5.08 | 4.42 | * | 0.69 | |||
| 9 months climatic chamber | 7.84 | 4.64 | 7.71 | 0.61 | ||||
| 9 months room temperature | 7.92 | 6.78 | 7.86 | 0.31 | ||||
| 14 months climatic chamber | 7.84 | 5.6 | 5.03 | 0.33 | ||||
| 14 months room temperature | 7.99 | 6.94 | 6.71 | 0.55 |
TCA: trans-caffeic acid; TPCA: trans-p-coumaric acid. * Under detection limit.
Table 13.
Biologically active substances. Sample B—Chardonnay, harvest 2016.
| Analytes | Gallic Acid mg/L | TCA mg/L | TPCA mg/L | Rutin mg/L | Ferulic Acid mg/L | Myricetin mg/L | Resveratrol mg/L | Quercetin mg/L |
|---|---|---|---|---|---|---|---|---|
| Zero measurement | 2.78 | 3.17 | 0.32 | * | 0.51 | |||
| 9 months climatic chamber | 2.94 | 2.00 | 3.18 | 0.8 | ||||
| 9 months room temperature | 2.74 | 5.17 | 0.73 | 0.43 | ||||
| 14 months climatic chamber | 2.91 | 1.8 | 4.83 | 0.5 | ||||
| 14 months room temperature | 2.96 | 4.029 | 1.39 | 0.4 |
TCA: trans-caffeic acid; TPCA: trans-p-coumaric acid. * Under detection limit.
Table 14.
Biologically active substances. Sample C—Pálava, harvest 2016.
| Analytes | Gallic Acid mg/L | TCA mg/L | TPCA mg/L | Rutin mg/L | Ferulic Acid mg/L | Myricetin mg/L | Resveratrol mg/L | Quercetin mg/L |
|---|---|---|---|---|---|---|---|---|
| Zero measurement | 9.4 | 6.34 | 4.34 | 0.96 | 0.29 | * | ||
| 9 months climatic chamber | 9.65 | 8.02 | 4.17 | 0.97 | 0.4 | |||
| 9 months room temperature | 8.18 | 5.07 | 1.1 | 0.96 | 0.58 | |||
| 14 months climatic chamber | 10.41 | 5.85 | 2.04 | 0.96 | 0.25 | |||
| 14 months room temperature | 8.67 | 3.96 | 5.31 | 0.94 | 0.43 |
TCA: trans-caffeic acid; TPCA: trans-p-coumaric acid. * Under detection limit.
Table 15.
Biologically active substances. Sample D—Cabernet Sauvignon rosé, harvest 2016.
| Analytes | Gallic Acid mg/L | TCA mg/L | TPCA mg/L | Rutin mg/L | Ferulic Acid mg/L | Myricetin mg/L | Resveratrol mg/L | Quercetin mg/L |
|---|---|---|---|---|---|---|---|---|
| Zero measurement | 0.48 | 1.59 | 2.12 | 0.47 | 0.11 | * | ||
| 9 months climatic chamber | 0.58 | 1.98 | 2.55 | 0.49 | 0.02 | |||
| 9 months room temperature | 0.41 | 1.52 | 0.16 | 0.44 | 0.15 | |||
| 14 months climatic chamber | 0.53 | 1.44 | 1.97 | 0.47 | 0.08 | |||
| 14 months room temperature | 0.52 | 1.62 | 1.52 | 0.45 | 0.06 |
TCA: trans-caffeic acid; TPCA: trans-p-coumaric acid. * Under detection limit.
Table 16.
Biologically active substances. Sample F—Pinot noir sweet, harvest 2016.
| Analytes | Gallic Acid mg/L | TCA mg/L | TPCA mg/L | Rutin mg/L | Ferulic Acid mg/L | Myricetin mg/L | Resveratrol mg/L | Quercetin mg/L |
|---|---|---|---|---|---|---|---|---|
| Zero measurement | 98.77 | 5.87 | 0.04 | 4.99 | 0.32 | 0.02 | 0.03 | * |
| 9 months climatic chamber | 98.81 | 3.56 | 1.54 | 2.63 | 0.52 | 0.05 | 0.03 | |
| 9 months room temperature | 98.79 | 3.62 | 2.21 | 3.98 | 0.27 | 0.03 | 0.03 | |
| 14 months climatic chamber | 98.77 | 3.65 | 0.09 | 3.42 | 0.37 | 0.04 | 0.04 | |
| 14 months room temperature | 98.81 | 4.24 | 0.08 | 5.03 | 0.66 | 0.04 | 0.01 |
TCA: trans-caffeic acid; TPCA: trans-p-coumaric acid. * Under detection limit.
Table 17.
Biologically active substances. Sample E—Pinot noir dry, harvest 2016.
| Analytes | Gallic Acid mg/L | TCA mg/L | TPCA mg/L | Rutin mg/L | Ferulic Acid mg/L | Myricetin mg/L | Resveratrol mg/L | Quercetin mg/L |
|---|---|---|---|---|---|---|---|---|
| Zero measurement | 75.69 | 4.22 | 0.14 | 6.25 | 0.4 | 0.32 | 0.54 | 0.09 |
| 9 months climatic chamber | 75.84 | 3.2 | 0.04 | 5.17 | 0.57 | 0.17 | 0.59 | 0.12 |
| 9 months room temperature | 75.67 | 3.53 | 0.06 | 7.02 | 0.76 | 0.19 | 0.78 | 0.12 |
| 14 months climatic chamber | 75.74 | 1.92 | 0.2 | 5.37 | 0.77 | 0.16 | 0.63 | 0.11 |
| 14 months room temperature | 75.79 | 3.76 | 0 | 3.84 | 0.61 | 0.32 | 0.68 | 0.11 |
TCA: trans-caffeic acid; TPCA: trans-p-coumaric acid.
Publisher’s Note: MDPI stays neutral with regard to jurisdictional claims in published maps and institutional affiliations. |
© 2021 by the authors. Licensee MDPI, Basel, Switzerland. This article is an open access article distributed under the terms and conditions of the Creative Commons Attribution (CC BY) license (https://creativecommons.org/licenses/by/4.0/).
Share and Cite
MDPI and ACS Style
Javorský, J.; Král, M.; Šnirc, M.; Árvay, J.; Tremlová, B.; Dordević, D. Characterization of Moravian Wines by Selected Chemical Parameters. Separations 2021, 8, 89. https://0-doi-org.brum.beds.ac.uk/10.3390/separations8070089
AMA Style
Javorský J, Král M, Šnirc M, Árvay J, Tremlová B, Dordević D. Characterization of Moravian Wines by Selected Chemical Parameters. Separations. 2021; 8(7):89. https://0-doi-org.brum.beds.ac.uk/10.3390/separations8070089
Chicago/Turabian StyleJavorský, Jan, Martin Král, Marek Šnirc, Július Árvay, Bohuslava Tremlová, and Dani Dordević. 2021. "Characterization of Moravian Wines by Selected Chemical Parameters" Separations 8, no. 7: 89. https://0-doi-org.brum.beds.ac.uk/10.3390/separations8070089
Note that from the first issue of 2016, this journal uses article numbers instead of page numbers. See further details here.