
Formation of Humic-Like Substances during the Technological Process of Lignohumate® Synthesis as a Function of Time

 , ,
, ,
Abstract
:
1. Introduction
2. Materials and Methods
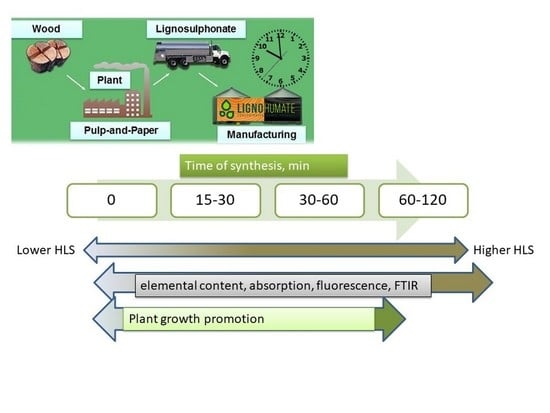
2.1. Technological Process and Sampling
2.2. Chemical Analyses
2.3. UV-Vis Absorption and Fluorescence
2.4. FTIR Spectra
2.5. Plant Growth Bioassay
2.6. Statistical Analysis
3. Results
3.1. Composition of HLS: Elemental Content and Functional Groups
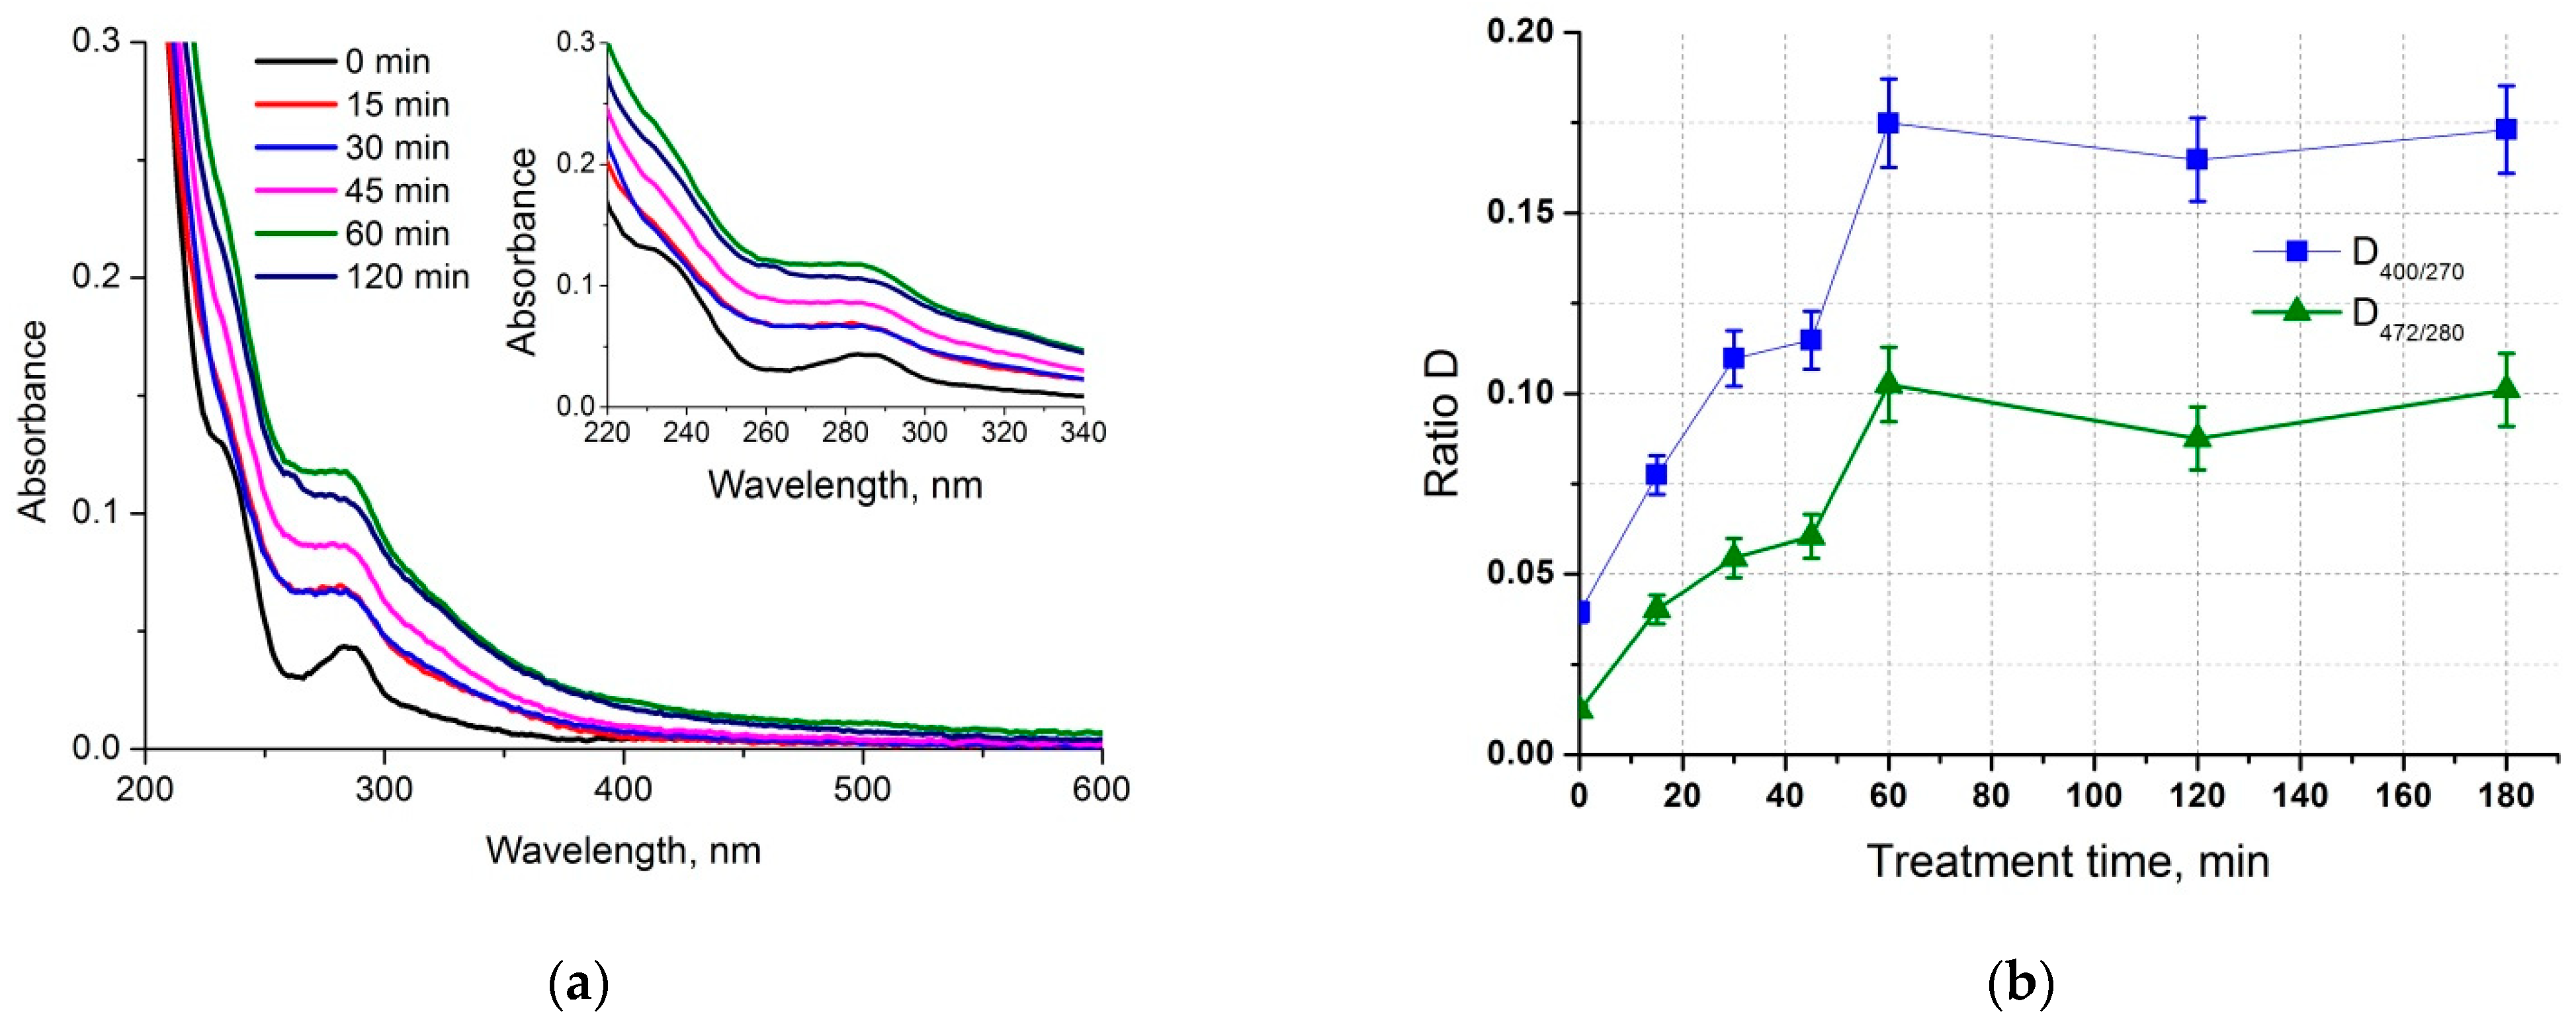
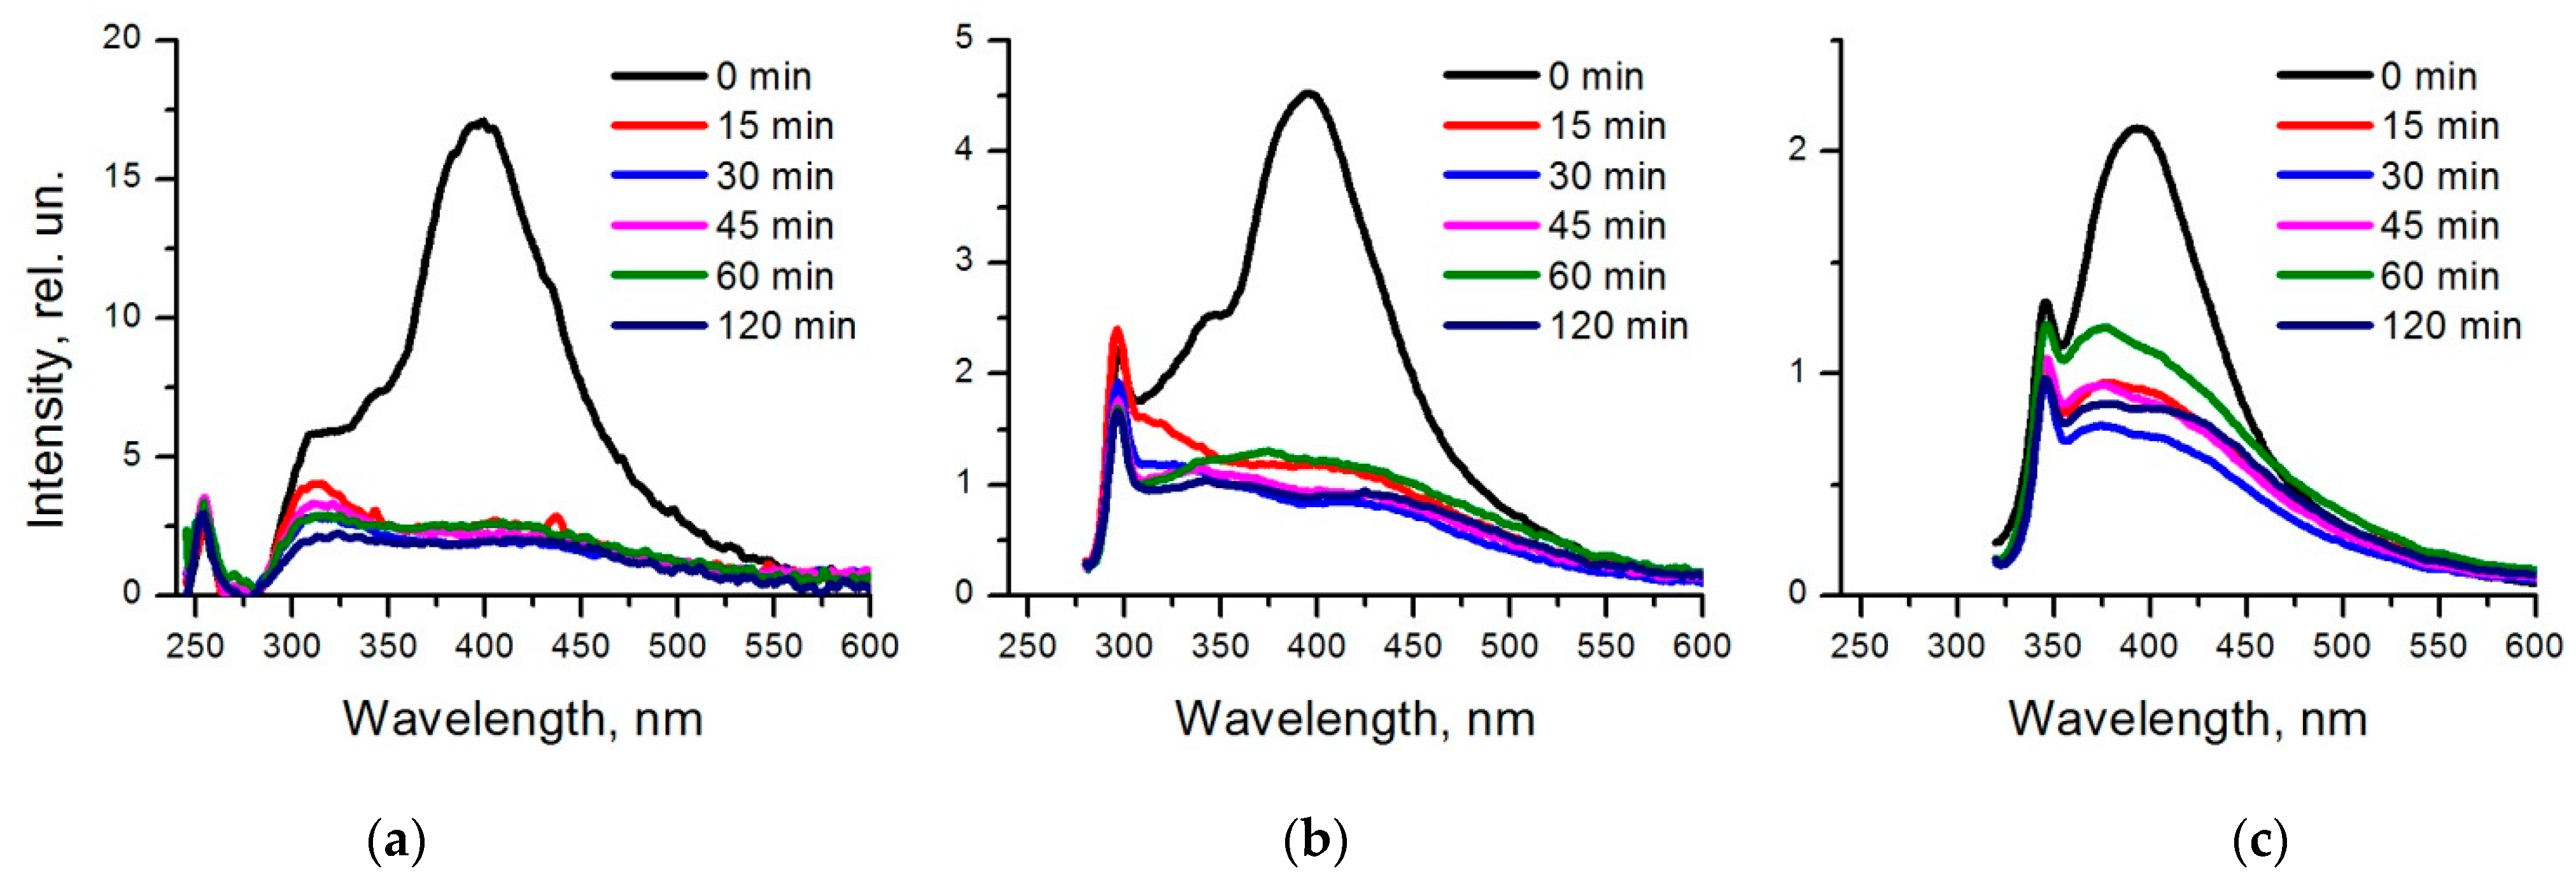
3.2. UV-Vis Absorption and Fluorescence
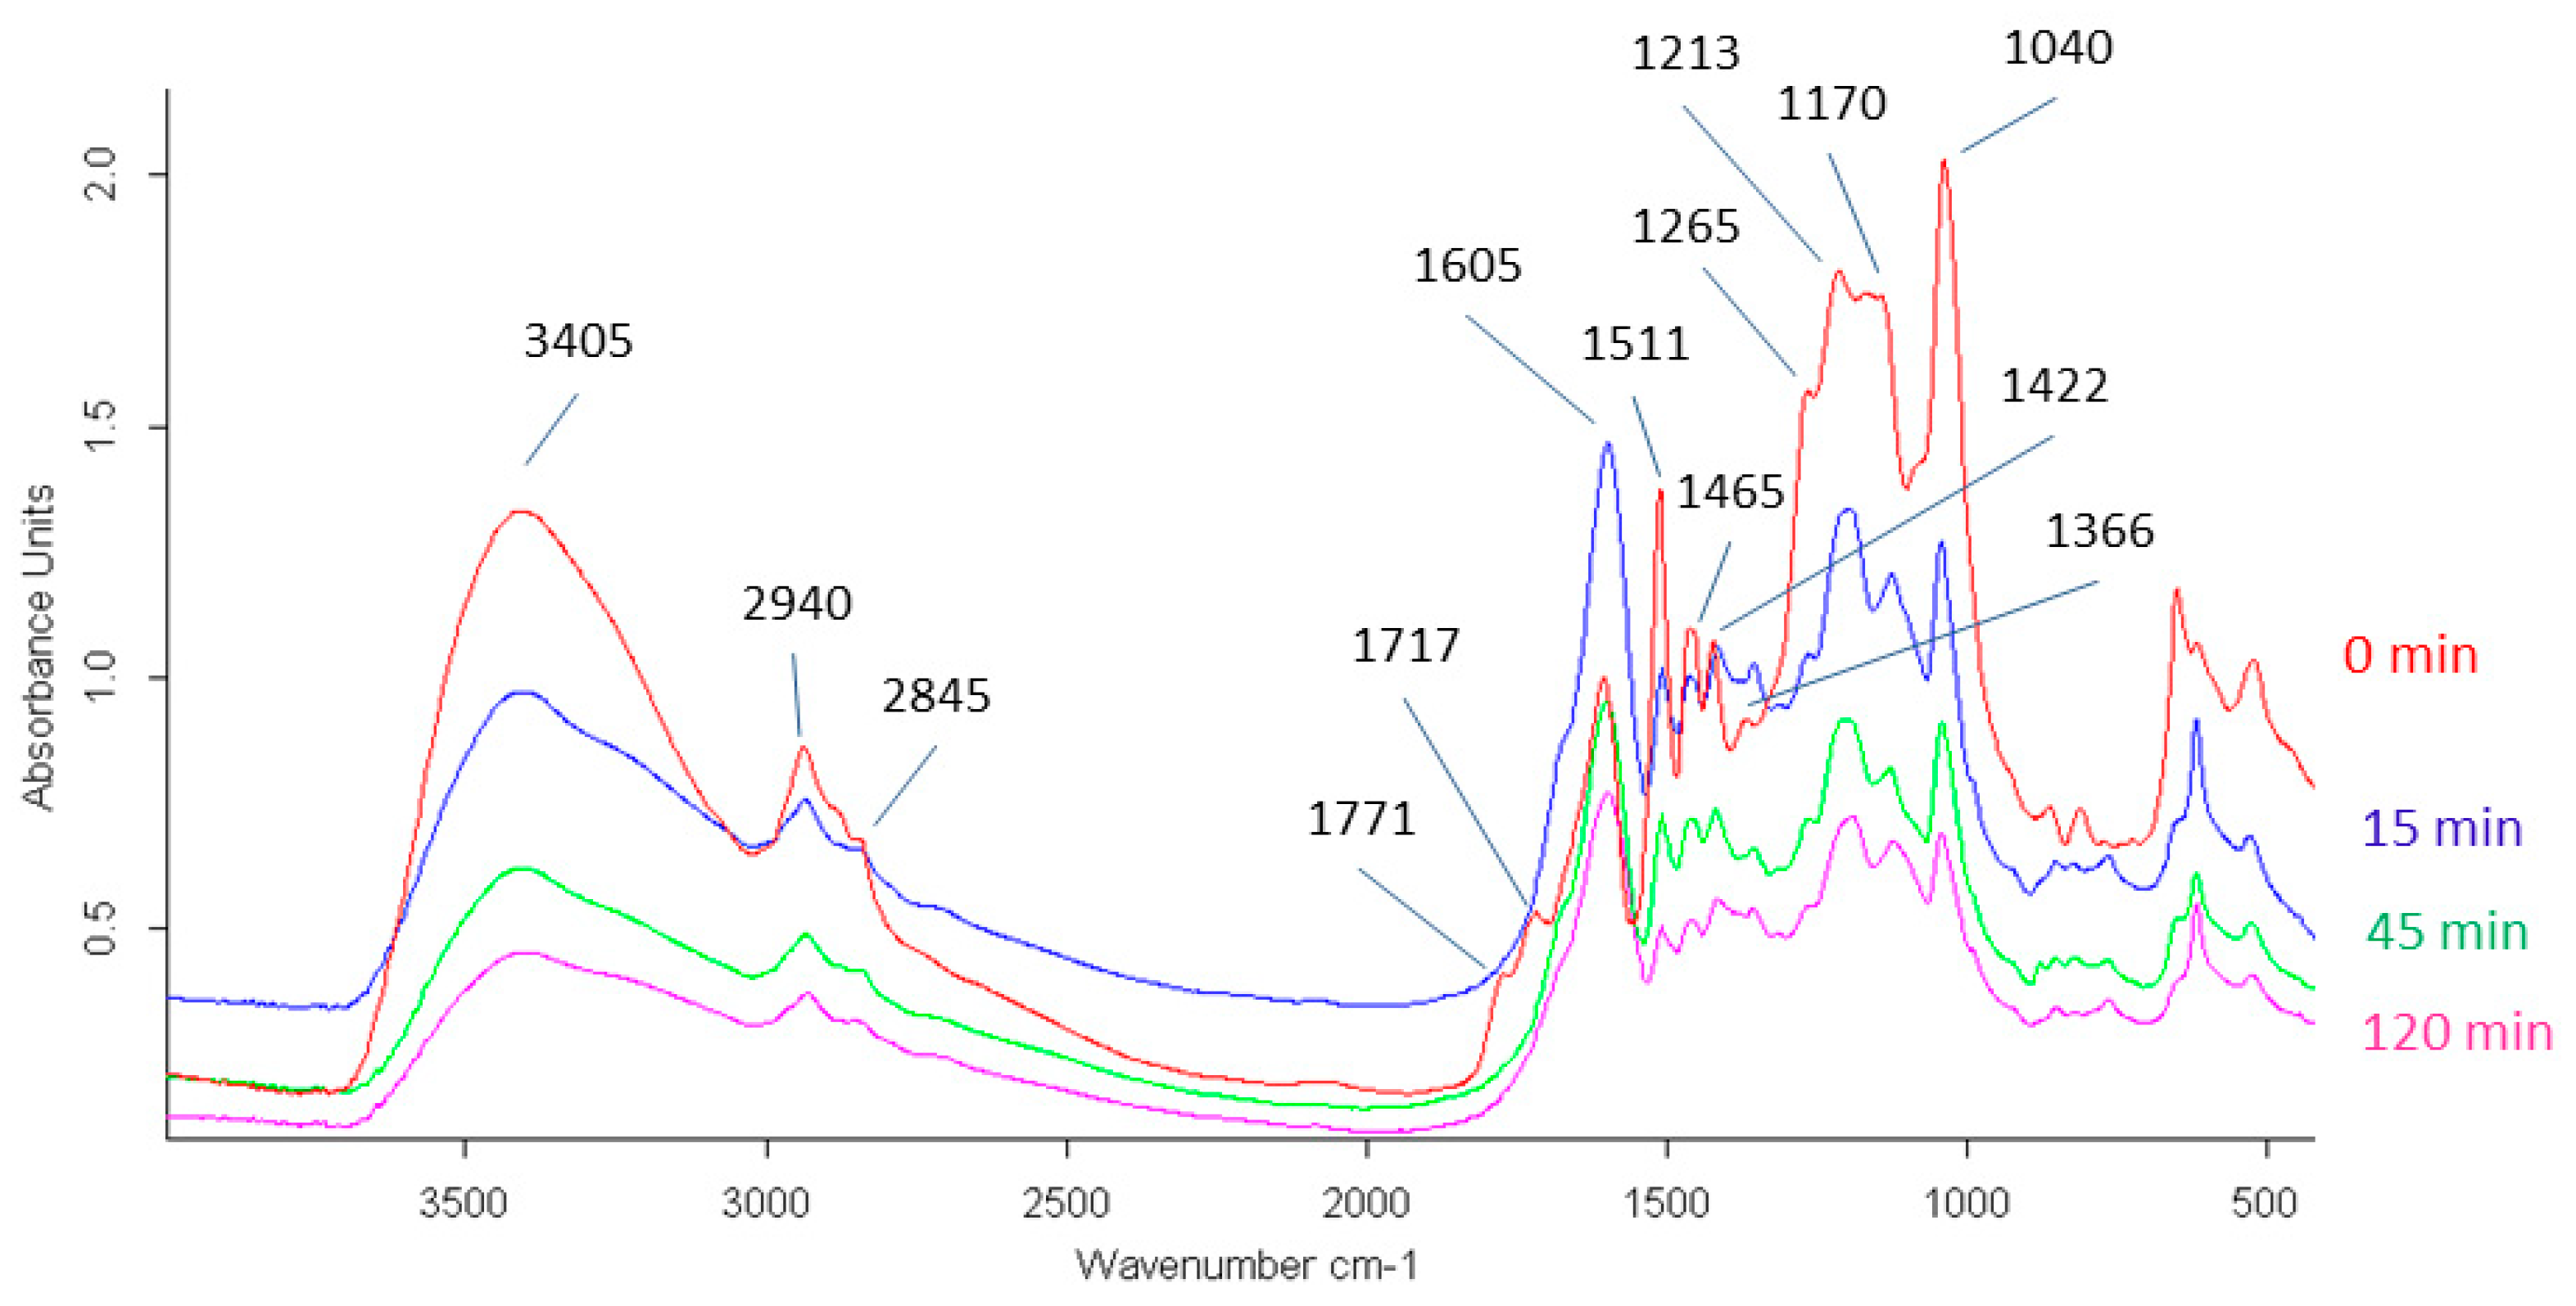
3.3. FTIR-Spectra
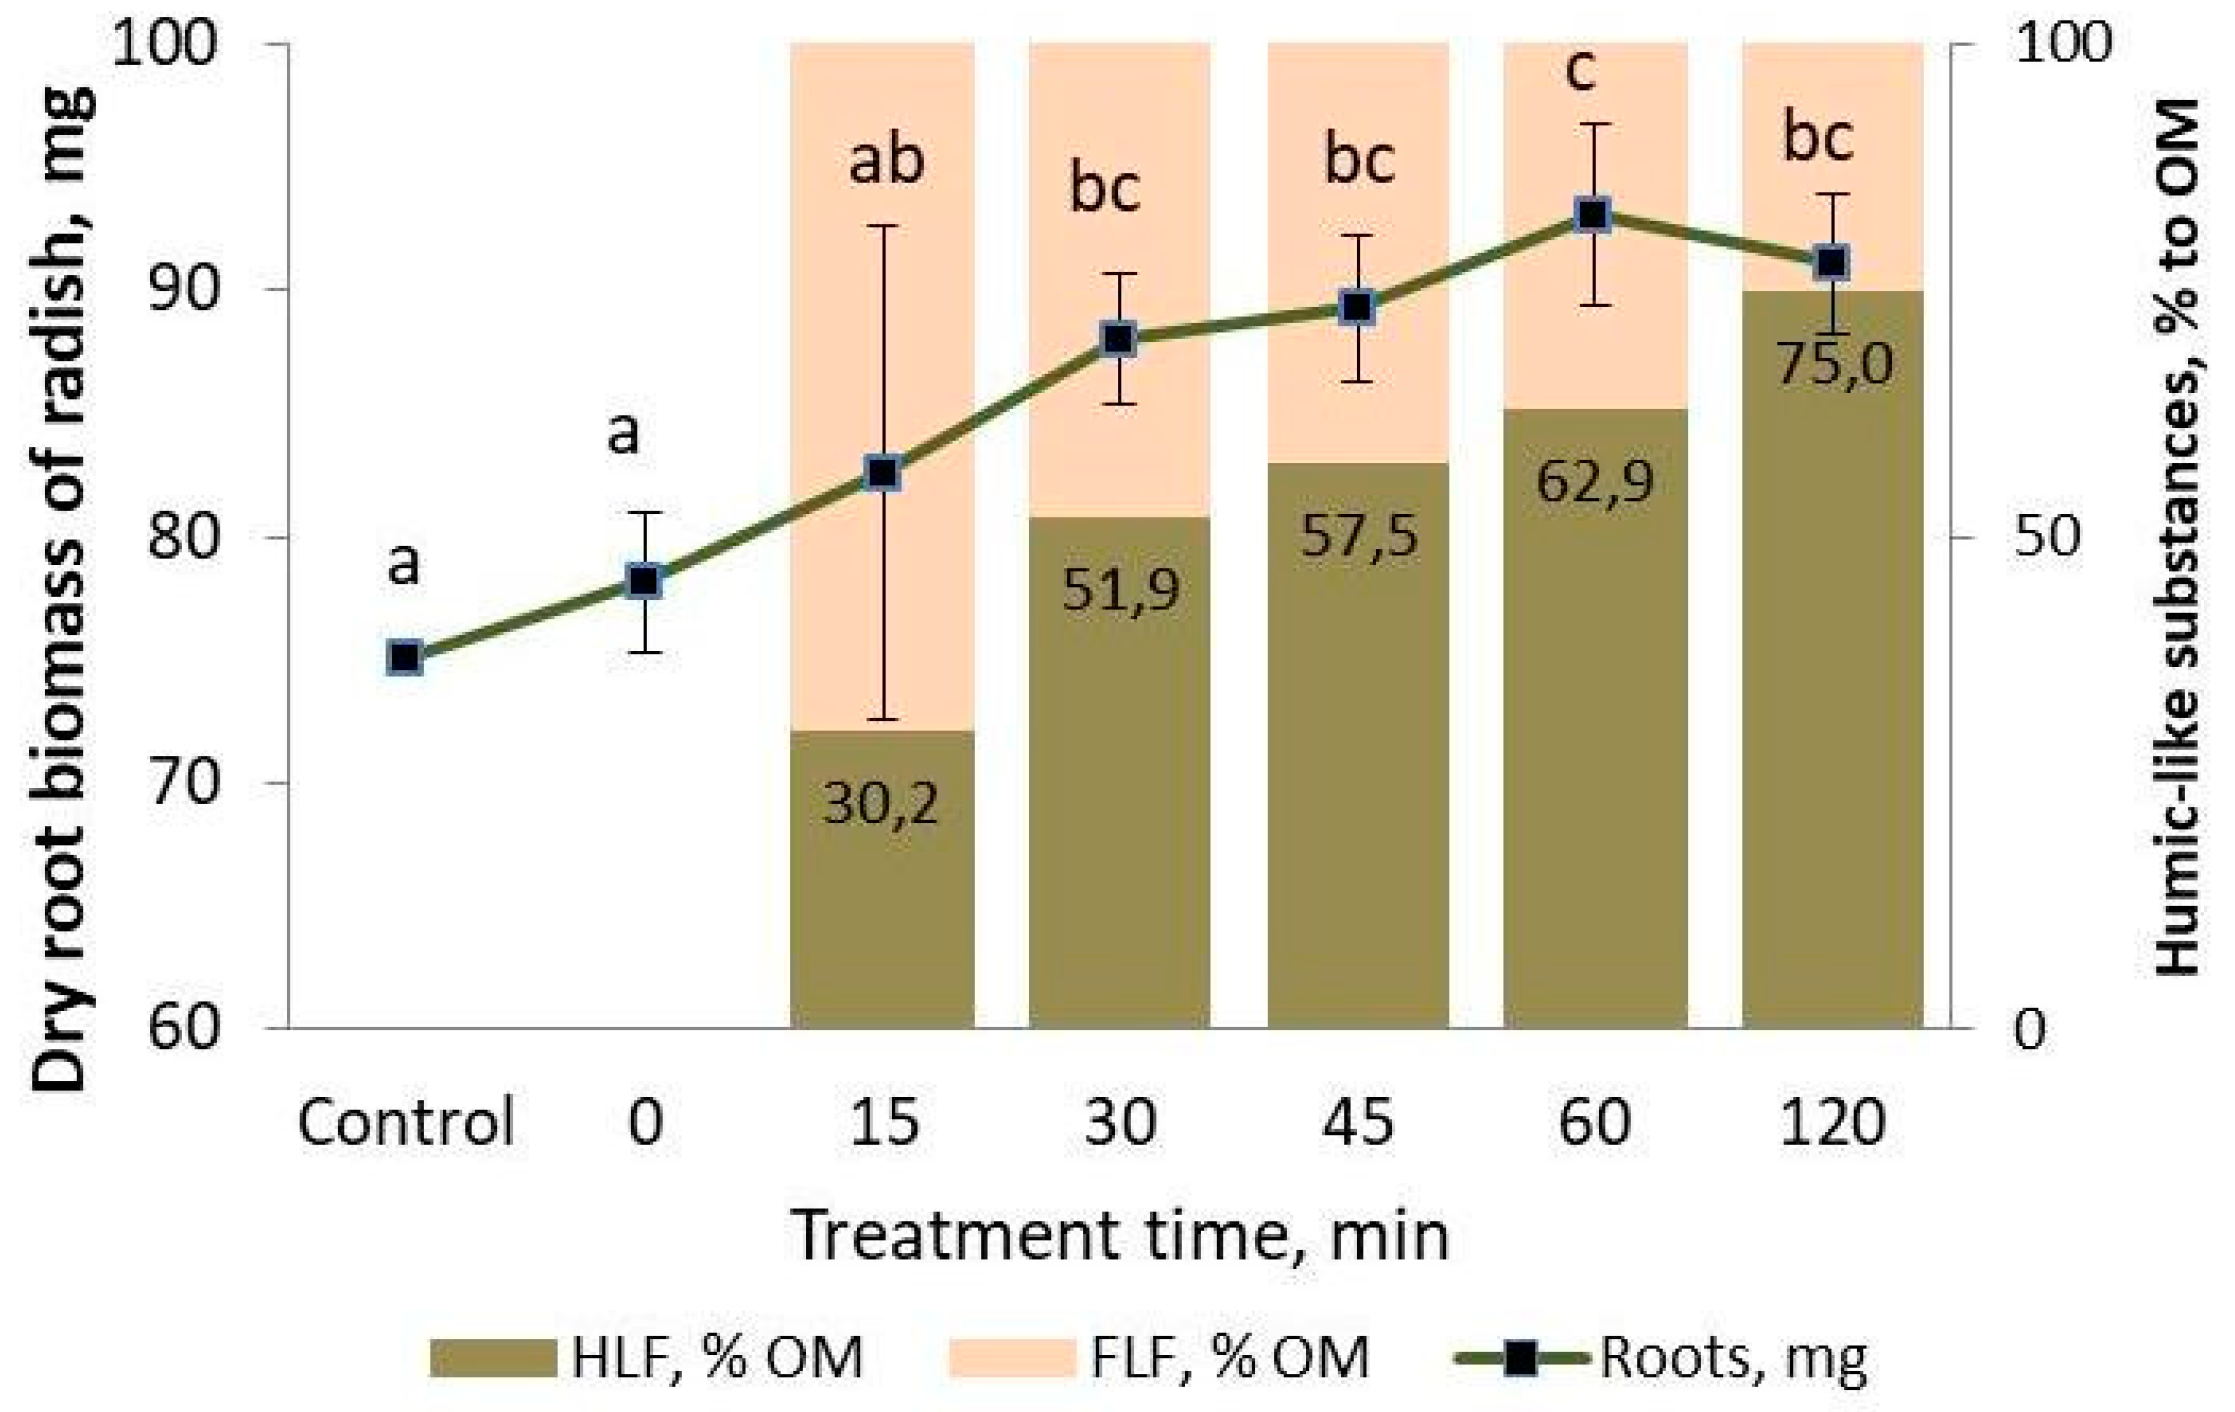
3.4. Bioassay
4. Discussion
4.1. Overview of Results
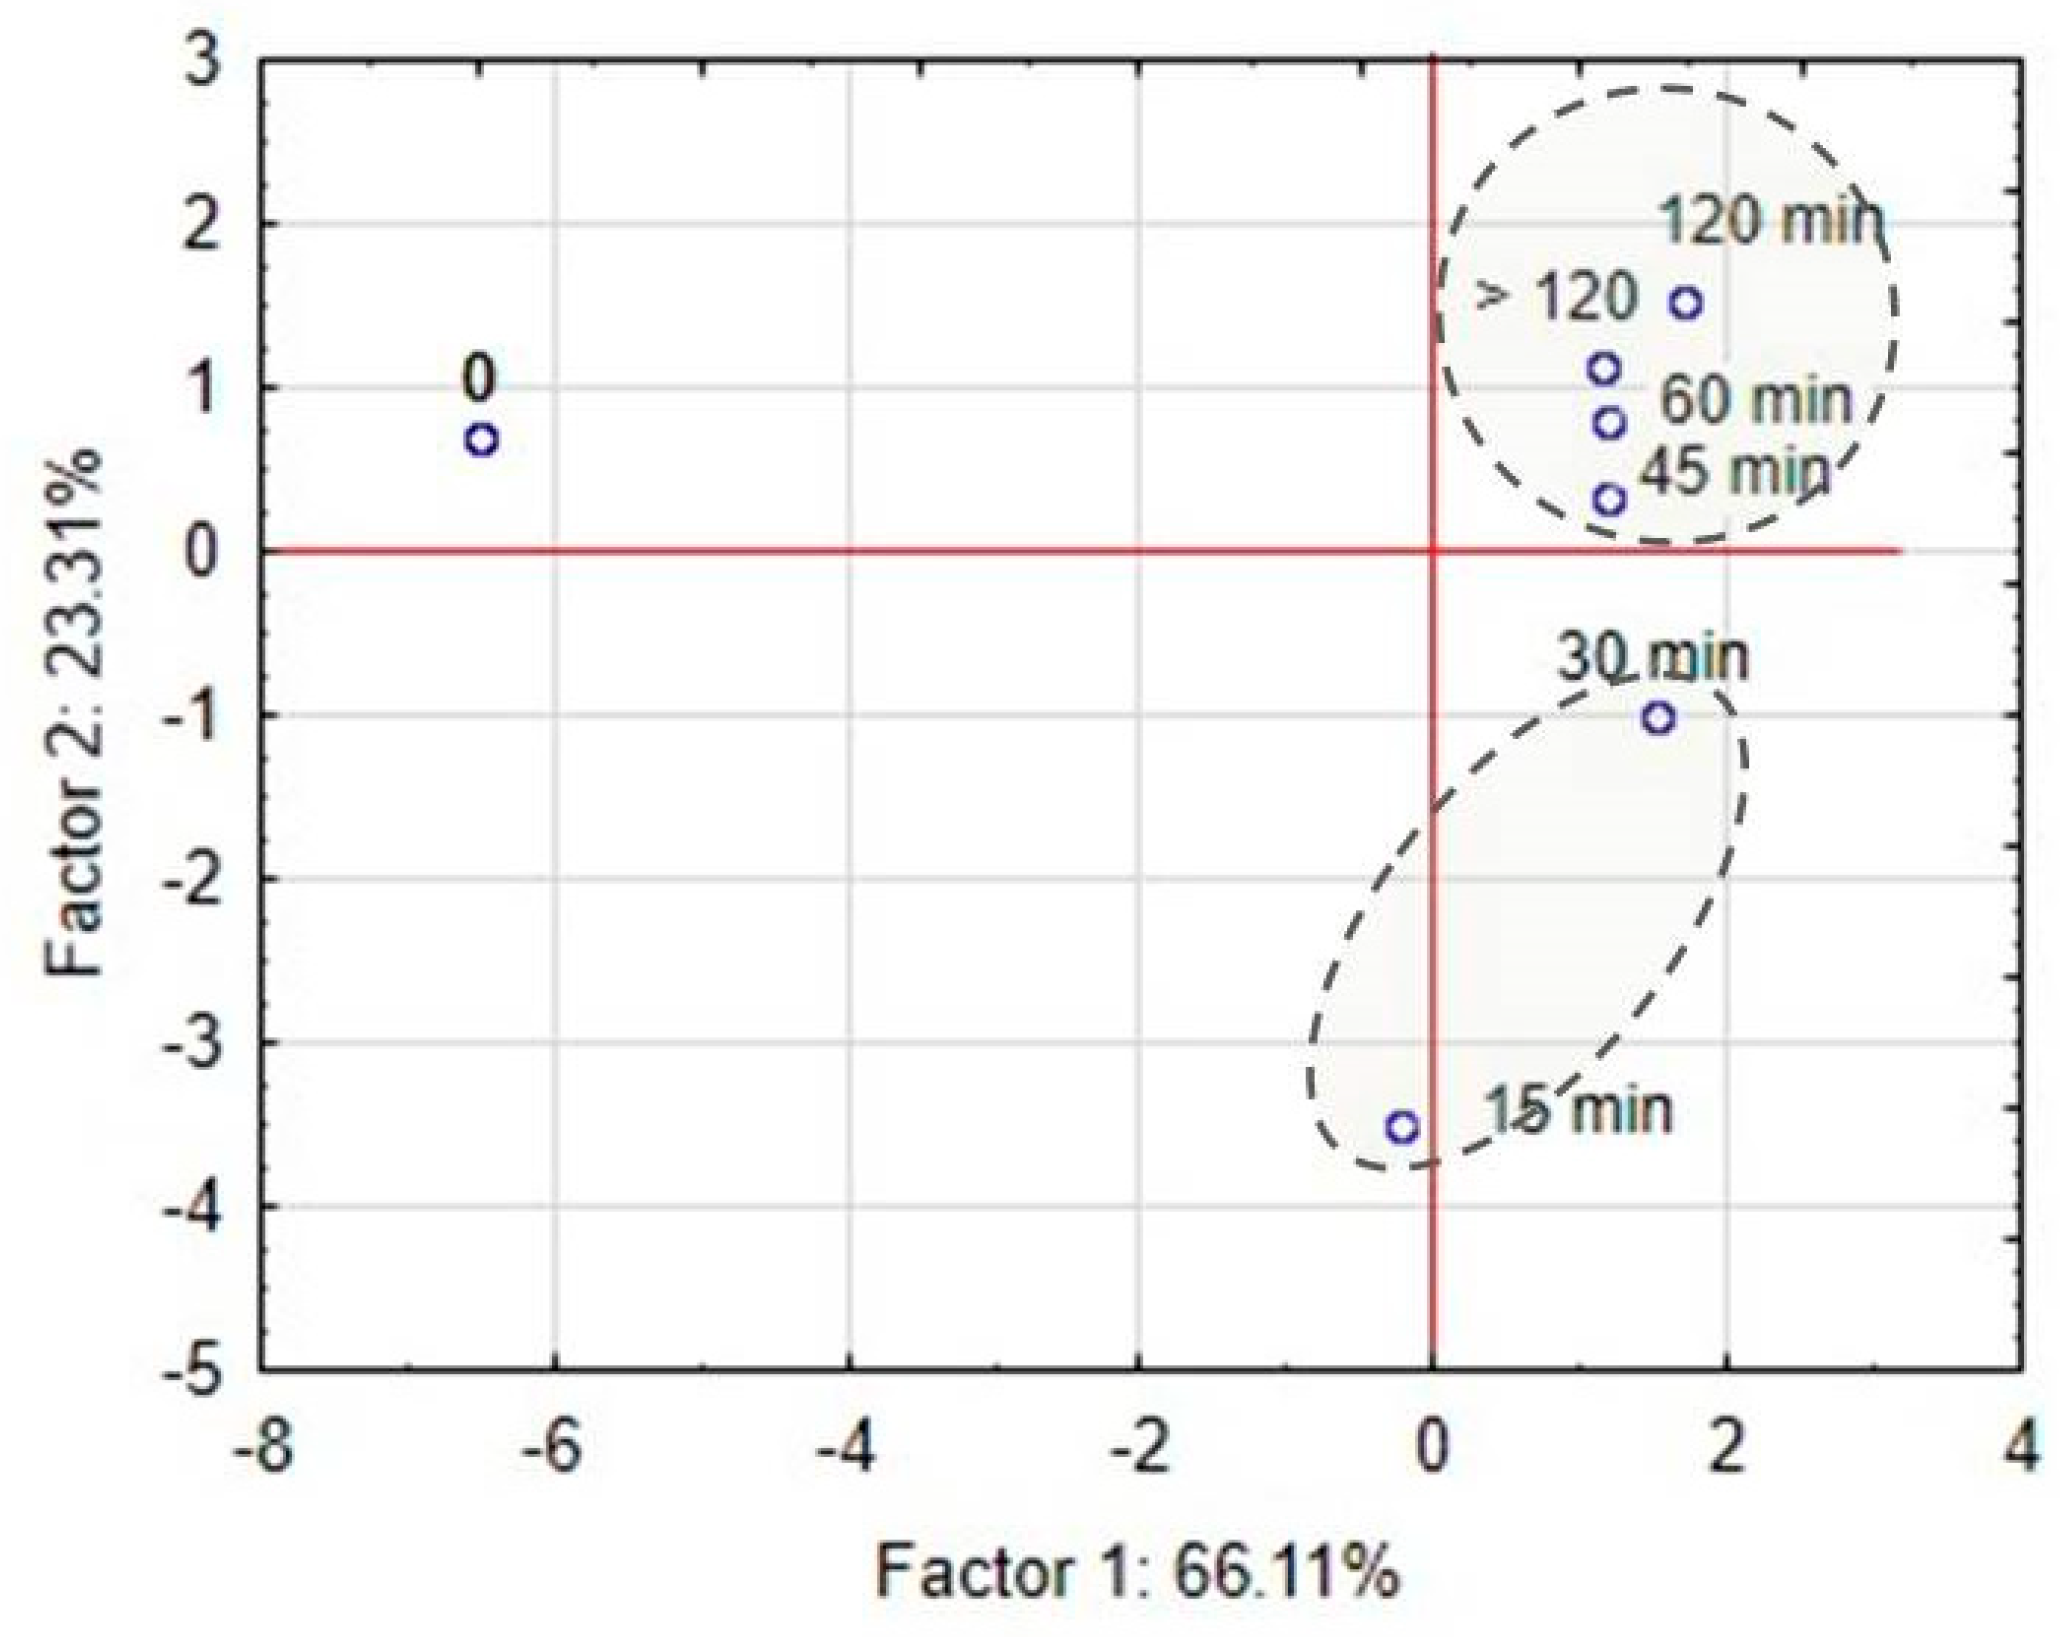
4.2. Identification of Differences in LH Originated HLS Using Principal Component Analysis
5. Conclusions
Author Contributions
Funding
Institutional Review Board Statement
Informed Consent Statement
Acknowledgments
Conflicts of Interest
References
- Olk, D.C.; Dinnes, D.L.; Scoresby, J.R.; Callaway, C.R.; Darlington, J.W. Humic products in agriculture: Potential benefits and research challenges-a review. J. Soils Sediments 2018, 18, 2881–2891. [Google Scholar] [CrossRef]
- Conselvan, G.B.; Pizzeghello, D.; Francioso, O.; Di Foggia, M.; Nardi, S.; Carletti, P. Biostimulant activity of humic substances extracted from leonardites. Plant Soil 2017, 420, 119–134. [Google Scholar] [CrossRef]
- Pukalchik, M.; Panova, M.; Karpukhin, M.; Yakimenko, O.; Kydralieva, K.; Terekhova, V. Using humic products as amendments to restore Zn and Pb polluted soil: A case study using rapid screening phytotest endpoint. J. Soils Sediments 2018, 18, 750–761. [Google Scholar] [CrossRef]
- Pukalchik, M.; Kydralieva, K.; Yakimenko, O.; Fedoseeva, E.; Terekhova, V. Outlining the potential role of humic products in modifying biological properties of the soil-a review. Front. Environ. Sci. 2019, 7, 80. [Google Scholar] [CrossRef]
- Jindo, K.; Olivares, F.L.; da Paixão Malcher, D.J.; Sánchez-Monedero, M.A.; Kempenaar, C.; Canellas, L.P. From lab to field: Role of humic substances under open-field and greenhouse conditions as biostimulant and biocontrol agent. Front. Plant Sci. 2020, 11, 426. [Google Scholar] [CrossRef] [PubMed]
- Kulikova, N.A.; Volikov, A.B.; Filippova, O.I.; Kholodov, V.A.; Yaroslavtseva, N.V.; Farkhodov, Y.R.; Yudina, A.V.; Roznyatovsky, V.A.; Grishin, Y.K.; Zhilkibayev, O.T. Modified humic substances as soil conditioners: Laboratory and field trials. Agronomy 2021, 11, 150. [Google Scholar] [CrossRef]
- Calvo, P.; Nelson, L.; Kloepper, J.W. Agricultural uses of plant biostimulants. Plant Soil 2014, 383, 3–41. [Google Scholar] [CrossRef] [Green Version]
- Canellas, L.P.; Olivares, F.L.; Aguiar, N.O.; Jones, D.L.; Nebbioso, A.; Mazzei, P.; Piccolo, A. Humic and fulvic acids as biostimulants in horticulture. Sci. Hortic. 2015, 196, 15–27. [Google Scholar] [CrossRef]
- Ertani, A.; Francioso, O.; Tugnoli, V.; Righi, V.; Nardi, S. Effect of commercial lignosulfonate-humate on Zea mays L. metabolism. J. Agric. Food Chem. 2011, 59, 11940–11948. [Google Scholar] [CrossRef]
- Laurichesse, S.; Averous, L. Chemical modification of lignins: Towards biobased polymers. Prog. Polym. Sci. 2014, 39, 1266–1290. [Google Scholar] [CrossRef]
- Savy, D.; Canellas, L.; Vinci, G.; Cozzolino, V.; Piccolo, A. Humic-like water-soluble lignins from giant reed (Arundo donax L.) display hormone-like activity on plant growth. J. Plant Growth Regul. 2017, 36, 995–1001. [Google Scholar] [CrossRef]
- Gargulak, J.D.; Lebo, S.E. Commercial use of lignin-based materials. Lignin Hist. Biol. Mater. Perspect. 2000, 742, 304–320. [Google Scholar] [CrossRef]
- Yakimenko, O.S.; Terekhova, V.A. Humic preparations and the assessment of their biological activity for certification purposes. Eurasian Soil Sci. 2011, 44, 1222–1230. [Google Scholar] [CrossRef]
- Rose, M.T.; Patti, A.F.; Little, K.R.; Brown, A.L.; Jackson, W.R.; Cavagnaro, T.R. A Meta-analysis and review of plant-growth response to humic substances: Practical implications for agriculture. Adv. Agron. 2014, 124, 37–89. [Google Scholar] [CrossRef]
- Ertani, A.; Nardi, S.; Francioso, O.; Pizzeghello, D.; Tinti, A.; Schiavon, M. Metabolite-targeted analysis and physiological traits of Zea mays L. in response to application of a leonardite-humate and lignosulfonate-based products for their evaluation as potential biostimulants. Agronomy 2019, 9, 445. [Google Scholar] [CrossRef] [Green Version]
- Popa, V.I. Lignin in Biological Systems. Polym. Biomater. Struct. Funct. 2013, 1, 709–737. [Google Scholar] [CrossRef]
- Almas, A.R.; Afanou, A.K.; Krogstad, T. Impact of lignosulfonate on solution chemistry and phospholipid fatty acid composition in soils. Pedosphere 2014, 24, 308–321. [Google Scholar] [CrossRef]
- Savy, D.; Cozzolino, V.; Drosos, M.; Mazzei, P.; Piccolo, A. Replacing calcium with ammonium counterion in lignosulfonates from paper mills affects their molecular properties and bioactivity. Sci. Total Environ. 2018, 645, 411–418. [Google Scholar] [CrossRef] [PubMed]
- Abdullah, W.; Tan, N.P.; Low, L.Y.; Loh, J.Y.; Wee, C.Y.; Taib, A.Z.M.; Ong-Abdullah, J.; Lai, K.S. Calcium lignosulfonate improves proliferation of recalcitrant indica rice callus via modulation of auxin biosynthesis and enhancement of nutrient absorption. Plant Physiol. Biochem. 2021, 161, 141–152. [Google Scholar] [CrossRef]
- Ikkonen, E.; Chazhengina, S.; Jurkevich, M. Photosynthetic nutrient and water use efficiency of Cucumis sativus under contrasting soil nutrient and lignosulfonate levels. Plants 2021, 10, 340. [Google Scholar] [CrossRef]
- Lamar, R.T.; Olk, D.C.; Mayhew, L.; Bloom, P.R. A new standardized method for quantification of humic and fulvic acids in humic ores and commercial products. J. Aoac Int. 2014, 97, 721–730. [Google Scholar] [CrossRef]
- Karpukhina, E.; Mikheev, I.; Perminova, I.; Volkov, D.; Proskurnin, M. Rapid quantification of humic components in concentrated humate fertilizer solutions by FTIR spectroscopy. J. Soils Sediments 2019, 19, 2729–2739. [Google Scholar] [CrossRef]
- Matsushita, Y. Conversion of technical lignins to functional materials with retained polymeric properties. J. Wood Sci. 2015, 61, 230–250. [Google Scholar] [CrossRef] [Green Version]
- Savy, D.; Mazzei, P.; Nebbioso, A.; Drosos, M.; Nuzzo, A.; Cozzolino, V.; Spaccini, R.; Piccolo, A. Molecular properties and functions of humic substances and humic-like substances (HULIS) from biomass and their transformation products. In Analytical Techniques and Methods for Biomass; Springer: Berlin, Germany, 2016; pp. 85–114. [Google Scholar]
- Wang, W.; Hou, Y.; Huang, W.; Liu, X.; Wen, P.; Wang, Y.; Yu, Z.; Zhou, S. Alkali lignin and sodium lignosulfonate additives promote the formation of humic substances during paper mill sludge composting. Bioresour. Technol. 2021, 320, 124361. [Google Scholar] [CrossRef] [PubMed]
- Poloskin, R.B.; Polyakov, Y.U.; Gladkov, O.A.; Sokolova, I.V.; Sorokin, N.I.; Glebov, A.V.; Polyakov, Y.J.; Sorokin, N. Humic acid salts preparation involves high-temperature treatment of an aqueous suspension of raw vegetable material in a continuous process. U.S. Patent 7198805-B2, 3 April 2021. [Google Scholar]
- Katahira, R.; Mittal, A.; McKinney, K.; Chen, X.W.; Tucker, M.P.; Johnson, D.K.; Beckham, G.T. Base-catalyzed depolymerization of biorefinery lignins. ACS Sustain. Chem. Eng. 2016, 4, 1474–1486. [Google Scholar] [CrossRef]
- Lyu, G.J.; Yoo, C.G.; Pan, X.J. Alkaline oxidative cracking for effective depolymerization of biorefining lignin to mono-aromatic compounds and organic acids with molecular oxygen. Biomass Bioenergy 2018, 108, 7–14. [Google Scholar] [CrossRef]
- Novak, F.; Sestauberova, M.; Hrabal, R. Structural features of lignohumic acids. J. Mol. Struct. 2015, 1093, 179–185. [Google Scholar] [CrossRef]
- Abdelaziz, O.Y.; Meier, S.; Prothmann, J.; Turner, C.; Riisager, A.; Hulteberg, C.P. Oxidative depolymerisation of lignosulphonate lignin into low-molecular-weight products with Cu-Mn/delta-Al2O3. Top. Catal. 2019, 62, 639–648. [Google Scholar] [CrossRef] [Green Version]
- Pinto, P.C.R.; da Silva, E.A.B.; Rodrigues, A.E. Insights into oxidative conversion of lignin to high-added-value phenolic aldehydes. Ind. Eng. Chem. Res. 2011, 50, 741–748. [Google Scholar] [CrossRef]
- Santos, S.G.; Marques, A.P.; Lima, D.L.D.; Evtuguin, D.V.; Esteves, V.I. Kinetics of eucalypt lignosulfonate oxidation to aromatic aldehydes by oxygen in alkaline medium. Ind. Eng. Chem. Res. 2011, 50, 291–298. [Google Scholar] [CrossRef] [Green Version]
- Cui, P.; Fang, H.X.; Qian, C.; Cheng, M.H. Detection and identification of lignosulfonate depolymerization products using UPLC-QTOF-MS and a self-built database. Chromatographia 2020, 83, 87–93. [Google Scholar] [CrossRef]
- Pu, Y.Q.; Hu, F.; Huang, F.; Ragauskas, A.J. Lignin structural alterations in thermochemical pretreatments with limited delignification. Bioenergy Res. 2015, 8, 992–1003. [Google Scholar] [CrossRef]
- El Mansouri, N.E.; Farriol, X.; Salvado, J. Structural modification and characterization of lignosulfonate by a reaction in an alkaline medium for its incorporation into phenolic resins. J. Appl. Polym. Sci. 2006, 102, 3286–3292. [Google Scholar] [CrossRef]
- Guizani, C.; Lachenal, D. Controlling the molecular weight of lignosulfonates by an alkaline oxidative treatment at moderate temperatures and atmospheric pressure: A size-exclusion and reverse-phase chromatography study. Int. J. Mol. Sci. 2017, 18, 2520. [Google Scholar] [CrossRef] [Green Version]
- Schutyser, W.; Kruger, J.S.; Robinson, A.M.; Katahira, R.; Brandner, D.G.; Cleveland, N.S.; Mittal, A.; Peterson, D.J.; Meilan, R.; Roman-Leshkov, Y.; et al. Revisiting alkaline aerobic lignin oxidation. Green Chem. 2018, 20, 3828–3844. [Google Scholar] [CrossRef]
- Hladky, J.; Pospisilova, L.; Liptaj, T. Spectroscopic characterization of natural humic substances. J. Appl. Spectrosc. 2013, 80, 8–14. [Google Scholar] [CrossRef]
- Enev, V.; Pospisilova, L.; Klucakova, M.; Liptaj, T.; Doskocil, L. Spectral Characterization of Selected Humic Substances. Soil Water Res. 2014, 9, 9–17. [Google Scholar] [CrossRef] [Green Version]
- Jarosova, M.; Klejdus, B.; Kovacik, J.; Hedbavny, J. The impact of humic substances on oxidative stress and plant growth of spring barley exposed to NaCl. Mendelnet 2014, 2014, 463–468. [Google Scholar]
- Yakimenko, O.; Khundzhua, D.; Izosimov, A.; Yuzhakov, V.; Patsaeva, S. Source indicator of commercial humic products: UV-Vis and fluorescence proxies. J. Soils Sediments 2018, 18, 1279–1291. [Google Scholar] [CrossRef]
- Poloskin, R.; Gladkov, O.; Osipova, O.; Yakimenko, O. Comparable Evaluation of Biological Activity of New Liquid and Dry Modifications of the Humic Product “Lignohumate”. In Functions of Natural Organic Matter in Changing Environment; Springer: Berlin, Germany, 2013; pp. 1095–1099. [Google Scholar]
- Suada, I.K.; Suwastika, A.A.N.G.; Pradnyana, I.K.N.; Shchegolkova, N.; Poloskin, R.; Gladkov, O.; Yakimenko, O.; Stepanov, A. Application of Trichoderma spp. and Lignohumate to Suppress a Pathogen of Clubroot (Plasmodiophora Brassicae Wor.) and Promote Plant Growth of Cabbage. Int. J. Biosci. Biotechnol. 2019, 6, 79–94. [Google Scholar] [CrossRef]
- Pozdnyakov, L.A.; Stepanov, A.L.; Gasanov, M.E.; Semenov, M.V.; Yakimenko, O.S.; Suada, I.K.; Rai, I.N.; Shchegolkova, N.M. Effect of Lignohumate on Soil Biological Activity on the Bali Island, Indonesia. Eurasian Soil Sci. 2020, 53, 653–660. [Google Scholar] [CrossRef]
- Garcia, A.C.; de Castro, T.A.V.; Santos, L.A.; Tavares, O.C.H.; Castro, R.N.; Berbara, R.L.L.; Garcia-Mina, J.M. Structure-Property-Function Relationship of Humic Substances in Modulating the Root Growth of Plants: A Review. J. Environ. Qual. 2019, 48, 1622–1632. [Google Scholar] [CrossRef]
- Perminova, I.V.; Garcia-Mina, J.M.; Knicker, H.; Miano, T. Humic substances and nature-like technologies: Learning from nature: Understanding humic substances structures and interactions for the development of environmentally friendly, nature-like technologies. J. Soils Sediments 2019, 19, 2663–2664. [Google Scholar] [CrossRef] [Green Version]
- Savy, D.; Brostaux, Y.; Cozzolino, V.; Delaplace, P.; du Jardin, P.; Piccolo, A. Quantitative Structure-Activity Relationship of Humic-Like Biostimulants Derived From Agro-Industrial Byproducts and Energy Crops. Front. Plant Sci. 2020, 11, 581. [Google Scholar] [CrossRef] [PubMed]
- Du Jardin, P. Plant biostimulants: Definition, concept, main categories and regulation. Sci. Hortic. 2015, 196, 3–14. [Google Scholar] [CrossRef] [Green Version]
- De Pascale, S.; Rouphael, Y.; Colla, G. Plant biostimulants: Innovative tool for enhancing plant nutrition in organic farming. Eur. J. Hortic. Sci 2017, 82, 277–285. [Google Scholar] [CrossRef]
- Yakhin, O.I.; Lubyanov, A.A.; Yakhin, I.A.; Brown, P.H. Biostimulants in Plant Science: A Global Perspective. Front. Plant Sci. 2017, 7, 2049. [Google Scholar] [CrossRef] [Green Version]
- Swift, R.S. Organic matter characterization. Methods Soil Anal. 1996, 5, 1011–1069. [Google Scholar]
- Gosteva, O.Y.; Izosimov, A.A.; Patsaeva, S.V.; Yuzhakov, V.I.; Yakimenko, O.S. Fluorescence of Aqueous Solutions of Commercial Humic Products. J. Appl. Spectrosc. 2012, 78, 884–891. [Google Scholar] [CrossRef]
- Khundzhua, D.A.; Patsaeva, S.V.; Trubetskoj, O.A.; Trubetskaya, O.E. An Analysis of Dissolved Organic Matter from Freshwater Karelian Lakes Using Reversed-Phase High-Performance Liquid Chromatography with Online Absorbance and Fluorescence Analysis. Mosc. Univ. Phys. Bull. 2017, 72, 68–75. [Google Scholar] [CrossRef]
- Uyguner, C.S.; Bekbolet, M. Evaluation of humic acid photocatalytic degradation by UV-vis and fluorescence spectroscopy. Catal. Today 2005, 101, 267–274. [Google Scholar] [CrossRef]
- Domeizel, M.; Khalil, A.; Prudent, P. UV spectroscopy: A tool for monitoring humification and for proposing an index of the maturity of compost. Bioresour. Technol. 2004, 94, 177–184. [Google Scholar] [CrossRef]
- Albrecht, R.; Le Petit, J.; Terrom, G.; Perissol, C. Comparison between UV spectroscopy and NIRS to assess humification process during sewage sludge and green wastes co-composting. Bioresour. Technol. 2011, 102, 4495–4500. [Google Scholar] [CrossRef] [PubMed]
- Lipski, M.; Slawinski, J.; Zych, D. Changes in the luminescent properties of humic acids induced by UV radiation. J. Fluoresc. 1999, 9, 133–138. [Google Scholar] [CrossRef]
- Senesi, N.; D’Orazio, V.; Ricca, G. Humic acids in the first generation of EUROSOILS. Geoderma 2003, 116, 325–344. [Google Scholar] [CrossRef]
- Fuentes, M.; Baigorri, R.; Gonzalez-Gaitano, G.; Garcia-Mina, J.M. New methodology to assess the quantity and quality of humic substances in organic materials and commercial products for agriculture. J. Soils Sediments 2018, 18, 1389–1399. [Google Scholar] [CrossRef]
- Zherebker, A.; Kostyukevich, Y.; Kononikhin, A.; Kharybin, O.; Konstantinov, A.I.; Zaitsev, K.V.; Nikolaev, E.; Perminova, I.V. Enumeration of carboxyl groups carried on individual components of humic systems using deuteromethylation and Fourier transform mass spectrometry. Anal. Bioanal. Chem. 2017, 409, 2477–2488. [Google Scholar] [CrossRef]
- Stevenson, F.J. Humus Chemistry: Genesis, Composition, Reactions; John Wiley & Sons: Hoboken, NJ, USA, 1994. [Google Scholar]
- Tan, K.H. Humic Matter in Soil and the Environment: Principles and Controversies, 2nd ed.; CRC Press: Boca Raton, FL, USA, 2014; pp. 1–439. [Google Scholar] [CrossRef]


| % to DM | % to OM | w% Ash Free Basis | Total Acidity, meq g−1 | ||||||||
|---|---|---|---|---|---|---|---|---|---|---|---|
| Sample | pH | DM, % | Ash | OM | HLF | C | H | N | S | O | |
| LS | 5.21 | 42.9 | 22.1 | 77.9 | NA * | 55.5 | 7.3 | 0.9 | 9.6 | 26.7 | 1.048 |
| 15 min | 10.12 | 26.6 | 36.3 | 63.7 | 30.2 | 57.9 | 4.4 | 0.5 | 10.5 | 26.6 | 0.210 |
| 30 min | 9.18 | 26.4 | 39.1 | 60.9 | 51.9 | 60.0 | 4.5 | 0.7 | 12.1 | 22.8 | 0.293 |
| 45 min | 9.01 | 26.4 | 39.3 | 60.7 | 57.5 | 60.6 | 5.1 | 0.8 | 11.5 | 22.0 | 0.677 |
| 60 min | 8.69 | 25.9 | 36.9 | 63.1 | 62.9 | 57.2 | 5.1 | 0.8 | 9.3 | 27.6 | 0.612 |
| 120 min | 8.27 | 24.8 | 40.0 | 60.0 | 75.0 | 58.9 | 5.3 | 1.1 | 12.5 | 22.2 | 0.643 |
| >120 min | 8.09 | 21.7 | 37.7 | 62.3 | 71.2 | 57.3 | 5.1 | 0.9 | 11.9 | 24.7 | 0.650 |
| Variable | Factor 1 | Factor 2 |
|---|---|---|
| pH | 0.812 | −0.566 |
| DM, g L−1 | −0.960 | 0.038 |
| OM, % DM | −0.990 | 0.062 |
| HLF, % OM | 0.747 | 0.652 |
| S,% | 0.592 | 0.132 |
| H/C | −0.892 | 0.445 |
| O/C | −0.781 | −0.337 |
| C/N | 0.094 | −0.988 |
| Total acidity, meq g−1 | −0.627 | 0.746 |
| IF phen (λex 270) | −0.892 | −0.420 |
| IF hum (λex 270) | −0.987 | 0.137 |
| Absorbance D285 | 0.931 | 0.063 |
| Roots, mg | 0.826 | 0.468 |
| Eigenvalue | 8.59 | 3.03 |
| % Total variance | 66.11 | 23.31 |
| Cumulative % | 66.11 | 89.42 |
Publisher’s Note: MDPI stays neutral with regard to jurisdictional claims in published maps and institutional affiliations. |
© 2021 by the authors. Licensee MDPI, Basel, Switzerland. This article is an open access article distributed under the terms and conditions of the Creative Commons Attribution (CC BY) license (https://creativecommons.org/licenses/by/4.0/).
Share and Cite
Yakimenko, O.; Stepanov, A.; Patsaeva, S.; Khundzhua, D.; Osipova, O.; Gladkov, O. Formation of Humic-Like Substances during the Technological Process of Lignohumate® Synthesis as a Function of Time. Separations 2021, 8, 96. https://0-doi-org.brum.beds.ac.uk/10.3390/separations8070096
Yakimenko O, Stepanov A, Patsaeva S, Khundzhua D, Osipova O, Gladkov O. Formation of Humic-Like Substances during the Technological Process of Lignohumate® Synthesis as a Function of Time. Separations. 2021; 8(7):96. https://0-doi-org.brum.beds.ac.uk/10.3390/separations8070096
Chicago/Turabian StyleYakimenko, Olga, Andrey Stepanov, Svetlana Patsaeva, Daria Khundzhua, Olesya Osipova, and Oleg Gladkov. 2021. "Formation of Humic-Like Substances during the Technological Process of Lignohumate® Synthesis as a Function of Time" Separations 8, no. 7: 96. https://0-doi-org.brum.beds.ac.uk/10.3390/separations8070096