Article

Non-Targeted Chemical Characterization of JUUL Virginia Tobacco Flavored Aerosols Using Liquid and Gas Chromatography

Juul Labs, Inc., Washington, DC 20004, USA
*
Author to whom correspondence should be addressed.
Submission received: 13 July 2021 / Revised: 6 August 2021 / Accepted: 17 August 2021 / Published: 24 August 2021

Abstract

:
The chemical constituents of JUUL Virginia Tobacco pods with 3.0% and 5.0% nicotine by weight (VT3 and VT5) were characterized by non-targeted analyses, an approach to detect chemicals that are not otherwise measured with dedicated methods or that are not known beforehand. Aerosols were generated using intense and non-intense puffing regimens and analyzed by gas chromatography electron ionization mass spectrometry and liquid chromatography electrospray ionization high resolving power mass spectrometry. All compounds above 0.7 µg/g for GC–MS analysis or above 0.5 µg/g for LC–HRMS analysis and differing from blank measurements were identified and semi-quantified. All identifications were evaluated and categorized into five groups: flavorants, harmful and potentially harmful constituents, extractables and/or leachables, reaction products, and compounds that could not be identified/rationalized. For VT3, 79 compounds were identified using an intense puffing regimen and 69 using a non-intense puffing regimen. There were 60 compounds common between both regimens. For VT5, 85 compounds were identified with an intense puffing regimen and 73 with a non-intense puffing regimen; 67 compounds were in common. For all nicotine concentrations, formulations and puffing regimens, reaction products accounted for the greatest number of compounds (ranging from 70% to 75%; 0.08% to 0.1% by mass), and flavorants comprised the second largest number of compounds (ranging from for 15% to 16%; 0.1 to 0.2% by mass). A global comparison of the compounds detected in JUUL aerosol to those catalogued in cigarette smoke indicated an approximate 50-fold decrease in chemical complexity. Both VT3 and VT5 aerosols contained 59 unique compounds not identified in cigarette smoke.

1. Introduction

In light of the fact that combustible cigarette (CC) smoking is the number one cause of preventable death in the world [1], causing over 8 million deaths each year and comprising 30% of cancer-related deaths overall [2], numerous public health agencies have developed programs with the intent of both preventing smoking initiation and promoting smoking cessation [3,4]. Tobacco product regulations, such as the U.S. Food and Drug Administration (FDA) “Family Smoking Prevention and Tobacco Control Act”, were enacted to help protect public health by regulating the manufacturing, distribution, and marketing of tobacco products [5]. There are, however, many smokers who are not likely to quit in the near term [6]. With this in mind, in 2017, the FDA announced the Comprehensive Plan for Tobacco and Nicotine Regulation (“Comprehensive Plan”), which recognizes that nicotine is delivered on a continuum of risk and seeks to render cigarettes and other combustible tobacco products minimally or non-addictive through the creation of a very low nicotine cigarette product standard [7]. This continuum of risk places combustible cigarettes at the highest risk and nicotine replacement therapies at the lowest risk of the harm spectrum. This continuum of risk is based in large part on evidence that nicotine, while addictive, is not itself responsible for serious disease and death in cigarette smokers [8]. Rather, it is the combination of thousands of other chemical constituents present in the smoke of CCs [9].
The chemical composition of CC smoke has been well studied [10] and much is known about the harmfulness of smoking [1]. This is due partly to the length of time researchers have been studying smoking and its negative effects on the population [1]. A great deal of our current understanding of the harmfulness of smoking cigarettes is founded on an understanding of the compounds which are produced during the tobacco combustion process. Temperatures at the center of a burning cigarette range from 600 to 900 °C. In addition to combustion byproducts, the high temperatures involved in the production of mainstream smoke result in incomplete combustion, which causes thermal degradation of the tobacco plant materials, paper, and non-tobacco ingredients. Cigarette smoke is a highly complex mixture of >5000 constituents including carcinogenic, mutagenetic and respiratory toxicants [10,11]. Therefore, numerous public health organizations have developed lists of toxicants in the smoke of CCs [12,13,14]. The FDA’s established list in particular contains 93 harmful or potentially harmful constituents (HPHCs) recognized in tobacco products [14].
Byproducts of tobacco combustion are responsible for many of the toxicants present in cigarette smoke [11]. Electronic Nicotine Delivery System (ENDS) products are designed to operate below combustion temperatures, which may reduce the toxicant production when compared with CCs [9]. ENDS represent a fundamentally different approach to delivering nicotine versus CC [15] and may reduce the harm potential of nicotine-containing aerosols [16,17]. The e-liquid of ENDS products is compositionally different than a tobacco cigarette. Plant material and paper are not present nor combusted in an ENDS product. Therefore, many HPHCs present in mainstream smoke are either not present in ENDS product aerosols, or present at significantly lower levels than CC smoke, i.e., ammonia, aromatic amines, carbon monoxide, tobacco-specific nitrosamines, polycyclic aromatic hydrocarbons, and volatile organic compounds [15,16,18,19,20,21]. However, questions regarding the complexity of ENDS aerosols and the possible existence of unique constituents which pose potential harm apart from the known HPHCs of CCs remain [22,23].
Bentley and colleagues performed non-targeted analysis (NTA) of the IQOS heated tobacco product which showed that IQOS aerosol is much less complex than CC smoke [24]. The JUUL System, like IQOS, operates below combustion temperatures and, unlike IQOS, has no tobacco paper or plant material (excluding tobacco-derived nicotine and tobacco-derived flavorants). Therefore, we hypothesized that the chemical composition of JUUL System aerosols would also be less complex and contain fewer HPHCs than CC smoke.
Regulators and other public health organizations are also interested in addressing the concern that there may be uniquely harmful constituents in the aerosol of ENDS products. On 5 August 2019, the FDA proposed the addition of 19 ENDS-specific chemicals to the HPHC list [14]. These proposed additions include some flavorants, glycerol (vegetable glycerin or VG), and propylene glycol (PG), which are constituents for many ENDS products. While the expanded HPHC list included some ENDS-specific constituents, it does not fully encompass the range of ingredients used in ENDS formulations or constituents present in ENDS aerosols. Formulation ingredients are unique to each ENDS product and multiple ingredients may react to form a wide range of reaction products, similar to reaction chemistry previously observed with a wide range of food grade flavors [25]. Erythropel et al. reported data that indicated that primary constituents and flavorant aldehydes may react with each other to form acetals of PG and VG [26,27,28]. It is plausible that in addition to these reactions, which require mixing and time, other reactions could take place as a result of heating, contact with the heating coil material, or increased exposure to water and oxygen during aerosol formation. In addition, flavorants and extractable and leachable (E&L) compounds that could be transferred to the aerosol should be evaluated as well.
The majority of analytical work on ENDS has focused on targeting known chemicals of interest (i.e., the analytes being determined are known beforehand and the methods are tailored to detect those chemicals) based on changes to the device, formulation, power, temperature or sampling approaches [29]. For example, Vreeke and colleagues used targeted GC–MS and nuclear magnetic resonance to measure the amount of dihydroxyacetone generated from ENDS as a function of operating wattages [30]. Electron spin resonance has been used to determine free radicals in ENDS aerosols with GC–MS analysis employed to characterize flavor components [31]. Kosmider et al. used GC–MS to determine nicotine emission from ENDS as a function of PG and VG composition as well as device power [32], while Zhao and colleagues used liquid chromatography coupled to tandem mass spectrometry and electron spin resonance (ESR) targeted methods to detect stable/short lived reactive oxygen species (ROS) and found a substantial influence of e-cig brand, e-liquid flavor, puffing pattern and operational voltage on ROS levels [33]. Farsalinos and Gillman published a review focused on carbonyl emission from ENDS devices which covered 32 English-language studies in which 22 puffing variations and 9 trapping approaches are represented [34]. While many known chemicals have been targeted for analysis, these methods may yet leave unsampled portions, leading to potential gaps in the understanding of ENDS aerosol composition. Apart from the work of a few research groups [35,36,37], little has been published on the NTA of nicotine-containing aerosol from combustible and heated tobacco products, and even less on ENDS aerosols [38,39,40,41].
To address the potential gaps in understanding left by targeted analysis, NTA characterization requires the ability to capture, detect, and identify compounds relevant to a specific chemical space. The non-targeted analyses performed in this study were designed to span physicochemical properties from non-volatile to volatile and non-polar to polar chemicals [24]. This is best achieved using at least a set of two complimentary non-targeted methods. GC–MS methods are well suited and widely accepted for analysis of volatile sensory, flavor, and aroma compounds [42] as demonstrated by its application to coffee [43], fermentation products [44], bread [45], Scotch Whisky [46], wine [47], tobacco [48], olive oil [49] and electronic cigarettes [50]. GC–MS methods are well suited for non-targeted analyses because amount estimations without a reference standard are possible and because there are standardized electron ionization spectral libraries that facilitate compound identification [51]. For example, Krüsemann, using heat-assisted diffusion of volatiles in tobacco products to the gas phase, measured results against large databases in order to create a library of flavor compounds [48]. GC–MS alone is not sufficient for characterizing all portions of ENDS aerosol because there are liquid droplets also present in the aerosol and they may contain chemicals that are not amendable to GC–MS analysis. This is due to the fact that as the bulk liquids are heated, mixed with air and converted into an aerosol, there is a potential for non-volatile and higher-molecular-weight compounds to be present in the microdroplets of the carrier [36]. Therefore, for a thorough characterization, there is a need for an LC–MS-based non-targeted approach as well.
This combination of GC–MS and LC–MS-based non-targeted methodologies was employed in the current study to detect chemicals not included in the FDA’s list of 93 HPHCs, the proposed additions to the HPHC list, or elsewhere in the literature. The approach was designed with the intent to detect a large portion of the composition of JUUL aerosol and to elucidate constituents in common with, and unique from, the smoke of CCs using published data. The thorough chemical characterization of JUUL System aerosols described here is part of a multi-path approach to generate the necessary data for a toxicological risk assessment of JUUL use.

2. Materials and Methods

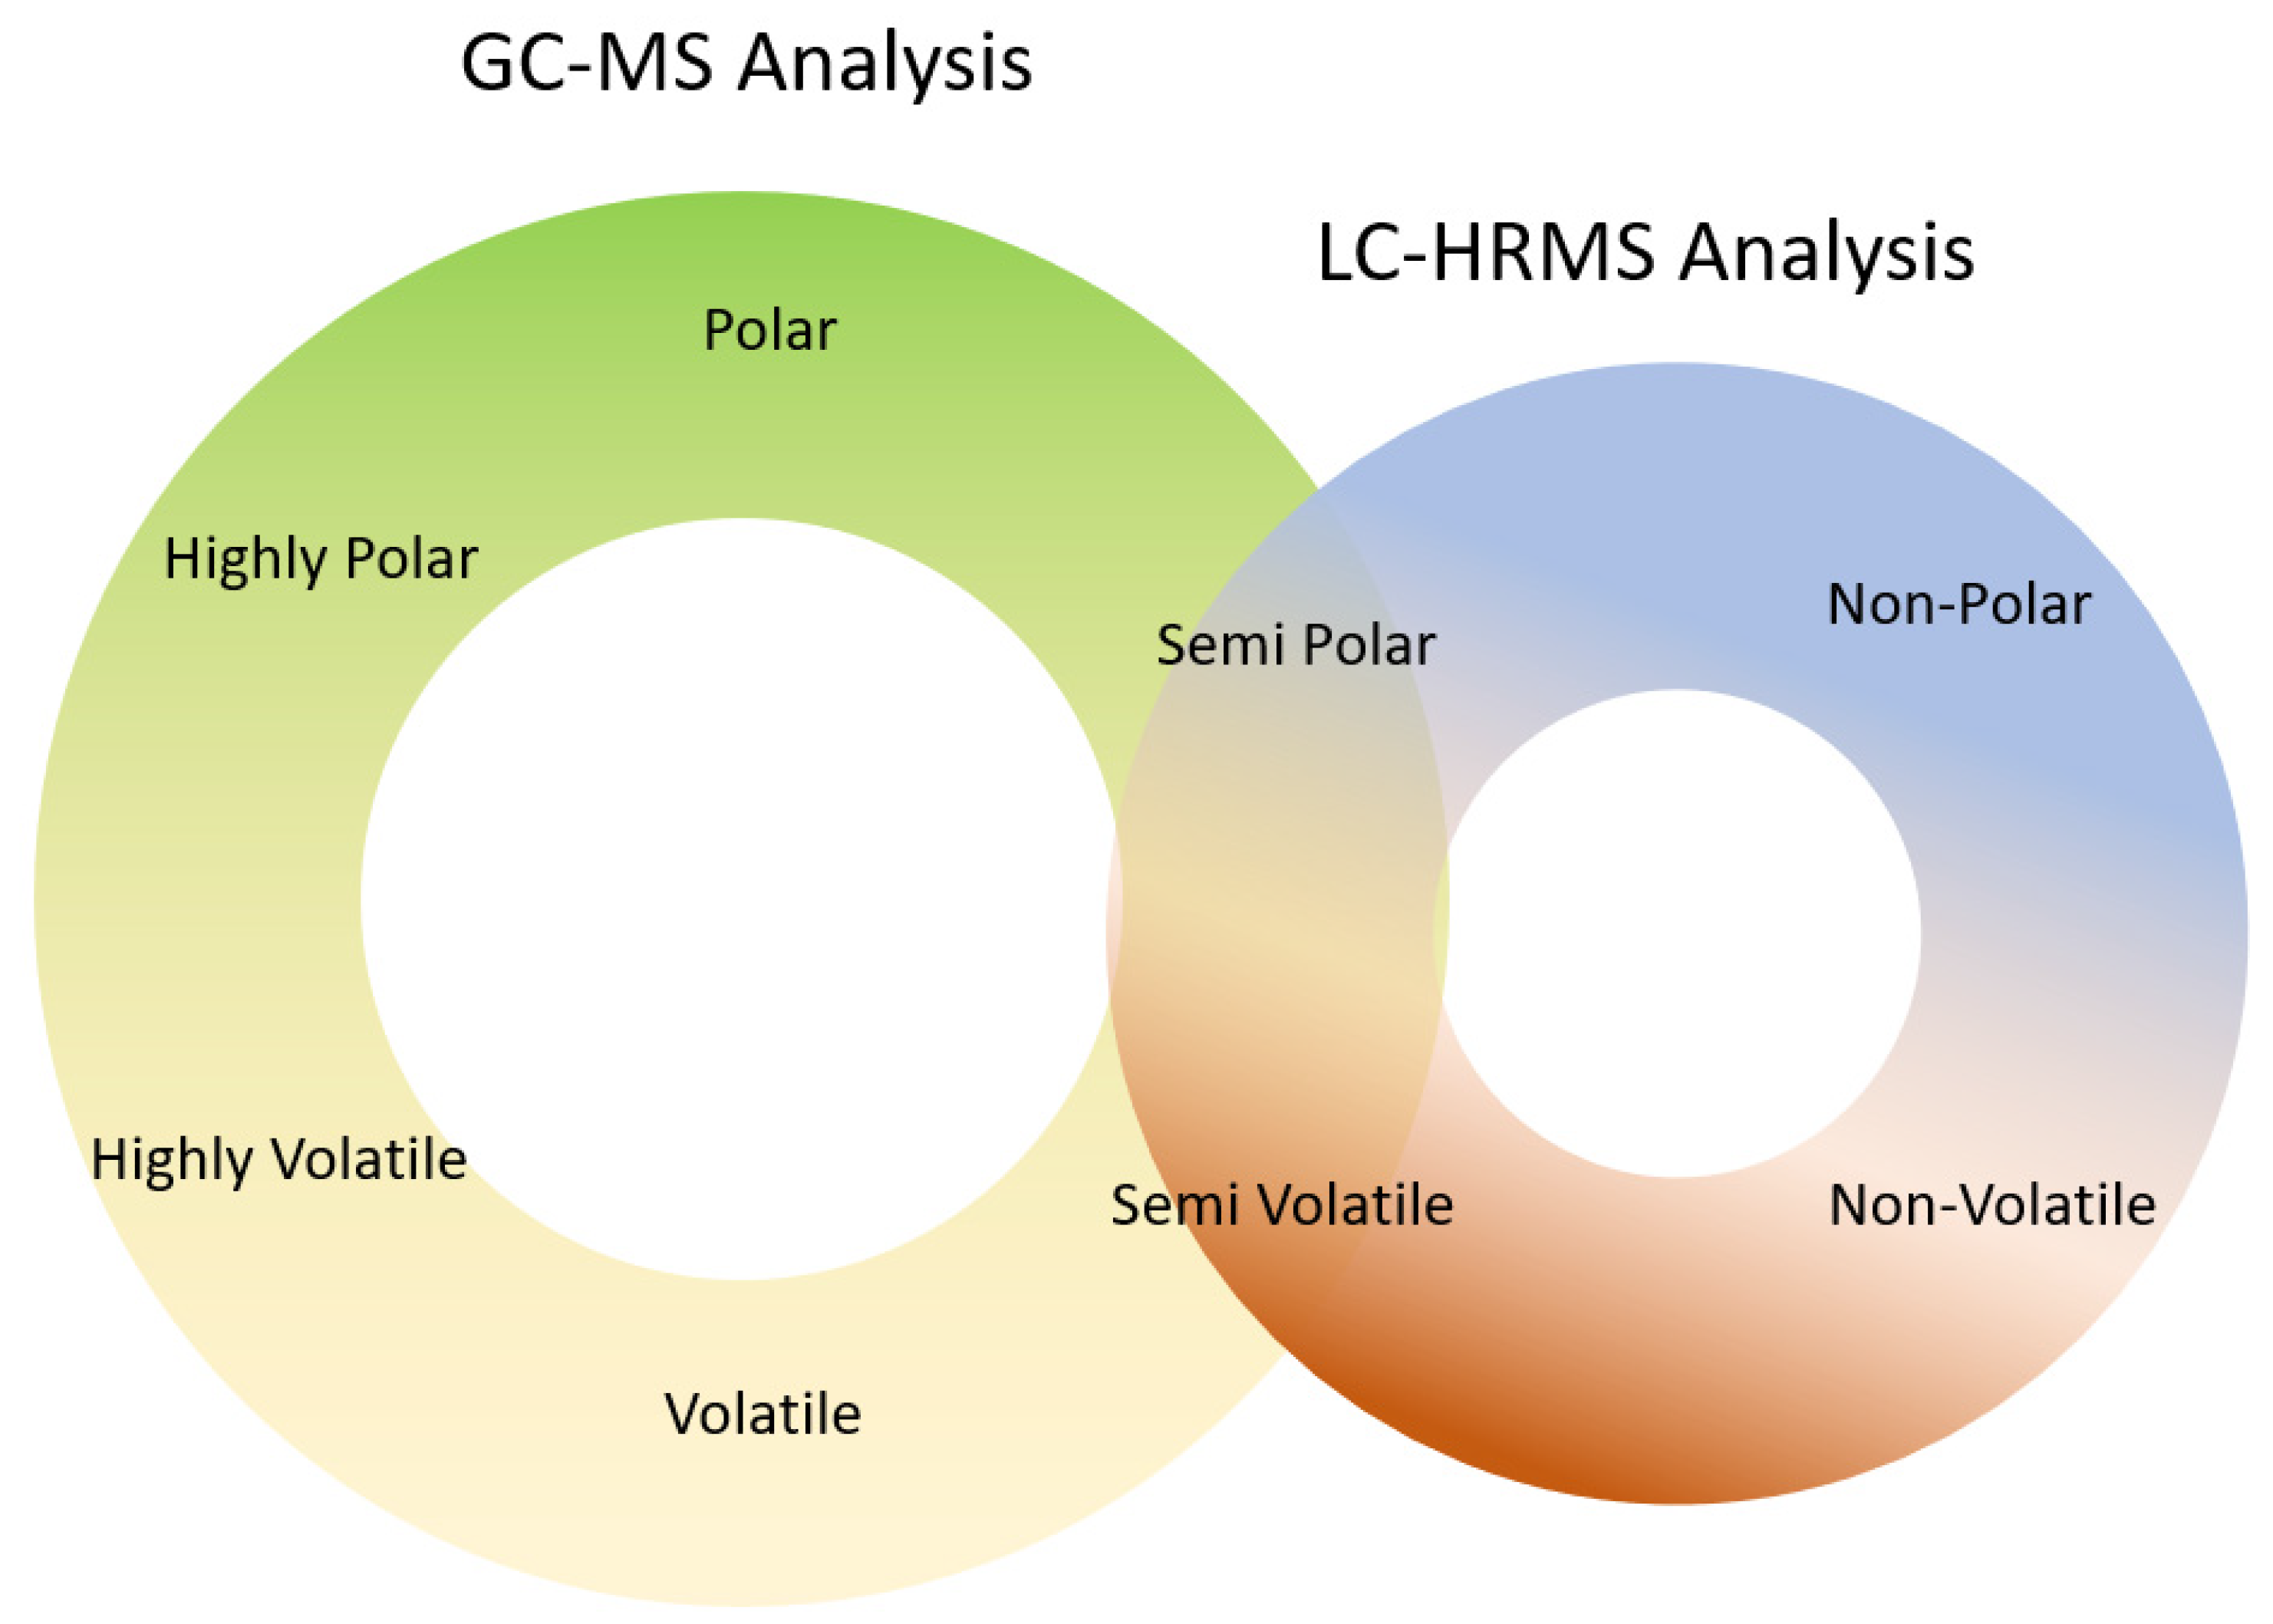
Two semi-quantitative non-targeted analyses were implemented to compliment targeted methods in order to provide a more complete list of aerosol constituents. The NTA methods were developed to be suitable for the detection and identification of chemicals from a broad chemical space (Figure 1). It is necessary to consider the properties of the anticipated compounds (i.e., volatile, non-volatile, polar, non-polar, etc.) in order to achieve a robust and thorough characterization, and to minimize sample preparation/manipulation. Therefore, the samples were collected and analyzed without any matrix removal steps, which minimized analyte loss and enabled the capture of a full range of diverse chemical constituents. This was achieved by collecting aerosols through a quartz filter pad and chilled impinger containing ethanol. After collection, the pad and ethanol were combined to extract the pad contents, and the resulting solution was sampled without any further manipulation or dilution.
Two complimentary analytical techniques were employed: gas chromatography electron ionization mass spectrometry and liquid chromatography electrospray ionization high resolving power mass spectrometry. These techniques were optimized to complement each other to provide maximal coverage of the chemicals potentially present in the aerosol of ENDS products. The GC–MS method was optimized for the detection of volatile and polar compounds [39]. Concurrently, the LC–HRMS method was optimized for detection of non/semi-volatile compounds and non/semi-polar compounds [52] (Figure 1). These techniques employ comparison to a known amount of an internal standard to achieve a quantity estimation across multiple compounds. It should be noted, however, that while these complementary methods cover a broad chemical space, not all chemicals present in the aerosol are detectable under these methods. For example, chemicals such as metals, non-ionizable compounds, compounds that are not amenable to chromatography, or compounds outside of the mass-to-charge (M/Z) scan range of the mass detector cannot be detected.
Software platforms were utilized for data processing of both GC–MS and LC–HRMS data to facilitate compound detection and identification. Agilent MassHunter Unknowns Analysis software (GC–MS) (Santa Clara, CA, USA) and Thermo Compound Discoverer version 3.0 (LC–HRMS) (Waltham, MA, USA) were employed to search both commercial and custom mass spectral libraries to identify potential aerosol constituents. This workflow was employed to investigate the chemical composition of JUUL aerosols with the aim of providing semi-quantitative information of constituents and evaluating the relative complexity of JUUL aerosols compared to cigarette smoke [10].
In this study, differential analyses based on nine (n = 9) collection replicates of each of the nicotine strengths (3.0% and 5.0%) and each collection condition (intense and non-intense) were used to characterize compounds differing from collection blanks. This method relies on the application of statistical tools to extract the relevant information from a large and highly complex dataset [53,54]. Due to the large number of variables in non-targeted analyses relative to the number of samples, these tools are imperative to avoid misinterpretation of instrument and collection artifacts as sample relevant compounds [55].
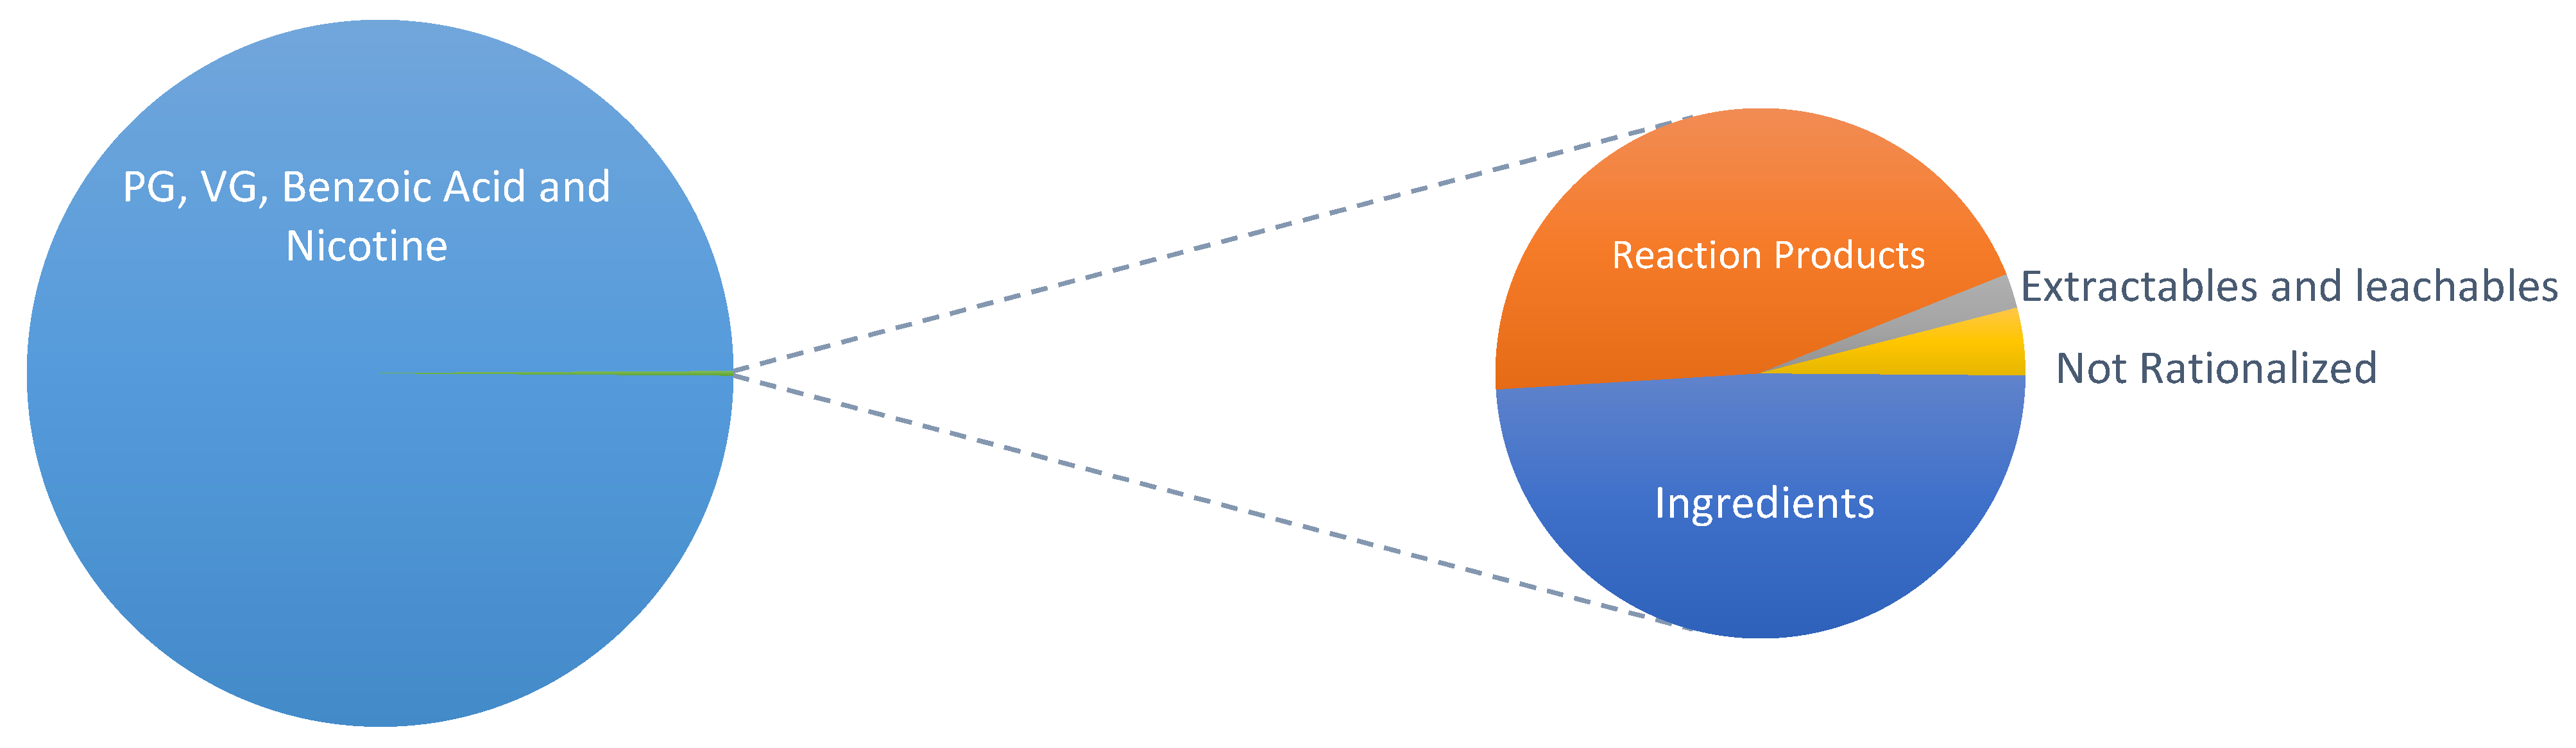
To allow for a more complete understanding of aerosol chemistry, tentatively identified ENDS aerosol analytes were rationalized into defined groups (Table 1). Compounds listed in the Flavor Extract Manufacturers Association (FEMA) flavor ingredient library [56] were labeled as flavorants. Compounds which are listed by the FDA as HPHCs in Tobacco Products and Tobacco Smoke: Established List [14] were labeled as HPHCs. Any compounds which are commonly found to migrate from packaging materials of consumer products [57,58,59] were labeled as extractables and leachables (E&L). Compounds proposed to be a result of chemical reactions, except when the product is an HPHC, were labeled as reaction products (Figure 2). All other compounds which were not able to be identified or rationalized were assigned to group 5.
All samples were equilibrated to room temperature if removed from environmental chambers. Prior to aerosol collection, the JUULpod was attached to a fully charged JUUL device. All aerosol collections were performed on Borgwaldt LX20 (Hamburg, Germany Part# 12000820) linear puffing machines and the JUUL System was inserted into a custom pad holder containing a 55 mm glass fiber filter pad (GFFP) (Part # 9703-9024, Whatman) to trap non-volatile compounds during aerosol collection. A chilled impinger (−5 ± 5 °C) containing 10 µg/mL 6-methylcoumarin (Sigma-Aldrich P/N W269905-100G-K), in 200 proof ethanol (Pharmco-Aaper P/N 111000200) as a trapping solvent was used in conjunction with the GFFP. The device was oriented at a 45° angle, with the battery end downward. The GFFP was extracted in the impinger solution and shaken for 30 to 60 min. The resulting solution was subjected to GC–MS and LC–HRMS analysis. Additionally, aerosol blanks were collected using an open port on the puffing machine and by puffing room air across the filter pad and through the impinger concurrently with sample collections. The pad and trapping solution for the blank were treated and analyzed the same as samples but were differentiated from samples during data processing. Three production batches and three replicates from each batch were analyzed for a total of nine replicates per JUUL product.
As recommended in the FDA’s guidance on premarket tobacco product applications for ENDS, non-intense and intense puffing regimens were used for all aerosol measurements performed with the JUUL System [60]. The non-intense puffing regimen followed the ISO 20768:2018 standard (square wave 55 mL over 3 s every 30 s). The intense puffing regimen used a square wave puff volume of 110 mL over 6 s every 30 s (Table 2). As opposed to discrete puffing blocks, an end of life (EOL) study was carried out to determine the number of machine puffs needed to fully deplete a JUULpod. Sample collections were set to achieve 85–90% of total EOL aerosol yield [61]. End of life testing was performed for both non-intense and intense puffing regimens, using the same product batches included in this study to ensure that the product performance was consistent with the samples being tested. The puffing was done in sequential 50-puff blocks, with the devices removed from the smoking machine every 50 puffs and inverted three times to settle the e-liquid on the wick. Devices were replaced every 50 puffs with fully charged devices. The device mass loss was determined by weighing the device prior to and after each 50-puff block. The EOL for a given pod was defined as the 50-puff collection where device mass loss was <10 mg/50 puffs for each replicate. The results of the EOL study showed that the intense regimen required about 2/3 the number of puffs to deplete a JUULpod compared to non-intense puffing, despite having 2-fold the puff volume. The six second duration for intense puffs was chosen because the JUUL device heating cuts off after six seconds of continuous puffing.
LC–HRMS analysis was conducted at and by Juul Labs, Inc. using a Thermo Liquid Chromatograph coupled with Q-Exactive Orbitrap mass spectrometer (Thermo Fisher Scientific, Waltham, MA, USA) in both the full scan and data-dependent acquisition modes. Compounds were separated on a Waters (Milford, MA, USA) BEH C18 column (2.1 × 100 mm, 1.7 µm) Part # 186002352 over 26 min. The mobile phase gradient started at 95% 5 mM ammonium acetate in water, reaching 80% methanol at 22 min, followed by a 4 min re-equilibration at starting conditions. Compounds were detected in the positive electrospray ionization (+ESI) mode. Mass spectrometric data were acquired in the full scan mode at 140,000 resolving power from m/z 60 to 800. A pooled mixture of all samples was prepared as a quality control sample to monitor and compensate for time-dependent batch effects as well as for collected data-dependent MS/MS spectra.
Compound Discoverer version 3.0 software (Thermo Fisher Scientific, Waltham, MA, USA) was used to detect compounds and search +ESI spectra compound libraries (Juul Labs, Inc., Washington, DC, USA) custom compound mass spectral library and Thermo mzCloud mass spectral database) to identify the compounds detected by the NTA. All reported constituent amounts were estimated by comparison with the internal standard. All compounds with estimated amounts at or above 0.5 µg/g and a probability value (p-value) less than 0.05 were considered sample relevant. A p-value less than 0.05 is considered statistically significant (less than a 5% probability that the results are random) [62]. A match factor criterion guideline for the identification confidence levels of compounds identified by LC–HRMS was formulated as shown in Table 3. The final identification confidence levels were assigned after a visual inspection of the mass spectrum.
GC–MS analyses were conducted at and by Altria Client Services, LLC. (Richmond VA, USA) using a validated method that was included under the site’s ISO 17025 accreditation. The scope of this method is to identify new compounds or compounds that increase in concentration over time during stability studies for ENDS products. This provides semi-quantitative results based on the response factor of an analog internal standard. Analyses were performed on an Agilent (Santa Clara, CA, USA) gas chromatograph with electron ionization single quadrupole mass spectrometer (7890 GC/5977 MSD). Compounds were separated using a Restek Stabilwax capillary column (30 m, 0.25 mm ID) over a 27 min temperature gradient starting at 60 °C and held for 1.25 min, followed by 15 °C/min to 210 °C and held for 2 min, finishing by ramping 30 °C/min to 260 °C held for 9 min and mass spectrometric data were acquired in the full scan mode from m/z 60 to 400.
MassHunter Unknowns Analysis software (Agilent, Santa Clara, CA, USA) was used to deconvolute GC–MS full scan EI mass spectra to detect compounds and assign tentative identifications. Compound identifications for peaks in study samples were completed by comparing the mass spectra from the samples to the National Institute of Standards and Technology 2017 mass spectral database and an in-house-developed custom mass spectral library. The custom library consists of mass spectra from matrix matched reference standards, tentative identifications, and previously observed unknown compounds relevant to the sample. All reported compounds from the GC–MS results were detected in the aerosol at greater than 3-fold the estimated amounts in blanks (pad blank, aerosol collection blank, and reagent blank). All reported constituent amounts were estimated by comparison with the internal standard. A match factor criterion guideline for the identification confidence levels of compounds identified by GC–MS was formulated as shown in Table 4. The final identification confidence levels were assigned after a visual inspection of the mass spectrum.
Full instrument conditions are outlined in the Extended Methods section of the Supplemental Information.

3. Results

All reported compounds from LC–HRMS and GC–MS NTA results were detected in the aerosol at or above 0.5 µg/g with a p-value less than 0.05 [62] for LC–HRMS analysis and at or above 0.7 µg/g and greater than 3-fold the signal in the sample vs. the blank for GC–MS analysis. Nicotine, PG, VG, and benzoic acid are not reported as their concentration exceeded the dynamic range and linear response of the detectors. This rendered it challenging to estimate their amounts while also estimating the amounts of low concentration analytes. Glycidol is also excluded from the NTA results because it is known to form from thermal degradation of glycerol under GC inlet temperatures of 260 °C [63]. The confidence levels of tentative identifications were determined based on the criteria presented in Table 3 and Table 4. The identity of each compound was rationalized and categorized into one of the five groups: (1) flavorant, (2) HPHC [14], (3) extractable or leachable, (4) reaction product, or (5) not rationalized (Table 1).

3.1. Virginia Tobacco 3.0% Nicotine (VT3)

A total of 79 compounds were detected in VT3 aerosol collected under the intense puffing regimen, and 69 compounds were detected under the non-intense regimen. The total aerosol constituents tentatively identified in VT3 aerosol (intense and non-intense) using LC–HRMS and GC–MS are outlined in Supplementary Tables S1–S4.
A comparison of GC–MS and LC–HRMS results indicate that the techniques used in this study are generally complementary, with a small overlap of eight compounds detected in both analyses. For both intense and non-intense aerosol samples, these compounds included hydroxyacetone, 2-hydroxypropyl but-3-enoate isomer 1 and isomer 2, veratryl aldehyde, veratryl aldehyde PG acetal isomer 1 and isomer 2, triethyl citrate, and damascenone. The GC–MS method is less susceptible to analyte-specific ionization efficiency when compared to the LC–HRMS method. Therefore, in instances when both LC–HRMS and GC–MS detected the same compound, the GC–MS estimated amounts were used for the calculation in Table 5 and Table 6.
Figure 3 provides a visual summary of the total percent (%) mass breakdown of constituents in the VT3 intense aerosol detected by NTA. In total, the five groups represent 0.23% of the total aerosol mass. The remaining aerosol mass detected by NTA consisted of the major ingredient components PG, VG, nicotine and benzoic acid.
Table 5 summarizes the total number and percent aerosol mass represented by each group of compounds identified in the VT3 intense puffing regimen data. Among the five groups, reaction products (Figure 3) accounted for 70% of the total number of compounds identified. These reaction products however, make up only one-tenth of one percent (0.097%) of the total aerosol mass. Flavorants accounted for 16% of the total number of compounds and 0.13% of the aerosol. Extractables and leachables accounted for 6% of the total number of compounds and a small percentage of the total aerosol mass (0.003%). There were no HPHCs detected for VT3 intense aerosol using these NTA methods—as is the case for all SKUs included in this study; this is due to several reasons. First, some HPHCs are byproducts of complete and incomplete combustion of tobacco plant materials and paper. Given that there is no tobacco plant material—excluding tobacco-derived nicotine and tobacco derived flavorants—nor paper in JUUL products, many HPHCs are not observed at all. Second, some highly volatile or reactive HPHCs, such as formaldehyde, are typically collected with specialized derivatization protocols unlike those used in NTA. Third, some HPHCs that would be detectable by the reported NTA method, for example tobacco-specific nitrosamines NNN and NNK, are found by targeted methods to be absent from or present in concentrations below the limit of detection for these NTA methods [64]. Only a very small percentage of the total aerosol mass (0.0001%) was classified as unknowns or could not be rationalized into a specific group based on tentative identifications.
Table 6 summarizes the total number and percent aerosol mass represented by each group of the compounds identified in the VT3 non-intense puffing regimen data. Among the 5 groups, reaction products accounted for 75% of the total number of compounds identified. These reaction products, however, make up only one-tenth of one percent (0.096%) of the total aerosol mass. Flavorants comprised 16% of the total number of compounds and 0.20% of the aerosol mass. Extractables and leachables accounted for 7% of the total number of compounds and a small percentage of the total aerosol mass (0.0046%). HPHCs were not detected (ND) for VT3 non-intense aerosol using these NTA methods and only a very small percentage of the total aerosol mass (0.0001%) were unknowns or could not be rationalized into a specific group based on the tentative identification.
As summarized in Table 7, there were 60 compounds in common between the two puffing topographies. Intense puffing resulted in 19 unique identifications (24% of 79 compounds) while non-intense puffing resulted in 9 unique IDs (13% of 69 compounds). Therefore, the total number of compounds in the aerosol of VT3 was determined to be 88 (60 common identifications + 28 unique identifications). Overall, 42% of compound IDs were confirmed by standard reference material. The remaining 58% compounds were identified with “high” (24%), “medium” (8%), “low” (1%), and “NA” (25%) confidence levels. Among 22 compounds with “NA” confidence level, 13 compounds were classified as nicotine-related degradants. In summary, excluding nicotine, benzoic acid, PG, and VG, the compounds discovered by semi-quantitative NTA methods accounted for approximately 0.2% and 0.3% of the total detected aerosol mass in the intense and non-intense aerosol, respectively.
Although the total number of compounds detected using non-intense topography was smaller than the total number of compounds detected using the intense regimen, the total calculated average mass of collected non-primary-ingredient compounds under non-intense puffing was larger than that for the intense regimen. A difference in the masses collected in the flavorant group accounted for the majority of this inconsistency, and coelution of triethyl citrate with benzoic acid in some analyses was determined to be the primary cause of the inconsistency between intense and non-intense aerosol samples for this group. Prior to the analysis non-intense samples, chromatographic separation between triethyl citrate and benzoic acid was improved, resulting in higher levels of measured triethyl citrate. Overall, approximately 50% of the NTA detected mass was attributed to flavorants. There were six compounds in total that were determined to be associated with E&L, under either puffing regimen. The majority of compounds rationalized as reaction products were associated with PG, VG or nicotine related degradation. A very small percentage of the total aerosol mass (0.0017% for intense and 0.0001% for non-intense puffing topographies) could not be rationalized into a specific group based on the tentative chemical identification.
A global compilation of 5162 compounds in CC smoke catalogued by Rodgman and Perfetti [10] was compared to the 88 compounds detected in VT3 aerosol (Figure 4). Conservatively, this comparison was performed using CAS number, meaning that unless a compound from the NTA was fully identified, it was labeled to be exclusive to JUUL aerosol. Of the 88 compounds detected in VT3, 29 were found to be in common with cigarette smoke and 59 were found to be unique to VT3 (supplemental Table S9). Of the 59 compounds, 44 were termed unique due to lack of CAS number and 24 were classified as nicotine degradants. Table 8 summarizes the total number and aerosol mass represented by each group of the 59 unique compounds in VT3 aerosol. The largest contributing group by mass was flavorant due to the presence of triethyl citrate. Triethyl citrate has been detected in tobacco [65] and in an isolated pyrolysis study, but not detected in tobacco smoke [10,66]. The largest number of compounds exclusive to VT3 aerosols fall into the category of reaction products. Of the 48 reaction products, 19 were nicotine degradants (13 without known structures), 9 were PG/VG degradants and 20 were the product of chemical reactions. The remaining 6 compounds which were not rationalized comprised a very small amount of the total mass (0.0016%). A complete list of all compounds either common with or unique from CC smoke used to generate Figure 4 is presented in Supplementary Table S9.

3.2. Virginia Tobacco 5.0% Nicotine (VT5)

A total of 85 compounds were detected in VT5 aerosol collected under the intense puffing regimen and 73 compounds were detected under the non-intense puffing regimen. The total aerosol constituents discovered in VT5 aerosol (intense and non-intense) using LC–HRMS and GC–MS are outlined in Supplementary Tables S5–S8.
A comparison of LC–HRMS and GC–MS results indicates that the techniques used in this study are generally complementary, with only ten compounds detected in both analyses. These compounds included hydroxyacetone, 2-hydroxypropyl but-3-enoate isomers 1 and 2, veratryl aldehyde, 1-(1-methyl-5-(pyridine-3-yl)-1H-pyrrol-2-yl) propan-2-one isomer 1 and 2, veratryl aldehyde PG acetal isomers 1 and 2, triethyl citrate, and damascenone for both intense and non-intense aerosol samples. As with the VT3 data, when both LC–HRMS and GC–MS NTA detected the same compounds, the GC–MS estimated amounts were used for calculations in Table 9 and Table 10.
Figure 5 provides a visual summary of the total percent (%) mass breakdown of constituents in the VT5 intense aerosol detected by NTA. In total, the 5 groups represent less than approximately 0.2% of the total aerosol mass and the rest of the aerosol mass percent detected by NTA is comprised of the major ingredient components PG, VG, nicotine, and benzoic acid.
Table 9 summarizes the total number and percent aerosol mass represented by each group of compounds identified in the VT5 intense puffing regimen data. Among the five groups, reaction products accounted for 72% of the total number of compounds identified. These reaction products, however, make up less than one-tenth of one percent (0.089%) of the total detected aerosol mass. Flavorants accounted for 15% of the total number of compounds and 0.098% of the detected aerosol mass. E&L accounted for 4% of the total number of compounds and 0.0042% of the total aerosol mass. There were no HPHCs detected for VT5 intense aerosol using these NTA methods and only 0.0038% of the total aerosol mass were unknowns or could not be rationalized into a specific group based on the tentative identification.
Table 10 summarizes the total number and percent aerosol mass represented by each group of the compounds identified in the VT5 non-intense puffing regimen data. Among the five groups, reaction products accounted for 71% of the total number of compounds identified, but less than one-tenth of one percent (0.080%) of the total aerosol mass. Flavorants comprised 16% of the total number of compounds and 0.098% of the detected aerosol mass. Extractables and leachables accounted for 4% of the total number of compounds 0.0038% of the total detected aerosol mass. There was only 0.0022% of the total aerosol mass were unknowns or could not be rationalized into a specific group based on the tentative identification.
As summarized in Table 11, there were 67 compounds in common between the two puffing regimens. Intense puffing resulted in 18 unique identifications (21% of 85 compounds) and non-intense puffing resulted in 6 unique compounds (8% of the 73 compounds). Therefore, the total number of unique compounds in VT5 aerosol was determined to be 91 (67 common identifications + 24 unique IDs). Overall, 47% of compound identifications were confirmed by standard reference material. The remaining 53% of compounds were identified with “high” (20%), “medium” (6%), “low” (2%), and “NA” (25%) confidence levels. Among 23 compounds with “NA” confidence level, 14 compounds were classified as nicotine-related degradants.
In summary, the semi-quantitative NTA methods accounted for approximately 0.2% of the total aerosol mass in both intense and non-intense aerosols. The total number of compounds detected using non-intense topography was smaller than the total number of compounds detected using the intense regimen. Most of the total detected mass of both puffing regimens was comprised of flavorants and reaction products. There were four compounds in total that were determined to be associated with E&L, under either puffing regimen. Most reaction products were associated with either PG, VG, or nicotine-related degradation. The small number of remaining compounds were related to E&L or could not be rationalized into one of these categories. Only a very small percentage of the total detected aerosol mass (0.0038% for intense and 0.0022% for non-intense puffing regimens) could not be rationalized into a specific group based on the tentative chemical identification.
As with VT3, the 91 compounds detected in the aerosol of VT5 were compared to the 5162 compounds in CC smoke catalogued by Rodgman and Perfetti (Figure 6). This comparison was also performed using only compounds fully identified with a CAS number, meaning that compounds which were not identified fully were labeled to be exclusive to JUUL aerosol. Of the 91 compounds detected in VT5, 32 were found to be in common with cigarette smoke and 59 were labeled as unique to VT5. Table 12 summarizes the total number and aerosol mass represented by each group of the 59 unique compounds in VT5 aerosol (supplemental Table S10). A high percentage of the mass of analytes exclusive to JUUL was related to one flavorant compound, triethyl citrate. According to Rodgman and Perfetti, triethyl citrate has been detected in tobacco and an isolated pyrolysis study, but not detected in tobacco smoke [10]. Reaction products account for the largest number and mass of compounds exclusive to VT5 aerosol. Of the 47 reaction products, 20 were nicotine degradants (14 without known structures), 9 were PG/VG degradants and 18 were the product of other chemical reactions. The remaining 9 compounds which were not rationalized comprised only 0.0039% of the total mass. A complete list of all compounds either common with or unique from CC smoke used to generate Figure 6 is presented in Supplementary Table S10.

4. Discussion

Evaluating ENDS aerosols based only on knowledge of the harmful chemicals found in cigarette smoke leaves a gap in the assessment of ENDS aerosols [21,67]. This is due in part to the difference in regulated electronic heating and combustion as well as the ingredients unique to ENDS (i.e., propylene glycol and glycerol). Nicotine delivery from a CC is based on the combustion of plant material, whereas nicotine delivery from ENDS products is based on heating and aerosolizing nicotine-containing liquids. Measurement shows that JUUL operates within a regulated temperature range [68] with the intent of minimizing HPHCs formed as heat degradation byproducts [19,20,69]. Due to these fundamental differences in design, the use of only targeted methods to analyze ENDS products may leave a gap in our understanding of their aerosols. Therefore, in order to identify a wider range of the constituents contained within JUUL Virginia Tobacco aerosols, two complementary NTA methods were applied.
The LC–HRMS and GC–MS NTA methods presented here were optimized to screen for chemicals with a broad range of physiochemical properties, potentially present in ENDS aerosol. However, these methods are not exhaustive, and some chemical classes may not be well suited for a general sample collection and mass spectral analyses. More generally, mass spectrometry detection has limitations in its inability to detect nonionizable compounds, and compounds outside the defined mass-to-charge scan range. Another limitation inherent to a non-targeted analysis is the challenge in estimating the amounts of very high and very low concentration analytes in the same analysis; these NTA methods were developed to be sensitive to sub ppm range and were unable to provide reliable amount estimations for the detected primary constituents (PG, VG, nicotine, and benzoic acid), owing to the broad peak shape and detector saturation caused by their high concentrations. This, along with water, which was not detectable by these NTA methods, affected the ability to perform a careful mass balance analysis. Despite these limitations, the reported NTA approach provides a broad coverage of chemical properties—volatile, semi-volatile, non-volatile, non-polar, and polar compounds. Therefore, only a small percentage of aerosol constituents are thought to have gone undetected.
Overall, the NTA identified 88 and 91 chemical constituents (excluding PG, VG, nicotine, and benzoic acid) in VT3 and VT5, respectively. Of these compounds, 47% were confirmed using reference standards. Most of the compounds, approximately 50% of the NTA detected aerosol mass, were flavorants. Reaction products, including nicotine-related degradants, made up approximately 30–40% of the aerosol mass detected by NTA with the small amount remaining consisting of E&L and non-rationalized compounds. Overall, the 5 groups accounted for approximately 0.2-0.3% of the total aerosol mass with flavorants and reaction products comprising most of the mass detected. The unknown/not rationalized compounds were estimated to be present in low amounts and were detected with low signals, which posed challenges in compound identification. In total, more compounds were present in the 5.0% nicotine concentration product than the 3.0% nicotine product and more compounds were identified in aerosols generated with the intense puffing regimen than the non-intense puffing regimen. The NTA did not detect any HPHCs in the aerosol of JUUL Virginia Tobacco products.
The consistent composition of the aerosols across nicotine strengths and puffing conditions is contrasted with the variability in the composition of natural tobacco in traditional cigarettes. Botanical preparations contain a wide variety of bioactive secondary metabolites, which vary considerably depending on the cultivar and geography [70]. The variability of tobacco and the temperature of combustion (smoldering side stream smoke vs. mainstream smoke generated during the draw) both affect the composition of CC smoke, which is much more complex overall than the aerosol of ENDS products [11,71]. In contrast to CC, JUUL devices only produce aerosol during the draw and their electrical performance is well regulated [19,72]. This means that the puffing regimen should not appreciably impact the composition of the aerosol, which was shown to be true in this study, making a detailed and reproducible characterization of the chemicals possible.
In addition to the identification and semi-quantitation of the aerosol constituents, potential mechanisms for the formation of all tentatively identified compounds were considered. If an automated spectra search returned a tentative identification for which there was not a reasonable chemical mechanism of compound generation, then those identifications were re-evaluated. Understanding of the formation of the compounds detected by the non-targeted screening methods would have allowed for strategic formulation adjustment had that been necessary.
A global compilation of the 5162 compounds in CC smoke was catalogued by Rodgman and Perfetti [10], 93 of which have been identified by FDA as HPHCs. In addition to the specific links that are known between HPHCs and tobacco related diseases, there are additional risks related to the chemical complexity of CC smoke. Such chemical complexity has made it difficult to determine the active constituents responsible for all tobacco-related health risks of smoking and it is now being realized that a component of the health effects of this complex mixture are likely to result from a combined effect of these chemicals through multiple mechanisms rather than as a result of the effects of a single smoke constituent [9,71]. In this light, chemical complexity in and of itself may contribute to the harmfulness of cigarette smoke. Therefore, understanding the chemical complexity of JUUL aerosol in relation to CC smoke may aid in determining the relative potential health risks of using JUUL as an alternative to smoking for smokers who have not yet quit. The comparison of aerosol constituents detected by NTA to the list of chemicals in cigarette smoke catalogued by Perfetti and Rodgman resulted in 59 unique compound identifications in both VT3 and VT5 aerosols (out of 88 and 91 total constituents detected, respectively). Most of the aerosol mass from the 59 unique compounds in Virginia Tobacco products was comprised of one flavorant compound, triethyl citrate. Approximately 30% of the reaction products unique to VT aerosol were classified as nicotine-related compounds with limited structural information. Overall, the JUUL Virginia Tobacco aerosols studied here are shown to be approximately 50-fold less complex when compared to cigarette smoke.
The present study sought to construct a more complete appraisal of the full chemical space of JUUL Virginia Tobacco aerosol as a compliment to targeted analyses of pre-defined constituents, and to provide data for the comparative risk assessment of JUUL aerosols compared to CC smoking. The compound identifications and concentration estimates obtained by NTA provided a reasonably comprehensive characterization of JUUL Virginia Tobacco aerosols and proposed potential sources and chemical reactions for each compound allowed for a better understanding of aerosol composition and potential ingredient degradants. To this end, the present study contributes important understanding of the chemical composition of JUUL Virginia Tobacco aerosols toward appropriate assessment of the comparative public health risk for JUUL products compared to CC.

Supplementary Materials

The following are available online at https://0-www-mdpi-com.brum.beds.ac.uk/article/10.3390/separations8090130/s1, Table S1: Liquid Chromatographic Conditions; Table S2: Q-Exactive Mass Spectrometer Parameters; Table S3: Gas Chromatographic Parameters; Table S4: GC–MS Characterization of Aerosol Collected Under the Intense Puffing Regimen from Three Batches of Virginia Tobacco 3.0%; Table S5: GC–MS Characterization of Aerosol Collected Under the Non-Intense Puffing Regimen from Three Batches of Virginia Tobacco 3.0%; Table S6: LC–MS Characterization of Aerosol Collected Under the Intense Puffing Regimen from Three Batches of Virginia Tobacco 3.0%; Table S7: LC–HRMS Characterization of Aerosol Collected Under the Non-Intense Puffing Regimen from Three Batches of Virginia Tobacco 3.0%; Table S8: GC–MS Characterization of Aerosol Collected Under the Intense Puffing Regimen from Three Batches of Virginia Tobacco 5.0%; Table S9: GC–MS Characterization of Aerosol Collected Under the Non-Intense Puffing Regimen from Three Batches of Virginia Tobacco 5.0%; Table S10: LC–HRMS Characterization of Aerosol Collected Under the Intense Puffing Regimen from Three Batches of Virginia Tobacco 5.0%; Table S11: LC–HRMS Characterization of Aerosol Collected Under the Non-Intense Puffing Regimen from Three Batches of Virginia Tobacco 5.0%; Table S12: List of Compounds Detected in the Aerosol Collected from JUUL Virginia Tobacco 3.0% under the Intense and Non-Intense Puffing Regimens by Non-Targeted Analyses; Table S13: List of Compounds Detected in the Aerosol Collected from JUUL Virginia Tobacco 5.0% Under the Intense and Non-Intense Puffing Regimens by Non-Targeted Analyses.

Author Contributions

M.R.C.: conceptualization, data curation, investigation, formal analysis, methodology, and writing; L.N.J.: conceptualization, data curation, investigation, methodology, and writing; P.C.B.: visualization and writing; A.L.: data curation and conceptualization; C.Y.: software; A.O.: project administration; J.B.J.: supported analysis; I.G.G.: supervision and resources. All authors have read and agreed to the published version of the manuscript.

Funding

This research received no external funding.

Institutional Review Board Statement

Not applicable.

Informed Consent Statement

Not applicable.

Data Availability Statement

Due to its proprietary nature, the analyzed data is not publicly available.

Conflicts of Interest

The authors declare no conflict of interest.

References

  1. US Department of Health and Human Services. The Health Consequences of Smoking—50 Years of Progress: A Report of the Surgeon General; Reports of the Surgeon General: Altanta, GA, USA, 2014.
  2. Report on the Global Tobacco Epidemic: A Report of the World Health Organization; World Health Organization: Geneva, Switzerland, 2019.
  3. FDA. FDA’s Youth Tobacco Prevention Plan. Available online: https://www.fda.gov/tobacco-products/youth-and-tobacco/fdas-youth-tobacco-prevention-plan (accessed on 18 August 2021).
  4. USSG. Preventing Tobacco Use Among Youth and Young Adults: A Report of the Surgeon General; National Center for Chronic Disease Prevention and Health Promotion (US) Office on Smoking and Health: Atlanta, GA, USA, 2012.
  5. Family Smoking Prevention and Tobacco Control and Federal Retirement Reform. Available online: https://www.govinfo.gov/content/pkg/PLAW-111publ31/pdf/PLAW-111publ31.pdf (accessed on 18 August 2021).
  6. Brown, J.; Brown, B.; Schwiebert, P.; Ramakrisnan, K.; McCarthy, L.H. In adult smokers unwilling or unable to quit, does changing from tobacco cigarettes to electronic cigarettes decrease the incidence of negative health effects associated with smoking tobacco? A Clin-IQ. J. Patient Cent. Res. Rev. 2014, 1, 99–101. [Google Scholar] [CrossRef] [Green Version]
  7. US Food and Drug Administration. FDA’s Comprehensive Plan for Tobacco and Nicotine Regulation. 2019. Available online: https://www.fda.gov/tobacco-products/ctp-newsroom/fdas-comprehensive-plan-tobacco-and-nicotine-regulation (accessed on 18 August 2021).
  8. Benowitz, N.L. Nicotine addiction. N. Engl. J. Med. 2010, 362, 2295–2303. [Google Scholar] [CrossRef] [PubMed]
  9. Paschke, M.; Hutzler, C.; Henkler, F.; Luch, A. Oxidative and inert pyrolysis on-line coupled to gas chromatography with mass spectrometric detection: On the pyrolysis products of tobacco additives. Int. J. Hyg. Environ. Health 2016, 219, 780–791. [Google Scholar] [CrossRef] [PubMed]
  10. Rodgman, A.; Perfetti, T.A. The Chemical Components of Tobacco and Tobacco Smoke, 2nd ed.; CRC Press: Boca Raton, FL, USA, 2013. [Google Scholar]
  11. How Tobacco Smoke Causes Disease: The Biology and Behavioral Basis for Smoking-Attributable Disease: A Report of the Surgeon General; Publications and Reports of the Surgeon General: Atlanta, GA, USA, 2010.
  12. IARC Working Group on the Evaluation of Carcinogenic Risks to Humans; World Health Organization; International Agency for Research on Cancer. Tobacco smoke and involuntary smoking. IARC Monogr. Eval. Carcinog. Risks Hum. 2004, 83, 1–1438.
  13. Burns, D.M.; Dybing, E.; Gray, N.; Hecht, S.; Anderson, C.; Sanner, T.; O’Connor, R.; Djordjevic, M.; Dresler, C.; Hainaut, P.; et al. Mandated lowering of toxicants in cigarette smoke: A description of the World Health Organization TobReg proposal. Tob. Control 2008, 17, 132–141. [Google Scholar] [CrossRef] [PubMed] [Green Version]
  14. FDA. Harmful and Potentially Harmful Constituents in Tobacco Products; Established List; Proposed Additions; Request for Comments. Fed Regist 2019, 2021, 38032–38035. [Google Scholar]
  15. Dusautoir, R.; Zarcone, G.; Verriele, M.; Garçon, G.; Fronval, I.; Beauval, N.; Allorge, D.; Riffault, V.; Locoge, N.; Lo-Guidice, J.-M.; et al. Comparison of the chemical composition of aerosols from heated tobacco products, electronic cigarettes and tobacco cigarettes and their toxic impacts on the human bronchial epithelial BEAS-2B cells. J. Hazard. Mater. 2021, 401, 123417. [Google Scholar] [CrossRef]
  16. Tayyarah, R.; Long, G.A. Comparison of select analytes in aerosol from e-cigarettes with smoke from conventional cigarettes and with ambient air. Regul. Toxicol. Pharm. 2014, 70, 704–710. [Google Scholar] [CrossRef] [PubMed] [Green Version]
  17. McNeill, A.; Brose, L.S.; Calder, R.; Bauld, L.; Robson, D. Evidence Review of E-Cigarettes and Heated Tobacco Products 2018; A Report Comissioned by Public Health England: London, UK, 2018. [Google Scholar]
  18. Gillman, I.G.; Kistler, K.A.; Stewart, E.W.; Paolantonio, A.R. Effect of variable power levels on the yield of total aerosol mass and formation of aldehydes in e-cigarette aerosols. Regul. Toxicol. Pharm. 2016, 75, 58–65. [Google Scholar] [CrossRef] [Green Version]
  19. GIllman, I.G.; Johnson, M.; Martin, A.; Meyers, D.; Alston, B.; Misra, M. Characterization of Temperature Regulation and HPHC Profile of a Nicotine-Salt Based ENDS Product. In Proceedings of the Society for Research on Nicotine, Baltimore, MD, USA, 21–24 February 2018. [Google Scholar]
  20. Farsalinos, K.E.; Kistler, K.A.; Pennington, A.; Spyrou, A.; Kouretas, D.; Gillman, I.G. Aldehyde levels in e-cigarette aerosol: Findings from a replication study and from use of a new-generation device. Food Chem. Toxicol. 2018, 111, 64–70. [Google Scholar] [CrossRef] [PubMed]
  21. El-Hage, R.; El-Hellani, A.; Salman, R.; Talih, S.; Shihadeh, A.; Saliba, N.A. Vaped Humectants in E-Cigarettes Are a Source of Phenols. Chem. Res. Toxicol. 2020, 33, 2374–2380. [Google Scholar] [CrossRef]
  22. Wilson, S.; Partos, T.; McNeill, A.; Brose, L.S. Harm perceptions of e-cigarettes and other nicotine products in a UK sample. Addiction 2019, 114, 879–888. [Google Scholar] [CrossRef] [Green Version]
  23. Caponnetto, P. Well-being and harm reduction, the consolidated reality of electronic cigarettes ten years later from this emerging phenomenon: A narrative review. Health Psychol. Res. 2021, 8, 9463. [Google Scholar] [CrossRef]
  24. Bentley, M.C.; Almstetter, M.; Arndt, D.; Knorr, A.; Martin, E.; Pospisil, P.; Maeder, S. Comprehensive chemical characterization of the aerosol generated by a heated tobacco product by untargeted screening. Anal. Bioanal. Chem. 2020, 412, 2675–2685. [Google Scholar] [CrossRef] [Green Version]
  25. Woelfel, K.; Hartman, T.G. Mass Spectrometry of the Acetal Derivatives of Selected Generally Recognized as Safe Listed Aldehydes with Ethanol, 1,2-Propylene Glycol and Glycerol. In Flavor Analysis; ACS Symposium Series; American Chemical Society: Washintong, DC, USA, 1998; Volume 705, pp. 193–210. [Google Scholar]
  26. Erythropel, H.C.; Davis, L.M.; de Winter, T.M.; Jordt, S.E.; Anastas, P.T.; O’Malley, S.S.; Krishnan-Sarin, S.; Zimmerman, J.B. Flavorant-Solvent Reaction Products and Menthol in JUUL E-Cigarettes and Aerosol. Am. J. Prev. Med. 2019, 57, 425–427. [Google Scholar] [CrossRef]
  27. Jabba, S.V.; Diaz, A.N.; Caceres, A.I.; Erythropel, H.C.; Kumar, V.; Varghese, S.; Simmerman, J.B.; Jordt, S.E. Chemical Adducts of Reactive Flavor Aldehydes Formed in E-cigarette Liquids Are Cytotoxic and Inhibit Mitochondrial Function in Respiratory Epithelial Cells. In Proceedings of the Society of Toxicology, Online, 12–26 March 2021. [Google Scholar]
  28. Erythropel, H.C.; Jabba, S.V.; DeWinter, T.M.; Mendizabal, M.; Anastas, P.T.; Jordt, S.E.; Zimmerman, J.B. Formation of flavorant-propylene Glycol Adducts With Novel Toxicological Properties in Chemically Unstable E-Cigarette Liquids. Nicotine Tob. Res. 2019, 21, 1248–1258. [Google Scholar] [CrossRef] [PubMed]
  29. Ward, A.M.; Yaman, R.; Ebbert, J.O. Electronic nicotine delivery system design and aerosol toxicants: A systematic review. PLoS ONE 2020, 15, e0234189. [Google Scholar] [CrossRef] [PubMed]
  30. Vreeke, S.; Korzun, T.; Luo, W.; Jensen, R.P.; Peyton, D.H.; Strongin, R.M. Dihydroxyacetone levels in electronic cigarettes: Wick temperature and toxin formation. Aerosol. Sci. Technol. 2018, 52, 370–376. [Google Scholar] [CrossRef] [PubMed] [Green Version]
  31. Bitzer, Z.T.; Goel, R.; Reilly, S.M.; Elias, R.J.; Silakov, A.; Foulds, J.; Muscat, J.; Richie, J.P., Jr. Effect of flavoring chemicals on free radical formation in electronic cigarette aerosols. Free Radic. Biol. Med. 2018, 120, 72–79. [Google Scholar] [CrossRef] [PubMed]
  32. Kosmider, L.; Spindle, T.R.; Gawron, M.; Sobczak, A.; Goniewicz, M.L. Nicotine emissions from electronic cigarettes: Individual and interactive effects of propylene glycol to vegetable glycerin composition and device power output. Food Chem. Toxicol. 2018, 115, 302–305. [Google Scholar] [CrossRef] [PubMed]
  33. Zhao, J.; Zhang, Y.; Sisler, J.D.; Shaffer, J.; Leonard, S.S.; Morris, A.M.; Qian, Y.; Bello, D.; Demokritou, P. Assessment of reactive oxygen species generated by electronic cigarettes using acellular and cellular approaches. J. Hazard. Mater. 2018, 344, 549–557. [Google Scholar] [CrossRef]
  34. Farsalinos, K.E.; Gillman, I.G. Carbonyl Emissions in E-cigarette Aerosol: A Systematic Review and Methodological Considerations. Front. Physiol. 2017, 8, 1119. [Google Scholar] [CrossRef]
  35. Klupinski, T.P.; Strozier, E.D.; Friedenberg, D.A.; Brinkman, M.C.; Gordon, S.M.; Clark, P.I. Identification of New and Distinctive Exposures from Little Cigars. Chem. Res. Toxicol. 2016, 29, 162–168. [Google Scholar] [CrossRef] [PubMed] [Green Version]
  36. Arndt, D.; Wachsmuth, C.; Buchholz, C.; Bentley, M. A complex matrix characterization approach, applied to cigarette smoke, that integrates multiple analytical methods and compound identification strategies for non-targeted liquid chromatography with high-resolution mass spectrometry. Rapid Commun. Mass Spectrom. 2020, 34, e8571. [Google Scholar] [CrossRef] [PubMed] [Green Version]
  37. Klupinski, T.P.; Strozier, E.D.; Makselan, S.D.; Buehler, S.S.; Peters, E.N.; Lucas, E.A.; Casbohm, J.S.; Friedenberg, D.A.; Landgraf, A.J.; Frank, A.J.; et al. Chemical characterization of marijuana blunt smoke by non-targeted chemical analysis. Inhal. Toxicol. 2020, 32, 177–187. [Google Scholar] [CrossRef] [PubMed]
  38. Holt, A.K.; Poklis, J.L.; Cobb, C.O.; Peace, M.R. The Identification of Gamma-Butyrolactone in JUUL Liquids. J. Anal. Toxicol. 2021. [Google Scholar] [CrossRef] [PubMed]
  39. Miller, J.H.; Shah, N.H.; Noe, M.R.; Agnew-Heard, K.A.; Gardner, W.P.; Pithawalla, Y.P. Non-targeted analysis using gas chromatography mass spectrometry for evaluation of chemical composition of e-vapor products. In Proceedings of the CORESTA, Online, 12 October–12 November 2020. [Google Scholar]
  40. Rawlinson, C.; Martin, S.; Frosina, J.; Wright, C. Chemical characterisation of aerosols emitted by electronic cigarettes using thermal desorption–gas chromatography–time of flight mass spectrometry. J. Chromatogr. A 2017, 1497, 144–154. [Google Scholar] [CrossRef] [PubMed]
  41. Herrington, J.S.; Myers, C. Electronic cigarette solutions and resultant aerosol profiles. J. Chromatogr. A 2015, 1418, 192–199. [Google Scholar] [CrossRef] [PubMed] [Green Version]
  42. Xiao, Z.; Yu, D.; Niu, Y.; Chen, F.; Song, S.; Zhu, J.; Zhu, G. Characterization of aroma compounds of Chinese famous liquors by gas chromatography-mass spectrometry and flash GC electronic-nose. J. Chromatogr. B Anal. Technol. Biomed. Life Sci. 2014, 945–946, 92–100. [Google Scholar] [CrossRef]
  43. Mehari, B.; Redi-Abshiro, M.; Chandravanshi, B.S.; Combrinck, S.; McCrindle, R.; Atlabachew, M. GC-MS profiling of fatty acids in green coffee (Coffea arabica L.) beans and chemometric modeling for tracing geographical origins from Ethiopia. J. Sci. Food Agric. 2019, 99, 3811–3823. [Google Scholar] [CrossRef]
  44. Zhang, H.; Li, Y.; Mi, J.; Zhang, M.; Wang, Y.; Jiang, Z.; Hu, P. GC-MS Profiling of Volatile Components in Different Fermentation Products of Cordyceps Sinensis Mycelia. Molecules 2017, 22, 1800. [Google Scholar] [CrossRef] [PubMed] [Green Version]
  45. Wang, Y.; Zhao, J.; Xu, F.; Wu, X.; Hu, W.; Chang, Y.; Zhang, L.; Chen, J.; Liu, C. GC-MS, GC-O and OAV analyses of key aroma compounds in Jiaozi Steamed Bread. Grain Oil Sci. Technol. 2020, 3, 9–17. [Google Scholar] [CrossRef]
  46. Stupak, M.; Goodall, I.; Tomaniova, M.; Pulkrabova, J.; Hajslova, J. A novel approach to assess the quality and authenticity of Scotch Whisky based on gas chromatography coupled to high resolution mass spectrometry. Anal. Chim. Acta 2018, 1042, 60–70. [Google Scholar] [CrossRef]
  47. Angioni, A.; Pintore, G.A.; Caboni, P. Determination of wine aroma compounds by dehydration followed by GC/MS. J. AOAC Int. 2012, 95, 813–819. [Google Scholar] [CrossRef] [PubMed]
  48. Krüsemann, E.J.Z.; Visser, W.F.; Cremers, J.W.J.M.; Pennings, J.L.A.; Talhout, R. Identification of flavour additives in tobacco products to develop a flavour library. Tob. Control 2018, 27, 105. [Google Scholar] [CrossRef] [PubMed]
  49. Tahri, K.; Duarte, A.A.; Carvalho, G.; Ribeiro, P.A.; da Silva, M.G.; Mendes, D.; El Bari, N.; Raposo, M.; Bouchikhi, B. Distinguishment, identification and aroma compound quantification of Portuguese olive oils based on physicochemical attributes, HS-GC/MS analysis and voltammetric electronic tongue. J. Sci. Food Agric. 2018, 98, 681–690. [Google Scholar] [CrossRef] [PubMed]
  50. Pagano, T.; DiFrancesco, A.G.; Smith, S.B.; George, J.; Wink, G.; Rahman, I.; Robinson, R.J. Determination of Nicotine Content and Delivery in Disposable Electronic Cigarettes Available in the United States by Gas Chromatography-Mass Spectrometry. Nicotine Tob. Res. 2015, 18, 700–707. [Google Scholar] [CrossRef] [PubMed] [Green Version]
  51. Available online: https://www.nist.gov/programs-projects/nist20-updates-nist-tandem-and-electron-ionization-spectral-libraries (accessed on 18 August 2021).
  52. Crosswhite, M.; Jeong, L.; Yang, C.; Jameson, B.; Oldham, M.; Cook, D.; Gillman, I.G. Comprehensive Evaluation of Aerosol Constituents from JUUL Virginia Tobacco 5.0% Using Non-Targeted Analysis: LC-HRMS Analysis of E-Vapor Aerosol, Data Acquisition and Processing. In Proceedings of the North Carolina Local Section of the American Chemical Society, Online, 10 November 2020. [Google Scholar]
  53. Sobus, J.R.; Grossman, J.N.; Chao, A.; Singh, R.; Williams, A.J.; Grulke, C.M.; Richard, A.M.; Newton, S.R.; McEachran, A.D.; Ulrich, E.M. Using prepared mixtures of ToxCast chemicals to evaluate non-targeted analysis (NTA) method performance. Anal. Bioanal. Chem. 2019, 411, 835–851. [Google Scholar] [CrossRef] [PubMed]
  54. Caesar, L.K.; Kvalheim, O.M.; Cech, N.B. Hierarchical cluster analysis of technical replicates to identify interferents in untargeted mass spectrometry metabolomics. Anal. Chim. Acta 2018, 1021, 69–77. [Google Scholar] [CrossRef] [PubMed]
  55. Bruni, R.; Brighenti, V.; Caesar, L.K.; Bertelli, D.; Cech, N.B.; Pellati, F. Analytical methods for the study of bioactive compounds from medicinally used Echinacea species. J. Pharm. Biomed. Anal. 2018, 160, 443–477. [Google Scholar] [CrossRef] [PubMed]
  56. Flavor Ingredient Library. Available online: https://www.femaflavor.org/flavor-library (accessed on 28 April 2021).
  57. Jenke, D.; Carlson, T. A Compilation of Safety Impact Information for Extractables Associated with Materials Used in Pharmaceutical Packaging, Delivery, Administration, and Manufacturing Systems. PDA J. Pharm. Sci. Technol. 2014, 68, 407–455. [Google Scholar] [CrossRef] [PubMed]
  58. Jenke, D. Appendix: Materials Used in Pharmaceutical Constructs and their Associated Extractables. In Compatibility of Pharmaceutical Products and Contact Materials; John Wiley & Sons, Inc.: Hoboken, NJ, USA, 2009; pp. 347–370. [Google Scholar]
  59. Cederberg, T.; Jensen, L.K. Siloxanes in Silicone Products Intended for Food Contact: Selected Samples from the Norwegian Market in 2016; National Food Institute, Technical University of Denmark: Copenhagen, Denmark, 2017. [Google Scholar]
  60. Vapour Products—Routine Analytical Vaping Machine—Definitions and Standard Conditions; International Organization for Standardization 20768:2018(E); ISO: Geneva, Switzerland, 2018.
  61. Belushkin, M.; Tafin Djoko, D.; Esposito, M.; Korneliou, A.; Jeannet, C.; Lazzerini, M.; Jaccard, G. Selected Harmful and Potentially Harmful Constituents Levels in Commercial e-Cigarettes. Chem. Res. Toxicol. 2020, 33, 657–668. [Google Scholar] [CrossRef] [PubMed] [Green Version]
  62. Statistical Methods for Research Workers. J. R. Stat. Soc. 1926, 89, 144–145. [CrossRef]
  63. Fraley, N.; Anderson, E.; Almond, C. Glycidol in Tobacco Heated Products. In Proceedings of the TSRC, Leesburg, VA, USA, 15–18 September 2019. [Google Scholar]
  64. Gilman, G.; Johnson, M.; Martin, A.; Misra, M. HPHC Analysis of Eight Flavors of a Temperature-Regulated Nicotine Salt-Based ENDS Product. In Proceedings of the 5th Global Forum on Nicotine, Warsaw, Poland, 14 June 2018. [Google Scholar]
  65. 65. RJ Reynolds Tobacco Co. Chemical and Biological Studies on New Cigarette Prototypes that Heat Instead of Burn Tobacco; RJ Reynolds Tobacco Company: Winston-Salem, NC, USA, 1988; pp. 144–175. [Google Scholar]
  66. Baker, R.R.; Bishop, L.J. The pyrolysis of tobacco ingredients. J. Anal. Appl. Pyrolysis 2004, 71, 223–311. [Google Scholar] [CrossRef]
  67. King, B.; Borland, R.; Morphett, K.; Gartner, C.; Fielding, K.; O’Connor, R.J.; Romijnders, K.; Talhout, R. ‘It’s all the other stuff!’ How smokers understand (and misunderstand) chemicals in cigarettes and cigarette smoke. Public Underst. Sci. 2021, 6, 777–796. [Google Scholar] [CrossRef]
  68. Alston, B. Measurement of temperature regulation performance of the JUUL nicotine salt pod system. In Proceedings of the CORESTA, Hamburg, Germany, 6–10 October 2019. [Google Scholar]
  69. Salamanca, J.C.; Meehan-Atrash, J.; Vreeke, S.; Escobedo, J.O.; Peyton, D.H.; Strongin, R.M. E-cigarettes can emit formaldehyde at high levels under conditions that have been reported to be non-averse to users. Sci. Rep. 2018, 8, 7559. [Google Scholar] [CrossRef] [PubMed]
  70. Kellogg, J.J.; Graf, T.N.; Paine, M.F.; McCune, J.S.; Kvalheim, O.M.; Oberlies, N.H.; Cech, N.B. Comparison of Metabolomics Approaches for Evaluating the Variability of Complex Botanical Preparations: Green Tea (Camellia sinensis) as a Case Study. J. Nat. Prod. 2017, 80, 1457–1466. [Google Scholar] [CrossRef] [PubMed] [Green Version]
  71. Saha, S.P.; Bhalla, D.K.; Whayne, T.F., Jr.; Gairola, C. Cigarette smoke and adverse health effects: An overview of research trends and future needs. Int. J. Angiol. 2007, 16, 77–83. [Google Scholar] [CrossRef] [Green Version]
  72. Talih, S.; Salman, R.; El-Hage, R.; Karam, E.; Salam, S.; Karaoghlanian, N.; El-Hellani, A.; Saliba, N.; Shihadeh, A. A comparison of the electrical characteristics, liquid composition, and toxicant emissions of JUUL USA and JUUL UK e-cigarettes. Sci. Rep. 2020, 10, 7322. [Google Scholar] [CrossRef] [PubMed]
Figure 1. Technical Coverage of Constituent Properties in JUUL Aerosol Chemical Space.
Separations 08 00130 g001
Figure 2. Examples of Possible Chemical Pathways Used for Rationalizing a Reaction Product.
Separations 08 00130 g002
Figure 3. % Total Mass of Aerosol Constituents Detected by NTA Grouped by Type for Aerosol of VT3 Under the Intense Puffing Regimen.
Separations 08 00130 g003
Figure 4. Comparison of the Compounds Detected in VT3 Aerosol to Compounds Found in Smoke of Combustible Cigarettes (Circles are to Scale).
Separations 08 00130 g004
Figure 5. % Total Mass of Constituents by Type in Aerosol of VT5 Under the Intense Puffing Regimen.
Separations 08 00130 g005
Figure 6. Comparison of the Compounds Detected in VT5 Aerosol to Compounds Found in Smoke of Combustible Cigarette (Circles are to Scale).
Separations 08 00130 g006
Table 1. Classification of Rational Compound Origin Identification.
Group NumberGroup Definition
1Flavorants
2HPHCs listed in Tobacco Products and Tobacco Smoke: Established List
3Extractables and leachables
4Any compound resulting from a chemical reaction
5Compounds unable to be identified/rationalized
Table 2. Aerosol Generation for Samples.
GroupPuff Volume (mL)Duration (s)Puff Interval (s)Puff Count (n)
VT3
intense110630225
non-intense55330315
VT5
intense110630225
non-intense55330320
Table 3. Confidence Levels of Compounds Identified by LC–HRMS NTA.
ConfirmedComparison to standard reference material
HighHigh mass accuracy measurement generated a molecular formula which was consistent with a rationalized identification
MediumAutomated search of a library with MS/MS spectral peaks in common
LowManual search of online library for best spectral match
NANot applicable
Table 4. Confidence Levels of Compounds Identified by GC–MS NTA.
ConfirmedIdentification confirmed by comparison to standard reference material by high and unit mass resolution mass spectrometry
HighA mass spectrum match factor score of 850 to 1000
MediumA mass spectrum match factor score of 700 to 849
LowA mass spectrum match factor score of 500 to 699
NANot Applicable
Table 5. Summary of Non-Targeted Analyses of VT3 Aerosol Using the Intense Puffing Regimen.
Group
Number
Group NameAverage Mass (µg/g)Average % Aerosol Mass Number of Compounds% Number of Compounds
1Flavorants1315.01315 × 10−41316
2HPHCsNDNDNDND
3Extractables and Leachables30.730.7 × 10−456
4Reaction Products970.9970.9 × 10−45570
5Not Rationalized16.616.6 × 10−468
Total2333.22333.2 × 10−479100
ND = not detected.
Table 6. Summary of Non-Targeted Analyses of VT3 Aerosol Using the Non-Intense Puffing Regimen.
Group
Number
Group NameAverage Mass (µg/g)Average % Aerosol MassNumber of Compounds% Number of Compounds
1Flavorant2014.32014.3 × 10−41116
2HPHCsNDNDNDND
3Extractables and Leachables46.046.0 × 10−457
4Reaction Products958.8958.8 × 10−45275
5Not Rationalized0.80.8 × 10−411
Total3019.93019.9 × 10−469100
ND = not detected.
Table 7. Summary of Non-Targeted Analyses of VT3 Aerosol Using Both Puffing Regimens.
Group
Number
Group NameIntense Number of Compounds Non-Intense Number of Compounds Number of Common CompoundsAverage Mass (µg/g) IntenseAverage Mass (µg/g) Non-Intense
1Flavorant1311111315.02014.3
2HPHCsNDNDNDNDND
3Extractables and Leachables55430.746.0
4Reaction Products555245970.9958.8
5Not Rationalized61016.60.8
Total7969602333.23019.9
ND = not detected.
Table 8. Compounds Exclusive to JUUL VT3 Aerosol Compared to Cigarette Smoke.
Group NameNumber of Compounds Unique to VT3 AerosolAverage Mass (µg/g)Average % Aerosol Mass
Flavorant11439.41439.4 × 10−4
HPHCsNDNDND
Extractables and Leachables432.932.9 × 10−4
Reaction Products48988.6988.6 × 10−4
Not Rationalized616.016.0 × 10−4
Total592476.92476.9 × 10−4
ND = not detected.
Table 9. Summary of Non-Targeted Analyses in VT5 Aerosol Using the Intense Puffing Regimen.
Group NumberGroup NameAverage Mass (µg/g)Average % Aerosol MassNumber of Compounds% Number of Compounds
1Flavorants975.9975.9 × 10−41315
2HPHCsNDNDNDND
3Extractables and Leachables41.841.8 × 10−434
4Reaction Products891.6891.6 × 10−46172
5Not Rationalized38.038.0 × 10−489
Total1947.21947.2 × 10−485100
ND = not detected.
Table 10. Summary of Non-Targeted Analyses in VT5 Aerosol Using the Non-Intense Puffing Regimen.
Group NumberGroup NameAverage Mass (µg/g)Average % Aerosol MassNumber of Compounds% Number of Compounds
1Flavorants983.7983.7 × 10−41216
2HPHCsNDNDNDND
3Extractables and Leachables38.138.1 × 10−434
4Reaction Products801.2801.2 × 10−45271
5Not Rationalized22.022.0 × 10−468
Total1844.91844.9 × 10-473100
ND = not detected.
Table 11. Summary of Non-Targeted Analyses in Aerosol for Virginia Tobacco 5.0% Using Two Puffing Regimens.
Group NumberGroup NameIntense Number of Compounds Non-Intense Number of Compounds Number of Common CompoundsAverage Mass (µg/g) IntenseAverage Mass (µg/g) Non-Intense
1Flavorants131212975.9983.7
2HPHCsNDNDNDNDND
3Extractables and Leachables33241.838.1
4Reaction Products615249891.6801.2
5Not Rationalized86438.022.0
Total 8573671947.21844.9
ND = not detected.
Table 12. Compounds Exclusive to JUUL VT5 Aerosol Compared to Cigarette Smoke.
Group NameIntense Number of Compounds Average Mass (µg/g) from Higher of Intense of Non-IntenseAverage % Aerosol Mass
Flavorants1423.1423.1 × 10−4
HPHCsNDNDND
Extractables and Leachables236.636.6 × 10−4
Reaction Products47823.4823.4 × 10−4
Not Rationalized938.738.7 × 10−4
591321.81321.8 × 10−4
Publisher’s Note: MDPI stays neutral with regard to jurisdictional claims in published maps and institutional affiliations.

