Article

Distribution and Estrogenic Risk of Alkylphenolic Compounds, Hormones and Drugs Contained in Water and Natural Surface Sediments, Morelos, Mexico

by
José Gustavo Ronderos-Lara
1,
Hugo Saldarriaga-Noreña
1,*,
Mario Alfonso Murillo-Tovar
1,2,
Laura Alvarez
1,
Josefina Vergara-Sánchez
3,
Victor Barba
1 and
Jorge Antonio Guerrero-Alvarez
1
1
Centro de Investigaciones Químicas, Instituto de Investigación en Ciencias Básicas y Aplicadas, Universidad Autónoma del Estado de Morelos, Av. Universidad 1001, Cuernavaca 62209, Mexico
2
Cátedras, Consejo Nacional de Ciencia y Tecnología, Av. Insurgentes Sur 1582, Colonia Crédito Constructor, Del. Benito Juárez, Mexico City 03940, Mexico
3
Laboratorio de Análisis y Sustentabilidad Ambiental, Escuela de Estudios Superiores de Xalostoc, Universidad Autónoma del Estado de Morelos, Ayala 62715, Mexico
*
Author to whom correspondence should be addressed.
Submission received: 29 November 2021 / Revised: 30 December 2021 / Accepted: 31 December 2021 / Published: 16 January 2022
(This article belongs to the Section Environmental Separations)

Abstract

:
This study evaluated the distribution and potential estrogenic risk of the presence of bisphenol A (BPA), 4-nonylphenol (4NP), naproxen (NPX), ibuprofen (IBU), 17-β-estradiol (E2) and 17-α-ethinylestradiol (EE2) in water and sediments of the Apatlaco river micro-basin (Morelos, Mexico). The concentration of the determined compounds ranged between <LOD to 86.40 ng·L−1 and <LOD to 3.97 ng g−1 in water and sediments, respectively. The Log Kd distribution obtained (from 1.05 to 1.91 L Kg−1) indicates that the compounds tend to be adsorbed in sediments, which is probably due to the hydrophobic interactions confirmed by the significant correlations determined mainly between the concentrations and parameters of total organic carbon (TOC), total suspended solids (TSS), biological oxygen demand (BOD5) and chemical oxygen demand (COD). Of five sites analyzed, four presented estrogenic risk due to the analyzed endocrine-disrupting compounds (EEQE2 > 1 ng·L−1).

Graphical Abstract

1. Introduction

In the last two decades, the presence of emerging compounds in the environment has raised great health concerns [1,2,3]. In surface water bodies, emerging compounds have been linked to feminization and other hormonal alterations in aquatic organisms [4]. It has also been found that they can cause dysfunction in the germination of vegetables [5].
Knowledge of the transport mechanisms and distribution phenomena that these pollutants experience in surface water bodies, as well as their destination in the environment, can contribute to determining the potential risk they pose to the environment and human health. However, their mobility between different environmental compartments can be affected by their properties and involve the influence of various physicochemical factors [6], such as organic-matter content, temperature, pH, conductivity, content of microorganisms and flow-rate current, among others [7,8].
The partition coefficient (Log Kd) is a parameter calculated between the concentration of the compound of interest detected in water and in sediments, and it is used to determine the transport and destination of pollutants in the environment. Log Kd values > 0 indicate that the compound has a tendency to be adsorbed on organic matter due to the hydrophobic interactions of the compounds. This allows the compounds retained in sediments to biomagnify their concentration through the trophic chain. The log Kd value of a compound can vary according to various physicochemical parameters of the environment. Since it depends on these, if water-compound-sediment interactions reach equilibrium [9,10], the presence in the environment of certain endocrine-disrupting compounds (EDCs) can cause different estrogenic damages in aquatic organisms. Some effects caused by these compounds are feminization in fish, as well as alteration in vitalogenin levels [11] and alterations in sexual organs [12].
The purpose of this work was to examine the distribution as a partition coefficient Log Kd and the potential estrogenic risk due to the presence of two phenolic compounds, (bisphenol A (BPA) and 4-nonylphenol (4NP)), 2 drugs, (Ibuprofen (IBU) and naproxen (NPX)) and 2 hormones (17-β estradiol (E2), and 17-α ethinylestradiol (EE2)) between water and sediment from the Apatlaco river micro-basin in Morelos, Mexico.

2. Materials and Methods

2.1. Standards and Reagents

17α-ethinyl estradiol (EE2 ≥ 98%), 17β-estradiol (E2 ≥ 98%), 4-nonylphenol (4NP ≥ 99%) and ibuprofen (IBU ≥ 98%) standards were obtained from Sigma-Aldrich. B = Bisphenol A standard (BPA ≥ 99%) was purchased from Supelco, (St. Louis, MO, USA) while the naproxen was obtained from Fluka (St. Louis, MO, USA) (NPX ≥ 99.9%). For its part, deuterated chrysene (Chry-D12) was obtained from Supelco (St. Louis, MO, USA). The solvents acetone (≥99.9%) and methanol (≥99.9%) used for the conditioning of material, as well as in the preparation of standards and environmental samples, were HPLC-grade (Meyer 99.9%). The solvents used were previously filtered under vacuum conditions through Pall brand nylon, 0.2 µm and 47 mm in diameter. For the extraction of water and sediment samples, Chromabond 500 mg Solid Phase Extraction (EFS) cartridges (Macherey-Nagel, C18, encapped, Düren, Germany) were used.
For the derivatization, N, O-bis (trimethylsilyl) -trifluoroacetamide + trimethylchlorosilane (BSTFA + TMCS, 99:1, Supelco, St. Louis, MO, USA) and Pyridine (99.8%, Sigma-Aldrich, St. Louis, MO, USA) were used.

2.2. Description of the Sites and Sampling

The Apatlaco river micro-basin is the most important body of surface water in the state of Morelos, Mexico. This basin crosses through 10 different municipalities before reaching the State of Guerrero and emptying into the Pacific Ocean. During its course, its waters and sediments are used in planting fields, as well as for recreational activities.
Water and sediment samples were taken from five different points of the Apatlaco river micro-basin (Figure 1). The physicochemical parameters of pH, conductivity, dissolved oxygen and temperature were measured in situ during each sampling. The samples were immediately transported to the laboratory, maintaining a temperature ≤ 4 °C.

2.3. Sample Preparation

2.3.1. Water Samples

Amounts of 50 mL of sample were passed through Solid Phase Extraction (SPE) cartridges, applying a flow of 4–6 mL min−1. Prior to extraction, the stationary phase was conditioned with 6 mL of acetone-MeOH (3:2), 6 mL of MeOH and 6 mL of deionized water. At the end of the extraction, the stationary phase was washed with 10 mL of deionized water and kept under vacuum until the complete elimination of water was observed. Compounds retained in the stationary phase were eluted with 10 mL of acetone-MeOH (3:2). The obtained eluate was evaporated to approximately 0.5 mL in a rotary evaporator. The remainder was filtered through 0.45 µm nylon acrodisc syringe filter, brought to dryness by direct exposure to N2 (99.9999%) and resuspended in 50 μL of BSTFA + TMCS (99:1) + 50 μL of pyridine for the derivatization of the compounds of interest. Subsequently, the vials were subjected to a water bath at 70 °C for 40 min. After this reaction time, they were left to rest until reaching room temperature, at which point 20 µL of chry-D12 was added to each vial, for a final volume of 120 µL (1500 ng·mL −1 final concentration).

2.3.2. Sediment Samples

Sediment samples were placed inside a fume hood and isolated from light until dry. Subsequently, the sediments were crushed in porcelain mortar and sieved through a 2.0 mm mesh. The samples were stored in amber glass flasks under refrigeration (≤4 °C). For extraction, 10 g of sediment was weighed and extracted by ultrasound-assisted extraction, followed by solid-phase extraction (UAE-EFS) for 20 min with 10 mL of acetone-MeOH (3:2). At the end of the extraction time, the samples were centrifuged at 4500 rpm for 5 min until complete separation of the liquid-solid phases was obtained. The liquid phase was collected, and the extraction was repeated two more times, joining the liquid phase obtained in each extraction. Subsequently, the liquid phase was reduced to approximately 0.5 mL in a rotary evaporator. The remainder obtained was resuspended in 1 mL of acetone and made up to 50 mL with deionized water. The sample was then extracted using EFS and processed as indicated in the previous section.

2.3.3. Evaluation of Extraction Efficiency

The efficiency of the extraction methodology was evaluated through the fortification of three types of natural surface water and sediments collected in springs and rivers that are mainly impacted by direct discharges from domestic drains and effluents from wastewater treatment. Before extraction, the water samples (50 mL) were adjusted to pH ≈ 7, while the sediment samples (10 g) were dried at room temperature and sieved. The water and sediment samples were enriched with a solution containing a mixture of compounds (IBU, BPA, NX, 4NP, E2 and EE2) at two concentration levels (80 and 160 ng mL−1). The repeatability was evaluated at the lowest level of the concentration and the reproducibility at the two levels. Briefly, repeatability was determined by repeating the addition of the standard concentration of 80 ng mL−1 twice, while reproducibility was performed by adding the two concentration levels (80 and 160 ng mL−1). Each level was repeated twice, and with the average of each level, the reproducibility was estimated.

2.3.4. Chromatographic Analysis

Sample analysis was performed on an Agilent model 6890N chromatograph coupled to an Agilent model 7000D mass spectrometer (Santa Clara, CA, USA). The injector temperature was kept at 280 °C. In each analysis, 1 μL of sample was injected in splitless mode. The stripping gas was Helium (99.999%), using a flow of 1 mL min−1. Separation of the compounds was carried out on an Agilent HP5-MS column, 30 m long × 0.25 mm in diameter, with an internal coating of 0.25 μm. The temperature of the column started at 120 °C, maintaining for 2 min. Subsequently, temperature was increased by 15 °C every minute until reaching 250 °C, with increments of 5 °C per minute until reaching 300 °C. The transfer line from the chromatograph to the mass spectrometer was kept at 310 °C. Ionization of the molecules was carried out by means of electronic impact (EI) using an ionization energy of 70 eV. The ionization source was kept at 200 °C (Table 1).
The repeatability of the injections was monitored as the variation calculated through the response obtained for Chry-D12 between injections of calibration solutions and environmental samples. In all cases, the variation obtained in the Chry-D12 response was less than 5%.

2.3.5. Partition Coefficient (Log Kd)

The partition coefficient of drugs and EDCs between water and sediment was calculated as the Log Kd of the quotient obtained between the concentration determined in sediment and water according to the following equation:
Log   K d = C s C w
where Cs is the average concentration of the compound determined in the sediment samples and Cw is the average concentration of the compound determined in the water samples.

2.3.6. Estrogenicity Equivalent to E2

Estrogenic activity (EEQE2) in water and sediments was determined by means of the estrogenicity factor equivalent to E2 (EEF) and the environmental concentration measured for each compound (MEC). According to the Environmental Protection Agency (US-EPA), estrogenic risk is significant when the concentration of estrogenic compounds is greater than 1 ng·L−1. Determination of EEQE2 in both matrices was determined only for those compounds with EEFi values reported by Vega-Morales et al., 2013 [13] (4NP, BPA, E2 and EE2). The EEQE2 value in water was determined with Equation (2), while the EEQE2 value for sediments was determined with Equation (3), by converting the estrogenic activity of the selected compounds to their corresponding EEQE2 in sediments [14,15,16].
EEQ E 2 ( ng   L 1 ) = EEF i MEC i
EEQ E 2 ( ng   L 1 ) sediment = 1000 MECi Sediment EEF i K oc ,   i TOC   ( % )
EEF i = estrogenicity factor equivalent to E2; MEC = measured environmental concentration for each compound; TOC = total organic carbon; K oc, i = normalized partition coefficient for organic carbon; MECi Sediment = concentration measured in the environment

3. Results and Discussion

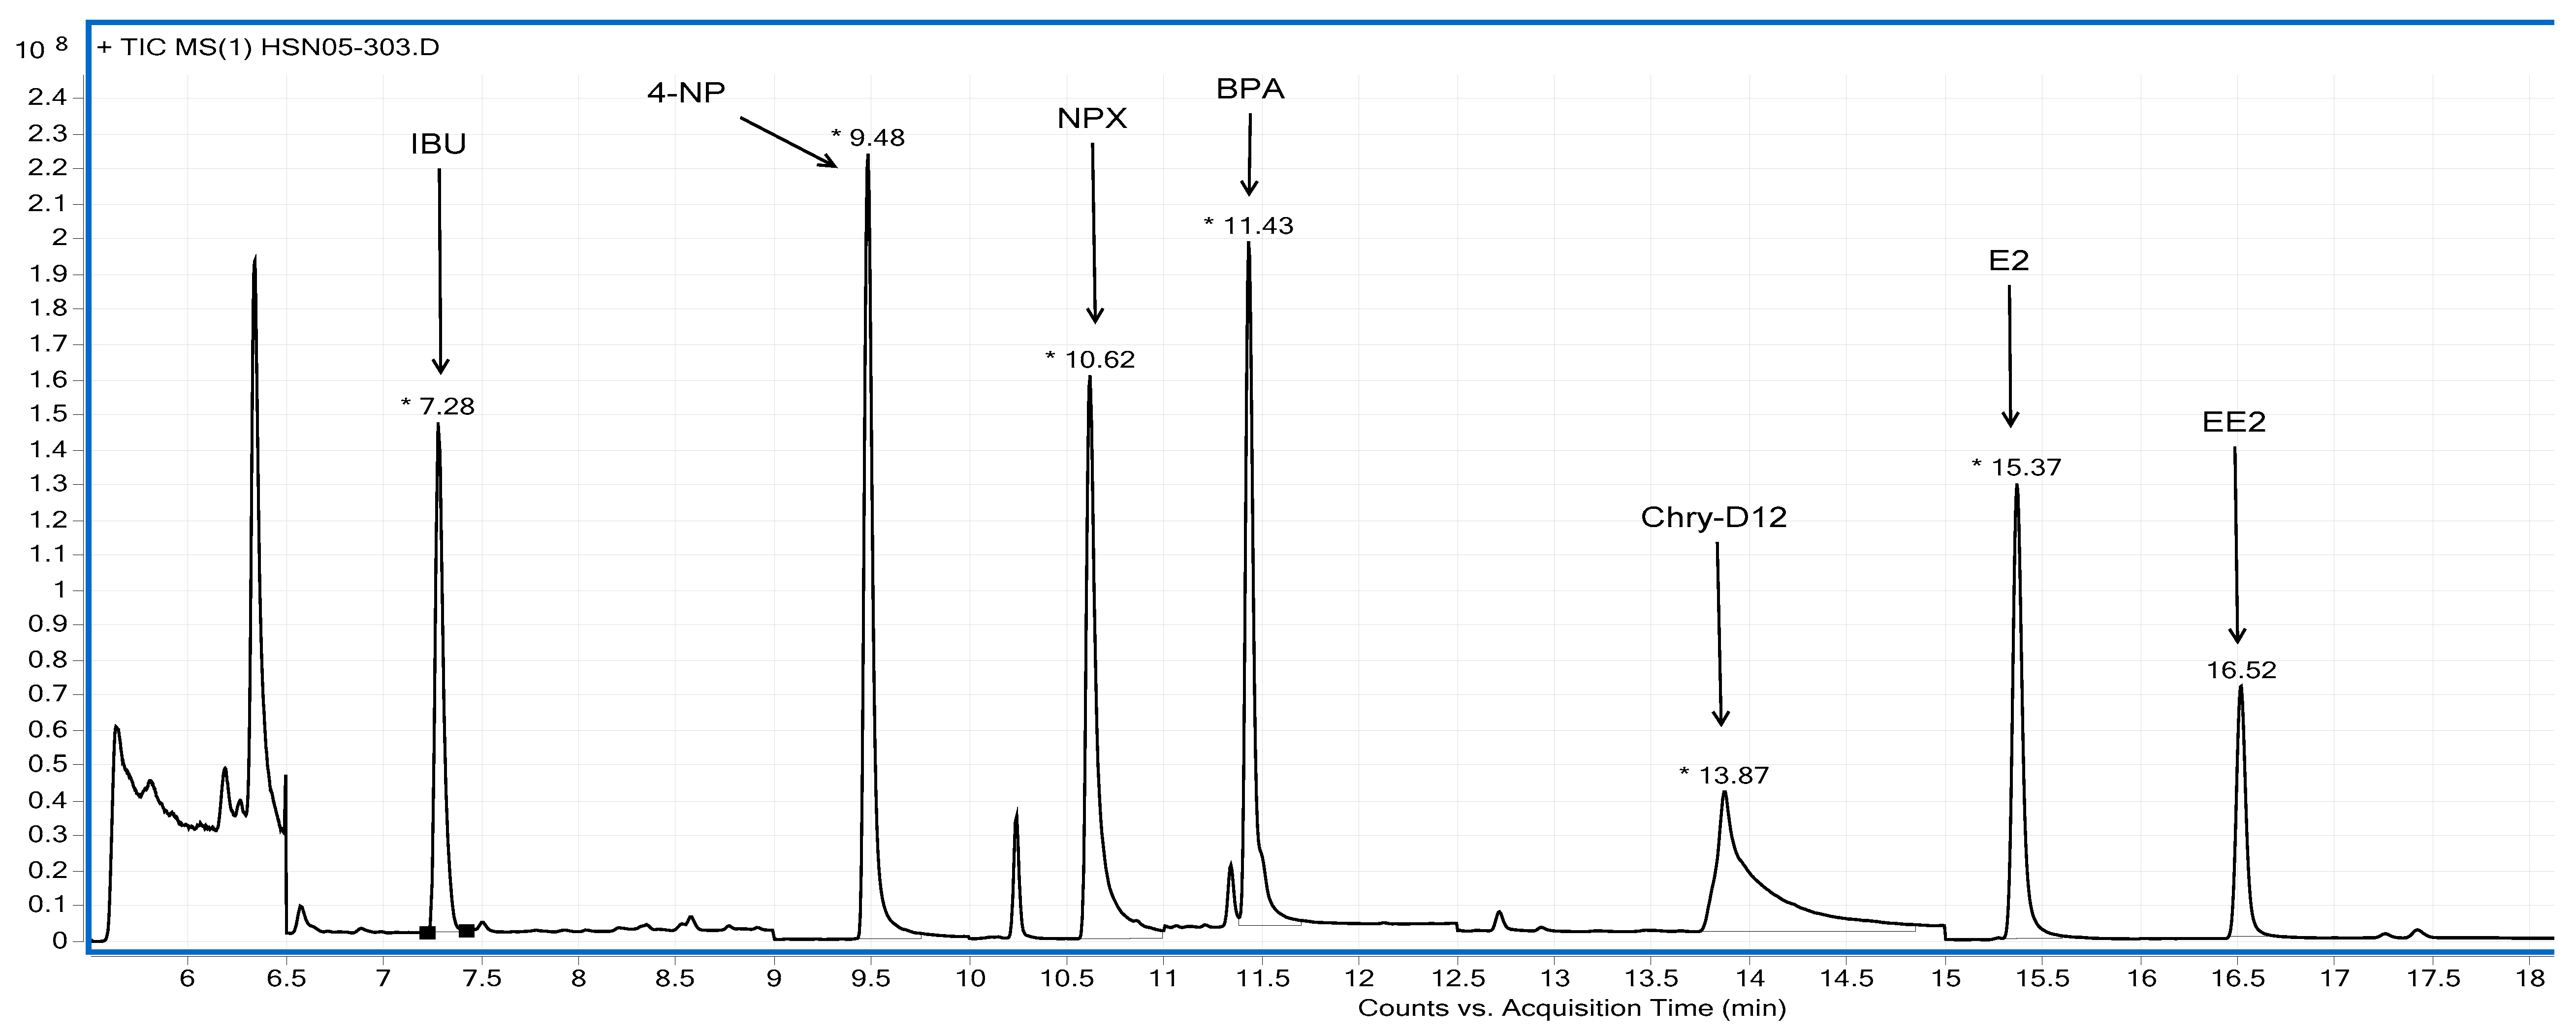
3.1. Chromatographic Method Optimization

The chromatogram obtained for the analysis of the compounds (Figure 2) shows the correct separation of the compounds, indicating that the method is selective. The chromatographic equipment was calibrated using seven different concentration levels (0–320 ng·mL−1). The correlation coefficient (r) obtained for all compounds ranged between 0.9851 (E2) and 0.9991 (IBU). The detection limits obtained were 13.73, 0.26, 1.02, 0.41, 0.3 and 0.12 ng·mL−1 for IBU, 4NP, NPX, BPA, E2 and EE2, respectively (Table 2).

3.2. Extraction Efficiency

The recovery percentages obtained through the enrichment of spring samples ranged between 70 (IBU) and 83% (4NP), respectively. In the samples of water impacted by domestic drains, the recovery percentages were between 67 (BPA) and 88% (4NP). In the case of the samples impacted by discharges from wastewater treatment plants, the extraction percentages ranged between 64 (E2) and 97%, (EE2).
On the other hand, in the validation of the sediment samples taken in the same places where the water was sampled, the obtained recovery percentages ranged between 61 (4NP) and 86% (EE2) in the spring samples. For the samples impacted by domestic drains, the recovery percentages ranged between 49 (4NP) and 112% (NPX), while in the samples impacted by effluents from wastewater treatment plants, the recovery percentage ranged between 48 (BPA) and 111% (E2) (Table 3). The precision of the method in terms of the relative standard deviation (RSD) was below 20% in all cases, which indicates that the SPE method is suitable for application to surface water and sediment samples obtained from different sources (Table 3).
The recovery percentages obtained in each of the different enriched matrices were used to correct the concentration in the real samples.

3.3. Concentration Levels of Drugs and ECDs in Environmental Samples of Surface-Water Sediments

All compounds of interest were detected in the analyzed water and sediment samples. In the water samples, the concentrations ranged between <LOD to 86.40 ng·L−1, while in sediment they were between <LOD to 3.97 ng g−1. NPX (50.90 ng g−1) and alkylphenol BPA (1.04 ng g−1) were the compounds with the highest average concentration in both matrices (Table 4). In water, the accumulated average concentration of the compounds at the different sites decreased in the following order: JTPC > TMC1 > TTL > TMC2 > CPTC. In sediment, the accumulated average concentration of the compounds at the different sites decreased in the following order: JTPC > TMC1 = TTL > TMC2 > CPTC. In both matrices, the site with the highest average accumulated concentration of compounds was JTPC. This behavior is probably due to the fact that this site is mainly impacted by effluents from two industrial and domestic wastewater treatment plants. Meanwhile, in the water and sediment samples corresponding to the CPTC site, only alkylphenols (4NP, BPA) and natural hormone (E2) were detected in concentrations <LOD. At this site, drugs and the synthetic hormone EE2 were not detected, probably because this site is in a recreational park and is, to some extent, under the care of government authorities.
It is well known that sewage treatment plants do not remove 100% of compounds, such as drugs and hormones [17]. The presence of various compounds in sediments depends on different physicochemical factors [8,9], so it is difficult to determine whether the analyte-sediment interactions in the environment are kept in equilibrium or if analytes are constantly undergoing adsorption or desorption processes.

3.4. Comparisons of Concentrations of Compounds Detected with Other Studies

Table 5 shows a comparison of the concentration levels of the compounds of interest detected in water and sediments by different studies carried out in other places. The concentrations observed in the present study for IBU and NPX in water were up to two orders of magnitude below those reported by Rivera-Jaimes et al., 2018 [18] in the same basin. These differences can probably be explained by the fact that the samplings were carried out in the tributary of a wastewater treatment plant [17]. In the case of hormones E2 and EE2, Calderón-Moreno et al., 2019 [19] reported similar concentrations in the Cuautla river basin in the State of Morelos, Mexico. However, for 4NF and BPA, they found concentrations of up to one and three orders of magnitude higher than those determined in this study, which probably suggests a higher incidence of industrial discharge, mainly from the manufacture of plastics and cleaning products, respectively [20]. The results observed in the present study for IBU and NPX were similar to those reported in the Yangtze River [20], while for E2 and EE2, the concentrations were higher than those determined in the Apatlaco river basin. Meanwhile, in a study carried out in the Tagus River (Spain/Portugal), concentrations were reported to be higher than those observed in the Apatlaco river basin for IBU and NPX. Meanwhile, for E2 and EE2, similar concentrations to those determined in this study, were reported [21,22].
On the other hand, for sediments, the concentrations detected in the present study for IBU and NPX were lower than those reported in the Tula River, Hidalgo, Mexico [23], which suggests a greater amount of domestic discharge. Meanwhile, the concentrations observed for IBU, NPX, 4NP, E2 and EE2 in the present study are similar to those reported in sediments in the Mbokodweni River, Africa [7], in the Three Gorges Reservoir region (China) [24] and different rivers in Italy [25].

3.5. Log Kd Distribution of Drugs and CDEs between Water and Sediment

Table 6 presents a summary of the distribution values (Log Kd partition coefficient) obtained for each of the compounds analyzed in this study, as well as comparisons with other similar studies.
All the values observed for Log Kd in this work are above unity (Log Kd > 1), which suggests that the compounds are adsorbed to a greater extent in sediments. This behavior was similar to that observed by Gong et al., 2019 [26], in different matrices from the Zhujiang and Dongjiang rivers (China) for BPA, while E2 and EE2 concentrations were similar to those reported by Gomes et al., 2011 and Murillo-Torres et al., 2012 [27,28], in treated waters from the southeast of the United Kingdom and Tula, Mexico respectively. The Log Kd value obtained for 4NP is lower than that reported by Salgueiro-Gonzáles et al., 2015, in the Minho River [29]. For its part, IBU levels were similar to those reported by Agunbiade and Moodley et al. in 2016 in the Msunduzi River in southern Africa [30]. Meanwhile, NPX concentrations were lower those obtained by Mohd Amin et al., 2016 [31]. The differences observed in Log Kd values in the different studies are probably due to the differences in the physicochemical characteristics of the water and sediment samples, which affect the distribution of these compounds in both matrices.

3.6. Relationship between Drug and EDC Concentrations and Physicochemical Parameters

To determine the possible associations between the concentrations observed for each of the compounds and the determined physicochemical parameters, the Spearman correlation coefficient was used; the statistically significant correlations are described in Table 7.
In the water samples, there were strong correlations between BOD5 and COD with BPA (0.9272 and 0.9446), E2 (0.8783) and EE2 (0.9027 and 0.9552), which suggests the possible action of aquatic microorganisms in the degradation of such compounds; a similar behavior was reported by Gong et al., 2019 [26]. Likewise, significant positive correlations were observed between TOC and TS with IBU (0.8499 and 0.7996, respectively), 4NP (0.7528), NPX (0.7899), BPA (0.8503), E2 (0.8136) and EE2 (0.8423), indicating that the presence of these substances is associated with the amount of organic matter present in water and sediments.
On the other hand, in the sediment samples, at a confidence level p ≤ 0.05, significant positive correlations were found between IBU and SST (0.9373), 4NF and COD (0.8896), BPA with TOC (0.9246), BOD5 (0.9158) and COD (0.9880), and EE2 with TOC (0.8376), BOD5 (0.8990) and COD (0.9524), which confirms that the content of organic matter regulates the adsorption of these compounds in aqueous media. Meanwhile, a significant negative correlation was found between EE2 and dissolved oxygen (−0.7833), which may be indicative of increased biodegradation under aerobic conditions [26]. At this same level of probability, a significant positive correlation was found between IBU and conductivity (0.7632). According to the environment of the sampling sites, the presence of Al3+, Ca2+ and Mg2+ cations (not determined in this study) is likely, which can increase the “salting out” effect and reduce the solubility of IBU, which favors adsorption with sediments.

3.7. Estrogenicity and Ecological Risk

The risk of an aquatic organism being affected at the endocrine level can be determined by the risk of estrogenicity (EPA-US, 1997) [32]. The risk of estrogenicity can be studied as estrogenicity equivalent to the natural hormone Estradiol (E2) (EEQ = ng·L−1). If the EEQ value > 1 ng·L−1, the water body presents estrogenic risk (AC01769567 1996) [33]. Meanwhile, ecological risk estimates the level of risk to which aquatic organisms are subjected due to the presence of an estrogenic compound (Figure 3).
The estimated average estrogenic activity obtained in water for the studied sites was 6.92 ng·L−1. The estrogenic activity calculated for each site decreased in the following order: JTPC (25.47 ng·L−1) > TTL (4.10 ng·L−1) > TMC1 (2.60 ng·L−1) > TMC2 (1.95 ng·L−1) > CPTP (0.50 ng·L−1). The total EEQ value in water for each site (Σ EEQ ng·L−1) was calculated by taking into account 4NP, BPA, E2 and EE2. In the water samples, at four of the five analyzed sites (TTL, TMC1, TMC2 and JTPC), values of Σ EEQ > 1 ng·L−1 were found. At these sites, the greatest contribution of estrogenic activity was provided by the hormones E2 and EE2, which represents a high risk of causing estrogenicity in living organisms.
Table 8 shows some studies focused on the determination of the estrogenic risk in different rivers located in different parts of the world. The estrogenic-risk range (EEQ ng·L−1) determined in this work for water samples is up to an order of magnitude greater than that determined in the Cuautla river basin [19] and in the Yeongsan and Seomjin rivers, located in South Korea [34].
Meanwhile, the values observed for Σ EEQ in the present study were up to three orders of magnitude lower than those reported by [15,35,36] in plant-effluent wastewater treatment, which could explain these differences. On the contrary, in the Pearl River, the Σ EEQ calculated is up to two orders of magnitude greater than that determined for the Apatlaco River basin [37]. Meanwhile, in the Langat River, located in Malaysia, Σ EEQ levels were up to two orders of magnitude lower than those determined in this work [38] The low levels of estrogenic risk are probably due to the fact that the hormones E2 and EE2 were detected in low concentrations.
On the other hand, in sediments, the range of Σ EEQ determined in this study was similar to the estrogenic range determined in different rivers of China [35], up to two orders of magnitude lower than the range of Σ EEQ determined in the Yundang Lagoon in Xiamen, China [39] and up to three orders of magnitude greater than the range of Σ EEQ determined in the Lhasa basin and in the Pearl River, located in China [36,37].
Table 8. Comparison between the estrogenicity observed in the Apatlaco River with other rivers in different parts of the world.
River/SiteEstrogenicity (EEQ ng·L−1)Analyzed CompoundsReferences
Agua
Apatlaco basin/Mexico0.0–5.034NP, BPA, E2, EE2This study
Cuautla basin/Mexico0.02–6.64NP, BPA, E2, EE2, 4tOPCalderón-Moreno et al., 2019 [19]
Langat/Malaysia 0.0–4.13 × 10⁻²E2, EE2, E1, E3Praveena et al., 2016 [38]
Different rivers/China 3 × 10⁻⁴–4.45 × 10⁻³BPA, E1, E2, EE2Tan et al., 2018 [15]
Lhasa basin/China 5 × 10⁻³–0.04BPA, E1, E2, E3, PLiu et al., 2020 [36]
Yeongsan and Seomjin/South Korea 3.8–5.94NP, BPA, OP, E2, E1, EE2Duong et al., 2010 [34]
Different rivers/China 3.27 × 10⁻³–2.24E2, EE2, DES, BPA,4 NP, OPLiu et al., 2017 [35]
Pearl river/China 0.23–324E2, DHTT, Ehrenstorfer, tamoxifen, flutamideZhao et al., 2011 [37]
Sediments
Apatlaco basin/Mexico0.08–28.354NP, BPA, E2, EE2This study
Different rivers/China 1.87 × 10⁻⁷–1.41BPA, E1, E2, EE2Tan et al., 2018 [15]
Lhasa basin/China 2–105BPA, E1, E2, E3, PLiu et al., 2020 [36]
Pearl river/China 0–101E2, DHTT, Ehrenstorfer, tamoxifen, flutamideZhao et al., 2011 [37]
Xiamen lagoon/China 8.66–23.95E1, E2, EE2, DES, 4NP, OP, BPAZhang et al., 2011 [39]
4tOP = 4 tert-octylphenol; OP = octylphenol; E1 = estrone; E3 = estriol; P = progesterone; DES = diethylstilbestrol; DHTT = dihydrotestosterone.

4. Conclusions

The optimized methodology allowed for the determination of the content of different families of compounds in environmental samples with very diverse characteristics.
In both water and sediments, the accumulated average concentration of the compounds in the different sites decreases in the following order: JTPC > TMC1 > TTL > TMC2 > CPTC. This behavior is probably due to the fact that this site is mainly impacted by effluents from two industrial and domestic wastewater treatment plants.
The obtained Log Kd distribution values indicate that the analyzed compounds tend to be adsorbed in sediments.
The estrogenic levels (EEQE2) determined in water and sediments and the concentrations of CDEs determined in TTL, TMC1, TCM2 and JTPC represent a potential negative risk for the health of aquatic organisms that inhabit the Apatlaco river micro-basin.

Author Contributions

Conceptualization, H.S.-N. and M.A.M.-T.; methodology, J.G.R.-L. and L.A.; validation, J.G.R.-L., J.V.-S. and J.A.G.-A.; formal analysis, J.G.R.-L. and V.B.; investigation, H.S.-N. and M.A.M.-T.; resources, H.S.-N.; writing—original draft preparation, H.S.-N., J.G.R.-L. and M.A.M.-T.; writing—review and editing, funding acquisition, L.A. All authors have read and agreed to the published version of the manuscript.

Funding

This project was supported by the National Council of Science and Technology, within the framework of the call LANEM 2021, project number 315896.

Institutional Review Board Statement

Not applicable.

Informed Consent Statement

Not applicable.

Data Availability Statement

The data presented in this study are available on request from the corresponding author.

Acknowledgments

The authors thank the National Council of Science and Technology for the support received to carry out this research, as well as LANEM for facilitating the use of all its infrastructure.

Conflicts of Interest

The authors declare no conflict of interest.

References

  1. Ahmed, S.A. The immune system as a potential target for environmental estrogens (endocrine disrupters): A new emerging field. Toxicology 2000, 150, 191–206. [Google Scholar] [CrossRef]
  2. Akhbarizadeh, R.; Russo, G.; Rossi, S.; Golianova, K.; Moore, F.; Guida, M.; de Falco, M.; Grumetto, L. Emerging endocrine disruptors in two edible fish from the Persian Gulf: Occurrence, congener profile, and human health risk assessment. Mar. Pollut. Bull. 2021, 166, 112241. [Google Scholar] [CrossRef] [PubMed]
  3. Stuart, M.; Lapworth, D.; Crane, E.; Hart, A. Review of risk from potential emerging contaminants in UK groundwater. Sci. Total Environ. 2012, 416, 1–21. [Google Scholar] [CrossRef] [PubMed] [Green Version]
  4. Kabir, E.R.; Rahman, M.S.; Rahman, I. A review on endocrine disruptors and their possible impacts on human health. Environ. Toxicol. Pharmacol. 2015, 40, 241–258. [Google Scholar] [CrossRef]
  5. Schmidt, W.; Redshaw, C.H. Evaluation of biological endpoints in crop plants after exposure to non-steroidal anti-inflammatory drugs (NSAIDs): Implications for phytotoxicological assessment of novel contaminants. Ecotoxicol. Environ. Saf. 2015, 112, 212–222. [Google Scholar] [CrossRef] [PubMed]
  6. Zhao, X.; Grimes, K.L.; Colosi, L.M.; Lung, W.S. Attenuation, transport, and management of estrogens: A review. Chemosphere 2019, 230, 462–478. [Google Scholar] [CrossRef]
  7. Amos Sibeko, P.; Naicker, D.; Mdluli, P.S.; Madikizela, L.M. Naproxen, ibuprofen, and diclofenac residues in river water, sediments and Eichhornia crassipes of Mbokodweni river in South Africa: An initial screening. Environ. Forensics 2019, 20, 129–138. [Google Scholar] [CrossRef]
  8. Cheng, Z.; Dong, F.; Xu, J.; Liu, X.; Wu, X.; Chen, Z.; Pan, X.; Zheng, Y. Atmospheric pressure gas chromatography quadrupole-time-of-flight mass spectrometry for simultaneous determination of fifteen organochlorine pesticides in soil and water. J. Chromatogr. A 2016, 1435, 115–124. [Google Scholar] [CrossRef]
  9. Pignotti, E.; Dinelli, E. Distribution and partition of endocrine disrupting compounds in water and sediment: Case study of the Romagna area (North Italy). J. Geochem. Explor. 2018, 195, 66–77. [Google Scholar] [CrossRef]
  10. Müller, A.K.; Markert, N.; Leser, K.; Kämpfer, D.; Crawford, S.E.; Schäffer, A.; Segner, H.; Hollert, H. Assessing endocrine disruption in freshwater fish species from a “hotspot” for estrogenic activity in sediment. Environ. Pollut. 2020, 257, 113636. [Google Scholar] [CrossRef]
  11. Zezza, D.; Bisegna, A.; Angelozzi, G.; Merola, C.; Conte, A.; Amorena, M.; Perugini, M. Impact of Endocrine Disruptors on Vitellogenin Concentrations in Wild Brown Trout (Salmo trutta trutta). Bull. Environ. Contam. Toxicol. 2020, 105, 218–223. [Google Scholar] [CrossRef]
  12. Luzio, A.; Monteiro, S.M.; Rocha, E.; Fontaínhas-Fernandes, A.A.; Coimbra, A.M. Development and recovery of histopathological alterations in the gonads of zebrafish (Danio rerio) after single and combined exposure to endocrine disruptors (17α-ethinylestradiol and fadrozole). Aquat. Toxicol. 2016, 175, 90–105. [Google Scholar] [CrossRef] [PubMed]
  13. Vega-Morales, T.; Sosa-Ferrera, Z.; Santana-Rodríguez, J.J. Evaluation of the presence of endocrine-disrupting compounds in dissolved and solid wastewater treatment plant samples of Gran Canaria Island (Spain). BioMed Res. Int. 2013, 2013, 790570. [Google Scholar] [CrossRef] [PubMed]
  14. Jin, S.; Yang, F.; Xu, Y.; Dai, H.; Liu, W. Risk assessment of xenoestrogens in a typical domestic sewage-holding lake in China. Chemosphere 2013, 93, 892–898. [Google Scholar] [CrossRef] [PubMed]
  15. Tan, R.; Liu, R.; Li, B.; Liu, X.; Li, Z. Typical Endocrine Disrupting Compounds in Rivers of Northeast China: Occurrence, Partitioning, and Risk Assessment. Arch. Environ. Contam. Toxicol. 2018, 75, 213–223. [Google Scholar] [CrossRef] [PubMed]
  16. Zhao, J.L.; Ying, G.G.; Chen, F.; Liu, Y.S.; Wang, L.; Yang, B.; Liu, S.; Tao, R. Estrogenic activity profiles and risks in surface waters and sediments of the Pearl River system in South China assessed by chemical analysis and in vitro bioassay. J. Environ. Monit. 2011, 13, 813–821. [Google Scholar] [CrossRef]
  17. Patrolecco, L.; Ademollo, N.; Grenni, P.; Tolomei, A.; Barra Caracciolo, A.; Capri, S. Simultaneous determination of human pharmaceuticals in water samples by solid phase extraction and HPLC with UV-fluorescence detection. Microchem. J. 2013, 107, 165–171. [Google Scholar] [CrossRef]
  18. Rivera-Jaimes, J.A.; Postigo, C.; Melgoza-Alemán, R.M.; Aceña, J.; Barceló, D.; López de Alda, M. Study of pharmaceuticals in surface and wastewater from Cuernavaca, Morelos, Mexico: Occurrence and environmental risk assessment. Sci. Total Environ. 2018, 613–614, 1263–1274. [Google Scholar] [CrossRef] [PubMed]
  19. Calderón-Moreno, G.M.; Vergara-Sánchez, J.; Saldarriaga-Noreña, H.; García-Betancourt, M.L.; Domínguez-Patiño, M.L.; Moeller-Chávez, G.E.; Ronderos-Lara, J.G.; Arias-Montoya, M.I.; Montoya-Balbas, I.J.; Murillo-Tovar, M.A. Occurrence and risk assessment of steroidal hormones and phenolic endocrine disrupting compounds in surface water in Cuautla River, Mexico. Water 2019, 11, 2628. [Google Scholar] [CrossRef] [Green Version]
  20. Li, Y.; Ding, J.; Zhang, L.; Liu, X.; Wang, G. Occurrence and ranking of pharmaceuticals in the major rivers of China. Sci. Total Environ. 2019, 696, 133991. [Google Scholar] [CrossRef]
  21. Rocha, M.J.; Cruzeiro, C.; Reis, M.; Pardal, M.Â.; Rocha, E. Toxicological relevance of endocrine disruptors in the Tagus River estuary (Lisbon, Portugal). Environ. Monit. Assess. 2015, 187. [Google Scholar] [CrossRef]
  22. Valcárcel, Y.; Alonso, S.G.; Rodríguez-Gil, J.L.; Castaño, A.; Montero, J.C.; Criado-Alvarez, J.J.; Mirón, I.J.; Catalá, M. Seasonal variation of pharmaceutically active compounds in surface (Tagus River) and tap water (Central Spain). Environ. Sci. Pollut. Res. 2013, 20, 1396–1412. [Google Scholar] [CrossRef]
  23. Díaz, A.; Peña-Alvarez, A. A Simple Method for the Simultaneous Determination of Pharmaceuticals and Personal Care Products in River Sediment by Ultrasound-Assisted Extraction Followed by Solid-Phase Microextraction Coupled with Gas Chromatography-Mass Spectrometry. J. Chromatogr. Sci. 2017, 55, 946–953. [Google Scholar] [CrossRef]
  24. Wang, W.; Ndungu, A.W.; Wang, J. Monitoring of Endocrine-Disrupting Compounds in Surface Water and Sediments of the Three Gorges Reservoir Region, China. Arch. Environ. Contam. Toxicol. 2016, 71, 509–517. [Google Scholar] [CrossRef]
  25. Errico, S.; Nicolucci, C.; Migliaccio, M.; Micale, V.; Mita, D.G.; Diano, N. Analysis and occurrence of some phenol endocrine disruptors in two marine sites of the northern coast of Sicily (Italy). Mar. Pollut. Bull. 2017, 120, 68–74. [Google Scholar] [CrossRef] [PubMed]
  26. Gong, J.; Ran, Y.; Zhang, D.; Chen, D.; Li, H.; Huang, Y. Vertical profiles and distributions of aqueous endocrine-disrupting chemicals in different matrices from the Pearl River Delta and the influence of environmental factors. Environ. Pollut. 2019, 246, 328–335. [Google Scholar] [CrossRef] [PubMed]
  27. Gomes, R.L.; Scrimshaw, M.D.; Cartmell, E.; Lester, J.N. The fate of steroid estrogens: Partitioning during wastewater treatment and onto river sediments. Environ. Monit. Assess. 2011, 175, 431–441. [Google Scholar] [CrossRef] [Green Version]
  28. Murillo-Torres, R.; Prado, B.; Durán-Álvarez, J.C.; Jiménez-Cisneros, B. Retención de 4-nonilfenol y di(2-etilhexil) ftalato en suelos del Valle de Tula, Hidalgo, México. Tecnol. Cienc. Agua 2012, III, 113–126. [Google Scholar]
  29. Salgueiro-González, N.; Turnes-Carou, I.; Besada, V.; Muniategui-Lorenzo, S.; López-Mahía, P.; Prada-Rodríguez, D. Occurrence, distribution and bioaccumulation of endocrine disrupting compounds in water, sediment and biota samples from a European river basin. Sci. Total Environ. 2015, 529, 121–130. [Google Scholar] [CrossRef]
  30. Agunbiade, F.O.; Moodley, B. Occurrence and distribution pattern of acidic pharmaceuticals in surface water, wastewater, and sediment of the Msunduzi River, Kwazulu-Natal, South Africa. Environ. Toxicol. Chem. 2016, 35, 36–46. [Google Scholar] [CrossRef]
  31. Mohd Amin, M.F.; Heijman, S.G.J.; Rietveld, L.C. Clay-starch combination for micropollutants removal from wastewater treatment plant effluent. Water Sci. Technol. 2016, 73, 1719–1727. [Google Scholar] [CrossRef] [PubMed]
  32. EPA-US. EPA Ecological Risk Assessment Guidance for Superfund: Process for Designing and Conducting Ecological Risk Assessments Interim Final. 1997. Available online: https://www.epa.gov/risk/ecological-risk-assessment-guidance-superfund-process-designing-and-conducting-ecological-risk (accessed on 7 November 2021).
  33. AC01769567 (1996). Technical Guidance Document in Support of Commission Directive 93 67 EEC on Risk Assessment for New Notified Substances and Commission Regulation (EC) No. 1488 94 on Risk Assessment for Existing Substances. Office for Official Publ. of the European Communities. Available online: https://op.europa.eu/en/publication-detail/-/publication/31268bfb-3534-4b9f-90aa-3506f6ba8231 (accessed on 15 October 2021).
  34. Duong, C.N.; Ra, J.S.; Cho, J.; Kim, S.D.; Choi, H.K.; Park, J.H.; Kim, K.W.; Inam, E.; Kim, S.D. Estrogenic chemicals and estrogenicity in river waters of South Korea and seven Asian countries. Chemosphere 2010, 78, 286–293. [Google Scholar] [CrossRef]
  35. Liu, D.; Wu, S.; Xu, H.; Zhang, Q.; Zhang, S.; Shi, L.; Yao, C.; Liu, Y.; Cheng, J. Distribution and bioaccumulation of endocrine disrupting chemicals in water, sediment and fishes in a shallow Chinese freshwater lake: Implications for ecological and human health risks. Ecotoxicol. Environ. Saf. 2017, 140, 222–229. [Google Scholar] [CrossRef]
  36. Liu, Y.; Su, W.; Zhu, Y.; Xiao, L.; Hu, T. Endocrine disrupting compounds in the middle and lower reaches of the Lhasa River Basin: Occurrence, distribution, and risk assessment. Sci. Total Environ. 2020, 727, 138694. [Google Scholar] [CrossRef] [PubMed]
  37. Zhao, J.L.; Ying, G.G.; Yang, B.; Liu, S.; Zhou, L.J.; Chen, Z.F.; Lai, H.J. Screening of multiple hormonal activities in surface water and sediment from the Pearl River system, South China, using effect-directed in vitro bioassays. Environ. Toxicol. Chem. 2011, 30, 2208–2215. [Google Scholar] [CrossRef]
  38. Praveena, S.M.; Lui, T.S.; Hamin, N.A.; Razak, S.Q.N.A.; Aris, A.Z. Occurrence of selected estrogenic compounds and estrogenic activity in surface water and sediment of Langat River (Malaysia). Environ. Monit. Assess. 2016, 188, 442. [Google Scholar] [CrossRef] [PubMed]
  39. Zhang, X.; Gao, Y.; Li, Q.; Li, G.; Guo, Q.; Yan, C. Estrogenic compounds and estrogenicity in surface water, sediments, and organisms from Yundang Lagoon in Xiamen, China. Arch. Environ. Contam. Toxicol. 2011, 61, 93–100. [Google Scholar] [CrossRef] [PubMed]
Figure 1. Sampling sites (Apatlaco river micro-basin); TTL (Tetela); CPTC (Chapultepec); TMC1 (Temixco 1); TMC2 (Temixco 2); JTPC (Jiutepec).
Separations 09 00019 g001
Figure 2. Chromatography that demonstrates the optimal separation of the six compounds studied by GC-MS.
Separations 09 00019 g002
Figure 3. Total EEQ value (Σ EEQ ng·L−1) in water for each site.
Separations 09 00019 g003
Table 1. Monitored ions (m/z) in mass spectrometry for each of the trimethylsilyl-derived (TMS) compounds of interest.
CompoundMolecular Weight (g·mol−1)Trimethylsilyl-Derived CompoundMolecular Weight (g·mol−1)Ion Quantitation (m/z)Ion Confirmation (m/z)
IBU206.29TMS-IBU278.47160263, 234, 278
4NP220.36TMS-4NP292.54179292, 277
NPX230.26TMS-NPX302.44185243, 287, 302
BPA228.29TMS-BPA372.65357372, 207
E2272.39TMS-E2416.75285232, 416
EE2296.41TMS-EE2440.77232196, 425, 440
Table 2. Summary of results obtained from the calibration for each of the compounds analyzed.
ParameterIBU4NPNPXBPAE2EE2
Correlation coefficient (r)0.99910.99510.99030.99360.98510.9908
Regression equationy = 27,095X + 170,681y = 68,437,723X − 54,677,536y = 2,916,856 − 2,163,466y = 31,517,484X − 8,421,391y = 13,688,606X − 4,858,261y = 7,331,801X − 1,541,923
Linear range (ng·mL−1)0–2400–3200–3200–3200–2400–320
LOD (ng·mL−1)13.730.261.020.410.030.12
LOQ (ng·mL−1)45.750.873.411.350.090.42
LOD: limit of detection; LOQ: limit of quantification.
Table 3. Validation of extraction methods for water and sediment samples.
Sample OriginCompoundWater (SPE)Sediment (UAE–SPE)
Recovery ± SD (n = 2)Repeatibility (n = 2)Reproducibility
(n = 2)
Recovery ± SD (n = 2)Repeatibility (RSD)Reproducibility (RSD)
SpringIBU70.35 ± 1.82.552.7572.65 ± 1.41.927.02
4NP83.94 ± 0.10.121.9661.01 ± 1.11.807.68
NPX79.17 ± 0.30.403.6870.78 ± 2.53.534.63
BPA76.75 ± 1.41.822.3073.86 ± 3.85.148.64
E280.03 ± 1.82.252.4868.48 ± 5.78.3212.95
EE275.39 ± 4.45.836.0286.57 ± 6.37.279.63
Household drainsIBU77.73 ± 0.10.130.7065.23 ± 2.84.306.73
4NP88.18 ± 0.50.601.1249.02 ± 2.75.517.64
NPX70.63 ± 0.30.420.58112.55± 4.33.824.19
BPA67.65 ± 1.21.801.9558.58 ± 1.72.903.09
E277.70 ± 2.63.353.5296.40 ± 6.46.6412.56
EE272.55 ± 2.53.443.6883.34 ± 4.45.306.80
wastewater treatment plantsIBU88.84 ± 0.20.221.3351.15 ± 1.12.157.21
4NP68.93 ± 1.21.741.9154.65 ± 1.83.304.61
NPX90.21 ± 0.70.801.3874.86 ± 0.91.203.86
BPA66.25 ± 0.60.901.7548.81 ± 8.417.2117.84
E264.59 ± 3.3 5.127.42111.58 ± 5.75.1115.12
EE297.68 ± 7.98.1011.1389.34 ± 2.32.607.92
SD: standard deviation; RSD: relative standard deviation.
Table 4. Environmental concentrations of drugs and CDEs determined in surface water and natural sediments.
SiteWater (ng·L−1)
IBU4-NPNPXBPAE2EE2AverageSD
CPTCND<LODND<LOD<LODND0.00.0
TTL<LOD8.45 ± 0.0281.65 ± 0.1219.75 ± 0.044.03 ± 0.04<LOD22.7931.26
TMC131.87 ± 0.079.19 ± 0.0184.13 ± 0.1119.81 ± 0.052.55 ± 0.03<LOD23.1431.45
TMC2<LDD<LDD2.33 ± 0.0110.37 ± 0.021.87 ± 0.01<LDD3.073.76
JTPC51.93 ± 0.0711.08 ± 0.0486.40 ± 0.0365.21 ± 0.145.37 ± 0.0316.06 ± 0.0436.8233.28
Average17.74 5.9450.9023.222.863.24
SD23.195.0745.4424.741.897.17
SiteSediment (ng g−1)
IBU4-NPNPXBPAE2EE2AverageSD
CPTCND<LODND<LOD0.01 ± 0.00ND0.000.00
TTL0.55 ± 00.07 ± 0.010.66 ± 0.010.1 ± 0.030.85 ± 0.01<LOD0.370.36
TMC10.62 ± 00.33 ± 0.060.85 ± 0.010.26 ± 0.030.16 ± 0.03<LOD0.370.31
TMC20.37 ± 0.040.02 ± 0.010.04 ± 00.87 ± 0.010.8 ± 0.03<LOD0.350.40
JTPC0.72 ± 0.010.70 ± 0.02ND3.97 ± 0.050.16 ± 0.050.46 ± 0.021.001.48
Average0.450.220.311.040.400.09
SD0.280.300.411.670.400.21
CPTC = Chapultepec; TTL = Tetela; TMC1 = Temixco 1; TMC2 = Temixco 2; JTPC = Jiutepec; SD = standard deviation; ND = no detected; LOD = limit of detection.
Table 5. Comparison of the concentration of drugs and CDEs found in the Apatlaco river basin and other places.
SiteRiverCompound
IBU4NPNPXBPAE2EE2
Superficial water ng mL−1MexicoApatlaco [18]502–1106NR3000–4820NRNRNR
Cuautla [19]NR1.23–44.74NR15.07–970.07–5.770.14–4.8
ChinaYangtze [20]0.4–41.23–104°0.6–1715–1100.81–590.5–44
Spain and PortugalTagus [21,22]180–2671–21109–16627–1900.14–30.1–9
Sediment (ng g−1)MexicoTula [23]<LODNR1.2–102NRNRNR
ChinaThree Gorges Dam [24]NR0.4–8NR0.5–410.08–170.2–37
ItalyDifferent rivers [25]NR0.1–97NR0.2-23NR<LOD
ÁfricaMbokodweni [7]0.8–3NR0.05–4°NRNRNR
NR = not reported.
Table 6. Distribution of the Log Kd obtained for the drugs and CDEs detected and that determined in other studies.
ParameterBPAE2EE24NPIBUNPX
Log Kd1.24 ± 0.59 *1.91 ± 0.56 *1.4 ± 0.13 *1.35 ± 0.37 *1.43 ± 0.26 *1.05 ± 0.17 *
2.87 [26]2.26 [27]2.45 [28]3.60 [29]1.08–1.89 [30] 0.47 [31]
* This study.
Table 7. Correlations observed between the compounds detected in water and sediment with physicochemical parameters.
ParameterWaterSediments
IBU4NPNPXBPAE2EE2IBU4NPNPXBPAE2EE2
Conductivity +0.7632 *
DO −0.7833 *
TOC+0.8499 * +0.8503 * +0.8423 * +0.9246 +0.8376
BOD5+0.8369 * +0.9272+0.8783+0.9027 +0.9158 +0.8990
COD+0.8628 * +0.9446+0.7483 *+0.9552 +0.8896 +0.9880 +0.9524
TSS+0.7996 *+0.7528 *+0.7899 * +0.8136 * +0.9373
* p ≥ 0.05; DO: dissolved oxygen; TOC: total organic carbon; BOD: biochemical oxygen demand; COD: chemical oxygen demand; TSS: total suspended solids.
Publisher’s Note: MDPI stays neutral with regard to jurisdictional claims in published maps and institutional affiliations.

