
A Study on the Erosion Mechanism of an Axial Cyclone Separator for Gas Purification
1
College of Mechanical and Transportation Engineering, China University of Petroleum, Beijing 102249, China
2
Sinopec Beijing Research Institute of Chemical Industry, Beijing 100029, China
3
China Petroleum Pipeline Machinery Manufacture Co., Ltd., Langfang 065000, China
4
China Petroleum Materials Co., Ltd., Beijing 300201, China
*
Author to whom correspondence should be addressed.
Separations 2022, 9(12), 409; https://0-doi-org.brum.beds.ac.uk/10.3390/separations9120409
Submission received: 27 September 2022
/
Revised: 21 November 2022
/
Accepted: 25 November 2022
/
Published: 5 December 2022
Abstract
:Severe erosion occurs in the cone bottom and the joint part between the cone and cylinder of the cyclone separator used in high-pressure natural gas transportation. The main objective of this study is to reveal the mechanism and influencing factors of erosion. To address these issues, the numerical simulations were used to investigate the parameters, such as inlet gas velocity, particle concentration, particle size, the cone length, the diameter of dust exit and the vortex finder. The results indicate that wall erosion is significantly affected by the inlet gas velocity and particle diameter. Increasing the cone length and the dust exit diameter can effectively reduce wall erosion, whereas the cyclone separation efficiency would be reduced simultaneously. It is worth noting that the vortex finder with spiral slits is of benefit to increase the cyclone separation efficiency but decreases the maximum erosion rate of the cyclone cone by at least 80%.
1. Introduction
In natural gas transportation, cyclone separators have been widely used for gas-solid separation. Almost of all intermediate stations in the natural gas pipeline, such as the compressor stations, offtake stations and gas storages, are commonly equipped with multi-cyclone separators that composed of several parallel cyclone separators with an axial inlet to remove particles and droplets. However, the security and reliability of the equipment are under serious threat of erosion in the lower cone and the joint part between the cone and cylinder of cyclone separator. Although cyclones are not expensive equipment, their damage due to erosion is one of the causes of unscheduled shutdowns that results in financial losses.
Therefore, the erosion mechanisms of a cyclone separator have been implemented by experimental and analytical approaches [1,2,3,4,5,6,7]. Mclean [4] used experimental and theoretical methods to analyze the effect of different catalyst particles on the wall erosion. Reppenhagen and Werther [5] studied the erosion in the cyclone separator and found that the erosion rate in the cyclone was proportional to the average radius and inlet velocity. Silva et al. [6] used a new rapid method to measure the erosion on the wall of the cyclone separator. It was found that when the particle concentration was high, the inlet velocity was large. Furthermore, the higher concentration particles would form on the wall, because the particle protects the layer, thereby reducing erosion wear. Karri et al. [7] conducted an experimental study on the cyclone separator and designed a horizontally placed stable vortex structure at the lower third of the cone. This structure can effectively suppress the impact of high-speed moving particles on the wall surface and improve the vortex stability, so that the separation efficiency would be improved and the erosion would be reduced.
In recent years, many researchers used numerical simulation to study the performance and structural improvement of cyclone separators. Similarly, computational fluid dynamics (CFD) techniques were used to deal numerically with erosion in, for instance, elbows [8,9,10,11,12,13], pipes [14,15,16], cyclones [17,18,19,20,21,22,23,24,25,26], and valves [21]. Chu et al. [17] used a combined CFD and discrete element method to predict the erosion rate of dense medium cyclone walls due to the impact of coal particles; the numerical results showed that the severe erosion locations were generally the inside wall of the spigot and the outside wall of the vortex finder. Parvaz et al. [18] studied the effects of internal cones of different diameters and heights on the separation performance and wall erosion at the bottom of the cone. Sedrez et al. [19] studied the erosion of a cyclone separator operating with fluid catalytic cracking particles by CFD and experimental methods, the results showed the erosion increases with the gas inlet velocity and decreases with the solids loading rate at the same inlet velocity. Mazyan et al. [23] investigated the effect of adding tangential chambers at the conical section of a Stairmand-type cyclone separator on the efficiency of the overall solid-gas separation efficiency, pressure drop, and erosion rate. Farokhipour et al. [24] studied erosions in gas-liquid-solid three-phase flows and showed that the erosion rate decreases due to the liquid film cushioning effects. Tofighian et al. [25] investigated the effect of different state-of-the-art dispersion and particle-wall collision models on the efficiency and erosion prediction by large eddy simulation; the results showed that wall roughness increases the erosion rate of large particles through the combined impact of the “shadow effect” and energetic inner vortex on particles. Foroozesh et al. [26] found that the solid loading and inlet gas velocity significantly affect the erosion rate and even more than that of particle size by the CFD method.
The above brief review shows that there are many studies in the open literature concerning effect of the cyclone’s geometrical parameters and operation parameters on its erosion. However, almost all previous works on the CFD simulation and experiment of cyclone erosions were focused on tangential inlet cyclone separators; there are only a limited number of erosion studies on the axial inlet cyclone separator.
In the present paper, the erosion mechanics of axial inlet cyclone separator has been investigated by the numerical simulation method. The Reynolds stress model (RSM) and Reynolds averaged Navier–Stokes equations are employed to describe the turbulence in the gas and particles motion, respectively. Moreover, the influence of operating and physical parameters on erosions are analyzed. Accordingly, the cyclone structures were improved, providing a reference for the wear resistance of the cyclone wall.
2. Computational Approach
2.1. Computational Domain and Grid Construction
An axial cyclone separator with a 150 mm diameter, illustrated in Figure 1, is used to study the erosion. In order to obtain an accurate solution, a hexagonal mesh is used, as shown in Figure 2. The grid independence study is carried out using five different mesh sizes, namely, 230,000, 290,000, 320,000, 355,000 and 400,000, respectively. It is shown that when the number of meshes reaches 320,000, further increasing the number of meshes would not have an impact on the accurate of internal flow field of the cyclone, as shown in Figure 3. Therefore, all simulations are performed with a mesh size of 320,000 to ensure grid independence.
2.2. CFD-Based Erosion Modeling
The Reynolds stress model (RSM) is used for analyzing the gas phase flow field due to its capability to predict the strong turbulent swirling flow with anisotropic behavior. In this study, the Eulerian–Lagrangian approach is used for analyzing the particulate phase motion. The continuous phase is solved by the Reynolds averaged Navier–Stokes equations, and the solid particles are treated as a discrete phase. As the volumetric fraction of particles is small, the one-way coupling can be used. In the Eulerian–Lagrangian approach, Newton’s second law governs the particle motion. The collision between particles is ignored, and the Discrete Phase Model (DPM) is used for calculation. The particle trajectory adopts the stochastic trajectory model, which studies the interaction between particles and vortices, reflecting the movement law of solid particles and the diffusion of vortices.
The solid particle velocity in gas-solid two-phase flow can be solved with the following formula:
where FD is the resistance acting on the unit mass of particles, and its expression is as follows:
where v is velocity, m/s; g and p are the gas phase and the particle phase, respectively; AP is the projected area of spherical particles, m2; dP is the spherical particle diameter, m; ρg is the density, kg/m3.
The particle impact on the wall causes erosion. The tangential erosion effects are typically more significant than the typical erosion effects on the surface in swirling flows. There is a broad of consensus that the Det Norske Veritas (DNV) erosion model is one of the most accurate available models for many industrial applications [20,21,22,27,28,29]. Accordingly, the DNV erosion model is introduced in the present study, and the rate of erosion in the cyclone wall can be calculated by [30,31]:
where Rerosion is the erosion rate, kg/(m2·s); f(α) is the impact angle function; α is the impact angle when the particle collides with the wall, °; v is the velocity of the particle with respect to the wall, m/s; C(dP) is the function of solid particle size; b(v) is the function of relative velocity of solid particles; Aface is the wall calculation unit area, m2; Nparticles is the number of particles colliding with the wall per unit area; is the mass flow rate of particles, kg/s.
The parameters are given according to the literature [32], and the expression is as follows:
where Fs is the solid particle shape factor; spherical particle shape factor is 1; B is the material Brinell hardness; a1, b1, x1, y1, z1 are constants: a1 = −33.4, b1 = 17.9, x1 = 1.239, y1 = −0.1192, z1 = 2.167. The calculation yields C(dp) = 7.28 × 10⁻⁹, f(α) = 2.17.
2.3. Boundary Condition Setting
The gas phase is set as methane, which is the main component of natural gas. The inlet and outlet boundary conditions are set as the velocity inlet and outflow, respectively. The no-slip boundary condition at the wall is considered, while the particles are assumed to escape from the outlet of the computational domain. The restitution coefficient, i.e., the ratio between particle normal rebound velocity to particle normal impact velocity, is set to 0.9 [33].
The talcum powder particles with a density of 2700 kg/m3 are used in this study. The particle diameter ranges from 2 μm to 38 μm, and the particle size distribution satisfies the Rossin–Rammler distribution. The median diameter is 10.2 μm, and the distribution index is 1.919.
2.4. CFD Validation
The calculated pressure drop is compared with the experimental data to validate the continuous phase simulations, as shown in Figure 4a. Flow simulations are performed for the experimental condition of Xiong et al. [34], which used the same axial cyclone as shown Figure 1. Figure 4b compares the corresponding computed and measured collection efficiencies at the particle concentration of 400 mg/m3. The results indicate that the model predictions for the continuous phase are in close quantitative agreement with the experimental data, and the developed RSM can predict the flow characteristics of cyclone gas particles with reasonable accuracy.
3. Results and Discussion
3.1. Tangential Velocity
Figure 5 shows the structure of the separator. For the inlet air velocity of 8 m/s, the radial profiles of the tangential velocity at the z = −500 mm section for different operating pressures are shown in Figure 6. It is seen that these velocity profiles are symmetrical with respect to the cyclone axis. Because there is no sudden change in the flow area for the axial cyclone separator, the profiles of the tangential velocity are roughly the same under different pressures. This phenomenon is different from the tangential inlet cyclone separator, which exists in a sudden change of flow area in the inlet region.
3.2. Analysis of the Location of the Wall Erosion
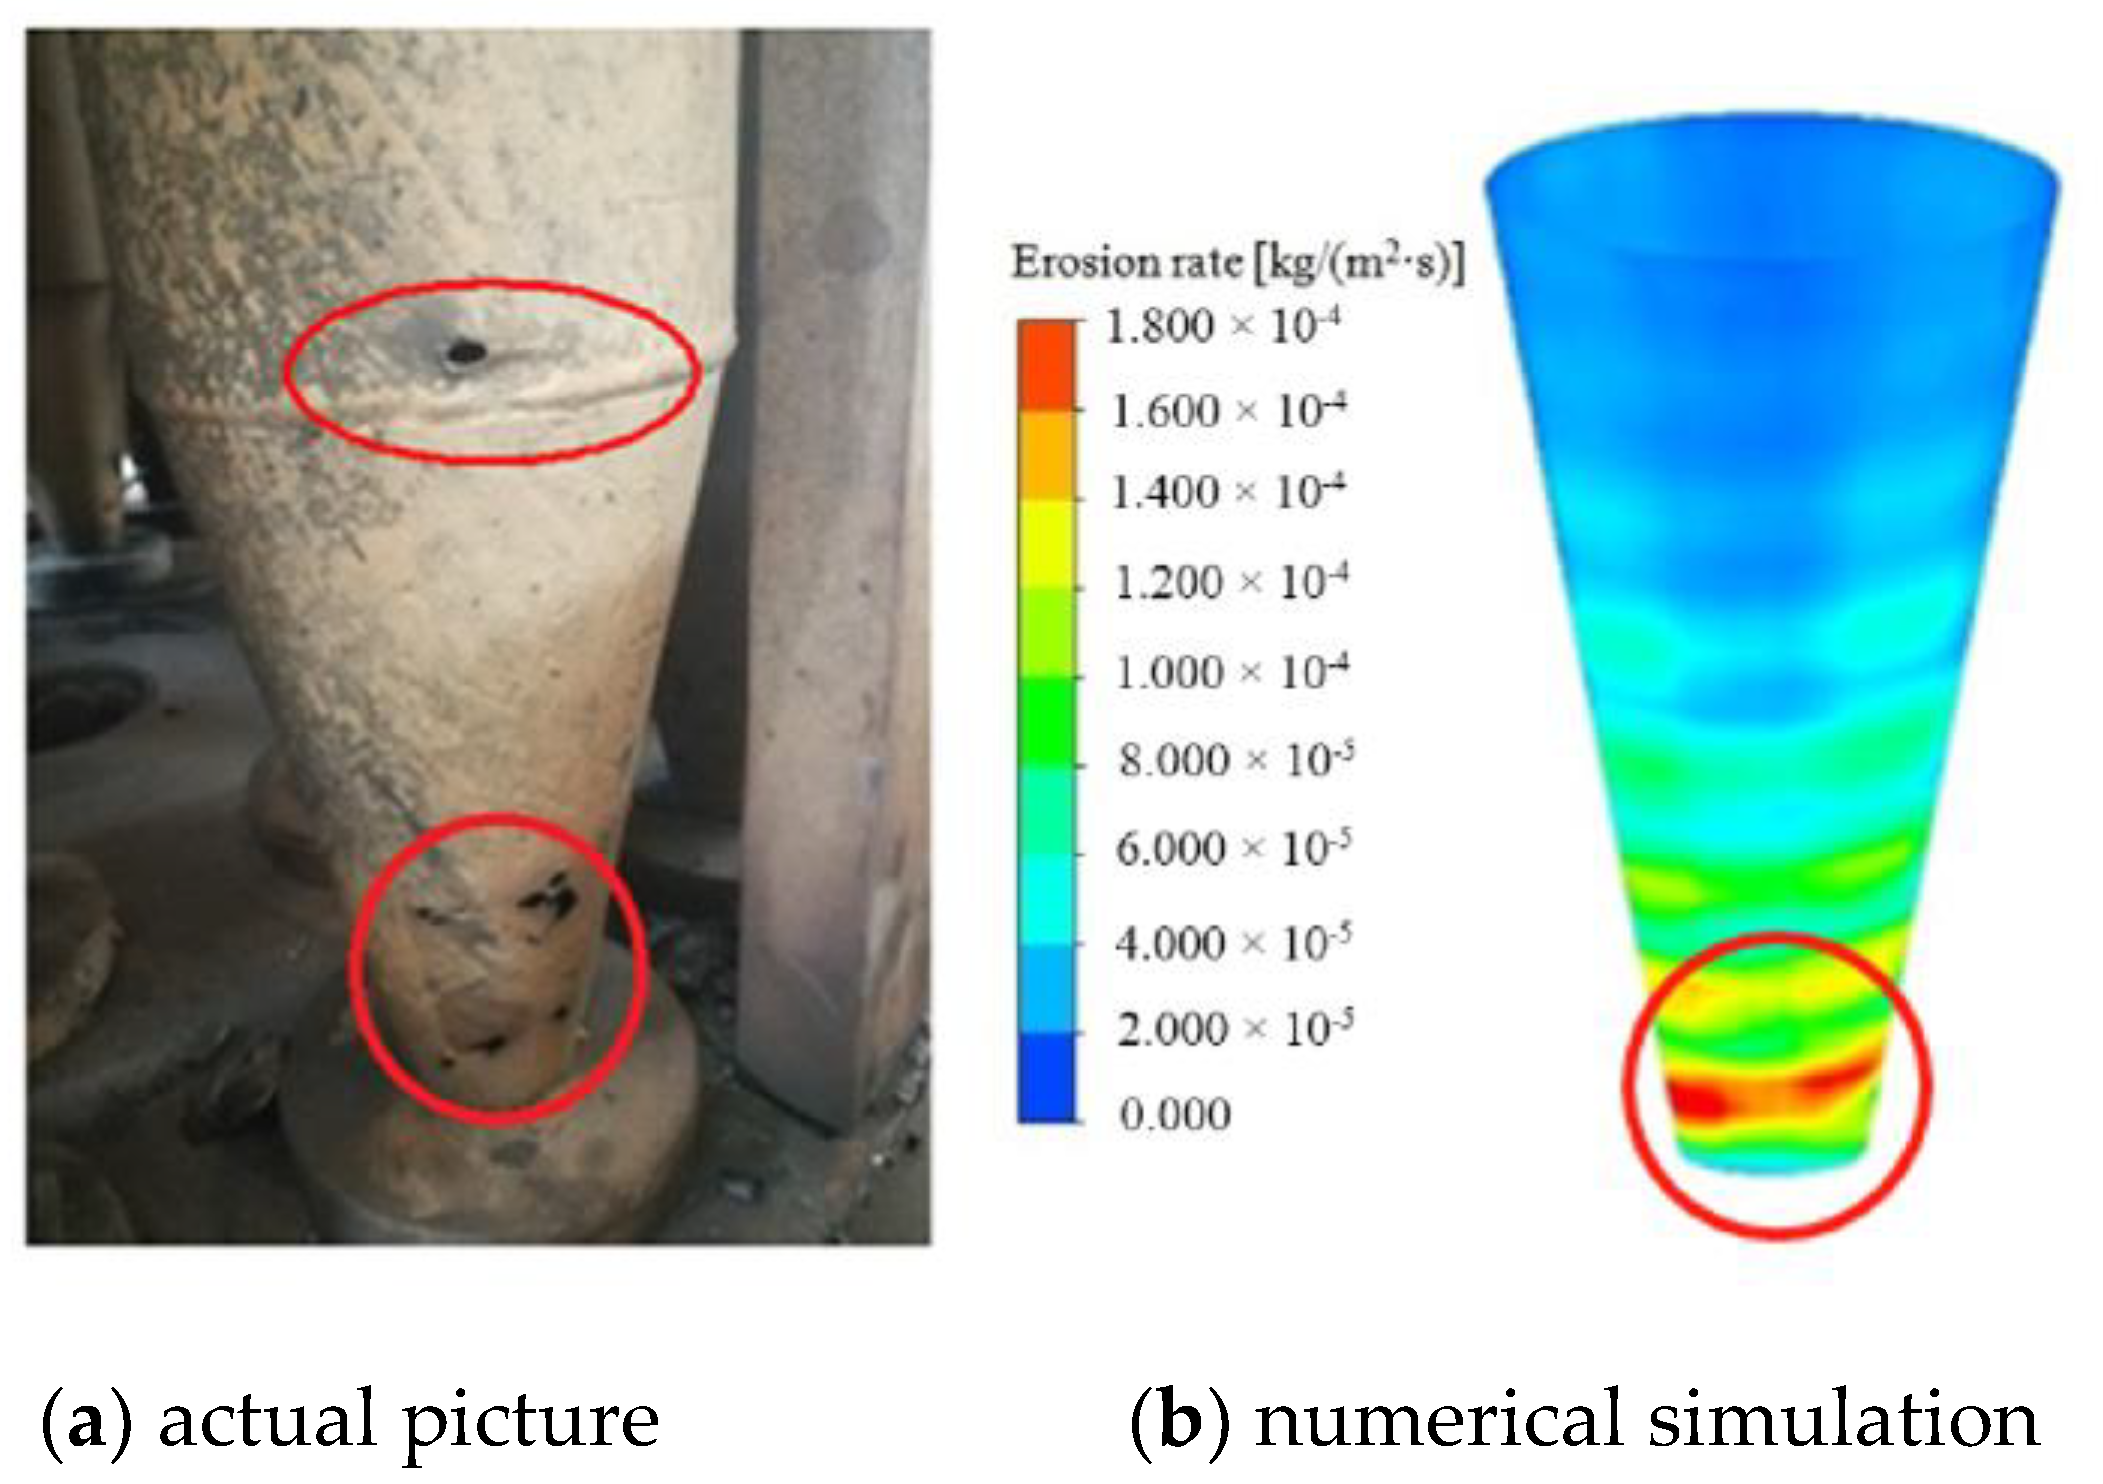
The wall erosion of the axial cyclone separator is studied under the operating pressure of 10 MPa, particle concentration of 10 g/m3 and inlet velocity of 8 m/s. Note that the volumetric fraction of particles is very small (less than 10−5) in the present study. Thus, the effect of particles on the gas phase can be ignored. The rate of the erosion on the inner surface of the cyclone is shown in Figure 7. Obviously, the distributions of wall erosion rate are similar to the particle trajectories. Figure 8 depicts the locations of the erosion in the cylinder and cone. Compared with the erosion occurring in an actual cyclone separator (see Figure 9), the numerical results are similar to the observational ones.
It can be observed from Figure 7 that the highest erosion rate appears in the cone bottom region of the cyclone, which is in contrast to the tangential inlet cyclone, where the erosion mainly occurs at the entrance of the cyclone [19]. In the cone bottom region, the increase of the erosion rate is probably related to two aspects: one is the particle concentration increases and the other is that the gas flow with free vortex reverse forced vortex, which causes the rotation frequency of gas and particles to rise sharply.
Furthermore, it can be seen in Figure 9a that the intersection of cylinder and cone is worn through. Note that it is different from that of the cone where the worn-through hole is not similar to the distribution of erosion rate. In order to illustrate the phenomenon, the effect of inlet gas velocity, operation pressure, particle concentration and particle size on the cyclone erosion have been simulated. As a result, except for particle size impact, the other simulations have similar erosion plots, as shown in Figure 7, in which the range of the particle size is 2–40 μm. In order to explain the particle size impact, three different particle diameters, i.e., 50 μm, 100 μm and 200 μm, are used for simulation. The uniform concentration of particles is introduced at the cyclone inlet. Figure 10 shows the erosion plot for three different particle diameters; as observed, different particle sizes have different erosion positions on the wall surface of the cone. As can be seen from Figure 10a, the small particle size has better followability to the airflow, and the highest erosion rate appears in the cone bottom region. For larger particles shown in Figure 10c, the particles tend to high-speed rotation at the intersection of cylinder and cone, and the weld seam of the intersection is not smooth. Thus, larger particles promote the worn-through hole at the intersection.
3.3. Influence of Operation Parameters on the Wall Erosion
Inlet Velocity
Inlet velocity is one of the essential parameters of wall erosion. Figure 11 is a comparison of the axial wall erosion contours of the cone at different inlet velocity, while Figure 12 plots the relationships curves between inlet velocity and wall erosion rate in the cone. As the inlet velocity increases, swirling flow has greater rotational kinetic energy, leading to a greater centrifugal force of particles. According to the erosion wear model shown in Formula (9), when other parameters are fixed, the increase of the inlet velocity causes the particle velocity to increase, and the wall erosion rate is 1.73 times higher than the particle velocity. The number of particles colliding with the wall surface per unit area increases, which makes the wall surface erosion rate and the inlet velocity approximately 2 to 3 times higher, as shown Figure 12.
4. Structural Improvement
There are many structures of the axial cyclone separator, and every change in the structural size will have a specific impact on the internal flow field and wall erosion of the cyclone. The size of the cyclone cone and vortex finder are two key parameters that affect the gas rotation strength, secondary flow, short-circuit flow, wall erosion, etc.
4.1. Increase the Cone Length
In this section, the separation performance and wall erosion are carried out on varying cone structures under an operating pressure of 10 MPa, inlet velocity of 8 m/s and particle concentration of 10 g/m3.
Because the cyclone separation efficiency will significantly reduce with the increasing of the cone diameter, only the length of the cone can be changed. The cone lengths are 270 mm, 300 mm and 324 mm in this study, respectively. The size diagram of the cyclone cone structure is shown in Figure 13.
The change in the length of the cone causes a change of the internal flow field of the cyclone separator. When the length of the cone increases, the tangential velocity inside the cyclone separator decreases, as shown in Figure 14 (z = −500 mm). As a result, the separation efficiency decreased from 84.89% to 83.72% and 82.96%, as shown in Figure 15.
However, as the turbulence intensity at the bottom of the cone decreases, the flow resistance decreases, which reduces the number of particle collisions on the wall and particle velocity. Figure 16 shows the comparison of the erosion of the cone under three different cone lengths; the erosion rate of the cone is significantly reduced, but the maximum erosion rate is a small reduction, as shown in Figure 17. Therefore, it is difficult to achieve the goals of reducing wall erosion and keeping separation efficiency at the same time by changing the size of the cyclone cone.
4.2. Improved Vortex Finder Structure
In our previous research [28], cyclone separators with different types of vortex finders (as shown in Figure 18) were evaluated for their performance on the reduction of the pressure drop and improvement of overall separation efficiency and grade efficiency. The experimental results showed that the vortex finder with the reflux cone (as shown in Figure 18, Type B), straight gaps (as shown in Figure 18, Type C) and/or spiral gaps (as shown in Figure 18, Type D) had increased overall separation efficiency and grade efficiency and decreased pressure drop. The vortex finder added with reflux cone and spiral gaps (15-degree dextrorotation) had the best performance, which reduced the pressure drop by 73% and increased the separation efficiency by 9% compared to the basic vortex finder. This modified vortex finder also removed 99% of the particles (>10 um).
The influences of the vortex finder structure on the wall erosion rate also have been studied under an operating pressure of 10 MPa, inlet velocity of 8 m/s and particle concentration of 10 g/m3. Figure 19 and Figure 20 are comparisons of the values and contours of the cone wall erosion of the separators with four different vortex finders, respectively. It can be seen from the figures that the wall erosion rate of the cyclones with straight gaps (Type C) and spiral gaps (Type D) significantly reduces. This is because the tangential and axial velocities and the volumetric entropy generation rate all decrease compared to those of the original cyclone separator [35]. Owing to the gaps, the maximum tangential velocity shifts from the space under the vortex finder to the annular space outside the vortex finder, and the maximum axial velocity moves from the under part to the upper part of the vortex finder. The non-symmetry flow field is also found to be ameliorated by adding gaps. In the vortex finder of Type C and Type D cyclones, the partial swirling flow turns to the inverse direction compared with those in Type A and Type B cyclones. In the literature [35], the volumetric entropy generation rate due to turbulent dissipation for the four cyclones was presented and compared.
The erosion rate and separation performance of the modified and original cyclones have been compared in Table 1. When the diameter of the dust exit increasing from 50 mm to 80 mm, the maximum erosion rate reduces by 65.14%, and the separation efficiency also reduces 4% or more at the same time. Additionally, the influence of the cone length on the erosion rate and separation performance is not evident among this range of dust exit diameter. However, the maximum erosion rate of Type C and Type D cyclones [decreases by 88.28% and 88.0%, respectively, compared to the original cyclone (Type A cyclone). At the same time, the separation efficiency increases by 6.8% or more, and the pressure drop decreases significantly.
5. Conclusions
In this study, the CFD method was carried out to investigate erosion in axial cyclones. The CFD model presented a qualitative validation of erosion locations, and the results demonstrated that the erosion is strongly depended on the gas inlet velocity, the particle concentration and particle size as expected. It was also evident that the region with the most erosion is the cyclone cone bottom as a consequence of the cyclone geometry used in this study, and the worn-through hole at the intersection between the cylinder and cone is caused by larger particles because of the high-speed rotation of larger particles.
Increasing the cone length and dust exit diameter was advantageous for reducing the wall erosion, but it is a disadvantage for separation efficiency. The region around the vortex finder is the key region for decreasing wall erosion. The gaps reduce the flow rate under the vortex finder and can effectively reduce the wall erosion, and the maximum erosion rates of Type C and Type D cyclones are reduced by 88.28% and 88.0%, respectively. In addition, the separation efficiency of Type C and Type D cyclones was slightly higher than that of the original cyclone, and the pressure drop significantly decreased the Type C and Type D cyclones, suggesting that Type C and Type D vortex finders can reduce the wall erosion and improve cyclone performance. The Type D cyclone separator is the optimum one, exhibiting the lowest wall erosion, the highest separation efficiency and the lowest pressure drop.
Author Contributions
Conceptualization, Z.X., Y.W., X.G., Y.Y. and J.S.; methodology and writing—review and editing, Z.X.; software and writing—original draft, X.G. and Y.W.; resources, Y.Y.; investigation, J.S. All authors have read and agreed to the published version of the manuscript.
Funding
This research received no external funding.
Data Availability Statement
Not applicable.
Conflicts of Interest
The authors declare no conflict of interest.
References
- Kraxner, M.; Portenkrichner, M.; Pillei, M.; Kofler, T.; Muschelknautz, U. Empirical Erosion Tests: Uniflow Cyclone as an Alternative to Reverse Flow Cyclones for a Longer Lifetime? In Proceedings of the AIChE Annual Meeting, San Francisco, CA, USA, 3–8 November 2013. [Google Scholar]
- Chen, Y.M.; Nieskens, M.; Reddy, S.B. Developments in cyclone technology improve FCC unit reliability. Pet. Technol. Q. 2010, 15, 65–71. [Google Scholar]
- Danyluk, S.; Shack, W.J.; Park, J.Y. The erosion of a type 310 stainless steel cyclone from a coal gasification pilot plant. Wear 1980, 63, 95–104. [Google Scholar] [CrossRef]
- Mclean, J.B. FCC catalyst properties can affect cyclone erosion. Oil Gas J. 2000, 98, 33–36. [Google Scholar]
- Reppenhagen, J.; Werther, J. Catalyst attrition in cyclones. Powder Technol. 2000, 113, 55–69. [Google Scholar] [CrossRef]
- Silver, P.D.; Briens, C.; Bernis, A. Development of a new Rapid Method to Measure Erosion Rates in Laboratory and Pilot Plant Cyclones. Powder Technol. 2003, 131, 111–119. [Google Scholar]
- Karri, S.B.R.; Knowlton, T. Erosion in Second Stage Cyclones: Effects of Cyclone Length and Outlet Gas Velocity. J. Mol. Struct. 2014, 330, 181–185. [Google Scholar]
- Pereira, G.C.; de Souza, F.J.; de Martins, D.A.M. Numerical prediction of the erosion due to particles in elbows. Powder Technol. 2014, 261, 105–117. [Google Scholar] [CrossRef]
- Parsi, M.; Agrawal, M.; Srinivasan, V.; Vieira, R.E.; Torres, C.F.; McLaury, B.S.; Shirazi, S.A. CFD simulation of sand particle erosion in gas-dominant multiphase flow. J. Nat. Gas Sci. Eng. 2015, 27, 706–718. [Google Scholar] [CrossRef]
- Dobrowolski, B.; Wydrych, J. Evaluation of numerical models for prediction of areas subjected to erosion wear. Int. J. Appl. Mech. Eng. 2006, 11, 735–749. [Google Scholar]
- Duarte, C.A.R.; de Souza, F.J.; dos Santos, V.F. Numerical investigation of mass loading effects on elbow erosion. Powder Technol. 2015, 283, 593–606. [Google Scholar] [CrossRef]
- Abdolkarimi, V.; Mohammadikhah, R. CFD modeling of particulates erosive effect on a commercial scale pipeline bend. ISRN Chem. Eng. 2013, 2013, 105912. [Google Scholar] [CrossRef]
- Wu, J.; Graham, L.J.W.; Lester, D.; Wong, C.Y.; Nguyen, B. An effective modeling tool for studying erosion. Wear 2011, 270, 598–605. [Google Scholar] [CrossRef]
- Jafari, M.; Mansoori, Z.; Saffar Avval, M.; Ahmadi, G.; Ebadi, A. Modeling and numerical investigation of erosion rate for turbulent two-phase gas-solid flow in horizontal pipes. Powder Technol. 2014, 267, 362–370. [Google Scholar] [CrossRef]
- Parsi, M.; Najmi, K.; Najafifard, F.; Hassani, S.; McLaury, B.S.; Shirazi, S.A. A comprehensive review of solid particle erosion modeling for oil and gas wells and pipelines applications. J. Nat. Gas Sci. Eng. 2014, 21, 850–873. [Google Scholar] [CrossRef]
- Huang, C.; Minev, P.; Luo, J.; Nandakumar, K. A phenomenological model for erosion of material in a horizontal slurry pipeline flow. Wear 2010, 269, 190–196. [Google Scholar] [CrossRef]
- Chu, K.W.; Kuang, S.B.; Yu, A.B.; Vince, A.; Barnett, G.D.; Barnett, P.J. Prediction of wear and its effect on the multiphase flow and separation performance of dense medium cyclone. Miner. Eng. 2014, 56, 91–101. [Google Scholar] [CrossRef]
- Parvaz, F.; Hosseini, S.H.; Elsayed, K. Numerical investigation of effects of inner cone on flow field, performance and erosion rate of cyclone separators. Sep. Purif. Technol. 2018, 201, 223–237. [Google Scholar] [CrossRef]
- Sedrez, T.A.; Decker, R.K.; da Silva, M.K. Experimental and CFD-based erosion modeling for gas-solids flow in cyclones. Powder Technol. 2017, 311, 120–131. [Google Scholar] [CrossRef]
- Vieira, R.E.; Mansouri, A.; McLaury, B.S.; Shirazi, S.A. Experimental and computational study of erosion in elbows due to sand particles in air flow. Powder Technol. 2016, 288, 339–353. [Google Scholar] [CrossRef]
- Wang, G.R.; Chu, F.; Tao, S.Y.; Jiang, L.; Zhu, H. Optimization design for throttle valve of managed pressure drilling based on CFD erosion simulation and response surface methodology. Wear 2015, 338–339, 114–121. [Google Scholar] [CrossRef]
- Mazumder, Q.H. Effect of liquid and gas velocities on magnitude and location of maximum erosion in U-bend. J. Fluids Struct. 2012, 2, 29–34. [Google Scholar] [CrossRef] [Green Version]
- Mazyan, W.; Ahmadi, A.; Brinkerhoff, J.; Ahmed, H.; Hoorfar, M. Enhancement of cyclone solid particle separation performance based on geometrical modification: Numerical analysis. Sep. Purif. Technol. 2018, 191, 276–285. [Google Scholar] [CrossRef]
- Farokhipour, A.; Mansoori, Z.; Saffar-Avval, M.; Ahmadi, G. 3D computational modeling of sand erosion in gas-liquid-particle multiphase annular flows in bends. Wear 2020, 450–451, 203241. [Google Scholar] [CrossRef]
- Tofighian, H.; Amani, E.; Saffar-Avval, M. A large eddy simulation study of cyclones: The effect of sub-models on efficiency and erosion prediction. Powder Technol. 2020, 360, 1237–1252. [Google Scholar] [CrossRef]
- Foroozesh, J.; Parvaz, F.; Hosseini, S.H.; Ahmadi, G.; Elsayed, K.; Babaoglu, N.U. Computational fluid dynamics study of the impact of surface roughness on cyclone performance and erosion. Powder Technol. 2021, 389, 339–354. [Google Scholar] [CrossRef]
- Deng, Y.; Liu, Y.; Chen, J.; Zhang, Y.; Guo, L. Numerical simulation of the erosion in the 90° elbow. AIP Conf. Proc. 2013, 1547, 671–683. [Google Scholar]
- Song, X.G.; Park, J.H.; Kim, S.G.; Park, Y.C. Performance comparison and erosion prediction of jet pumps by using a numerical method. Math. Comput. Model. 2013, 57, 245–253. [Google Scholar] [CrossRef]
- Peng, W.; Cao, X. Numerical prediction of erosion distributions and solid particle trajectories in elbows for gas-solid flow. J. Nat. Gas Sci. Eng. 2016, 30, 455–470. [Google Scholar] [CrossRef]
- ANSYS Fluent 16.0 User’s Guide; ANSYS Inc.: Canonsburg, PA, USA, 2013.
- Haider, A.; Levenspiel, O. Drag coefficient and terminal velocity of spherical and nonspherical particles. Powder Technol. 1989, 58, 63–70. [Google Scholar] [CrossRef]
- Morsi, S.A.; Alexander, A.J. An investigation of particle trajectories in two-phase flow system. J. Fluid Mesh 1972, 55, 193–208. [Google Scholar] [CrossRef]
- Derksen, J.J.; Sundaresan, S.; Akker, H.E.A.V.D. Simulation of mass-loading effects in gas-solid cyclone separators. Powder Technol. 2006, 163, 59–68. [Google Scholar] [CrossRef]
- Zhiyi, X.; Zhongli, J.; Xiaolin, W. Development of a cyclone separator with high efficiency and low pressure drop in axial inlet cyclones. Powder Technol. 2014, 253, 644–649. [Google Scholar]
- Lu, D.; Xiaolin, W.; Zhongli, J.; Zhiyi, X.; Jingxian, Z. The flow pattern and entropy in an axial inlet cyclone with reflux and gaps in the vortex finder. Powder Technol. 2016, 303, 192–202. [Google Scholar]
Figure 1.
The axial flow cyclone separator size.

Figure 2.
The axial flow cyclone separator mesh.

Figure 3.
The influence of grid number on tangential velocity.

Figure 4.
Validation of the simulation results [32].
Figure 4.
Validation of the simulation results [32].

Figure 5.
Dimensions of referenced section.

Figure 6.
Tangential velocity profiles at z = −500 mm section (vin = 8 m/s).

Figure 7.
Contour plot of the particles erosion rate on the cyclone wall.

Figure 8.
Erosion location of the cylinder and cone.

Figure 9.
Comparison of the cone erosion location.

Figure 10.
Location of the cone erosion for different particle diameters (50, 100, 200 μm).

Figure 11.
Erosion contour with different cone velocities.

Figure 12.
Erosion rate for different cone velocities.

Figure 13.
Dimension of the cones.

Figure 14.
The tangential velocity for different cone length in z = −500 mm.

Figure 15.
The overall efficiency and grade efficiency for different cone lengths.

Figure 16.
Erosion contour for different cone lengths.

Figure 17.
The comparison for the maximum erosion rate of different cone lengths.

Figure 18.
Geometries of the vortex finders.

Figure 19.
Cone erosion rate varied with different vortex finders.

Figure 20.
Cone erosion contour with different vortex finders.


Table 1.
Comparisons of maximum erosion rate and separation performance for different cyclones.
| dc/mm | h/mm | Maximum Erosion Rate Reduction Rate/% | Efficiency/% | Pressure Drop/Pa | |
|---|---|---|---|---|---|
| Original structure | 50 | 270 | 84.8 | 624 | |
| Dust exit diameter dc | 65 | 270 | 42.85 | 83.3 | 575 |
| 80 | 270 | 65.14 | 80.6 | 552 | |
| Cone length size h | 50 | 300 | 27.43 | 83.7 | 563 |
| 50 | 324 | 40.57 | 82.9 | 555 | |
| Type B | 50 | 270 | 2.86 | 88.4 | 424 |
| Type C | 50 | 270 | 82.28 | 91.6 | 326 |
| Type D | 50 | 270 | 88.00 | 93.3 | 159 |
Publisher’s Note: MDPI stays neutral with regard to jurisdictional claims in published maps and institutional affiliations. |
© 2022 by the authors. Licensee MDPI, Basel, Switzerland. This article is an open access article distributed under the terms and conditions of the Creative Commons Attribution (CC BY) license (https://creativecommons.org/licenses/by/4.0/).
Share and Cite
MDPI and ACS Style
Xiong, Z.; Wang, Y.; Gu, X.; Yang, Y.; Shang, J. A Study on the Erosion Mechanism of an Axial Cyclone Separator for Gas Purification. Separations 2022, 9, 409. https://0-doi-org.brum.beds.ac.uk/10.3390/separations9120409
AMA Style
Xiong Z, Wang Y, Gu X, Yang Y, Shang J. A Study on the Erosion Mechanism of an Axial Cyclone Separator for Gas Purification. Separations. 2022; 9(12):409. https://0-doi-org.brum.beds.ac.uk/10.3390/separations9120409
Chicago/Turabian StyleXiong, Zhiyi, Yanna Wang, Xiaolong Gu, Yunlan Yang, and Jie Shang. 2022. "A Study on the Erosion Mechanism of an Axial Cyclone Separator for Gas Purification" Separations 9, no. 12: 409. https://0-doi-org.brum.beds.ac.uk/10.3390/separations9120409
Note that from the first issue of 2016, this journal uses article numbers instead of page numbers. See further details here.