Article

Analysis of Differentially Expressed Proteins and Modifications Induced by Formaldehyde Using LC-MS/MS

1
The Province and Ministry Co-Sponsored Collaborative Innovation Center for Medical Epigenetics, Tianjin Key Laboratory of Medical Epigenetics, Key Laboratory of Immune Microenvironment and Disease (Ministry of Education), Tianjin Key Laboratory of Cellular Homeostasis and Diseases, Department of Biochemistry and Molecular Biology, Tianjin Medical University, Tianjin 300070, China
2
NHC Key Laboratory of Hormones and Development, Tianjin Key Laboratory of Metabolic Diseases, Chu Hsien-I Memorial Hospital & Tianjin Institute of Endocrinology, Tianjin Medical University, Tianjin 300134, China
*
Authors to whom correspondence should be addressed.
These authors contributed equally to this work.
Submission received: 31 March 2022 / Revised: 19 April 2022 / Accepted: 26 April 2022 / Published: 29 April 2022

Abstract

:
Formaldehyde (FA) is a toxic compound that is considered to have a carcinogenic effect due to its damage to biological macromolecules. However, the influence of FA at the protein level remains to be explored. Here, we used LC-MS/MS to identify the differentially expressed proteins and modifications to proteins between FA-treated and untreated HeLa cells. Among 2021 proteins identified, 196 proteins were significantly down-regulated and 152 up-regulated. The differentially expressed proteins were further analyzed using bioinformatics tools for annotating the characterization of their localizations and functions. To evaluate the interaction of FA with proteins, we performed proteomic analysis for a mass shift of 12 Da on the side chains of lysine, cysteine and tryptophan, which are induced by FA as noticeable signals. We identified the modified proteins and sites, suggesting direct interaction between FA and proteins. Motif analysis further showed the characterization of amino acid sequences that react with FA. Cluster analysis of the modified proteins indicated that the FA-interacting networks are mostly enriched in the nuclei, ribosomes and metabolism. Our study presents the influence of FA on proteomes and modifications, offering a new insight into the mechanisms underlying FA-induced biological effects.

1. Introduction

Formaldehyde (FA) is considered a toxic substance that is used in the manufacture of building materials, in household products and for illegal food preservation. Mounting evidence demonstrates that FA is toxic to the human body [1,2,3]. In particular, FA can cause genotoxic and carcinogenic effects due to damage to DNA or impeding of transcription [4]. It is believed that tumors may be induced by long-term exposure to FA. Indeed, FA is considered a nasal carcinogen through cytotoxicity and auxiliary genotoxicity [5]. FA can directly damage the cells of nasal cavity, resulting in the proliferation of damaged cells, which plays a role throughout the entire process of nasal carcinogenicity. Genotoxicity may be caused by FA through DNA–protein crosslinks and oxidative DNA damage [6]. FA has also been reported to be associated with a risk of leukemia in some epidemiology studies [7,8,9]. However, some studies pointed out that there is not enough evidence to support the hypothesis that FA causes myeloid leukemia [10,11]. FA has long been considered to be ‘carcinogenic to humans’ in Group 1 by the International Agency for Research on Cancer (IARC, 2006), although the underlying mechanisms remain unclear. Recent works still cannot exclude the possibility that FA increases the risk of lung cancer and other cancers [12,13]. In addition, FA is thought to induce the occurrence of neurodegenerative diseases [14]. Recent work further demonstrates that FA results in the suppression of effector T cell activities, thereby contributing to an immunosuppressive environment and the progression of cancer [15].
To understand the molecular mechanism of FA-induced damage to biological macromolecules, a variety of methods have been employed to determine the levels and effects of FA, including spectrophotometry, fluorescence, liquid chromatography (LC) and mass spectrometry (MS) [16,17,18,19,20,21]. At present, liquid chromatography tandem mass spectrometry (LC-MS/MS) is a powerful tool for proteomics analysis and protein modification identification [22,23], and thus can provide more detailed information regarding protein alterations induced by FA compared to traditional methods [24,25,26,27]. However, the effect of FA at the protein level remains to be explored.
Tayri-Wilk et al. recently reported the mechanism underlying FA-induced cross-linking in proteins [16]. The FA-induced cross-linking reaction can be adopted to analyze protein structure [21,28]. Thus, we reasonably assumed that FA-induced reactions in proteins could be used as signals to decipher the effects of FA on proteomes and to determine the proteins that interact with FA. In this study, we employed LC-MS/MS for the detection of protein alterations between HeLa cells treated using FA (experimental group) and HeLa cells without FA treatment (control group). Pearson’s correlation coefficient (PCC) and principal component analysis (PCA) both demonstrated the reliability of our data. Among a total of 2021 proteins identified, 196 were significantly down-regulated and 152 were obviously up-regulated. The differentially expressed proteins were further analyzed using bioinformatics tools to characterize their localization and functions. To evaluate the effect of FA on proteins, we comprehensively analyzed a mass shift of +12 Da on lysine (K), cysteine (C) and tryptophan (W) as FA-induced signals. Thus, we identified the modified sites, suggesting direct interaction between FA and proteins. Cluster analysis of the modified proteins showed that the networks with FA interactions were mainly enriched in the nucleus, ribosomes, and metabolism. Our study presents the influence of FA on proteomes and modifications, and it is useful for understanding the mechanism underlying FA-induced biological effects.

2. Materials and Methods

2.1. Chemicals and Reagents

Cell culture medium was supplied by Invitrogen (Grand Island, NY, USA). Fetal bovine serum (FBS) was purchased from VivaCell Biosciences (Shanghai, China). C18 ZipTips were obtained from Millipore (Bedford, MA, USA). Sequencing-grade modified trypsin was purchased from Promega (Madison, WI, USA). BCA protein assay kit and formic acid were bought from Thermo Fisher Scientific Inc. (Rockford, IL, USA). Formaldehyde solution (36.5–38% in water), dithiothreitol, iodoacetamide, cysteine, and ammonium bicarbonate were obtained from Sigma-Aldrich (Shanghai, China).

2.2. Cell Culture, Protein Extraction and Digestion

HeLa cells were cultured in DMEM medium supplemented with 10% FBS and 1% penicillin/streptomycin at 37 °C in a humidified incubator at 5% CO2. When reaching a confluence of approximately 80%, cells were treated with 1% FA (final concentration) for 15 min (for proteomics analysis) or 24 h (for modification analysis), respectively, while untreated cells were used as controls. After treatment, cells were washed twice in ice-cold phosphate-buffered saline (PBS). Plates were put on ice and 1 mL RIPA lysis buffer (1% TritonX-100, 0.1% SDS, 50 mM Tris, 150 mM NaCl, 1% sodium deoxycholate, 2 mM sodium pyrophosphate,1 mM EDTA, with 1× protease inhibitor cocktail and 1× deacetylase inhibitor cocktail) was added. After 30 min of incubation, cells were scraped and supernatants were collected after centrifuging at 12,000× g for 3 min. Protein concentrations were measured using a BCA protein assay kit, and equal total protein amounts (100 ug) in each sample were precipitated by adding trichloroacetic acid (TCA) up to 25% final concentration (v/v). After washing twice with −20 °C acetone, the protein pellets were dissolved in 100 mM NH4HCO3 (pH 8.0) for digestion. Protein solutions were subjected to tryptic digestion at 37 °C for 16 h. Dithiothreitol was added to a final concentration of 5 mM followed by incubation at 56 °C for 1 h. Iodoacetamide was added to alkylate proteins with a final concentration of 15 mM followed by incubation at room temperature in the dark for 45 min. The alkylation reaction was quenched with 30 mM of cysteine (final concentration) at room temperature for another 30 min. Trypsin was then added again with a ratio of trypsin to protein of 1:100 (w/w) for digestion at 37 °C for 4 h to complete the process. Three technical replicates and two biological replicates were analyzed.

2.3. LC-MS/MS Analysis

Tryptic peptides were desalted using C18 ZipTips according to the manufacturer’s instructions before LC-MS/MS analysis. Peptides were dissolved in HPLC buffer A (0.1% (v/v) formic acid in water) before being injected into a Nano-LC system (EASY-nLC 1000, Thermo Fisher Scientific, Waltham, MA, USA). Peptide separation was performed usig a reversed-phase C18 analytical column (75 µm inner-diameter × 15 cm, 3 µm C18) with a 75 min HPLC gradient. The gradient comprised increases from 5% to 13% solvent B (0.1% (v/v) formic acid in 100% ACN) for 16 min, from 13% to 28% for 35 min, from 28% to 40% for 15 min, and from 40% to 100% in 1 min followed by holding at 100% for the last 8 min, all at a constant flow rate of 300 nl/min. The HPLC elutes were electrosprayed directly into an Orbitrap Q-Exactive mass spectrometer (Thermo Fisher Scientific, Waltham, MA, USA). Mass spectrometric analysis was carried out in data-dependent mode with an automatic switch between a full MS scan and an MS/MS scan in the orbitrap. For the full MS survey scan, the automatic gain control (AGC) target was 3e6 and scan range was from 350 to 1750 at a resolution of 70,000. The 15 most intense peaks with charge state 2 and above were selected for fragmentation by higher-energy collision dissociation (HCD) with a normalized collision energy of 27%. MS2 spectra were acquired at a resolution of 17,500. The exclusion duration for the data-dependent scan was 20 s, and the isolation window was set at 2.0 Da.

2.4. Database Search

The resulting MS/MS data were searched against the UniProt database using Maxquant software (v.1.5.5.1). Label-free quantitation (LFQ) was performed to determine the relative quantification of the proteins. Peptide sequences were searched using trypsin specificity and allowing a maximum of five missed cleavages. Mass error was set to 10 ppm for precursor ions and 0.02 Da for fragment ions. Mass shifts (+12 Da) on lysine (K), cysteine (C), tryptophan (W), oxidation on methionine (M), and acetylation on protein N-terminal were set as variable modifications. False discovery rate (FDR) thresholds for protein, peptide, and modification site were specified at 1%. Minimum peptide length was set at 7. All other parameters in MaxQuant were set to the default values. MaxQuant search results were exported, and reverse matches and possible contaminants were deleted. Furthermore, modified peptides with scores less than 40 and localization probability scores less than 0.75 were removed. The relative quantification of the proteins was determined by LFQ intensity. The threshold for up- or down-regulated proteins was set as a twofold change.

2.5. Bioinformatic Analysis

The majority of bioinformatics analysis was accomplished using R (v.4.1.3) and Microsoft Excel. We performed correlation analysis by using the R package corrplot (v.0.92) to identify highly correlated variables. Principal component analysis (PCA) was performed through the R packages FactoMineR (v.2.0) and factoextra (v.1.0.7). The volcano plot was created using the R package ggplot2 (v.3.3.5). Gene Ontology (GO) enrichment analysis was performed using a hypergeometric test in R package clusterProfiler (v.4.1.4) for which the p.adjust threshold was specified at 0.05. The String database (v.11.5) was read into Cytoscape (v.3.9.0) for visualization of protein–protein interactions and the minimum required interaction score was set to 0.4. Motif analysis of modified sequences was visualized using iceLogo (v.1.3.8). Protein domain and Kyoto Encyclopedia of Genes and Genomes (KEGG) pathway enrichment was analyzed using the String database. Structure visualization was presented with PyMOL (v.1.8.4.0). The histogram was obtained using Prism Software 9.0 (GraphPad). For all statistical analyses, a two-tailed p value less than 0.05 was considered to be statistically significant.

3. Results and Discussion

3.1. The Design of Analysis Method

As a reactive compound, FA has long been considered to produce serious influences on survival, growth, and differentiation of cells [1]. In particular, FA causes the abnormal expression of proteins [27]. Recent studies showed that FA can induce the occurrence of chemical modifications on proteins [21]. For example, a mass shift of +12 Da at lysine residues (K) has been revealed as an important signal of FA adduction. Similar reactions are observed at tryptophan (W) and cysteine (C) [28]. Thus, we rationally hypothesized that these signals could be used as protein modifications for understanding the effect of FA at the protein level. A brief description of our strategy is illustrated in Figure 1. We chose two groups of cells, those treated with FA being the experimental sample while those not so treated being the control sample. Proteins were extracted and separated from cells and subjected to in-solution tryptic digestion; subsequently, the resulting peptides were analyzed using LC-MS/MS. The MS raw data were further analyzed for proteome quantification and FA-induced modifications. The differentially expressed proteins and modifications were finally analyzed using bioinformatics tools to investigate the impact of FA.

3.2. Evaluation of Analysis Data Quality

It has been reported that a 15 min treatment with FA has a measurable effect on cell outcomes [29], and thus we chose that condition as the experimental group for proteomics analysis. The control group was tested without FA treatment in parallel. To obtain accurate quantification of proteomes, we performed two biological replicate experiments and three technical replicates for each sample. To evaluate the robustness and reliability of these results, we performed Pearson’s correlation coefficient analysis (PCC) and principal component analysis (PCA). As shown in Figure 2A, all correlation coefficients were over 0.90, indicating strong correlations. Excellent correlations among replicates show that our data are reliable. Through PCA analysis of proteomic data, we could easily distinguish the FA-treated samples from control samples, and no batch effects were observed. The two groups of samples are represented by different shapes, and the ellipse shape represents the 0.95 confidence intervals for each type. This result demonstrates that there were significant differences in protein expression between the experimental group and the control group, suggesting changes to proteomes from FA treatment.

3.3. Analysis of Proteins Differentially Induced by FA

To determine the differential inducement of proteins by FA, we used A label-free strategy for quantification of proteomes. The resulting normal distribution of the relative protein abundance between the experimental group and the control group indicated that the data were reasonable and comparable (Figure 3A). Among a total of 2021 proteins identified, 348 proteins were significantly distinguished, including 152 up-regulated proteins (>2-fold increase, p < 0.05) and 196 down-regulated proteins (>2-fold decrease, p < 0.05), as shown in Figure 3B; the results are summarized in Supplementary Material Tables S1–S3. We further characterized the significantly changed proteins via GO analysis. It can be seen from Figure 3C,D that the down-regulated proteins were enriched in DNA- and chromatin-related proteins, while the up-regulated proteins were mostly enriched in metabolic pathways such as fatty acids and lipids. These results suggest that alterations to proteins are induced by FA.

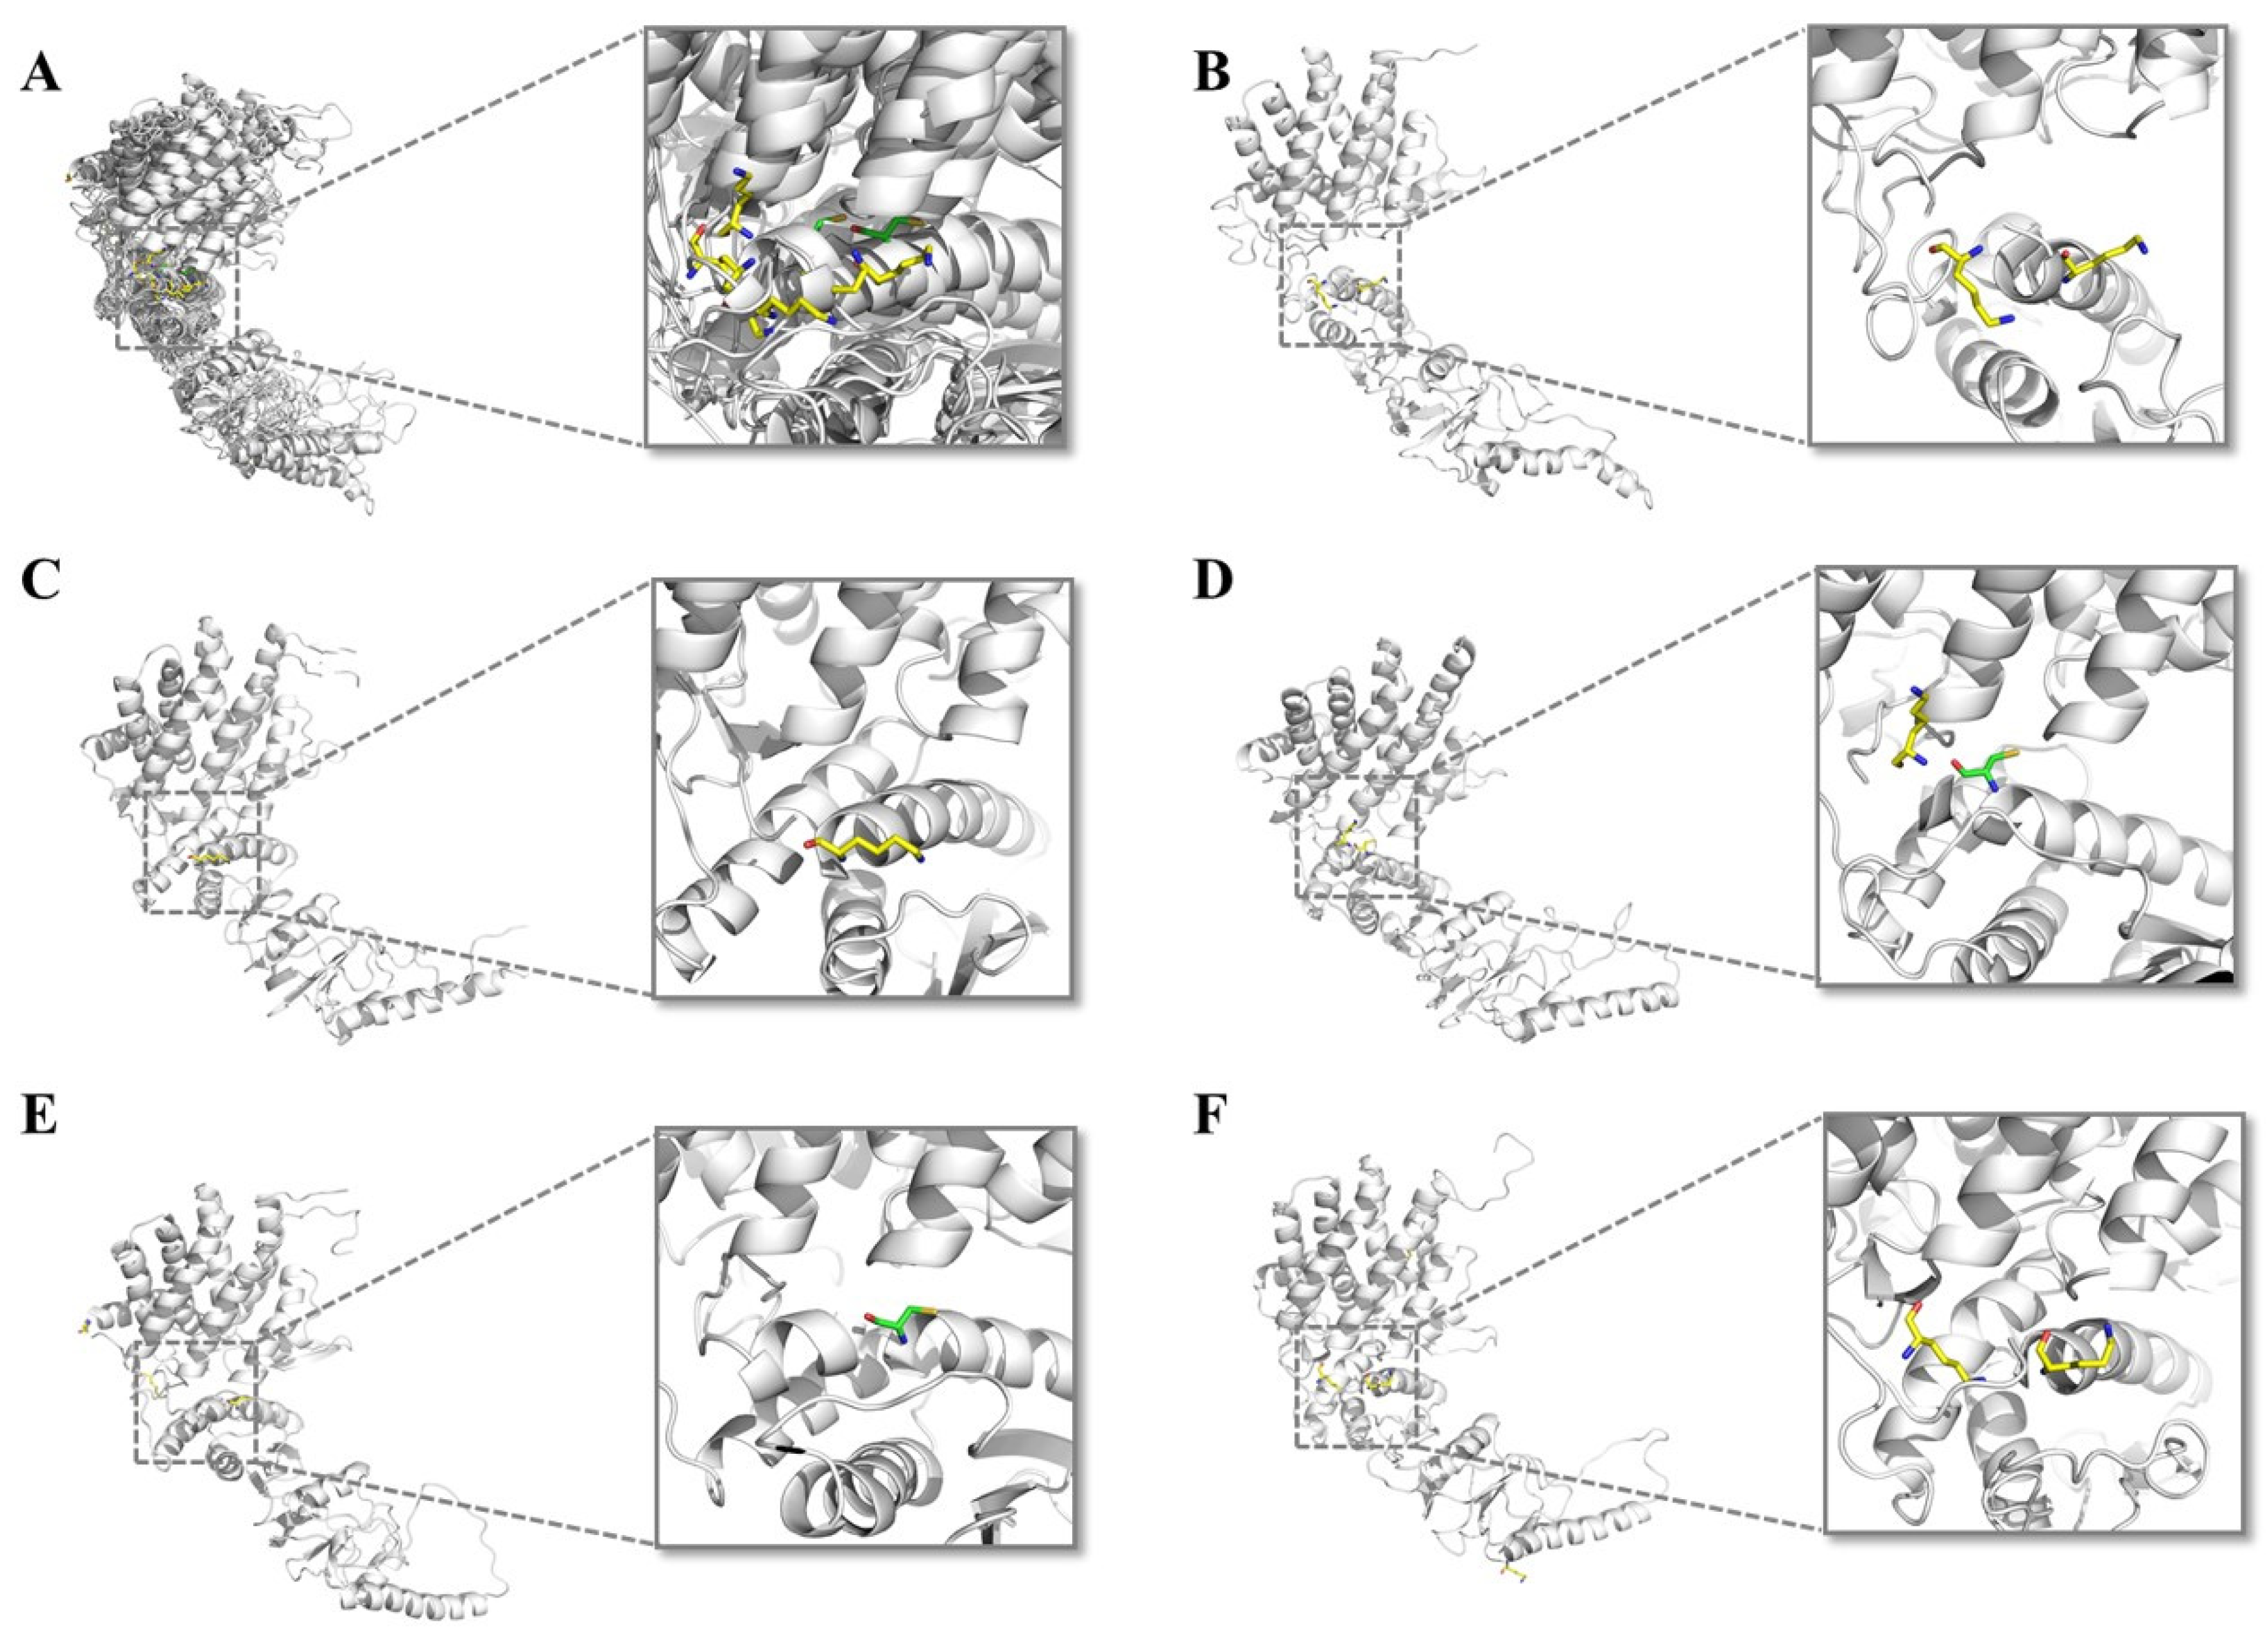
3.4. The Analysis of Protein Modifications Induced by FA

It is known that FA can induce chemical reactions involving proteins. However, the detailed chemical modifications and mechanisms underlying FA-induced reactions are not very clear. Recent studies revealed that +12 Da on the side chain of the lysine residue is an obvious signal of FA reactions with proteins in MS analysis [16,21,30]. The reaction mechanism is shown in Supplementary Material Figure S1. FA is first added to the amino group on the side chain of the lysine residue (+30 Da), and then is turned into an imine group via dehydration (+12 Da). Similar adduction occurs on other amino acids such as cysteine and tryptophan [31]. Thus, we analyzed these modifications at the proteomics level in the experimental group and the control group. We found increases in number of modified sites in the experimental group, compared to the control group (Figure 4A), suggesting that these modified sites were induced by FA. Next, we analyzed the frequency of the modifications in proteins, including 52 proteins that had one modified site, 42 proteins that had two modified sites, and 25 proteins that had three or more modified sites (Figure 4B), as shown in Supplementary Material Table S4.
We also analyzed the position-specific amino acid frequency of the surrounding sequences (15 amino acids to both termini) of modification using icelogo software, as shown in Figure 4C. To understand the selectivity of the FA-induced reaction to proteins, we further studied the structural properties of the modified proteins through the String database. We found that GroEL-like apical domain superfamily, Chaperone tailless complex polypeptide 1 (TCP-1), NAD (P)-binding domain superfamily and ATPase and nucleotide binding domains were the main domains of these modified proteins (Figure 4D). Next, we selected five typical proteins from the GroEL-like apical domain superfamily and the Chaperone tailless complex polypeptide 1 (TCP-1) domain. The protein structures were obtained from the RCSB PDB database (PDB ID: 6NR8). The five protein subunits were TCP1, CCT2, CCT4, CCT5, and CCT8, and they belonged to the homologous proteins. As shown in Figure 5, we annotated the site of the modification on the protein, with lysine (K) in yellow and cysteine (C) in green. The identified modification sites of the proteins observed were as follows: K406 and K400 of TCP1 protein, K402 of CCT2, K414 and K418 of CCT4, C407 of CCT5, and K400 and K406 of CCT8. It can be seen that the five proteins are structurally similar, and the modification sites are clustered in the same region of the protein, suggesting that specific domains and sites prefer to interact with FA. To further characterize the proteins interacting with FA, we analyzed the modified proteins using KEGG. As shown in Figure 6A, the modified proteins were enriched in ribosome proteins, nucleoproteins and metabolic enzymes. To investigate correlations among the modified proteins, we analyzed protein–protein interaction networks via String and Cytoscape, and the interaction network indicated that these modified proteins are closely related (Figure 6B). The results illustrated the proteins that interacted with FA in cells and presented the characterization and relationships of these modified proteins.
As a toxic compound, FA is associated with a variety of diseases, including tumors and neurodegenerative and immune diseases [1,3,14,15]. Although the underlying mechanisms remain unclear, cytotoxicity and genotoxicity induced by FA is considered to be damaging to human health. For example, FA can cause degeneration and necrosis of respiratory epithelial cells in the nasal cavity, resulting in cell proliferation and squamous metaplasia, and these changes are associated with tumor progression [6]. In addition, FA has displayed mutagenic and genotoxic activities by crosslinking DNA and protein, finally resulting in nasal cavity tumorigenicity [6]. However, the pathway of nasal cavity tumor development is currently not very clear. FA had been considered to be associated with risk of leukemia in some epidemiology studies [8]; however, recent studies demonstrated that not enough evidence could support the relationship between FA exposure and cancer [11]. Therefore, the mechanism of FA-induced carcinogenicity remains to be explored further.
In this work, we provide insight into the alterations to proteomics and the modifications induced by FA. From a total of 2021 proteins identified, we found effects of FA on protein levels, in particular revealing that down-regulated proteins were enriched in DNA and chromatin, while up-regulated proteins were mostly localized in metabolic pathways. The identification of protein modifications induced by FA provides evidence that supports the interactions between proteins and FA, suggesting a FA-interaction network. This information may be a vital clue to revealing the mechanism of FA-induced biological effects in future works.

4. Conclusions

In this study, we combined LC-MS/MS and bioinformatics tools for the analysis of proteomes and protein modifications induced by FA. We identified 152 up-regulated proteins that were mainly enriched in metabolism and 196 down-regulated proteins that were focused on nuclear-related processes. We identified the 119 modified proteins that adducted a mass shift of 12 Da at K, W and C, and characterized the motifs of the modifications. Herein, we developed an approach towards analysis of the effect of FA at the protein level, providing a new view for understanding the biological significance of FA addition.

Supplementary Materials

The following supporting information can be downloaded at: https://0-www-mdpi-com.brum.beds.ac.uk/article/10.3390/separations9050112/s1, Figure S1: Formaldehyde reacts with proteins to produce +30 Da or +12 Da mass shift on lysine, cysteine and tryptophan residues; Table S1: Information of identified proteins of FA-treated 15 min and untreated; Table S2: Information of upregulated (fold change >2 increase, p < 0.05) proteins induced by FA; Table S3: Information of downregulated (fold change >2 decrease, p < 0.05) proteins induced by FA; Table S4: Information of total proteins identified with FA-modified sites.

Author Contributions

S.T. and K.Z. conceived and designed the experiments. R.L. and Y.H. performed the experiments. R.L., Y.H., Z.W., J.Z., Y.Z., L.S., S.T. and K.Z. analyzed the data. R.L., S.T. and K.Z. wrote and critically revised the manuscript. All authors have read and agreed to the published version of the manuscript.

Funding

This research was supported by the Funding of National Natural Science Foundation of China to K.Z. (21874100 and 22074103), Tianjin Municipal Science and Technology Commission to K.Z. (19JCZDJC35000) and to S.T. (19JCQNJC08900), and the Talent Excellence Program from Tianjin Medical University to K.Z.

Institutional Review Board Statement

Not applicable.

Informed Consent Statement

Not applicable.

Data Availability Statement

The mass spectrometry proteomics data were deposited to the ProteomeXchange Consortium (http://proteomecentral.proteomexchange.org, accessed on 19 April 2022) via the iProX partner repository, with data set identifier PXD033286.

Conflicts of Interest

The authors declare no conflict of interest.

References

  1. Bernardini, L.; Barbosa, E.; Charao, M.F.; Brucker, N. Formaldehyde toxicity reports fromin vitro and in vivo studies: A review and updated data. Drug Chem. Toxicol. 2020, 45, 972–984. [Google Scholar] [CrossRef] [PubMed]
  2. Dingler, F.A.; Wang, M.; Mu, A.; Millington, C.L.; Oberbeck, N.; Watcham, S.; Pontel, L.B.; Kamimae-Lanning, A.N.; Langevin, F.; Nadler, C.; et al. Two Aldehyde Clearance Systems Are Essential to Prevent Lethal Formaldehyde Accumulation in Mice and Humans. Mol. Cell 2020, 80, 996–1012.e9. [Google Scholar] [CrossRef] [PubMed]
  3. Wang, F.; Chen, D.; Wu, P.; Klein, C.; Jin, C. Formaldehyde, Epigenetics, and Alzheimer’s Disease. Chem. Res. Toxicol. 2019, 32, 820–830. [Google Scholar] [CrossRef] [PubMed]
  4. Szende, B.; Tyihak, E. Effect of formaldehyde on cell proliferation and death. Cell Biol. Int. 2010, 34, 1273–1282. [Google Scholar] [CrossRef]
  5. Marsh, G.M.; Youk, A.O.; Buchanich, J.M.; Erdal, S.; Esmen, N.A. Work in the metal industry and nasopharyngeal cancer mortality among formaldehyde-exposed workers. Regul. Toxicol. Pharmacol. 2007, 48, 308–319. [Google Scholar] [CrossRef]
  6. Nishikawa, A.; Nagano, K.; Kojima, H.; Ogawa, K. A comprehensive review of mechanistic insights into formaldehyde-induced nasal cavity carcinogenicity. Regul. Toxicol. Pharmacol. 2021, 123, 104937. [Google Scholar] [CrossRef]
  7. Bachand, A.M.; Mundt, K.A.; Mundt, D.J.; Montgomery, R.R. Epidemiological studies of formaldehyde exposure and risk of leukemia and nasopharyngeal cancer: A meta-analysis. Crit. Rev. Toxicol. 2010, 40, 85–100. [Google Scholar] [CrossRef]
  8. Checkoway, H.; Boffetta, P.; Mundt, D.J.; Mundt, K.A. Critical review and synthesis of the epidemiologic evidence on formaldehyde exposure and risk of leukemia and other lymphohematopoietic malignancies. Cancer Causes Control 2012, 23, 1747–1766. [Google Scholar] [CrossRef] [Green Version]
  9. Kwon, S.C.; Kim, I.; Song, J.; Park, J. Does formaldehyde have a causal association with nasopharyngeal cancer and leukaemia? Ann. Occup. Environ. Med. 2018, 30, 5. [Google Scholar] [CrossRef] [Green Version]
  10. Allegra, A.; Spatari, G.; Mattioli, S.; Curti, S.; Innao, V.; Ettari, R.; Allegra, A.G.; Giorgianni, C.; Gangemi, S.; Musolino, C. Formaldehyde Exposure and Acute Myeloid Leukemia: A Review of the Literature. Medicina 2019, 55, 638. [Google Scholar] [CrossRef] [Green Version]
  11. Pira, E.; Romano, C.; Vecchia, C.; Boffetta, P. Hematologic and cytogenetic biomarkers of leukemia risk from formaldehyde exposure. Carcinogenesis 2017, 38, 1251–1252. [Google Scholar] [CrossRef] [PubMed]
  12. Kwak, K.; Paek, D.; Park, J.T. Occupational exposure to formaldehyde and risk of lung cancer: A systematic review and meta-analysis. Am. J. Ind. Med. 2020, 63, 312–327. [Google Scholar] [CrossRef] [PubMed]
  13. Mahboubi, A.; Koushik, A.; Siemiatycki, J.; Lavoue, J.; Rousseau, M.C. Assessment of the effect of occupational exposure to formaldehyde on the risk of lung cancer in two Canadian population-based case-control studies. Scand. J. Work Environ. Health 2013, 39, 401–410. [Google Scholar] [CrossRef] [PubMed] [Green Version]
  14. Hu, Y.; Wu, L.; Yang, S.Q.; Wei, H.J.; Wang, C.Y.; Kang, X.; Jiang, J.M.; Zhang, P.; Tang, X.Q. Formaldehyde induces ferritinophagy to damage hippocampal neuronal cells. Toxicol. Ind. Health 2021, 37, 685–694. [Google Scholar] [CrossRef]
  15. Park, J.; Yang, H.S.; Song, M.K.; Kim, D.I.; Lee, K. Formaldehyde exposure induces regulatory T cell-mediated immunosuppression via calcineurin-NFAT signalling pathway. Sci. Rep. 2020, 10, 17023. [Google Scholar] [CrossRef] [PubMed]
  16. Tayri-Wilk, T.; Slavin, M.; Zamel, J.; Blass, A.; Cohen, S.; Motzik, A.; Sun, X.; Shalev, D.E.; Ram, O.; Kalisman, N. Mass spectrometry reveals the chemistry of formaldehyde cross-linking in structured proteins. Nat. Commun. 2020, 11, 3128. [Google Scholar] [CrossRef]
  17. Xie, Z.; Ge, J.; Zhang, H.; Bai, T.; He, S.; Ling, J.; Sun, H.; Zhu, Q. A highly selective two-photon fluorogenic probe for formaldehyde and its bioimaging application in cells and zebrafish. Sens. Actuators B Chem. 2017, 241, 1050–1056. [Google Scholar] [CrossRef]
  18. He, L.; Yang, X.; Ren, M.; Kong, X.; Liu, Y.; Lin, W. An ultra-fast illuminating fluorescent probe for monitoring formaldehyde in living cells, shiitake mushrooms, and indoors. Chem. Commun. 2016, 52, 9582–9585. [Google Scholar] [CrossRef] [Green Version]
  19. Im, H.; Oh, E.; Mun, J.; Khim, J.-Y.; Lee, E.; Kang, H.-S.; Kim, E.; Kim, H.; Won, N.-H.; Kim, Y.-H.; et al. Evaluation of Toxicological Monitoring Markers Using Proteomic Analysis in Rats Exposed to Formaldehyde. J. Proteome Res. 2006, 5, 1354–1366. [Google Scholar] [CrossRef]
  20. Roth, A.; Li, H.; Anorma, C.; Chan, J. A Reaction-Based Fluorescent Probe for Imaging of Formaldehyde in Living Cells. J. Am. Chem. Soc. 2015, 137, 10890–10893. [Google Scholar] [CrossRef]
  21. Zhang, Y.; Du, Y.; Li, M.; Zhang, D.; Xiang, Z.; Peng, T. Activity-Based Genetically Encoded Fluorescent and Luminescent Probes for Detecting Formaldehyde in Living Cells. Angew. Chem. Int. Ed. Engl. 2020, 59, 16352–16356. [Google Scholar] [CrossRef] [PubMed]
  22. Shen, L.; Dong, H.; Guo, Z.; Zhai, G.; Zhang, K. Identification of Abnormal Proteins in Plasma from Gout Patients by LC-MS/MS. Separations 2021, 8, 85. [Google Scholar] [CrossRef]
  23. Dong, H.Y.; Zhao, Y.J.; Bi, C.F.; Han, Y.; Zhang, J.J.; Bai, X.; Zhai, G.J.; Zhang, H.; Tian, S.S.; Hu, D.Q.; et al. TmcA functions as a lysine 2-hydroxyisobutyryltransferase to regulate transcription. Nat. Chem. Biol. 2022, 18, 142–151. [Google Scholar] [CrossRef]
  24. Mohanty, B.P.; Mahanty, A.; Mitra, T.; Mohanty, S.; Naik, A.K.; Parija, S.C. Proteomic and transcriptomic changes in rat liver following oral feeding of formaldehyde. Chemosphere 2020, 245, 125599. [Google Scholar] [CrossRef]
  25. Emirbayer, P.E.; Sinha, A.; Ignatchenko, V.; Hoyer, S.; Dorrie, J.; Schaft, N.; Pischetsrieder, M.; Kislinger, T. Proteomic Response of Human Umbilical Vein Endothelial Cells to Histamine Stimulation. Proteomics 2017, 17, 1700116. [Google Scholar] [CrossRef]
  26. Ahn, K.H.; Kim, S.K.; Lee, J.M.; Jeon, H.J.; Lee, D.H.; Kim, D.K. Proteomic Analysis of Bronchoalveolar Lavage Fluid Obtained from Rats Exposed to Formaldehyde. J. Health Sci. 2010, 56, 287–295. [Google Scholar] [CrossRef] [Green Version]
  27. Jeon, Y.-M.; Ryu, J.-C.; Lee, M.-Y. Proteomic Analysis of Differentially Expressed Proteins in Human Lung Cells Following Formaldehyde Treatment. Mol. Cell. 2007, 3, 238–245. [Google Scholar]
  28. Zhu, R.; Zhang, G.; Jing, M.; Han, Y.; Li, J.; Zhao, J.; Li, Y.; Chen, P.R. Genetically encoded formaldehyde sensors inspired by a protein intra-helical crosslinking reaction. Nat. Commun. 2021, 12, 581. [Google Scholar] [CrossRef]
  29. Nocentini, S.; Moreno, G.; Coppey, J. Survival, DNA synthesis and ribosomal RNA transcription in monkey kidney cells treated by formaldehyde. Mutat. Res. 1980, 70, 231–234. [Google Scholar] [CrossRef]
  30. Metz, B.; Michiels, T.; Uittenbogaard, J.; Danial, M.; Tilstra, W.; Meiring, H.D.; Hennink, W.E.; Crommelin, D.J.A.; Kersten, G.F.A.; Jiskoot, W. Identification of Formaldehyde-Induced Modifications in Diphtheria Toxin. J. Pharm. Sci. 2020, 109, 543–557. [Google Scholar] [CrossRef] [Green Version]
  31. Liu, J.; Chan, K.K.; Chan, W. Identification of Protein Thiazolidination as a Novel Molecular Signature for Oxidative Stress and Formaldehyde Exposure. Chem. Res. Toxicol. 2016, 29, 1865–1871. [Google Scholar] [CrossRef] [PubMed]
Figure 1. Schematic overview of the experimental and data analysis workflow.
Separations 09 00112 g001
Figure 2. Evaluation of analysis data quality. (A) Pearson’s correlation coefficient (PCC). The thickness of the line represents the value of the PCC. The thinner the line, the closer it is to 1. (B). Principal component analysis (PCA). The ellipse represents the 0.95 confidence intervals.
Separations 09 00112 g002
Figure 3. Identification of differentially expressed proteins and GO enrichment analysis. (A) Histogram showing distribution of relative protein abundance between FA-treated and control cells. (B) Volcano plot of differential protein expression in FA-treated group compared to control group. Differentially expressed proteins were deemed significant if p < 0.05 and absolute fold change >2. Blue dots represent down-regulated proteins; red dots represent up-regulated proteins; grey dots represent other identified proteins that were not significantly changed. (C,D) GO enrichment analysis of up-regulated or down-regulated proteins. BP: biological process; CC: cellular component; MF: molecular function.
Separations 09 00112 g003
Figure 4. Characterization of domains and sequence recognition of motifs. (A) Comparison of the number of modifications between FA-treated group and control group. (B) Frequency of FA-induced modification on proteins. (C) The consensus sequence logos show enrichment of amino acid residues among the K+12 Da using icelogo software. Motifs with significance of p < 0.05 are shown. The motifs take lysine as center and show the distribution of seven amino acids on both sides. (D) Statistics of the various domains of FA-induced modification proteins in HeLa.
Separations 09 00112 g004
Figure 5. Analysis of different modified protein structures induced by FA. (A) Superposition diagram of structural comparison of the five proteins. (B) TCP1 protein; the identified modification sites are K406 and K400. (C) CCT2 protein; the identified modification site is K402. (D) CCT4 protein; the identified modification sites are C414 and K418. (E) CCT5 protein; the identified modification site is C407. (F) CCT8 protein; the identified modification sites are K400, K406. Yellow and green represent modification sites lysine (K) and cysteine (C), respectively.
Separations 09 00112 g005
Figure 6. Functional annotation of FA-induced modification to proteins. (A) Interaction networks of FA-induced modifications to proteins in HeLa. Blue indicates 54 ribosome-associated proteins; purple indicates 34 proteins associated with nucleoprotein; yellow indicates 31 proteins associated with metabolism. (B) Analysis via KEGG of protein modifications induced by FA in HeLa.
Separations 09 00112 g006
Publisher’s Note: MDPI stays neutral with regard to jurisdictional claims in published maps and institutional affiliations.

