Computing Brain White and Grey Matter Injury Severity in a Traumatic Fall


1
Institute for Future Transport and Cities, Coventry University, Priory Street, Coventry CV1 5FB, UK
2
Department of Mechanical Engineering, University of Birmingham, Edgbaston, Birmingham B15 2TT, UK
*
Author to whom correspondence should be addressed.
Math. Comput. Appl. 2020, 25(3), 61; https://0-doi-org.brum.beds.ac.uk/10.3390/mca25030061
Submission received: 29 July 2020
/
Revised: 18 September 2020
/
Accepted: 19 September 2020
/
Published: 22 September 2020
(This article belongs to the Special Issue Numerical Modelling and Simulation Applied to Head Trauma)
Abstract
:In the real world, the severity of traumatic injuries is measured using the Abbreviated Injury Scale (AIS). However, the AIS scale cannot currently be computed by using the output from finite element human computer models, which currently rely on maximum principal strains (MPS) to capture serious and fatal injuries. In order to overcome these limitations, a unique Organ Trauma Model (OTM) able to calculate the threat to the life of a brain model at all AIS levels is introduced. The OTM uses a power method, named Peak Virtual Power (PVP), and defines brain white and grey matter trauma responses as a function of impact location and impact speed. This research has considered ageing in the injury severity computation by including soft tissue material degradation, as well as brain volume changes due to ageing. Further, to account for the limitations of the Lagrangian formulation of the brain model in representing hemorrhage, an approach to include the effects of subdural hematoma is proposed and included as part of the predictions. The OTM model was tested against two real-life falls and has proven to correctly predict the post-mortem outcomes. This paper is a proof of concept, and pending more testing, could support forensic studies.
1. Introduction
Traumatic Brain Injuries (TBI) have been a major cause of morbidity and mortality for many years, and a major systematic review was conducted in 2005 [1], which is still one of the best-collected references on the subject. As shown in the review, TBIs are the leading cause of death between the ages of 15 and 44 throughout Europe [2]. In Southern Europe, road traffic crashes constitute the vast majority of cases and falls, mainly related to alcohol consumption, are the leading cause of trauma in Northern Europe [3]. Head trauma accounts for a majority of trauma deaths [4]. Some researchers predict that road traffic crash-related injuries will increase from ninth to third in the world disease burden ranking [5]. Another review by Post et al. [6] gives a highly detailed account of the history of TBI from the Wayne State Curve in the early 50’s, through the Gadd Index leading to the Head Injury Criteria (HIC) in the US [7] and the Head Injury Prediction Criterion (HPC) in Europe [8].
These early linear acceleration based criteria have attracted much criticism over the intervening years [6,9], as they do not show high correlation with major parameters, and have led to more advanced models such as GAMBIT [10] and the Head Impact Power criterion [11]. It was shown in 2001 [12] that all theoretically derived criteria, as opposed to empirical criteria like HIC, etc., can be shown to be variants of the theory of Peak Virtual Power (PVP), which is used in this study.
There are a number of papers on TBI that mention falls; however, there are actually few that analyse head injury and compare the results to the real world and even less using Finite Element methods. Some studies have used multibody models, which are good for kinematics but not as effective for injuries [13,14,15].
The papers of most relevance to this study is that of Raul et al. [16] and Lamy et al. [17]. These papers use a detailed FE model, and classical means of determining fall velocities; they output their results against a range of mechanical parameters such as the von Mises stress, Maximum Principal Strain etc., and show reasonable correlation; however, they could not assess the injury severity.
Recent research in falls has produced three papers that are relevant to this study [18]. The paper on “Certified Motorcycle Helmets: Computational Evaluation of the Efficacy of Standard Requirements with Finite Element Models” [19] concentrates on the efficacy of the helmets but uses their own FE model to assess injury metrics for the brain. This model uses hydrostatic pressure and the maximum principal strain against thresholds from the literature, which are quite wide. The results indicated that the helmets were not giving adequate protection against the thresholds; however, no estimate of injury severity was provided. The second study, “The Strain Rates in the Brain, Brainstem, Dura, and Skull under Dynamic Loadings” [20] indicates that the strain rate is important for the type of material models used, which supports the use of PVP. The third study, “Mechanism of Coup and Contrecoup Injuries Induced by a Knock-Out Punch” considers the effects of a single punch on the brain by modelling the cerebrospinal fluid interactions with the brain tissues, based on Smooth Particle Hydrodynamics (SPH). The first deviatoric principal stress was used, and found that the contre-coup injury indicated was higher than that of the coup injury [21]. Finally, the paper by Zhou [22], although not yet peer-reviewed, is relevant, and shows that there is considerable variation in levels of MPS depending on the anatomical model used; this gives support to the approach used here to age the THUMS model.
Modelling accidents, which could be automotive collisions, vehicle to vehicle or vehicle to pedestrians, as well as falls, use often anthropometric test devices (ATD) and in some cases, Human Computer models [23,24,25,26]. ATD’s record displacements, accelerations and forces. During a collision, the ATD’s accelerometer output information is cross-correlated to a probability of threat to life, or calculate the probability of death, based on statistical injury risk curves. ATDs can be used to suggest an overall risk to life, any local trauma assessment is impossible; this is what this research is proposing to overcome.
Real-life injury severity is defined by medical professionals, who have established a trauma injury scale known as the Abbreviated Injury Scale (AIS) [26]. The AIS is internationally accepted and is the primary tool to conclude injury severity and is anatomically based. It is a consensus-derived, global severity scoring system that classifies each injury by body region according to its relative importance (threat to life) on a six-point ordinal scale and provides a standardised terminology to describe injuries and ranks injuries by severity (Table 1).
The measurements from ATDs can only be used to speculate on the overall probability of death and have no internal organs, consequently they are not useful in predicting soft tissue injuries in a deterministic manner. Human-computer models, like the THUMS [26], have modelled the soft organ tissues (heart, kidneys, liver, spleen, liver, grey and white matter) and can output soft tissue Maximum Principal Strains (MPS). The MPS threshold considered in human-computer models are critical MPS values, which are supposed to represent severe injuries (AIS4), i.e., observable damage when physical human tissue tests are performed [28]. The MPS critical injury outputs levels, currently used by the scientific community when using Human-Computer models, are listed in Table 2. However, earlier work [29] has shown that using the THUMS model, in general, MPS significantly over-estimates the magnitude of the injury severity of the body organs; it is very diffuse and cannot predict the location of the injury, whereas PVP can address both these issues.
Using MPS provides a major limitation to trauma computation analysis, as (a) it is only possible to capture if the AIS 4 is reached and (b) it is not possible to compute intermediate AIS levels below and higher than AIS 4.
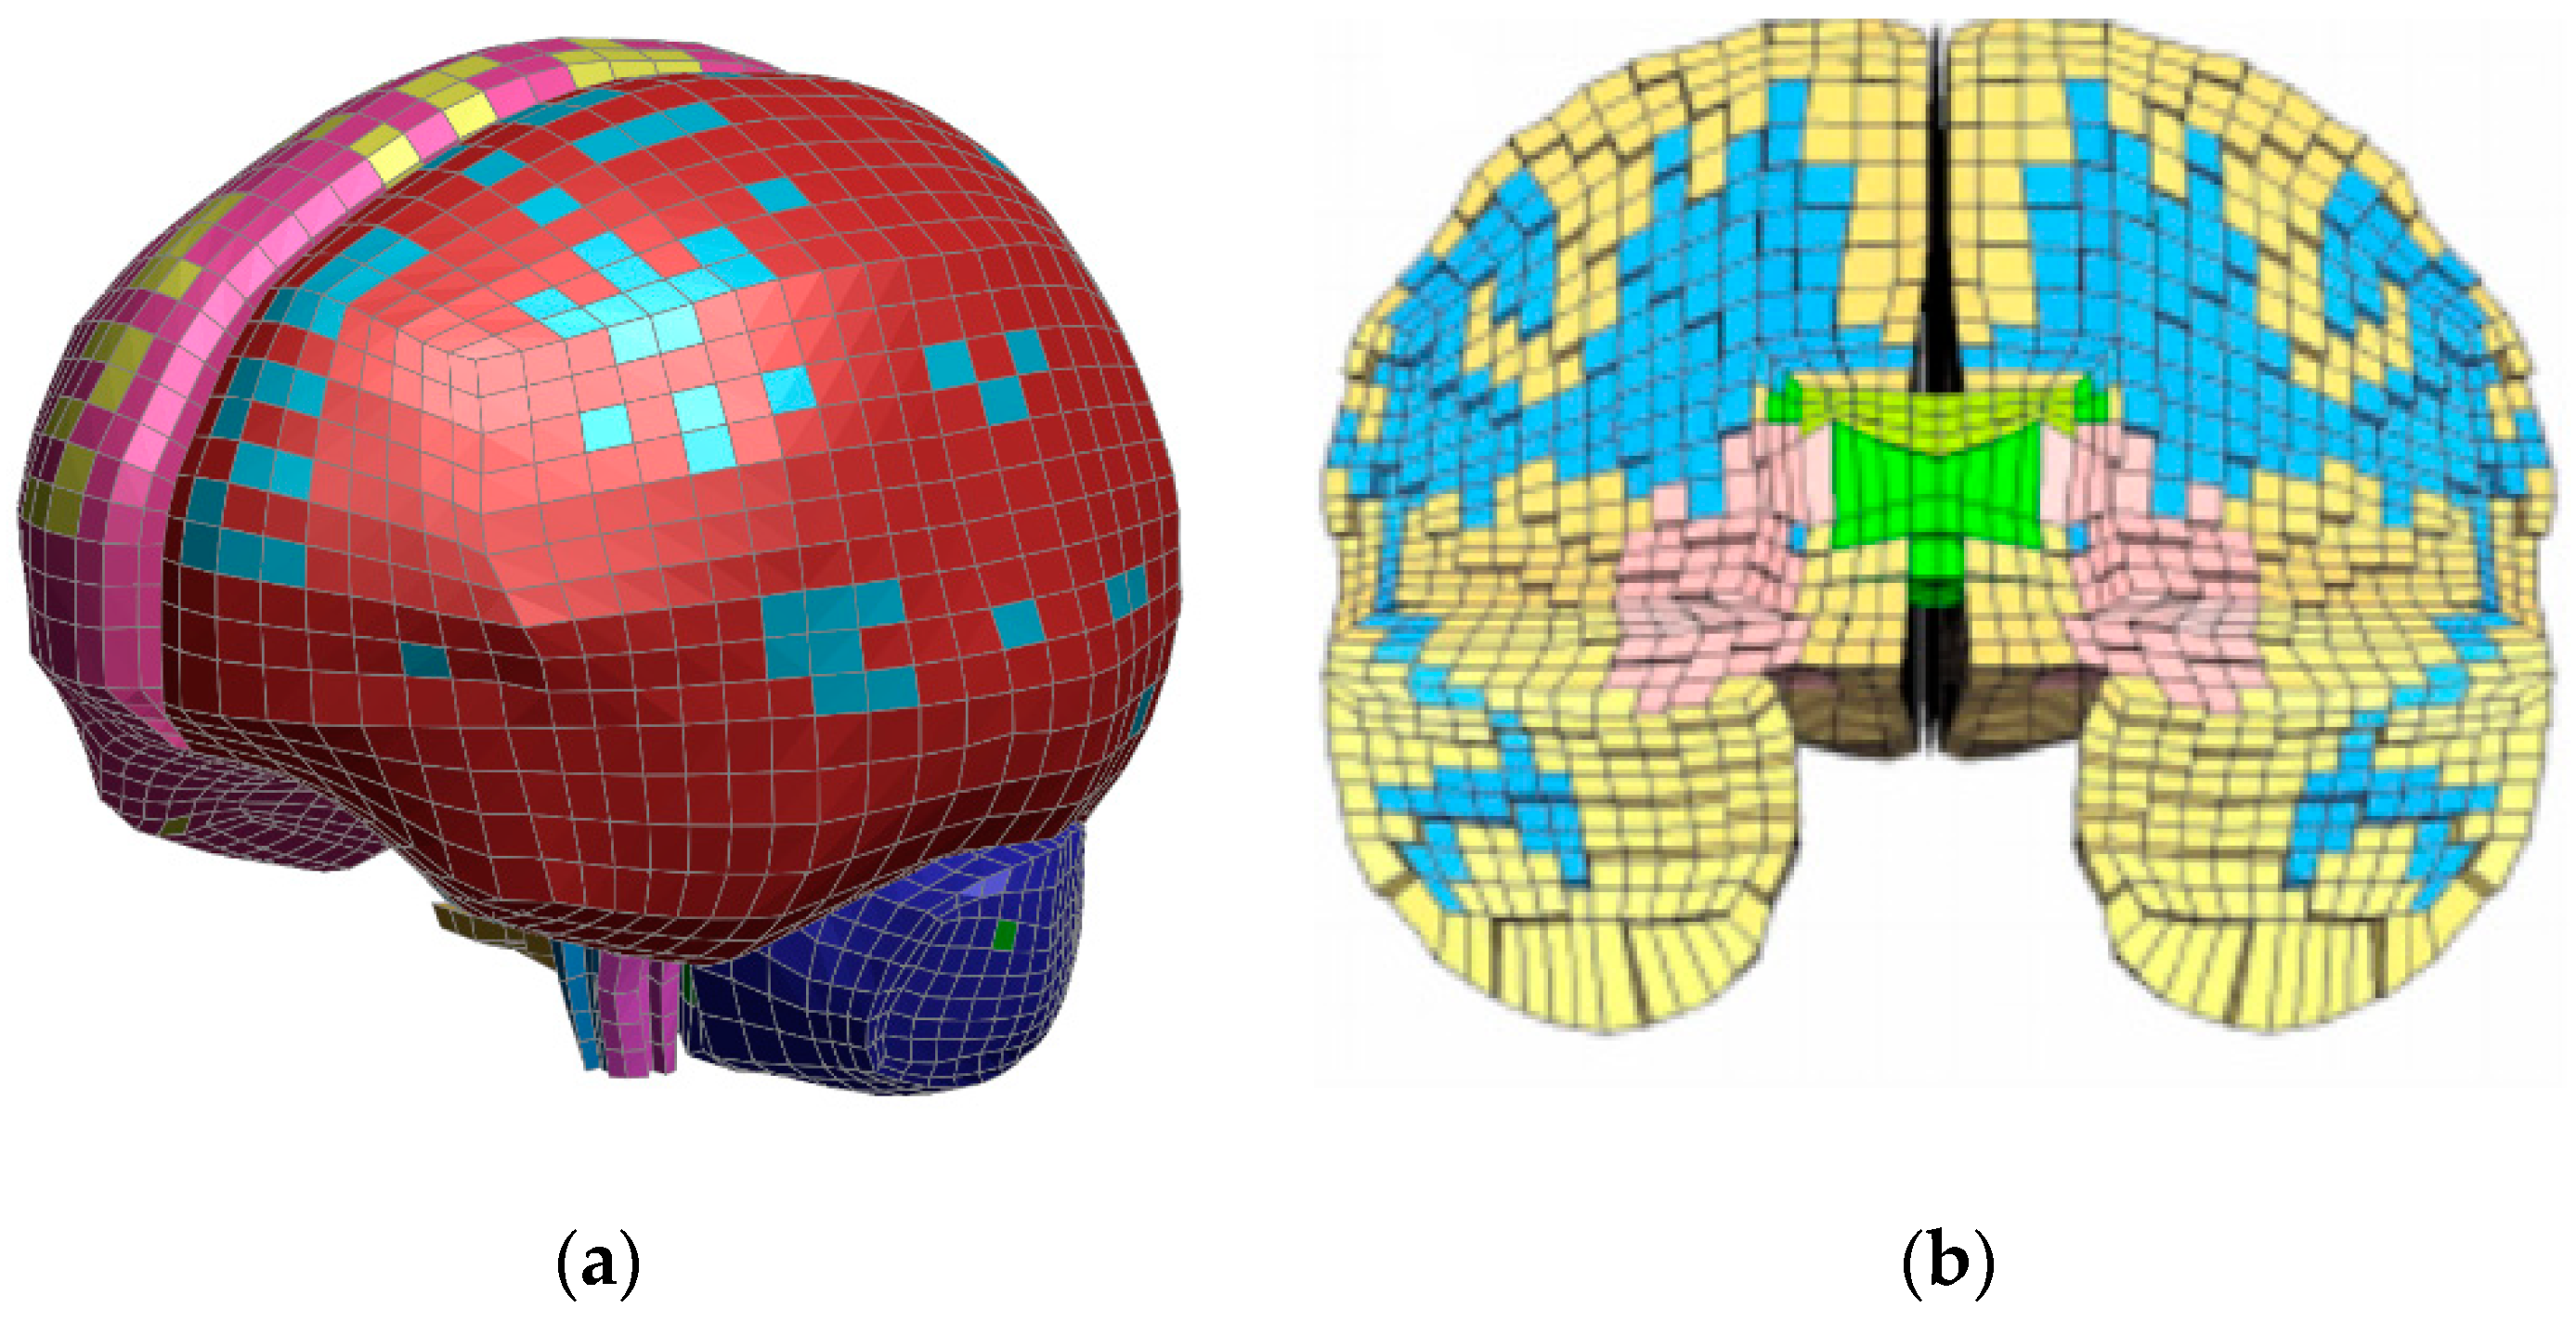
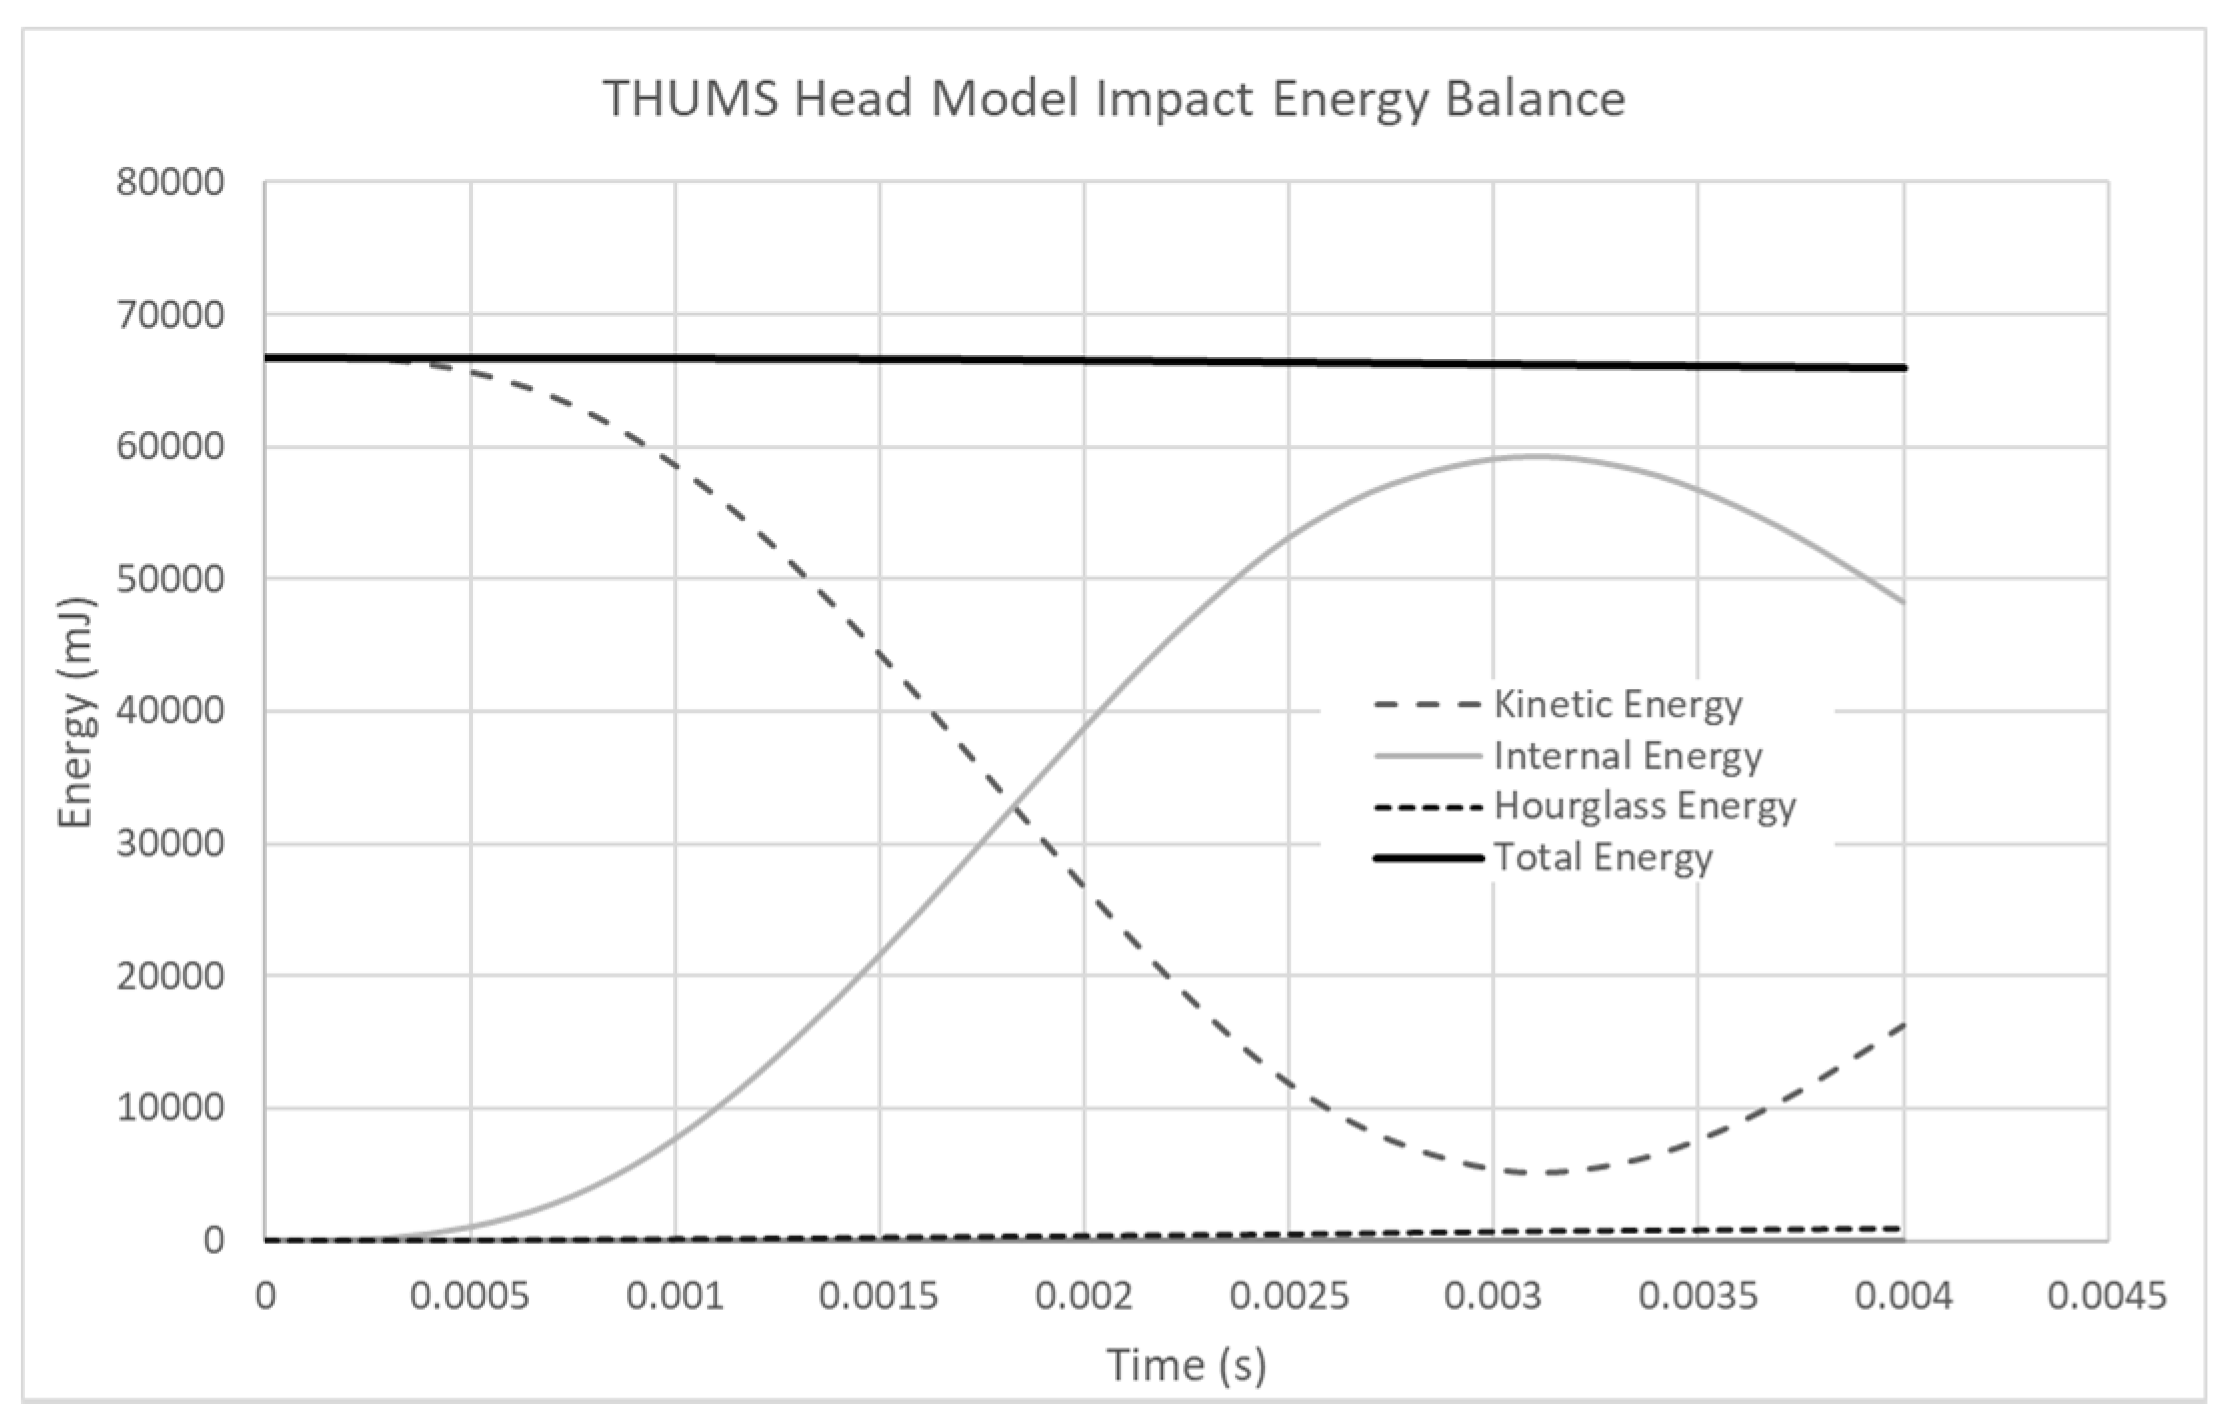
MPS are standard outputs suggested by Human-Computer models (Table 2), which is a major limitation when investigating injury severity predictions. In this study, THUMS 4.01, using LS-Dyna as an explicit solver, was chosen because of its excellent level of calibration against cadaver tests, as well as its brain overall mesh density (5 mm), allowing the computation of a fall under 1 h on a quad-core laptop, whilst respecting a conservative energy balance, as illustrated in Figure 3. THUMS 4.01 is built for the purpose of human safety in transport applications. It has a macroscopic model of the brain to provide automotive design/analyst engineers, who have no medical background, with a tool to assess the risk to transport users. The model does not include blood vessels and fluid-structure interaction details, having discretised the brain with a 5 mm average element size. All the elements are Lagrangian and the contact is a global sliding contact. This discretisation has influenced the location of grey and white matter elements (Figure 3); however, as the material properties of grey and white matter are identical in the THUMS 4.01 model, any meshing discrepancies are overcome in the post-processing stage, where the user can make the conscious decision to attribute the trauma value to the actual grey and white matter zones, which this research has done. Figure 1a illustrates the THUMS 4.01 mesh distribution. Note that the same discrepancy is also present in more complex head models, like the GHBMC (Figure 1b).
THUMS 4.01 is very efficient as the model contains one general global single surface contact, while the GHBMC has in excess of 400 contacts, which has the consequence of increasing the runtime because of the contact search algorithms. The skull is composed of 3 separate layers, which represent the diploe and the internal and external tables [30], as illustrated in Figure 2.
It can be observed in Figure 3 that the total energy is constant during the computation of a fall with a negligible rise of hourglass energy, showing that no element locking is present and that all the contacts inside the brain model are working as intended.
Injury severity can be computed from a concept called Peak Virtual Power (PVP). Peak Virtual Power is based on the general principle of the second law of thermodynamics, stating that entropy (state of disorder) increases after each mechanical process [12,33,34]. When a collision takes place, the entropy (represented by PVP) always increases, never to return. A typical pattern of this behaviour is illustrated in Figure 4, power goes up and down, while PVP always keeps to the maximum value at all time, PVP is proportional to the maximum rate of entropy production and as Schrodinger said, “a body reaches a maximum state of entropy, which is death” [35].
PVP [12,33] is derived using the Clausius–Duhem inequality, which is from the rate-dependent form of the second law of thermodynamics [37], illustrated in Equation (1).
where:
For a mechanical system, assuming the contribution of elasticity and heat flux are small, the constitutive relationships are:
With epsilon the elastic and plastic tensor, T the temperature and D the damage tensor. Equation (2) is differentiated (Equation (3)) and reinserted in Equation (1) to give Equation (4):
The Clausius–Duhem inequality now becomes:
Hence:
It is assumed that the Damage Tensor is proportional to Injury Severity or AIS [33]. Following the fact that entropy keeps on increasing during a collision, Equation (6) is derived, illustrating the trauma process from Figure 4.
Consequently, it is possible the calculate the peak power inside an organ and compare it to the critical level observed in Table 2 and calculate the maximum power needed to observed AIS 4 on the white matter and AIS 3 on the grey matter. To date, according to the authors, no literature has clearly documented the actual values MPS level relating to AIS 4 and ageing. Consequently, the current research has used the MPS data available and accepted in the THUMS model.
It has been observed in real life that there was a cubic relationship between the threat to life and AIS [36], shown in Figure 5.
It is, therefore possible to extract the intermediate AIS levels from Table 1. As an example, if the PVP necessary to cause a severe injury is known (AIS 4) then it is possible to extract how much PVP the organ can withstand to reach AIS 1, 2, 3 and 5. The PVP values can be scaled from AIS 4 by the ratios 1/64 (13/43), 8/64 (23/43), 27/64 (33/43) and 125/64 (53/43), respectively, to create the full map of trauma injuries for that organ, creating an “Organ Trauma Model” (OTM). It should be noted that AIS is ordinal, and so the interpolation model is only interrogated at ordinal values.
As an illustration, any OTM, will be therefore represented by a graph containing the relationship between PVP, impact velocity and AIS, as illustrated in Figure 6. It has been possible to include error corridors (upper and lower) for each AIS value by considering the spread of data from Figure 5.
Extraction of injury severity has been attempted by many researchers, creating computed models considering MPS [29,42], brain pressure [1,23] or acceleration thresholds [23]; however, they all fail to respond to the requirement for the extraction of injury severity.
This paper will respond to this deficiency and illustrate its potential by studying the case of a 63-year-old male who died from multiple falls. The research will focus on brain white and grey matter trauma injuries.
2. Methods
The research will revisit a previous study, in which the sequence of events is paraphrased by the authors as: “A 63-year-old male was slightly pushed leading to him taking two steps backward, stop and then fall backward like a stick, and thus sustaining a parieto-occipital head impact on the wooden floor. This event was witnessed by ten people who all gave the same version of the fall. During transportation, the male fell from the stretcher from a height of about 20–30 cm on his right-hand side, sustaining a parietal head impact” [16].
The previous work could capture the location of the trauma, but was unable to compute the injury severity, which this paper will address.
The methodology is illustrated in the flowchart in Figure 7.
The first step is to age the human-computer model to reflect the body of a 63-year-old. As in 42impact mechanics, stress is a function of the material properties (Equation (7)) [24,41,43], these values were scaled down from the 39-year-old THUMS 4.01 model to a 63-year-old adult to replicate its frailty due to ageing.
where,
- σ: Stress
- E: Young’s Modulus (or Modulus of Elasticity)
- : Density
- v: Impact velocity
Equation (7) is a parametric equation used to represent ageing [41]. It is similar to the standard stress wave equation, as it contains some of the parameters used to show ageing, such as Young’s Modulus and brain density; it is currently a restriction in ageing models that they only utilise elastic properties.
The 39-year-old THUMS 4.01 white and grey matter material properties were upgraded to include an incompressible Kelvin–Maxwell viscoelastic material behaviours of THUMS 4.02. *MAT61 [26] including the following properties:
- Density (t/mm3): 1.0 × 10⁻⁹
- Bulk Modulus (MPa): 2160
- Short Term Shear Modulus (MPa): 0.0060
- Long Term Shear Modulus (MPa): 0.0012
- Maxwell Decay (1/s): 80
The human brain is also subject to shrinking with age [44]. Previous work has generated a regression relationship linking brain volume and age [45], which is illustrated in Equation (8). In the model used in this study, the brain white and grey matter were scaled about the brain centre of gravity to adjust for ageing. The grey and white matter were both scaled together with the same ratio.
Combining the material degradation and volume changes, it was observed that the computed AIS 4 response curves were reduced when people get older, which is sensible as it takes less power to injure an older person than a younger one. This is illustrated in Figure 8 where a human head was impacted on its forehead with an arbitrary cylindrical object.
The AIS 4 equations for the OTM are given in Table 4.
The full OTM models will be presented in the results section.
Phase 2 will focus on the accident reconstruction. A THUMS human model, aged to a 63-year-old, is impacted against a stiff wooden structure. A 10-mm-thick wooden structure (300 mm × 300 mm), clamped at its edges (floor is very stiff globally) was modelled with an elastic material property (no cracking). The head was positioned to replicate both impact load cases (Figure 9).
The impact scenarios are provided in Table 5.
In step 3, in the simulation, PVP will be calculated and overlaid over the OTM model. Another important point to notice is that the method used to reconstruct the accidents is using finite elements. As a general principle, finite elements discretise the problem in small elements, which are connected to each other, so the sum of these elements represents the whole problem. By cutting the problem in small parts, it is possible to investigate what can happen locally: this method is used to analyse complex shapes that differ greatly from, for example, simple beams or plates that have been solved by engineers. Usually, organs with a three-dimensional aspect are represented by connected cubes (hexahedrons) or triangular-based pyramids (tetrahedrons). This is the case with the computer model used in this study (THUMS 4.01). During the impact, these elements deform, stretch and change shape; however, their volume remains constant. It is called a “Lagrangian” representation of the problem. The consequence, is that, should bleeding occur in the real-world, i.e., loss of volume due to the blood escaping the organ, then the finite elements will not be able to capture this. In order to include the bleeding effect, it is proposed to include the effects of Subdural Hematoma (SDH), which has been defined for an MPS value of 25.5% [46]. The problem then is to assert the AIS outcome from bleeding, as a small bleed could add ‘1’ to the AIS level to the current trauma severity computed or ‘2’ if the bleeding is judged to be important by the pathologist [47]. In some cases, the quantity of blood loss could be subjective, hence for the purpose of being consistent and conservative, all instances of blood loss for the purpose of this study have a ‘+1’ AIS increment on the base AIS computed.
3. Results
3.1. Occipital Impact
3.1.1. Grey Matter
The PVP value computed was 8.58 mW, which is overlaid over the OTM model for an impact speed of 6.0 m/s. The trauma severity is therefore AIS 3, as illustrated in Figure 10a.
However, looking at the MPS values in the grey matter, its value exceeded 25.5% (Figure 10b); hence, a hemorrhage is present. Consequently, the AIS level is increased by +1, meaning that the final trauma severity computed in the grey matter is AIS 4.
3.1.2. White Matter
The PVP value computed was 5.03 mW, which is overlaid over the OTM model for an impact speed of 6.0 m/s. The trauma severity is, therefore AIS 4, as illustrated in Figure 11a.
However, looking at the MPS values in the grey matter, its value exceeded 25.5% (76.9%) (Figure 11b); hence, a hemorrhage is present. Consequently, the AIS level is increased by +1, meaning that the final trauma severity computed in the grey matter is AIS 5.
3.2. Parietal Impact
3.2.1. Grey Matter
The PVP value computed was 0.05 mW, which is overlaid over the OTM model for an impact speed of 1.5 m/s. The trauma severity is therefore AIS 1, as illustrated in Figure 12a.
As the grey matter maximum principal strain did not exceed 25.5% (8.7%), the trauma severity remains unchanged, i.e., AIS 1 (Figure 12b).
3.2.2. White Matter
The PVP value computed was 0.07 mW, which is overlaid over the OTM model for an impact speed of 1.5 m/s. The trauma severity is therefore AIS 1, as illustrated in Figure 13a.
As the grey matter maximum principal strain did not exceed 25.5% (8.4%), the trauma severity remains unchanged, i.e., AIS 1 (Figure 13b).
4. Discussion
The results are summarized in Table 6 and are compared with the Post-Mortem (PM).
It can be noted that the trauma severity correctly matches the PM.
In all the cases, the head injury predictions had some similarities with the post-mortem results, as shown in Table 6. When no evidence was recorded in the PM, it did not necessarily mean that there was no injury, but that there was no observable injury. Consequently, no observation could mean that the AIS range could be from 0 to 2. This step has been taken, as it was found that overall, the quality of autopsy reports (PM) is often questioned: just half of PM reports 52% (873/1691) were considered satisfactory by experts, 19% (315/1691) were good and only 4% (67/1691) were excellent. Over a quarter were marked as poor or unacceptable. Proportionately, there were more reports rated ‘unacceptable’ for those cases that were performed in a local authority mortuary (21/214 for local authority mortuary cases versus 42/1477 for hospital mortuary cases)” [40]. Consequently, for trauma injury severity cases not observed in the PM, a probable PM range has been included in the results of OTM models.
In the computer model, there is evidence of trauma near the contact area between the head and the wooden block. The computer model suggests the same location as the CT scan.
The computer model also suggests trauma on the other side of the brain, as per the CT scan.
5. Conclusions
This paper has presented an organ trauma model (OTM), based on the second law of thermodynamics, which has been applied to modelling brain white and grey matter injuries. This trauma model was used to model the fatal fall of a 63-year-old male. As the computer model uses constant volume Lagrangian finite element modelling, an additional criterion was added to consider the hemorrhaging aspect of the trauma. This was achieved by monitoring the maximum principle strain of the brain and factoring 1 AIS if the threshold on 25.5% was computed, concurring with physiological soft tissue tests.
The predictions correctly matched the post-mortem in injury severity. Overall, it was also observed that the location of the trauma was comparable to the post-mortem CT scans; however, as the location of the slice was not provided, it is not possible to categorically confirm this.
This study has been validated using one accident case, and it is necessary to extend this validation with more cases (fall), considering different scenarios like pedestrian accident cases for example, where head injuries are the biggest cause of death.
This model provides however important advances in brain trauma modelling, and delivers a tool that could be used in forensic investigation, pending a correlation with a larger sample of samples of fall cases. In order to refine the results, future work could be consider researching MPS AIS 4 threshold levels and ageing, so that the OTM model could be further refined.
Author Contributions
Conceptualization, C.B., C.N.-S. and H.D.; methodology, C.B., C.N.-S. and H.D.; software, C.B. and X.C.; validation, C.B. and C.N.-S.; formal analysis, C.B. and C.N.-S.; investigation, C.B., C.N.-S. and H.D.; resources, C.B., X.C.; data curation, C.B.; writing—original draft preparation, C.B. and C.N.-S.; writing—review and editing, C.B., C.N.-S. and H.D.; visualization, C.B. and X.C.; supervision, C.B., C.N.-S. and H.D. All authors have read and agreed to the published version of the manuscript.
Funding
This research received no external funding.
Conflicts of Interest
The authors declare no conflict of interest.
References
- Tagliaferri, F.; Compagnone, C.; Korsic, M.; Servadei, F.; Kraus, J. A Systematic Review of Brain Injury Epidemiology in Europe; Springer: Berlin/Heidelberg, Germany, 2005. [Google Scholar]
- Paden, M.; McGee, K.; Krug, E. Injury: A Leading Cause of the Global Burden of Disease; WHO: Geneva, Switzerland, 2002. [Google Scholar]
- Hukkelhoven, C.; Steyerberg, E.; Farace, E.; Habbema, D.; Marshall, L.; Maas, A. Regional differences in patient characteristics, case management and outcomes in traumatic brain injury: Experience from the tirilazad trials. J. Neurosurg. 2002, 97, 549–557. [Google Scholar] [CrossRef] [PubMed]
- Acosta, J.; Yang, J.; Winchell, R.; Simons, R.; Fortlage, D.; Hollingsworth-Fridlund, P.; Hoyt, D. Lethal injuries and time to death in a Level I trauma center. J. Am. Coll. Surg. 1998, 186, 528–533. [Google Scholar] [CrossRef]
- Murray, J.; Lopez, A. The Global Burden of Disease; World Health Organization: Geneva, Switzerland, 1996. [Google Scholar]
- Post, A.; Taylor, K.; Hoshizaki, T.B.; Brien, S.; Cusimano, M.D.; Marshall, S. A biomechanical analysis of traumatic brain injury for slips and falls from height. Trauma 2019, 21, 27–34. [Google Scholar] [CrossRef]
- NHTSA. 2020; Regulations. Federal Motor Vehicle Safety Standards (FMVSS). Available online: https://www.nhtsa.gov/laws-regulations/fmvss (accessed on 21 September 2020).
- UNECE R94. Uniform Provisions Concerning the Approval of Vehicles with Regard to the Protection of the Occupants in The Event of a Frontal Collision; UNECE: Geneva, Switzerland, 2020. [Google Scholar]
- Fenner, H.; Thomas, D.; Gennarelli, T.; Pintar, F.; Becker, E.; Newman, A.; Yoganandan, N. Final Report of Workshop on Criteria for Head Injury and Helmet Standards; Department of Neurosurgery, Medical College of Wisconsin: Milwaukee, WI, USA, 2005. [Google Scholar]
- Newman, J. A Generalised Acceleration Model for Brain Injury Threshold (GAMBIT). In Proceedings of the International IRCOBI Conference, Zurich, Switzerland, 2–4 September 1986. [Google Scholar]
- Marjoux, D.; Baumgartner, D.; Deck, C.; Willinger, R. Head injury predictions capability of the HIC, HIP, SIMON and ULP criteria. In Proceedings of the International IRCOBI Conference 2006, Madrid, Spain, 20–22 September 2006. [Google Scholar]
- Sturgess, C.E.N. Peak Virtual Power—A Global Injury Criteria. In Proceedings of the Passive Safety Network Workshop on Human Body Modelling, Brussels, Belgium, 29–30 March 2001. [Google Scholar]
- Doorly, M.C.; Gilchrist, M.D. Three-dimensional multibody dynamics analysis of accidental falls resulting in traumatic brain injury. Int. J. Crashworth. 2009, 14, 503–509. [Google Scholar] [CrossRef]
- Koncan, D.; Gilchrist, M.; Vassilyadi, C.; Hoshizakia, B. Simulated brain strains resulting from falls differ between concussive events of young children and adults. Comput. Methods Biomech. Biomed. Eng. 2020, 23, 500–509. [Google Scholar] [CrossRef]
- Post, A.; Hoshizaki, T.B.; Gilchrist, M.; Brien, S.; Cusimano, M.; Marshall, S. Some have done parametric analyses Traumatic Brain Injuries: The Influence of the Direction of Impact. Neurosurgery 2015, 76, 81–91. [Google Scholar] [CrossRef]
- Raul, J.S.; Baumgartmer, D.; Willinger, R.; Ludes, B. Finite Element Modelling of Human Head Injuries by a Fall. Int. J. Leg. Med. 2006, 120, 212–218. [Google Scholar] [CrossRef]
- Lamy, M.; Baumgartner, D.; Williner, R.; Yoganandan, N.; Stemper, B. Study of Mild Traumatic Brain Injuries Using Experiments and Finite Element Modeling. Ann. Adv. Automot. Med. 2011, 55, 125–135. [Google Scholar]
- Fernandes, F. Numerical Modelling and Simulation Applied to Head Trauma. Available online: https://0-www-mdpi-com.brum.beds.ac.uk/journal/mca/special_issues/numer_head_model (accessed on 21 September 2020).
- Fernandes, F.A.O.; Wilhelm, J. Certified Motorcycle Helmets: Computational Evaluation of the Efficacy of Standard Requirements with Finite Element Models. Math. Comput. Appl. 2020, 25, 12. [Google Scholar] [CrossRef] [Green Version]
- Hosseini-Farid, M.; Amiri-Tehrani-Zadeh, M.; Ramzanpour, M.; Ziejewski, M.; Ghodrat Karami, G. The Strain Rates in the Brain, Brainstem, Dura, and Skull under Dynamic Loadings. Math. Comput. Appl. 2020, 25, 21. [Google Scholar] [CrossRef] [Green Version]
- Toma, M.; Chan-Akeley, R.; Lipari, C.; Kuo, S.H. Mechanism of Coup and Contrecoup Injuries Induced by a Knock-Out Punch. Math. Comput. Appl. 2020, 25, 22. [Google Scholar] [CrossRef] [Green Version]
- Li, X.; Zhou, Z.; Kleiven, S. An Anatomically Accurate and Personalizable Head Injury Model: Significance of Brain and White Matter Tract Morphological Variability on Strain; Division of Neuronic Engineering, Department of Biomedical Engineering and Health Systems, KTH Royal Institute of Technology: Huddinge, Sweden, 2020; Volume 141, p. 52. [Google Scholar]
- Doorly, M.C.; Gilchrist, M.D. The use of accident reconstruction for the analysis of traumatic brain injury due to head impacts arising from falls. Comput. Methods Biomech. Biomed. Eng. 2006, 9, 371–377. [Google Scholar] [CrossRef]
- Debasis, S.; Caroline, D.; Remy, W. Head Injury Assessment Based on Real-world Accidents Using FE Head Model. In Proceedings of the CARHS Safety Week—HuMoSymposium 2013, Aschaffenburg, Germany, 13 May 2013. [Google Scholar]
- Mao, H.; Zhang, L.; Jiang, B.; Genthikatti, V.V.; Jin, X.; Zhu, F.; Rahul, M.; Amandeep Singh, G.; Gurdeep, J.; Amrinder, S.; et al. Development of a Finite Element Human Head Model Partially Validated with Thirty-Five Experimental Cases. J. Biomech. Eng. 2013, 135, 111002. [Google Scholar] [CrossRef] [PubMed]
- THUMS. Total Human Model for Safety (THUMS). Available online: http://ls-dyna.jsol.co.jp/en/thums/index.html (accessed on 21 September 2020).
- Association for the Advancement of Automotive Medicine (AAAAM) 2020. The Abbreviated Injury Scale. Available online: https://www.aaam.org/ (accessed on 21 September 2020).
- Yamada, H.; Evans, F.G. Strength of Biological Materials; Williams & Wilkins: Baltimore, MD, USA, 1970. [Google Scholar]
- Bastien, C.; Neal-Sturgess, C.; Christensen, J.; Wen, L. A Method to Calculate the AIS Trauma Score from a Finite Element Model. J. Mech. Med. Biol. 2020, 20, 2050034. [Google Scholar] [CrossRef]
- Mao, H.; Yang, K.H. Investigation of brain contusion mechanism and threshold by combining finite element analysis with in vivo histology data. Int. J. Numer. Methods Eng. 2011, 27, 357–366. [Google Scholar]
- Bain, A.C.; Meaney, D.F. Tissue-level Thresholds for Axonal Damage in an Experimental Model of Central Nervous System White Matter Injury. J. Biomech. Eng. 2000, 122, 615–622. [Google Scholar] [CrossRef] [Green Version]
- Lynnerup, N.; Astrup, J.G.; Sejrsenbio, B. Thickness of the human cranial diploe in relation to age, sex and general body build. Head Face Med. 2005, 1, 13. [Google Scholar] [CrossRef] [Green Version]
- Sturgess, C.E.N. A Thermomechanical Theory of Impact Trauma. Proc. Inst. Mech. Eng. Part D J. Automob. Div. 2002, 216, 883–895. [Google Scholar] [CrossRef]
- Sturgess, C.E.N. The Entropy of Morbidity Trauma and Mortality. arXiv 2010, arXiv:10083695. [Google Scholar]
- Schrodinger, I. What Is Life? The Physical Aspect of the Living Cell; Cambridge University Press: Cambridge, UK, 1944; ISBN 0-521-42708-8. [Google Scholar]
- Wen, L. Computation of Risk to Life (AIS) from a Finite Element Pedestrian Model (THUMS) in Pedestrian Accident Cases. Ph.D. Thesis, Coventry University, Coventry, UK, 2019. [Google Scholar]
- Desmorat, R. Continuum Approach in Damage Mechanics. In Proceedings of the Summer School Hardening and Damage of Materials under Finite Deformations, Constitutive Modeling and Numerical Implementation, Dortmund, Germany, 3–7 September 2012. [Google Scholar]
- Baker, S.P.; O’neill, B.; Haddon, W., Jr.; Long, W.B. The injury severity score: A method for describing patients with multiple injuries and evaluating emergency care. J. Trauma Acute Care Surg. 1974, 14, 187–196. [Google Scholar] [CrossRef]
- Walder, A.; Yeoman, P.; Turnbull, A. The abbreviated injury scale as a predictor of outcome of severe head injury. Intensive Care Med. 1995, 21, 606–609. [Google Scholar] [CrossRef] [PubMed]
- CCIS (Cooperative Crash Injury Study). Available online: https://data.gov.uk/dataset/3adb7480-cb5b-4794-90be-35b36b830f34/cooperative-crash-injury-study-ccisNASS (accessed on 21 September 2020).
- Cheng, X. The Modelling of Ageing in Human Body Model and its Application in Trauma Prediction. Ph.D. Thesis, Coventry University, Coventry, UK, 2021. [Google Scholar]
- Klug, C.; Feist, F.; Wimmer, P. Simulation of a Selected Real World Car to Bicyclist Accident using a Detailed Human Body Model. Paper IRC-18-27. In Proceedings of the Ircobi Conference 2018, Athens, Greece, 12–14 September 2018; Available online: http://www.ircobi.org/wordpress/downloads/irc18/pdf-files/27.pdf (accessed on 21 September 2020).
- Bastien, C.; Neal-Sturgess, C.; Davies, H.; Wellings, R.; Hans-Brooker, C. The Use of Peak Virtual Power to Model Human Organ Trauma in Automotive Accidents. In Proceedings of the 2nd Annual Automotive Safety Summit, Düsseldorf, Germany, 19–20 September 2019. [Google Scholar]
- Svennerholm, L.; Bostrom, K.; Jungbier, B. Changes in weight and compositions of major membrane components of human brain during the span of adult human life of Swedes. Acta Neuropathol. 1997, 94, 345–352. [Google Scholar] [CrossRef] [PubMed]
- Sack, I.; Streitberger, K.-J.; Krefting, D.; Paul, F.; Braun, J. The influence of physiological aging and atrophy on brain viscoelastic properties in humans. PLoS ONE 2011, 6, e23451. [Google Scholar] [CrossRef] [PubMed]
- Oeur, A.; Karton, C.; Post, A.; Rousseau, P.; Hoshizaki, B.; Marshall, S.; Brien, S.; Smith, A.; Cusimano, M.; Gilchrist, D. A comparison of head dynamic response and brain tissue stress and strain using accident reconstructions for concussion, concussion with persistent postconcussive symptoms, and subdural hematoma. J. Neurosurg. 2015, 123, 415–422. [Google Scholar] [CrossRef] [PubMed]
- Perel, P.; Roberts, I.; Bouamra, O.; Woodford, M.; Mooney, J.; Lecky, F. Intracranial bleeding in patients with traumatic brain injury: A prognostic study. BMC Emerg. Med. 2009, 9, 15. [Google Scholar] [CrossRef] [PubMed] [Green Version]
Figure 1.
THUMS4.01 brain meshed model (a) [26] vs. GHBMC brain meshed model (b) [25]. (a) THUMS brain model, (b) GHBMC brain model (cross-section).


Figure 3.
Typical Energy balance in a THUMS head model under impact.

Figure 4.
Power goes up and down, while trauma (represented by PVP) continues to increase [36].
Figure 4.
Power goes up and down, while trauma (represented by PVP) continues to increase [36].

Figure 5.
Relationship between Threat to Life (%) and AIS (Baker [38], CCIS [39], NASS [40], and Walder [41]).

Figure 6.
Organ Trauma Model–Grey matter occipital impact starting from AIS4 and then deriving the other levels [33,41].

Figure 7.
Methodology Flowchart.

Figure 8.
AIS 4 response as a function of ageing (39-year-old vs. 63-year-old) [33].
Figure 8.
AIS 4 response as a function of ageing (39-year-old vs. 63-year-old) [33].

Figure 9.
Setup of both load cases (occipital and parietal). (a) Occipital head impact velocity, (b) Parietal head impact velocity.
Figure 9.
Setup of both load cases (occipital and parietal). (a) Occipital head impact velocity, (b) Parietal head impact velocity.

Figure 10.
Occipital Grey Matter OTM Model. (a) Occipital grey matter trauma prediction, (b) Maximum Principal strain (grey matter).
Figure 10.
Occipital Grey Matter OTM Model. (a) Occipital grey matter trauma prediction, (b) Maximum Principal strain (grey matter).


Figure 11.
Occipital White Matter OTM Model. (a) Occipital white matter trauma prediction, (b) Maximum Principal strain (white matter).
Figure 11.
Occipital White Matter OTM Model. (a) Occipital white matter trauma prediction, (b) Maximum Principal strain (white matter).


Figure 12.
Parietal Grey Matter—OTM Model. (a) Parietal grey matter trauma prediction, (b) Maximum Principal strain (grey matter).
Figure 12.
Parietal Grey Matter—OTM Model. (a) Parietal grey matter trauma prediction, (b) Maximum Principal strain (grey matter).


Figure 13.
Parietal White Matter OTM Model. (a) Parietal white matter trauma prediction, (b) Maximum Principal strain (white matter).
Figure 13.
Parietal White Matter OTM Model. (a) Parietal white matter trauma prediction, (b) Maximum Principal strain (white matter).


Figure 14.
First Accident. Brain trauma (coup). Comparison between CT scan [16] (a) CT Scan (coup) and computer predictions (b) Computer Simulation (coup).
Figure 14.
First Accident. Brain trauma (coup). Comparison between CT scan [16] (a) CT Scan (coup) and computer predictions (b) Computer Simulation (coup).

Figure 15.
First accident. Brain trauma (contre-coup). Comparison between CT scan [16] (a) CT Scan (contre-coup) and computer predictions, (b) Computer Simulation (contre-coup).
Figure 15.
First accident. Brain trauma (contre-coup). Comparison between CT scan [16] (a) CT Scan (contre-coup) and computer predictions, (b) Computer Simulation (contre-coup).

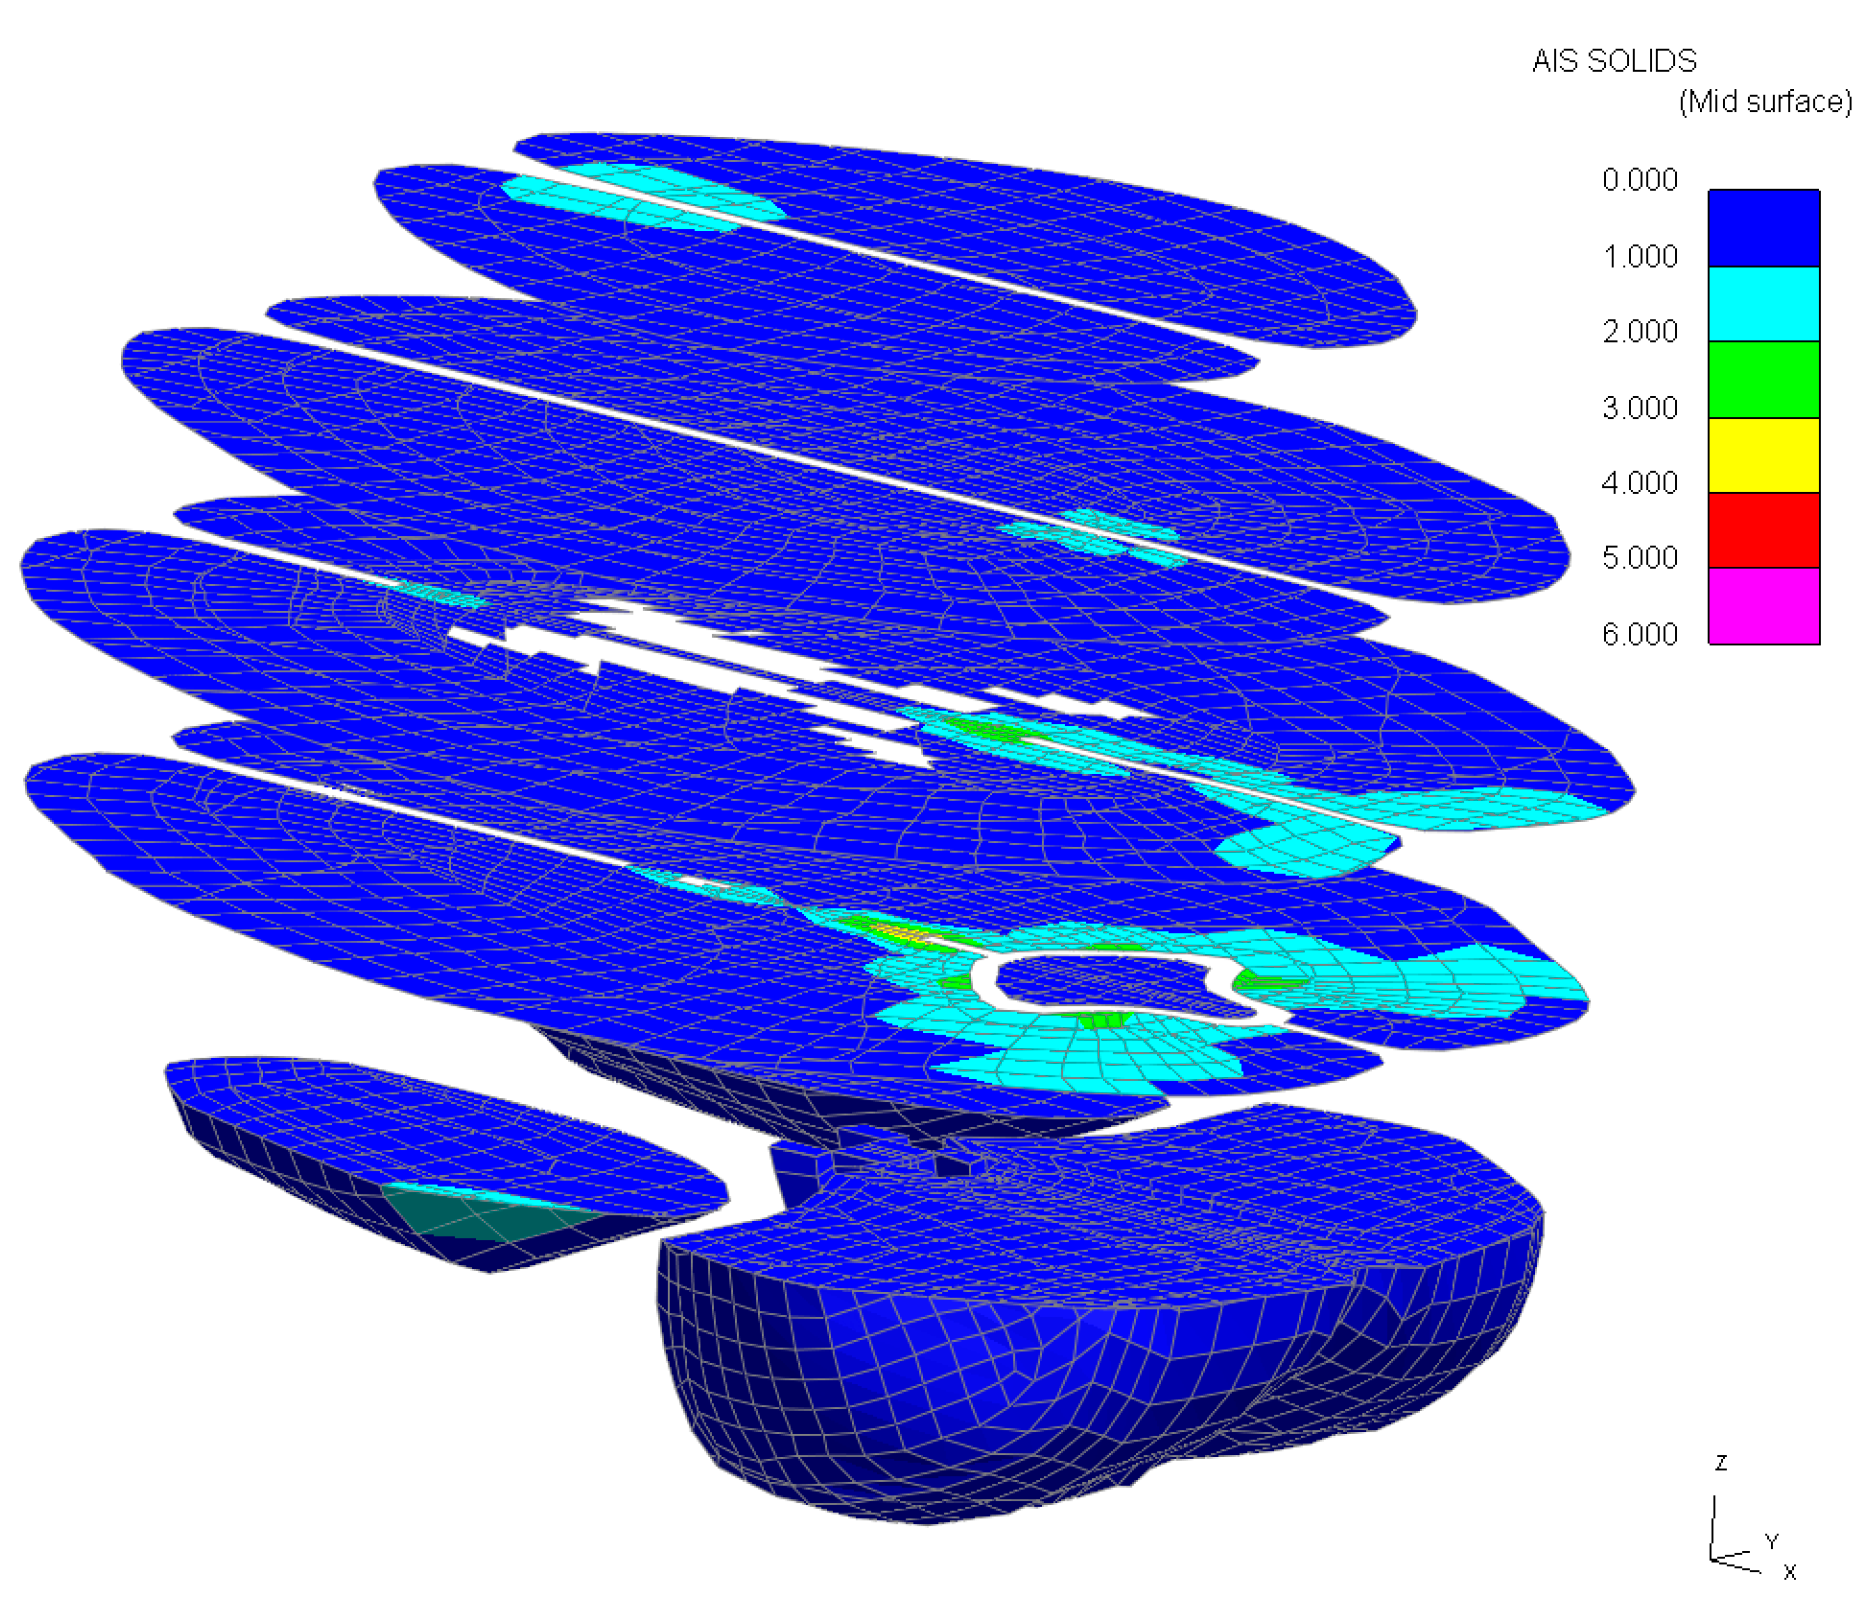
Figure 16.
3D slices of the brain (slices 20 mm apart).


Table 1.
Abbreviate Injury Scale (AIS) levels and risk to life [27].
Table 1.
Abbreviate Injury Scale (AIS) levels and risk to life [27].
| AIS Level | Injury | Risk of Death% |
|---|---|---|
| 1 | Minor | 0.0 |
| 2 | Moderate | 0.1–0.4 |
| 3 | Serious | 0.8–2.1 |
| 4 | Severe | 7.9–10.6 |
| 5 | Critical | 53.1–58.4 |
| 6 | Un-survivable | 100 |
| Body Part | Load | Threshold | AIS Level |
|---|---|---|---|
| Brain Contusion (Grey Matter) | Maximum principal strain | 26% [30] | 3 |
| Diffuse Axonal Injury (DAI) (White Matter) | Maximum principal strain | 21% [31] | 4 |
Table 3.
Hypothetical scenarios extracted from Figure 6.
Table 3.
Hypothetical scenarios extracted from Figure 6.
| Impact Speed (m/s) | PVP (mW) | AIS Extracted from Figure 6 |
|---|---|---|
| 6 | 10 | 5 |
| 16 | 15 | 4 |
| 19 | 10 | 3 or 4 (depending on how close the PVP value is from the upper AIS3 and lower AIS4 corridors |
Table 4.
AIS interpolation equation [41].
Table 4.
AIS interpolation equation [41].
| Trauma Calibration Parameter Values (THUMS 4.01 Geometry with 4.02 Brain Material Properties) | ||||
|---|---|---|---|---|
| Parts Identifier (White Matter)–right-hand side | white_matter_cerebrum_r | 88,000,100 | ||
| Parts Identifier (White Matter)–left-hand side | white_matter_cerebrum_l | 88,000,120 | ||
| Parts Identifier (Grey Matter)–right-hand side | gray_matter_cerebrum_r | 88,000,101 | ||
| Parts Identifier (Grey Matter)–left-hand side | gray_matter_cerebrum_l | 88,000,121 | ||
| PVP = a.V3 + b.V2 + c.V | ||||
| Parameter Values | a | b | c | |
| Occipital Impact | White matter | 0.002 | −0.076 | 1.252 |
| Grey matter | 0.007 | −0.212 | 4.160 | |
| Parietal Impact | White matter | 0.004 | −0.106 | 0.914 |
| Grey matter | 0.008 | −0.190 | 1.915 | |
Table 5.
Impact Scenarios.
| Direction | Velocity (m/s) |
|---|---|
| Occipital | 6.0 |
| Parietal | 1.5 |
Table 6.
Summary of results (comparison with post-mortem).
| Post-Mortem | Post Mortem AIS | AIS Predicted | |
|---|---|---|---|
| Occipital Impact | right and left frontal, temporal and occipital contusions, an occipital subdural haematoma, diffuse arachnoid haemorrhage, | 4–5 (depending on the volume of bleeding) | AIS 4 (Grey Matter) AIS 5 (White matter) |
| Parietal Impact | No observable brain injury | 1–2 (no evidence) | AIS 1 (Grey Matter) AIS 1 (White Matter) |
© 2020 by the authors. Licensee MDPI, Basel, Switzerland. This article is an open access article distributed under the terms and conditions of the Creative Commons Attribution (CC BY) license (http://creativecommons.org/licenses/by/4.0/).
Share and Cite
MDPI and ACS Style
Bastien, C.; Neal-Sturgess, C.; Davies, H.; Cheng, X. Computing Brain White and Grey Matter Injury Severity in a Traumatic Fall. Math. Comput. Appl. 2020, 25, 61. https://0-doi-org.brum.beds.ac.uk/10.3390/mca25030061
AMA Style
Bastien C, Neal-Sturgess C, Davies H, Cheng X. Computing Brain White and Grey Matter Injury Severity in a Traumatic Fall. Mathematical and Computational Applications. 2020; 25(3):61. https://0-doi-org.brum.beds.ac.uk/10.3390/mca25030061
Chicago/Turabian StyleBastien, Christophe, Clive Neal-Sturgess, Huw Davies, and Xiang Cheng. 2020. "Computing Brain White and Grey Matter Injury Severity in a Traumatic Fall" Mathematical and Computational Applications 25, no. 3: 61. https://0-doi-org.brum.beds.ac.uk/10.3390/mca25030061