Nanoplasmonics in High Pressure Environment

EPF-Ecole d’Ingénieurs, 3 bis rue Lakanal, 92330 Sceaux, France
Photonics 2020, 7(3), 53; https://0-doi-org.brum.beds.ac.uk/10.3390/photonics7030053
Submission received: 7 July 2020
/
Revised: 21 July 2020
/
Accepted: 25 July 2020
/
Published: 28 July 2020
(This article belongs to the Special Issue Latest Advances in Nanoplasmonics and Use of New Tools for Plasmonic Characterization)
Abstract
:An explosion in the interest for nanoplasmonics has occurred in order to realize optical devices, biosensors, and photovoltaic devices. The plasmonic nanostructures are used for enhancing and confining the electric field. In the specific case of biosensing, this electric field confinement can induce the enhancement of the Raman signal of different molecules, or the localized surface plasmon resonance shift after the detection of analytes on plasmonic nanostructures. A major part of studies concerning to plasmonic modes and their application to sensing of analytes is realized in ambient environment. However, over the past decade, an emerging subject of nanoplasmonics has appeared, which is nanoplasmonics in high pressure environment. In last five years (2015–2020), the latest advances in this emerging field and its application to sensing were carried out. This short review is focused on the pressure effect on localized surface plasmon resonance of gold nanosystems, the supercrystal formation of plasmonic nanoparticles stimulated by high pressure, and the detection of molecules and phase transitions with plasmonic nanostructures in high pressure environment.
1. Introduction
During the past decade, nanoplasmonics was employed for the production of photovoltaic devices [1,2,3,4,5,6], optical devices [7,8,9,10,11,12,13,14,15], and biosensors [16,17,18,19,20]. Additionally, nanoplasmonics enabled the enhancement of photocatalysis [21,22,23], the luminescence upconversion enhancement [24,25], and the optical tuning of luminescence and upconversion luminescence [26,27]. In addition, nanoplasmonics can also enhance the sum-frequency generation signal [28,29,30,31,32] and the Förster resonance energy transfer (FRET) [33,34,35,36,37]. Gold and silver were largely used for the production of plasmonic nanostructures, and other alternative plasmonic materials were also employed, such as aluminum [38,39], copper [40,41], palladium [42,43], transition-metal nitrides [44,45], and transparent conductive oxides [46,47]. The plasmonic nanostructures allowed confining the electromagnetic (EM) field into subwavelength-size zones. Concerning to the application to plasmonic biosensing, this EM field confinement allowed inducing an enhancement of Raman signal of analytes named surface enhanced Raman scattering (SERS) [48,49,50,51,52,53] or the localized surface plasmon resonance (LSPR) shift after detection of analytes on plasmonic nanostructures [54,55,56,57,58]. The confinement of the EM field can be controlled by adjusting the geometry and spatial organization of plasmonic nanosystems, for instance, which can be realized with various techniques of lithography [45,59,60,61,62,63,64,65,66]. In addition, various plasmonic modes can be used for biosensing based on SERS effect or LSPR shifting as dipolar and multipolar resonances [67,68], surface lattice resonances [69,70], and hybridized resonances [71,72]. In the majority of studies cited previously concerning the plasmonic sensing of analytes, the LSPR shifting and SERS measurements were realized in ambient environment (e.g., pressure). However, a relevant subject of nanoplasmonics has emerged over the past decade. This latter concerns nanoplasmonics in high pressure environment [73,74], and its potential application to sensing of molecules. In the nanoplasmonics in high pressure environment, the mechanisms for the LSPR shifts of metallic nanoparticles induced by high pressure are generally based on variations of the refractive index or the phase transitions of the surrounding medium, or deformation of metallic nanoparticles [73,74]. For instance, a study reporting on the effect of high pressure on the LSPR shift of colloidal gold nanoparticles demonstrated that the LSPR redshift of Au nanoparticles in water was due to the linear increasing of the refractive index of the water with pressure [73].
The aim of this short review is to discuss the latest advances on nanoplasmonics in high pressure environment over the period 2015–2020. Firstly, we will present the pressure effect on localized surface plasmon resonance of gold nanosystems, then the use of high pressures for the supercrystal formation of gold nanoparticles, and finish the detection of molecules and phase transitions with plasmonic nanostructures in high pressure environment.
2. Nanoplasmonics in High Pressure Environment
2.1. Effect of High Pressure on Localized Surface Plasmon Resonance of Metallic Nanoparticles
In this first section, we discuss the effect of high pressure on LSPR modes of gold nanoparticles with different shapes (see Table 1).
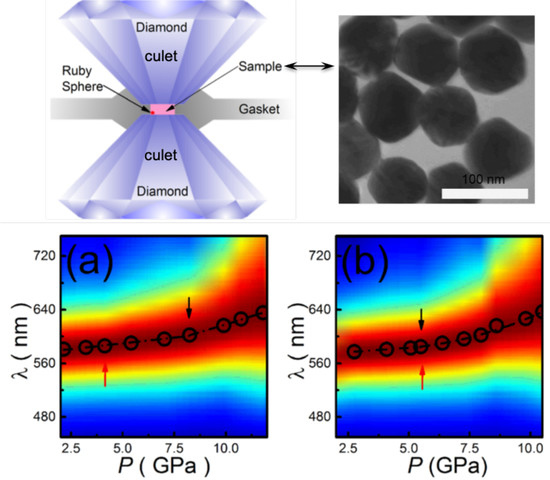
Bao et al. reported the effects of high pressure and the thickness of the gasket in a diamond anvil cell (DAC) on the localized surface plasmon resonance of a colloidal solution of Au spheroidal nanoparticles (AuSNPs). Authors have measured the LSPR of AuSNPs (size = 80 nm) by varying the pressure from 2 to 12 GPa for two gaskets pre-indented to 140 m (called GPI140) and 317 m (called GPI317). For the GPI140, the authors have recorded the absorption spectra of AuSNPs for pressures from 2.24 GPa to 11.8 GPa (see Figure 1a).
A broadening of the absorption peak of AuSNPs has occurred from the pressure of 4.13 GPa (indicated by the red arrow in Figure 1a). Subsequently, a sudden variation in the magnitude of LSPR shift for AuSNPs has occurred at 8.24 GPa (indicated by the black arrow in Figure 1a). This sudden variation is attributed to the deformation of the AuSNP shape. For the second gasket GPI317, they have recorded the absorption spectra of AuSNPs for pressures from 2.75 GPa to 10.47 GPa (see Figure 1b). The broadening of the absorption spectrum and the sudden variation in the LSPR shift magnitude for AuSNPs have occurred at the same pressure of 5.5 GPa (indicated by the red and black arrow, respectively, in Figure 1b). Furthermore, the authors remarked that the sudden variation in the LSPR shift magnitude for AuSNPs was achieved at a higher pressure for the thinnest gasket (GPI140). This was due to a better support of the part of the thinnest gasket located outside the culets in order to do a sharp expansion or contraction of the chamber where the sample is located, emerging at a higher pressure [75]. Gu et al. investigated the effect of quasihydrostatic and non-hydrostatic high pressures on the LSPR of gold nanocrystals (size = 3.9 nm) in a DAC [76]. The used quasihydrostatic and non-hydrostatic pressure media were ethylcyclohexane [78] and toluene [79], respectively. The authors have recorded no variation in the LSPR wavelength of Au nanocrystals for quasihydrostatic high pressures. On contrary, for non-hydrostatic high pressures, they observed a redshift of the LSPR of Au nanocrystals achieving 68 nm, and this latter was reversible when the pressure was decreased. This redshift was due to the deformation of Au nanocrystals (deformed shape with an aspect ratio of ∼2). When the non-hydrostatic pressure was decreased down to ambient pressure, the shape of Au nanocrystal came back its original shape [76]. Martin-Sanchez et al. demonstrated the effects of the hydrostatic pressure on LSPR of gold nanospheres and nanorods [77]. Firstly, the authors reported on the changes in the absorbance spectra of gold nanospheres (AuNS; diameter = 20 nm) in parrafin with pressure. Paraffin was used as solvent due to its easibility of stabilizing gold nanospheres in non-polar media. Authors observed a redshift of the localized surface plasmon resonance of AuNS when the pressure was increased from 0 to 17 GPa, and the redshift magnitude was around 3% of the LSPR wavelength for AuNS (see Figure 2a).
These weaker LSPR variations with pressure were caused by the higher shape factor (L = 1/3), which decreased the solvent impact. Furthermore, the authors have determined from the experimental measurements the bulk modulus (K) of the gold nanoparticles (called Nano) by using the Mie–Gans model [77]. They found a value of K equal to 190 GPa, which is bigger as compared to this obtained in the work of Heinz et al. [80] which is equal to 167 GPa for bulk gold (called bulk, see Figure 2b). The Mie–Gans model enables to express the wavelength of the localized surface plasmon resonance at a given pressure (P) as follows (for more details, see reference [77]):
where corresponds to the bulk plasma wavelength at the ambient pressure (corresponding to the pressure P = 0), and are the particle volume at the pressure P and at the ambient pressure, respectively. The ratio / depends on the bulk modulus of gold () and the first derivative . This ratio and express, as follows:
where K = + is the bulk modulus of a material (here gold) at a given pressure P. is the bulk modulus of a material (here gold) at the ambient pressure. The value of is fixed at 6 [80,81] for all of the studies presented here. and are the solvent dielectric function at the pressure P and the dielectric constant of gold in the short wavelength limit (or , which is commonly noted ), respectively. depends on the ratio /. L is the shape factor of the nanoparticle.
Secondly, the authors investigated the pressure effect on the LSPR of gold nanorods in hydrostatic regime and beyond this latter for two mixtures of a methanol–ethanol solution. For the first methanol–ethanol (1:4) solution with gold nanorods whose the aspect ratio (AR) is 3.7 (dimensions: 21.7 nm × 5.6 nm, see Figure 3a), they have experimentally observed a redshift of longitudinal plasmonic mode in hydrostatic (P = 1–4 GPa) and non-hydrostatic (P > 4 GPa) regimes (see Figure 3b). However, in the non-hydrostatic regime (after solution solidification), the optical density decreased abruptly (see Figure 3b).
Finally, the authors studied gold nanorods (AR = 3.7, see Figure 3a) in a methanol–ethanol (4:1) solution. They have experimentally observed a redshift of longitudinal plasmonic mode in hydrostatic (1–10 GPa) regime, i.e., up to solution solidification (see Figure 4a). Then, a blueshift in the LSPR wavelength of the longitudinal mode was observed after switching from hydrostatic to non-hydrostatic regime (see Figure 4). In this non-hydrostatic (P > 10 GPa) regime, the LSPR wavelength of the longitudinal mode was again redshifted when the pressure was increased (see Figure 4). However, the optical density decreased more abruptly than in the case of the methanol–ethanol (1:4) solution (see Figure 4a). Besides, weaker LSPR blueshifts for the transversal mode were also observed (see Figure 4b). These blueshifts of the transversal mode were due to the compression of Au nanorods and a higher electron density [77]. The Mie–Gans theory was in agreement with the experimental results for the measurement of the position of the plasmon peak in the hydrostatic regime for both longitudinal and transversal modes. For the non-hydrostatic regime, a difference between experiments and the Mie–Gans theory was observed.
To conclude this section, a dramatic decrease of the optical density at the LSPR peak was recorded after the solution solidification for both methanol–ethanol solutions with gold nanorods (AR = 3.7). When the pressure of the solution solidification was higher, the optical density decay was more significant (see Figure 3b and Figure 4a, and reference [77]).
2.2. Use of High Pressures for the Supercrystal Formation of Gold Nanoparticles
In this section, we present studies regarding the pressure effect on the supercrystal formation with gold nanoparticles (see Table 2).
Schroer et al. investigated the pressure effect on reversibility of the supercrystal formation with a gold nanoparticle suspension. The authors have used Au nanoparticles (AuNPs) functionalized with a shell of poly(ethyleneglycol) (PEG). The radius of AuNPs is around 6 nm, and two lengths of PEG were used (2 and 5 kDa), and these Au nanoparticles coated with PEG were called AuNP@PEG2k and AuNP@PEG5k, respectively. First, the authors have recorded patterns of small-angle X-ray scattering (SAXS) for Au@PEG5k in a CsCl solution of 2 M for two pressures: 1 bar and 4000 bar. For the SAXS pattern obtained for the pressure of 1 bar, they observed a strong forward scattering corresponding to a liquid state of the AuNP@PEG5k solution (see at left in Figure 5a,b). Then, for SAXS pattern recorded for the pressure of 4000 bar, Debye–Scherrer rings were observed, indicating the formation of supercrystals under the form of a face-centered cubic () superlattice (see at middle in Figure 5a,b). Finally, they observed a reversibility of the state of the AuNP@PEG5k solution after the pressure reduction down to 1 bar (see at right in Figure 5a,b) [82].
Subsequently, the authors studied the pressure effect on the supercrystal formation with the two types of AuNPs (AuNP@PEG2k and AuNP@PEG5k) in four chloride salts (CsCl, KCl, NaCl, RbCl) at a concentration of 2 M. They remarked that the constant a of the superlattice of the AuNP@PEG2k and AuNP@PEG5k had decreased when the pressure had increased (see Figure 6a,b). This decreasing was dependent on the cation of the chloride salt solution. Moreover, this pressure effect on the constant a of the lattice enabled the authors to calculate the effective compressibility of the superlattice at the pressure of 4000 bar and at the fixed concentration of 2 M for each chloride salt solution. They observed higher values of for the KCl solution for two types of AuNPs: 17.4 × 10 bar for AuNP@PEG2k and 39.5 × 10 bar for AuNP@PEG5k. They concluded that the decreasing of the lattice constant is primarily due to the compression of the PEG layer, because the Au core shape was not modified [82].
In the same research group, Lehmkühler et al. studied the kinetics of the supercrystal formation induced by pressure [83]. The authors have taken the same radius of 6 nm than previously for the gold spherical nanoparticles (AuNPs) functionalized with -methoxypoly(ethylene glycol)--(11-mercaptoundecanoate) ligands (PEGMUA). The molecular weight of PEGMUA is 5000 g.mol. These PEGMUA-coated AuNPs were disseminated in an 2 M chloride salt solution (RbCl). Authors observed that the time of the supercrystal formation has decreased when the jump from initial pressure (below the crystallisation pressure) to final pressure (beyond the crystallisation pressure) was more important. The time scale of this supercrystal formation has varied from 25 s to 0.3 s with the increasing of the pressure jump. This effect is linked to an improvement of the crystal quality caused by a larger speed of supercrystal formation [83].
Finally, Schroer et al. (same research group) also reported on the supercrystal formation of Au nanorods (AuNRs) stimulated by high pressure. The Au nanorods were functionalized with -methoxypoly(ethylene glycol)--(11-mercaptoundecanoate) ligands (PEGMUA2k). The dimensions of AuNRs (see Figure 7a) were 75 nm for the length and 22 nm for the width, and PEGMUA2k had a molecular weight of 2000 g·mol. First, authors have recorded SAXS patterns for AuNR@PEGMUA2k in a RbCl solution of 2 M for two pressures: 1 bar and 4000 bar. For SAXS pattern that was obtained for the pressure of 1 bar, they observed a same behavior than in the case of Au spherical nanoparticles seen previously, i.e., the AuNR@PEGMUA2k solution was in a liquid state (see Figure 7b). For the second SAXS pattern at the pressure of 4000 bar, Debye–Scherrer rings were distinguished showing the formation of supercrystals under the form of a 2D hexagonal superlattice (see Figure 7b). They also observed that the formation was very fast (a few seconds) and also reversible [84]. The authors also calculated the effective compressibilities from the dependence of the interparticle distance to the pressure (see Figure 7c). They found = 10.6 × 10 bar and = 6.8 × 10 bar.
To finish this section, the same authors demonstrated that, by changing the shape of gold nanoparticles, they obtained supercrystals under the form of a different superlattice as a face-centered cubic lattice with the spherical Au nanoparticles [82], and a 2D hexagonal lattice with the Au nanorods [84].
2.3. Detection of Molecules and Phase Transitions in High Pressure Environment
In this section, we present studies regarding the detection of molecules and phase transitions in high pressure environment (see Table 3).
Martin-Sanchez et al. demonstrated the detection of the refractive index of a methanol-ethanol (4:1) mixture in high pressure environment with gold spherical nanoparticles (AuNPs) of 20-nm diameter by following their LSPR shift [85]. First, the authors observed the LSPR shift of AuNPs in the methanol-ethanol (4:1) solution as a function of pressure (see Figure 8a–c). In the hydrostatic regime (from 0 to 10 GPa), they recorded a redshift of the AuNP LSPR due to a larger compressibility of solvent when compared to this of gold. In the non-hydrostatic regime (from 10 to 60 GPa), a blueshift of the AuNP LSPR was observed caused by the plasmon compression, which is more important than this of solvent in this case.
Subsequently, they studied the variations of the refractive index (RI) of the methanol-ethanol (4:1) solution with pressure. The authors described these RI variations with pressure by using the expression of Murnaghan type:
where corresponds to the RI of the methanol-ethanol (4:1) solution taken at ambient pressure (P = 0). and correspond to parameters of fit. These parameters were obtained by fitting the expression (1) of the LSPR wavelength at the pressure P by employing the expressions (2) and (3) in order to depict the variations of electron density of gold and dielectric function of solvent, respectively. They obtained = 19.3 and = 4.3 in the whole range of pressure (0–60 GPa) by taking = 190 GPa and = 6 (see Section 2.1 and references [85,86]). Afterwards, the authors compared their RI values as function of pressure to the literature [89,90,91,92,93], and these latter were generally in good agreement with this literature (see Figure 8d). Furthermore, the authors of this same research group investigated the detection of the refractive index of water in its liquid, ice VI, and ice VII phases by measuring the LSPR shift of aqueous solutions of Au nanorods at different high pressures [86] (see Figure 9). The dimensions of Au nanorods were 45.7 nm for the length and 13.4 nm for the width. By using the expressions (1)–(3), the RI values for each water state were calculated from the LSPR wavelength of Au nanorods. For the liquid phase (P = 0–1.8 GPa), the authors have taken = 1.33, = 26, and = 6. For the ice VI phase (P = 1.5–2.2 GPa), the values of , , and were equal to 1.40, 34, and 14, respectively. For the ice VII phase (P = 2.2–9 GPa), these values of , , and were equal to 1.43, 13.7, and 30, respectively. For all of the water states, and were obtained with the same method as described previously (with = 190 GPa and = 6), and corresponds to the RI of each water state at ambient pressure. Subsequently, these RI values of each water state were compared to the literature [92,94,95,96], and a good agreement between them was obtained [86].
In addition, Runowski et al. demonstrated the detection of phase transitions of different media by measuring the LSPR shift of gold nanorods with pressure [87]. The dimensions of Au nanorods were 100 nm for the length and 40 nm for the width. Authors have found the phase transition from liquid water to ice VI for a pressure of 1 GPa due to an abrupt redshift of the LSPR of both longitudinal and transversal modes of Au nanorods caused by a large jump of the refractive index of water (from liquid state to ice VI). Subsequently, they observed the transition from ice VI to ice VII at a pressure of 2.2 GPa due to a short blueshift for both plasmonic modes caused by the presence of both ice VI and ice VII. Then, authors investigated the detection phase transitions of urea [87]. A transition pressure was observed at 0.5 GPa for the phase from urea I to urea III measured by an abrupt redshift in the LSPR of Au nanorods due to the crystal lattice change from the tetragonal structure (phase I) to the orthorhombic one (phase III) corresponding to a significant deformation between these phases [97]. A second transition pressure was observed at 2.8 GPa for the transition from urea III to urea IV characterized by a smaller redshift of the Au nanorod LSPR due to the crystal lattice change from the orthorhombic phase III to the orthorhombic phase IV corresponding to a weaker deformation between these phases [97].
In the work of Sun et al., the authors reported on the surface enhanced Raman scattering (SERS) enhancement induced by high pressure with semiconducting nanoflowers (MoS NFs) decorated with gold nanoparticles (AuNPs) [88]. The diameters of the MoS NFs and AuNPs were 700 nm and 10 nm, respectively (see Figure 10a). They used the rhodamine 6G (R6G) molecules as SERS probe in the experimental measurements. The authors recorded the SERS spectra of R6G molecules on AuNPs/Mo NFs at the excitation wavelength of 532 nm for pressures varying from 0 to 8.38 GPa. The highest enhancement of the SERS signal was recorded for the pressure of 2.39 GPa (see Figure 10b). At this pressure, the SERS enhancement was due to a better alignment of the energy levels between MoS NFs, Au, and R6G molecules. This better alignment was obtained by the reduction of the energy of the band gap of MoS NFs, and gap of the highest occupied molecular orbital (HOMO) and lowest unoccupied molecular orbital (LUMO) levels for R6G molecules, when the applied pressure increased. The Fermi energy level of gold was kept almost constant when the pressure increased [88]. Thus, at this pressure of 2.39 GPa, two charge transfers (CTs) have occurred for enhancing the SERS signal (see Figure 10c).
The first CT mechanism was an electron transfer from the HOMO level of R6G to the conduction band minimum (CBM) of MoS NFs. Subsequently, the second one was a two-step mechanism: (i) electron transfer from the HOMO level of R6G to the Fermi energy level of Au and (ii) electron transfer from the Fermi energy level of Au to CBM of MoS NFs. In this study, the band gap energy of MoS NFs was determined by using the following expression [98]:
where is the band gap energy of MoS NFs (in eV), and P is the pressure (in GPa). Thus, the value for MoS NFs was calculated at the pressure of 2.39 GPa, and this latter was equal to 1.51 eV, which was weaker than its value at ambient pressure (1.68 eV) proposing that CBM and valence band maximum (VBM) levels of MoS NFs became smaller. Furthermore, the SERS mechanism at ambient pressure was a two-step mechanism: (i) electron transfer from the HOMO level of R6G to the Fermi energy level of gold enabled by the excitation laser wavelength (532 nm) and (ii) transfer of hot electrons produced by the plasmon resonance of AuNPs to the CBM of MoS NFs (see Figure 10c). Finally, for the pressures superior to 2.39 GPa, the SERS intensity decreased due to the fact that the HOMO level of R6G molecules has exceeded the Fermi energy level of gold [88].
3. Future Directions
The nanoplasmonics in high pressure environment has generally been studied for gold. It would be interesting to apply this type of studies to other plasmonic materials that are well-known, such as silver, copper, palladium, and aluminum [39,40,43] in order to have the influence of the nature of the plasmonic material on the LSPR shift in high pressure environment. We can extend this investigation type to other alternative plasmonic materials, such as transition-metal nitride nanoparticles [44], transparent conductive oxides [46], and iron carbide nanoparticles encapsulated by graphene [99], which are materials at lower costs having a better temperature stability. Moreover, the domain of the nanoplasmonics in high pressure environment can be applied to sensing of analytes, pollutants in high pressure media as the marine medium, for instance. Another future direction of this domain is the SERS effect induced by high pressure, which represents a novel frontier in the SERS field.
4. Conclusions
In this review, we discussed the emerging topic of the nanoplasmonics in high pressure environment. First, we spoke about the effect of high pressure on the localized surface plasmon resonance and the optical density of gold nanoparticles with different shapes and sizes. LSPR shifts were observed for gold nanoparticles and were dependent on the shape, size, pressure regime (hydrostatic and non-hydrostatic), and surrounding medium. Subsequently, we presented studies on the supercrystal formation in a high pressure environment. The supercrystal formation was dependent on the shape of gold nanoparticles influencing the form of the crystal superlattice. The phenomenon of the supercrystal formation was reversible and very fast (a few seconds). To finish, we reported on the detection of phase transitions and refractive index variations for different liquids as water and urea, by measuring the LSPR shift of gold nanoparticles in these liquids. Moreover, we also reported on the detection of chemical molecules by using the SERS effect that was induced by high pressure. In summary, the nanoplasmonics in high pressure environment can be very useful for obtaining structural information on solvents or studying optical, thermodynamic properties of several liquids (organic and inorganic) or solids.
Funding
This research received no external funding.
Conflicts of Interest
The author declares no conflict of interest.
References
- Moakhar, R.S.; Gholipour, S.; Masudy-Panah, S.; Seza, A.; Mehdikhani, A.; Riahi-Noori, N.; Tafazoli, S.; Timasi, N.; Lim, Y.F.; Saliba, M. Recent Advances in Plasmonic Perovskite Solar Cells. Adv. Sci. 2020, 30, 1908408. [Google Scholar]
- Qin, P.; Wu, T.; Wang, Z.; Xiao, L.; Ma, L.; Ye, F.; Xiong, L.; Chen, X.; Li, H.; Yu, X.; et al. Grain Boundary and Interface Passivation with Core–Shell Au@CdS Nanospheres for High-Efficiency Perovskite Solar Cells. Adv. Funct. Mater. 2020, 30, 1908408. [Google Scholar] [CrossRef]
- Bi, W.B.; Wu, Y.J.; Chen, C.; Zhou, D.L.; Song, Z.L.; Li, D.Y.; Chen, G.Y.; Dai, Q.L.; Zhu, Y.S.; Song, H.W. Dye Sensitization and Local Surface Plasmon Resonance-Enhanced Upconversion Luminescence for Efficient Perovskite Solar Cells. ACS App. Mater. Interfaces 2020, 12, 24737–24746. [Google Scholar] [CrossRef] [PubMed]
- Li, H.; Zhou, S.J.; Yin, L.W. Surface Plasmon Resonance Effect Enhanced CsPbBr3 Inverse Opals for High-Performance Inorganic Perovskite Solar Cells. Adv. Mater. Interfaces 2020, 7, 1901885. [Google Scholar] [CrossRef]
- Kaur, N.; Bhullar, V.; Singh, D.P. Bimetallic Implanted Plasmonic Photoanodes for TiO2 Sensitized Third Generation Solar Cells. Sci. Rep. 2020, 10, 7657. [Google Scholar] [CrossRef] [PubMed]
- Ho, W.J.; Yang, H.Y.; Liu, J.J.; Lin, P.J.; Ho, C.H. Plasmonic effects of two-dimensional indium-nanoparticles embedded within SiO2 anti-reflective coating on the performance of silicon solar cells. Appl. Surf. Sci. 2020, 508, 145275. [Google Scholar] [CrossRef]
- Ono, M.; Hata, M.; Tsunekawa, M.; Nozaki, K.; Sumikura, H.; Chiba, H.; Notomi, M. Ultrafast and energy-efficient all-optical switching with graphene-loaded deep-subwavelength plasmonic waveguides. Nat. Photonics 2020, 14, 37–43. [Google Scholar] [CrossRef] [Green Version]
- Winkler, J.M.; Ruckriegel, M.J.; Rojo, H.; Keitel, R.C.; De Leo, E.; Rabouw, F.T.; Norris, D.J. Dual-Wavelength Lasing in Quantum-Dot Plasmonic Lattice Lasers. ACS Nano 2020, 14, 5223–5232. [Google Scholar] [CrossRef] [Green Version]
- Sergent, S.; Takiguchi, M.; Tsuchizawa, T.; Taniyama, H.; Notomi, M. Low-Threshold Lasing up to 360 K in All-Dielectric Subwavelength-Nanowire Nanocavities. ACS Photonics 2020, 7, 1104–1110. [Google Scholar] [CrossRef]
- Guo, X.D.; Liu, R.N.; Hu, D.B.; Hu, H.; Wei, Z.; Wang, R.; Dai, Y.Y.; Cheng, Y.; Chen, K.; Liu, K.H.; et al. Efficient All-Optical Plasmonic Modulators with Atomically Thin Van Der Waals Heterostructures. Adv. Mater. 2020, 32, 1907105. [Google Scholar] [CrossRef]
- Zhou, X.B.; Jiang, M.M.; Wu, Y.T.; Ma, K.J.; Liu, Y.; Wan, P.; Kan, C.X.; Shi, D.N. Hybrid quadrupole plasmon induced spectrally pure ultraviolet emission from a single AgNPs@ZnO:Ga microwire based heterojunction diode. Nanoscale Adv. 2020, 2, 1340–1351. [Google Scholar] [CrossRef]
- Barbillon, G.; Ivanov, A.; Sarychev, A.K. Applications of Symmetry Breaking in Plasmonics. Symmetry 2020, 12, 896. [Google Scholar] [CrossRef]
- Li, Z.; Jin, J.; Yang, F.; Song, N.; Yin, Y. Coupling magnetic and plasmonic anisotropy in hybrid nanorods for mechanochromic responses. Nat. Commun. 2020, 11, 2883. [Google Scholar] [CrossRef] [PubMed]
- Ahmadivand, A.; Gerislioglu, B.; Ramezani, Z. Generation of magnetoelectric photocurrents using toroidal resonances: A new class of infrared plasmonic photodetectors. Nanoscale 2019, 11, 13108–13116. [Google Scholar] [CrossRef]
- Tomitaka, A.; Arami, H.; Ahmadivand, A.; Pala, N.; McGoron, A.J.; Takemura, Y.; Febo, M.; Nair, M. Magneto-plasmonic nanostars for image-guided and NIR-triggered drug delivery. Sci. Rep. 2020, 10, 10115. [Google Scholar] [CrossRef] [PubMed]
- Qiu, G.G.; Gai, Z.B.; Tao, Y.L.; Schmitt, J.; Kullak-Ublick, G.A.; Wang, J. Dual-Functional Plasmonic Photothermal Biosensors for Highly Accurate Severe Acute Respiratory Syndrome Coronavirus 2 Detection. ACS Nano 2020, 14, 5268–5277. [Google Scholar] [CrossRef] [Green Version]
- Portella, A.; Calvo-Lozano, O.; Estevez, M.C.; Escuela, A.M.; Lechuga, L.M. Optical nanogap antennas as plasmonic biosensors for the detection of miRNA biomarkers. J. Mater. Chem. B 2020, 8, 4310–4317. [Google Scholar] [CrossRef] [PubMed]
- Moakhar, R.S.; AbdelFatah, T.; Sanati, A.; Jalali, M.; Flynn, S.E.; Mahshid, S.S.; Mahshid, S. A Nanostructured Gold/Graphene Microfluidic Device for Direct and Plasmonic-Assisted Impedimetric Detection of Bacteria. ACS App. Mater. Interfaces 2020, 12, 23298–23310. [Google Scholar] [CrossRef] [PubMed]
- Huang, J.A.; Mousavi, M.Z.; Zhao, Y.Q.; Hubarevich, A.; Omeis, F.; Giovannini, G.; Schutte, M.; Garoli, D.; De Angelis, F. SERS discrimination of single DNA bases in single oligonucleotides by electro-plasmonic trapping. Nat. Commun. 2019, 10, 5321. [Google Scholar] [CrossRef] [Green Version]
- Dolci, M.; Bryche, J.-F.; Moreau, J.; Leuvrey, C.; Begin-Colin, S.; Barbillon, G.; Pichon, B.P. Investigation of the structure of iron oxide nanoparticle assemblies in order to optimize the sensitivity of surface plasmon resonance-based sensors. Appl. Surf. Sci. 2020, 527, 146773. [Google Scholar] [CrossRef]
- Gutierrez, Y.; Giangregorio, M.M.; Palumbo, F.; Gonzalez, F.; Brown, A.S.; Moreno, F.; Losurdo, M. Sustainable and Tunable Mg/MgO Plasmon-Catalytic Platform for the Grand Challenge of SF6 Environmental Remediation. Nano Lett. 2020, 20, 3352–3360. [Google Scholar] [CrossRef] [PubMed]
- Wang, Y.L.; Fang, L.L.; Gong, M.; Deng, Z.X. Chemically modified nanofoci unifying plasmonics and catalysis. Chem. Sci. 2019, 10, 5929–5934. [Google Scholar] [CrossRef] [PubMed] [Green Version]
- Alekseeva, S.; Nedrygailov, I.I.; Langhammer, C. Single Particle Plasmonics for Materials Science and Single Particle Catalysis. ACS Photonics 2019, 6, 1319–1330. [Google Scholar] [CrossRef]
- Saboktakin, M.; Ye, X.; Chettiar, U.K.; Engheta, N.; Murray, C.B.; Kagan, C.R. Plasmonic Enhancement of Nanophosphor Upconversion Luminescence in Au Nanohole Arrays. ACS Nano 2013, 7, 7186–7192. [Google Scholar] [CrossRef]
- Park, W.; Lu, D.; Ahn, S. Plasmon enhancement of luminescence upconversion. Chem. Soc. Rev. 2015, 44, 2940–2962. [Google Scholar] [CrossRef] [PubMed]
- Wang, Y.; Ding, T. Optical tuning of plasmon-enhanced photoluminescence. Nanoscale 2019, 11, 10589–10594. [Google Scholar] [CrossRef] [PubMed]
- Runowski, M.; Stopikowska, N.; Goderski, S.; Lis, S. Luminescent-plasmonic, lanthanide-doped core/shell nanomaterials modified with Au nanorods—Up-conversion luminescence tuning and morphology transformation after NIR laser irradiation. J. Alloys Compd. 2018, 762, 621–630. [Google Scholar] [CrossRef]
- Zhong, J.H.; Vogelsang, J.; Yi, J.M.; Wang, D.; Wittenbecher, L.; Mikaelsson, S.; Korte, A.; Chimeh, A.; Arnold, C.L.; Schaaf, P.; et al. Nonlinear plasmon-exciton coupling enhances sum-frequency generation from a hybrid metal/semiconductor nanostructure. Nat. Commun. 2020, 11, 1464. [Google Scholar] [CrossRef] [Green Version]
- Shen, Q.X.; Jin, W.L.; Yang, G.; Rodriguez, A.W.; Mikkelsen, M.H. Active Control of Multiple, Simultaneous Nonlinear Optical Processes in Plasmonic Nanogap Cavities. ACS Photonics 2020, 7, 901–907. [Google Scholar] [CrossRef]
- Gao, M.; He, Y.H.; Chen, Y.; Shih, T.M.; Yang, W.M.; Chen, H.Y.; Yang, Z.L.; Wang, Z.H. Enhanced sum frequency generation for ultrasensitive characterization of plasmonic modes. Nanophotonics 2020, 9, 815–822. [Google Scholar] [CrossRef] [Green Version]
- Dalstein, L.; Humbert, C.; Ben Haddada, M.; Boujday, S.; Barbillon, G.; Busson, B. The Prevailing Role of Hotspots in Plasmon-Enhanced Sum-Frequency Generation Spectroscopy. J. Phys. Chem. Lett. 2019, 10, 7706–7711. [Google Scholar] [CrossRef] [PubMed] [Green Version]
- Barbillon, G.; Noblet, T.; Busson, B.; Tadjeddine, A.; Humbert, C. Localised detection of thiophenol with gold nanotriangles highly structured as honeycombs by nonlinear sum frequency generation spectroscopy. J. Mater. Sci. 2018, 53, 4554–4562. [Google Scholar] [CrossRef]
- Baibakov, M.; Patra, S.; Claude, J.-B.; Moreau, A.; Lumeau, J.; Wenger, J. Extending Single-Molecule Förster Resonance Energy Transfer (FRET) Range beyond 10 Nanometers in Zero-Mode Waveguides. ACS Nano 2019, 13, 8469–8480. [Google Scholar] [CrossRef] [PubMed] [Green Version]
- Petreto, A.; Dos Santos, M.C.; Lefebvre, O.; Dos Santos, G.R.; Ponzellini, P.; Garoli, D.; De Angelis, F.; Ammar, M.; Hildebrandt, N. Optimizing FRET on Aluminum Surfaces via Controlled Attachment of Fluorescent Dyes. ACS Omega 2018, 3, 18867–18876. [Google Scholar] [CrossRef] [Green Version]
- Rotho, D.J.; Nasir, M.E.; Ginzburg, P.; Wang, P.; Le Marois, A.; Suhling, K.; Richards, D.; Zayats, A.V. Forster Resonance Energy Transfer inside Hyperbolic Metamaterials. ACS Photonics 2018, 5, 4594–4603. [Google Scholar] [CrossRef] [Green Version]
- De Torres, J.; Mivelle, M.; Moparthi, S.B.; Rigneault, H.; Van Hulst, N.F.; Garcia-Parajo, M.F.; Margeat, E.; Wenger, J. Plasmonic Nanoantennas Enable Forbidden Forster Dipole-Dipole Energy Transfer and Enhance the FRET Efficiency. Nano Lett. 2016, 163, 6222–6230. [Google Scholar] [CrossRef]
- Bidault, S.; Devilez, A.; Ghenuche, P.; Stout, B.; Bonod, N.; Wenger, J. Competition between Forster Resonance Energy Transfer and Donor Photodynamics in Plasmonic Dimer Nanoantennas. ACS Photonics 2016, 3, 895–903. [Google Scholar] [CrossRef]
- Castro-Lopez, M.; Brinks, D.; Sapienza, R.; van Hulst, N.F. Aluminum for Nonlinear Plasmonics: Resonance-Driven Polarized Luminescence of Al, Ag, and Au Nanoantennas. Nano Lett. 2011, 11, 4674–4678. [Google Scholar] [CrossRef]
- Ostovar, B.; Su, M.-N.; Renard, D.; Clark, B.D.; Dongare, P.D.; Dutta, C.; Gross, N.; Sader, J.E.; Landes, C.F.; Chang, W.-S.; et al. Acoustic Vibrations of Al Nanocrystals: Size, Shape, and Crystallinity Revealed by Single-Particle Transient Extinction Spectroscopy. J. Phys. Chem. A 2020, 124, 3924–3934. [Google Scholar] [CrossRef]
- Ma, R.; Wu, D.; Liu, Y.M.; Ye, H.; Sutherland, D. Copper plasmonic metamaterial glazing for directional thermal energy management. Mater. Des. 2020, 188, 108407. [Google Scholar] [CrossRef]
- Bohme, A.; Sterl, F.; Kath, E.; Ubl, M.; Manninen, V.; Giessen, H. Electrochemistry on Inverse Copper Nanoantennas: Active Plasmonic Devices with Extraordinarily Large Resonance Shift. ACS Photonics 2019, 6, 1863–1868. [Google Scholar] [CrossRef]
- Sugawa, K.; Tahara, H.; Yamashita, A.; Otsuki, J.; Sagara, T.; Harumoto, T.; Yanagida, S. Refractive Index Susceptibility of the Plasmonic Palladium Nanoparticle: Potential as the Third Plasmonic Sensing Material. ACS Nano 2015, 9, 1895–1904. [Google Scholar] [CrossRef] [PubMed]
- Sterl, F.; Strohfeldt, N.; Both, S.; Herkert, E.; Weiss, T.; Giessen, H. Design Principles for Sensitivity Optimization in Plasmonic Hydrogen Sensors. ACS Sens. 2020, 5, 917–927. [Google Scholar] [CrossRef] [PubMed]
- Karaballi, R.A.; Monfared, Y.E.; Dasog, M. Overview of Synthetic Methods to Prepare Plasmonic Transition-Metal Nitride Nanoparticles. Chem. Eur. J. 2020, 26, 8499–8505. [Google Scholar] [CrossRef]
- Askes, S.H.C.; Schilder, N.J.; Zoethout, E.; Polman, A.; Garnett, E.C. Tunable plasmonic HfN nanoparticles and arrays. Nanoscale 2019, 11, 20252–20260. [Google Scholar] [CrossRef] [PubMed]
- Noginov, M.A.; Gu, L.; Livenere, J.; Zhu, G.; Pradhan, A.K.; Mundle, R.; Bahoura, M.; Barnakov, Y.A.; Podolskiy, V.A. Transparent conductive oxides: Plasmonic materials for telecom wavelengths. Appl. Phys. Lett. 2011, 99, 021101. [Google Scholar] [CrossRef]
- Boltasseva, A.; Atwater, H.A. Low-Loss Plasmonic Metamaterials. Science 2011, 301, 290–291. [Google Scholar] [CrossRef]
- Ding, S.-Y.; You, E.-M.; Tian, Z.-Q.; Moskovits, M. Electromagnetic theories of surface-enhanced Raman spectroscopy. Chem. Soc. Rev. 2017, 46, 4042–4076. [Google Scholar] [CrossRef]
- Reguera, J.; Langer, J.; Jimenez de Aberasturi, D.; Liz-Marzan, L.M. Anistropic metal nanoparticles for surface enhanced Raman scattering. Chem. Soc. Rev. 2017, 46, 3866–3885. [Google Scholar] [CrossRef]
- Bryche, J.-F.; Bélier, B.; Bartenlian, B.; Barbillon, G. Low-cost SERS substrates composed of hybrid nanoskittles for a highly sensitive sensing of chemical molecules. Sens. Actuators B 2017, 239, 795–799. [Google Scholar] [CrossRef]
- Barbillon, G. Latest Novelties on Plasmonic and Non-Plasmonic Nanomaterials for SERS Sensing. Nanomaterials 2020, 10, 1200. [Google Scholar] [CrossRef] [PubMed]
- Sheena, T.S.; Devaraj, V.; Lee, J.-M.; Balaji, P.; Gnanasekar, P.; Oh, J.-W.; Akbarsha, M.A.; Jeganathan, K. Sensitive and label-free shell isolated Ag NPs@Si architecture based SERS active substrate: FDTD analysis and in-situ cellular DNA detection. Appl. Surf. Sci. 2020, 515, 145955. [Google Scholar] [CrossRef]
- Zhang, D.J.; Peng, L.Q.; Shang, X.L.; Zheng, W.X.; You, H.J.; Xu, T.; Ma, B.; Ren, B.; Fang, J.X. Buoyant particulate strategy for few-to-single particle-based plasmonic enhanced nanosensors. Nat. Commun. 2020, 11, 2603. [Google Scholar] [CrossRef] [PubMed]
- Zhu, S.; Li, H.; Yang, M.; Pang, S.W. Highly sensitive detection of exosomes by 3D plasmonic photonic crystal biosensor. Nanoscale 2018, 10, 19927–19936. [Google Scholar] [CrossRef] [PubMed]
- Cai, J.X.; Zhang, C.P.; Liang, C.W.; Min, S.Y.; Cheng, X.; Li, W.D. Solution-Processed Large-Area Gold Nanocheckerboard Metasurfaces on Flexible Plastics for Plasmonic Biomolecular Sensing. Adv. Opt. Mater. 2019, 7, 1900516. [Google Scholar] [CrossRef]
- Kawasaki, D.; Yamada, H.; Maeno, K.; Sueyoshi, K.; Hisamoto, H.; Endo, T. Core-Shell-Structured Gold Nanocone Array for Label-Free DNA Sensing. ACS Appl. Nano Mater. 2019, 2, 4983–4990. [Google Scholar] [CrossRef]
- Zhang, C.; Paria, D.; Semancik, S.; Barman, I. Composite-Scattering Plasmonic Nanoprobes for Label-Free, Quantitative Biomolecular Sensing. Small 2019, 15, 1901165. [Google Scholar] [CrossRef]
- Park, J.; Ndao, A.; Cai, W.; Hsu, L.; Kodigala, A.; Lepetit, T.; Lo, Y.; Kanté, B. Symmetry-breaking-induced plasmonic exceptional points and nanoscale sensing. Nat. Phys. 2020, 16, 462–468. [Google Scholar] [CrossRef]
- Dhawan, A.; Duval, A.; Nakkach, M.; Barbillon, G.; Moreau, J.; Canva, M.; Vo-Dinh, T. Deep UV nano-microstructuring of substrates for surface plasmon resonance imaging. Nanotechnology 2011, 22, 165301. [Google Scholar] [CrossRef]
- Barbillon, G.; Ivanov, A.; Sarychev, A.K. Hybrid Au/Si Disk-Shaped Nanoresonators on Gold Film for Amplified SERS Chemical Sensing. Nanomaterials 2019, 9, 1588. [Google Scholar] [CrossRef] [Green Version]
- Manfrinato, V.R.; Camino, F.E.; Stein, A.; Zhang, L.H.; Lu, M.; Stach, E.A.; Black, C.T. Patterning Si at the 1 nm Length Scale with Aberration-Corrected Electron-Beam Lithography: Tuning of Plasmonic Properties by Design. Adv. Funct. Mater. 2019, 29, 1903429. [Google Scholar] [CrossRef]
- Quilis, N.G.; Hageneder, S.; Fossati, S.; Auer, S.K.; Venugopalan, P.; Bozdogan, A.; Petri, C.; Moreno-Cencerrado, A.; Toca-Herrera, J.L.; Jonas, U.; et al. UV-Laser Interference Lithography for Local Functionalization of Plasmonic Nanostructures with Responsive Hydrogel. J. Phys. Chem. C 2020, 124, 3297–3305. [Google Scholar] [CrossRef] [PubMed] [Green Version]
- Yang, L.T.; Lee, J.H.; Rathnam, C.; Hou, Y.N.; Choi, J.W.; Lee, K.B. Dual-Enhanced Raman Scattering-Based Characterization of Stem Cell Differentiation Using Graphene-Plasmonic Hybrid Nanoarray. Nano Lett. 2019, 19, 8138–8148. [Google Scholar] [CrossRef] [PubMed]
- Chau, Y.F.C.; Chen, K.H.; Chiang, H.P.; Lim, C.M.; Huang, H.J.; Lai, C.H.; Kumara, N.T.R.N. Fabrication and Characterization of a Metallic-Dielectric Nanorod Array by Nanosphere Lithography for Plasmonic Sensing Applications. Nanomaterials 2019, 9, 1691. [Google Scholar] [CrossRef] [Green Version]
- Goetz, S.; Bauch, M.; Dimopoulos, T.; Trassi, S. Ultrathin sputter-deposited plasmonic silver nanostructures. Nanoscale Adv. 2020, 2, 869–877. [Google Scholar] [CrossRef]
- Driencourt, L.; Federspiel, F.; Kazazis, D.; Tseng, L.T.; Frantz, R.; Ekinci, Y.; Ferrini, R.; Gallinet, B. Electrically Tunable Multicolored Filter Using Birefringent Plasmonic Resonators and Liquid Crystals. ACS Photonics 2020, 7, 444–453. [Google Scholar] [CrossRef]
- Maier, S.A. Plasmonics: Fundamentals and Applications; Springer: New York, NY, USA, 2007; pp. 3–220. [Google Scholar]
- Enoch, S.; Bonod, N. Plasmonics: From Basics to Advanced Topics; Springer: Berlin/Heidelberg, Germany, 2012; pp. 3–317. [Google Scholar]
- Li, Z.; Butun, S.; Aydin, K. Ultranarrow Band Absorbers Based on Surface Lattice Resonances in Nanostructured Metal Surfaces. ACS Nano 2014, 8, 8242–8248. [Google Scholar] [CrossRef]
- Kravets, V.G.; Kabashin, A.V.; Barnes, W.L.; Grigorenko, A.N. Plasmonic Surface Lattice Resonances: A Review of Properties and Applications. Chem. Rev. 2018, 118, 5912–5951. [Google Scholar] [CrossRef]
- Sobhani, A.; Manjavacas, A.; Cao, Y.; McClain, M.J.; Javier Garcia de Abajo, F.; Nordlander, P.; Halas, N.J. Pronounced Linewidth Narrowing of an Aluminum Nanoparticle Plasmon Resonance by Interaction with an Aluminum Metallic Film. Nano Lett. 2015, 15, 6946–6951. [Google Scholar] [CrossRef]
- Yue, W.; Wang, Z.; Whittaker, J.; Lopez-Royo, F.; Yang, Y.; Zayats, A.V. Amplification of surface-enhanced Raman scattering due to substrate-mediated localized surface plasmons in gold nanodimers. J. Mater. Chem. C 2017, 5, 4075–4084. [Google Scholar] [CrossRef] [Green Version]
- Bao, Y.J.; Zhao, B.; Hou, D.J.; Liu, J.S.; Wang, F.; Wang, X.; Cui, T. The redshift of surface plasmon resonance of colloidal gold nanoparticles induced by pressure with diamond anvil cell. J. Appl. Phys. 2014, 115, 223503. [Google Scholar] [CrossRef]
- Li, B.S.; Wen, X.D.; Li, R.P.; Wang, Z.W.; Clem, P.G.; Fan, H.Y. Stress-induced phase transformation and optical coupling of silver nanoparticle superlattices into mechanically stable nanowires. Nat. Commun. 2014, 5, 4179. [Google Scholar] [CrossRef] [PubMed] [Green Version]
- Bao, Y.J.; Zhao, B.; Tang, X.Y.; Hou, D.J.; Cai, J.; Tang, S.; Liu, J.S.; Wang, F.; Cui, T. Tuning surface plasmon resonance by the plastic deformation of Au nanoparticles within a diamond anvil cell. Appl. Phys. Lett. 2015, 107, 201909. [Google Scholar] [CrossRef]
- Gu, X.W.; Hanson, L.A.; Eisler, C.N.; Koc, M.A.; Alivisatos, A.P. Pseudoelasticity at Large Strains in Au Nanocrystals. Phys. Rev. Lett. 2018, 121, 056102. [Google Scholar] [CrossRef] [Green Version]
- Martin-Sanchez, C.; Barreda-Argüeso, J.A.; Seibt, S.; Mulvaney, P.; Rodriguez, F. Effects of Hydrostatic Pressure on the Surface Plasmon Resonance of Gold Nanocrystals. ACS Nano 2019, 13, 498–504. [Google Scholar] [CrossRef]
- Jacobs, K.; Wickham, J.; Alivisatos, A.P. Threshold Size for Ambient Metastability of Rocksalt CdSe Nanocrystals. J. Phys. Chem. B 2002, 106, 3759–3762. [Google Scholar] [CrossRef] [Green Version]
- Choi, C.L.; Koski, K.J.; Sivasankar, S.; Alivisatos, A.P. Strain-Dependent Photoluminescence Behavior of CdSe/CdS Nanocrystals with Spherical, Linear, and Branched Topologies. Nano Lett. 2009, 9, 3544–3549. [Google Scholar] [CrossRef] [Green Version]
- Heinz, D.L.; Jeanloz, R. The Equation of State of the Gold Calibration Standard. J. Appl. Phys. 1984, 55, 885–893. [Google Scholar] [CrossRef]
- Takemura, K.; Dewaele, A. Isothermal equation of state for gold with a He-pressure medium. Phys. Rev. B 2008, 78, 104119. [Google Scholar] [CrossRef]
- Schroer, M.A.; Lehmkühler, F.; Möller, J.; Lange, H.; Grübel, G.; Schulz, F. Pressure-Stimulated Supercrystal Formation in Nanoparticle Suspensions. J. Phys. Chem. Lett. 2018, 9, 4720–4724. [Google Scholar] [CrossRef] [PubMed] [Green Version]
- Lehmkühler, F.; Schroer, M.A.; Markmann, V.; Frenzel, L.; Möller, J.; Lange, H.; Grübel, G.; Schulz, F. Kinetics of pressure-induced nanocrystal superlattice formation. Phys. Chem. Chem. Phys. 2019, 21, 21349–21354. [Google Scholar] [CrossRef] [PubMed]
- Schroer, M.A.; Lehmkühler, F.; Markmann, V.; Frenzel, L.; Möller, J.; Lange, H.; Grübel, G.; Schulz, F. Supercrystal Formation of Gold Nanorods by High Pressure Stimulation. J. Phys. Chem. C 2019, 123, 29994–30000. [Google Scholar] [CrossRef]
- Martin-Sanchez, C.; Sanchez-Iglesias, A.; Mulvaney, P.; Liz-Marzan, L.M.; Rodriguez, F. Plasmonic Sensing of Refractive Index and Density in Methanol–Ethanol Mixtures at High Pressure. J. Phys. Chem. C 2020, 124, 8978–8983. [Google Scholar] [CrossRef]
- Martin-Sanchez, C.; Gonzalez-Rubio, G.; Mulvaney, P.; Guerrero-Martinez, A.; Liz-Marzan, L.M.; Rodriguez, F. Monodisperse Gold Nanorods for High-Pressure Refractive Index Sensing. J. Phys. Chem. Lett. 2019, 10, 1587–1593. [Google Scholar] [CrossRef] [PubMed] [Green Version]
- Runowski, M.; Sobczak, S.; Marciniak, J.; Bukalska, I.; Lis, S.; Katrusiak, A. Gold nanorods as a high-pressure sensor of phase transitions and refractive-index gauge. Nanoscale 2019, 11, 8718–8726. [Google Scholar] [CrossRef] [PubMed]
- Sun, H.H.; Yao, M.G.; Song, Y.P.; Zhu, L.Y.; Dong, J.J.; Liu, R.; Li, P.; Zhao, B.; Liu, B.B. Pressure-induced SERS enhancement in a MoS2/Au/R6G system by a two-step charge transfer process. Nanoscale 2019, 11, 21493–21501. [Google Scholar] [CrossRef]
- Eggert, J.H.; Xu, L.; Che, R.; Chen, L.; Wang, J. High pressure refractive index measurements of 4:1 methanol:ethanol. J. Appl. Phys. 1992, 72, 2453–2461. [Google Scholar] [CrossRef]
- Ahrens, T.J.; Ruderman, M.H. Immersed-Foil Method for Measuring Shock Wave Profiles in Solids. J. Appl. Phys. 1966, 37, 4758–4765. [Google Scholar] [CrossRef] [Green Version]
- Petersen, C.F.; Rosenberg, J.T. Index of Refraction of Ethanol and Glycerol under Shock. J. Appl. Phys. 1969, 40, 3044–3046. [Google Scholar] [CrossRef]
- Vedam, K.; Limsuwan, P. Piezo- and elasto-optic properties of liquids under high pressure. II. Refractive index vs density. J. Chem. Phys. 1978, 69, 4772–4778. [Google Scholar] [CrossRef]
- Chen, C.C.; Vedam, K. Piezo- and elasto-optic properties of liquids under high pressure. III. Results on twelve more liquids. J. Chem. Phys. 1980, 73, 4577–4584. [Google Scholar] [CrossRef]
- Polian, A.; Grimsditch, M. Brillouin scattering from H2O: Liquid, ice VI, and ice VII. Phys. Rev. B 1983, 27, 6409–6412. [Google Scholar] [CrossRef]
- Dewaele, A.; Eggert, J.H.; Loubeyre, P.; Le Toullec, R. Measurement of refractive index and equation of state in dense He, H2, H2O, and Ne under high pressure in a diamond anvil cell. Phys. Rev. B 2003, 67, 094112. [Google Scholar] [CrossRef] [Green Version]
- Zha, C.; Hemley, R.J.; Gramsch, S.A.; Mao, H.; Basset, W.A. Optical study of H2O ice to 120 GPa: Dielectric function, molecular polarizability, and equation of state. J. Chem. Phys. 2007, 126, 074506. [Google Scholar] [CrossRef] [PubMed]
- Roszak, K.; Katrusiak, A. Giant Anomalous Strain between High-Pressure Phases and the Mesomers of Urea. J. Phys. Chem. C 2017, 121, 778–784. [Google Scholar] [CrossRef]
- Nayak, A.P.; Bhattacharyya, S.; Zhu, J.; Liu, J.; Wu, X.; Pandey, T.; Jin, C.; Singh, A.K.; Akinwande, D.; Lin, J.F. Pressure-induced semiconducting to metallic transition in multilayered molybdenum disulphide. Nat. Commun. 2014, 5, 3731. [Google Scholar] [CrossRef] [PubMed] [Green Version]
- Alahmadi, M.; Siaj, M. Graphene-Assisted Magnetic Iron Carbide Nanoparticles Growth. ACS Appl. Nano Mater. 2018, 1, 7000–7005. [Google Scholar] [CrossRef]
Figure 1.
At top, principle scheme of a DAC with a TEM picture of sample (AuSNP size = 80 nm; scale bar = 100 nm). The ruby sphere is employed in order to measure the pressure in chamber by fluorescence. At bottom, absorption spectra of AuSNPs are displayed as function of the wavelength and the pressure with a gasket pre-indented to (a) 140 m and (b) 317 m. Black circles correspond to experimental measurements of the absorption maximum. Red arrows represent the starting of the broadening of absorption peak. Black arrows represent the brutal change in the LSPR shift magnitude for AuSNPs. All of the figures are reprinted from [75], with the permission of AIP Publishing.

Figure 2.
(a) Absorbance (optical density) spectra of Au nanospheres in paraffin at different pressures. (b) Localized surface plasmon resonance wavelength versus pressure. The experimental data are displayed as green points. All of the lines correspond to a fit with the Mie–Gans model where the parameters vary according the considered case. The red dashed line corresponds to the case of an imcompressible particle. The dark and light gray lines correspond to the case where medium and particle are compressible with K = 190 GPa (called Nano) and K = 167 GPa (called Bulk), respectively. The brown lines correspond to the case of an incompressible medium for a gold nanoparticle (called Nano; in dark brown) and for bulk gold material (called Bulk; in light brown). All of the figures are reprinted (adapted) with permission from [77], Copyright 2019 American Chemical Society.

Figure 3.
(a) TEM picture of the Au nanorods with AR = 3.7 (dimensions: 21.7 nm × 5.6 nm). (b) Absorbance (optical density) spectra of Au nanorods (AR = 3.7) in methanol–ethanol (1:4) solution at different pressures. All of the figures are reprinted (adapted) with permission from [77], Copyright 2019 American Chemical Society.

Figure 4.
(a) Absorbance (optical density) spectra of Au nanorods (AR = 3.7) in methanol–ethanol (4:1) solution recorded at different pressures. (b) LSPR wavelength versus hydrostatic pressure for the longitudinal and transversal modes of Au nanorods (AR = 3.7) in methanol–ethanol (4:1) solution. Orange points correspond to experimental data. All of the lines correspond to a fit with the Mie–Gans model where the parameters vary according the considered case. For both plasmonic modes, the green line corresponds to the case of an incompressible particle. The gray lines correspond to the case where particle and solvent are compressible (in dark gray = the bulk modulus of gold called Nano; in light gray = the bulk modulus of gold called Bulk). The brown lines correspond to the case of an incompressible medium (in dark brown = the bulk modulus of gold called Nano; in light brown = the bulk modulus of gold called Bulk). The vertical dashed line corresponds to the solution solidification. All of the figures are reprinted (adapted) with permission from [77], Copyright 2019 American Chemical Society.

Figure 5.
(a) Small-angle X-ray scattering (SAXS) patterns of the AuNP@PEG5k in a CsCl solution of 2 M recorded for a pressure of 1 bar (at left), 4000 bar (at middle), again 1 bar (at right). (b) Corresponding scheme of the structural assembly of AuNP@PEG5k: at left, liquid state; at middle, face-centered cubic crystallites; at right, return to liquid state. All of the figures are reprinted (adapted) with permission from [82], Copyright 2018 American Chemical Society.

Figure 6.
Pressure effect on the lattice constant a for (a) AuNP@PEG5k and (b) AuNP@PEG2k in each chloride salt solution of 2 M (blue crosses for NaCl, red squares for KCl, orange disks for RbCl, and purple triangles for CsCl). All of the figures are reprinted (adapted) with permission from [82], Copyright 2018 American Chemical Society.

Figure 7.
(a) TEM picture of an AuNR@PEGMUA2k assembly. (b) SAXS patterns of the AuNR@PEGMUA2k in a RbCl solution of 2 M recorded for a pressure of 1 bar (at top), 4000 bar (at bottom) with the corresponding scheme of the structural assembly (liquid state and supercrystal with a two-dimensional (2D) hexagonal superlattice, respectively). (c) Interparticle distance for AuNR@PEGMUA2k versus pressure. The red and blue data correspond to the liquid state and supercrystal formation, respectively. The black data correspond to the switching from liquid state to supercrystals. All the figures are reprinted (adapted) with permission from [84], Copyright 2019 American Chemical Society.

Figure 8.
(a) Extinction spectra of AuNPs in the methanol-ethanol (4:1) solution at different pressures. (b) LSPR wavelength versus pressure. The dashed line represents the limit between the hydrostatic and non-hydrostatic regimes. (c) TEM picture of Au spherical nanoparticles with a diameter of 20 nm. (d) Refractive index of the methanol-ethanol (4:1) solution versus pressure. All of the colored points correspond to data found in the literature. The gray line corresponds to experimental RI measurements obtained with the expression (3). All the figures are reprinted (adapted) with permission from [85], Copyright 2020 American Chemical Society.

Figure 9.
(a) TEM picture of Au nanorods employed for experiments (scale bar = 200 nm). (b) LSPR wavelength versus pressure. The red, pink and green points correspond to experimental values for the liquid state, ice VI phase, and ice VII phase, respectively. The gray line represents the values determined with the Mie–Gans model. (c) Refractive index of the water versus pressure. All of the colored points correspond to data referenced in the literature. The gray line corresponds to experimental RI measurements obtained with the expression (3), and the dashed gray line corresponds to the values extrapolated with this model. All of the figures are reprinted (adapted) with permission from [86], Copyright 2019 American Chemical Society.

Figure 10.
(a) SEM picture of AuNPs/MoS NFs (scale bar = 500 nm). (b) SERS spectra of MoS/Au/R6G system at different pressures. (c) Charge transfer mechanism for the SERS enhancement induced pressure. All of the figures are reproduced from [88] with permission from the Royal Society of Chemistry.
Figure 10.
(a) SEM picture of AuNPs/MoS NFs (scale bar = 500 nm). (b) SERS spectra of MoS/Au/R6G system at different pressures. (c) Charge transfer mechanism for the SERS enhancement induced pressure. All of the figures are reproduced from [88] with permission from the Royal Society of Chemistry.


Table 1.
Effect of high pressure on localized surface plasmon resonance (LSPR) of metallic nanoparticles.
Table 1.
Effect of high pressure on localized surface plasmon resonance (LSPR) of metallic nanoparticles.
| Samples | Study | References |
|---|---|---|
| Au spheroidal nanoparticles | LSPR shifts | [75] |
| Au nanocrystals | LSPR shifts | [76] |
| Au nanospheres and Au nanorods | LSPR shifts for both modes | [77] |
Table 2.
Studies for the supercrystal formation of metallic nanoparticles stimulated by high pressure.
Table 2.
Studies for the supercrystal formation of metallic nanoparticles stimulated by high pressure.
| Samples | Study | References |
|---|---|---|
| Au spherical nanoparticles | Supercrystal formation | [82] |
| Au spherical nanoparticles | Kinetics of nanocrystal superlattice formation | [83] |
| Au nanorods | Supercrystal formation | [84] |
Table 3.
Detection of molecules and phase transitions in high pressure environment (RI = Refractive Index, AuNPs = Gold nanoparticles; MoS NFs = Molybdenum disulphide nanoflowers).
Table 3.
Detection of molecules and phase transitions in high pressure environment (RI = Refractive Index, AuNPs = Gold nanoparticles; MoS NFs = Molybdenum disulphide nanoflowers).
| Samples | Detection | References |
|---|---|---|
| Au spherical nanoparticles | RI of Methanol-ethanol mixture | [85] |
| Au nanorods | Phases of water | [86] |
| Au nanorods | Phases of water and urea | [87] |
| AuNPs/MoS NFs | Rhodamine 6G | [88] |
© 2020 by the author. Licensee MDPI, Basel, Switzerland. This article is an open access article distributed under the terms and conditions of the Creative Commons Attribution (CC BY) license (http://creativecommons.org/licenses/by/4.0/).
Share and Cite
MDPI and ACS Style
Barbillon, G. Nanoplasmonics in High Pressure Environment. Photonics 2020, 7, 53. https://0-doi-org.brum.beds.ac.uk/10.3390/photonics7030053
AMA Style
Barbillon G. Nanoplasmonics in High Pressure Environment. Photonics. 2020; 7(3):53. https://0-doi-org.brum.beds.ac.uk/10.3390/photonics7030053
Chicago/Turabian StyleBarbillon, Grégory. 2020. "Nanoplasmonics in High Pressure Environment" Photonics 7, no. 3: 53. https://0-doi-org.brum.beds.ac.uk/10.3390/photonics7030053
Note that from the first issue of 2016, this journal uses article numbers instead of page numbers. See further details here.