Giant Displacement Sensitivity Using Push-Pull Method in Interferometry


INESC TEC—Institute for Systems and Computer Engineering, Technology and Science, Rua do Campo Alegre 687, 4169-007 Porto, Portugal
*
Author to whom correspondence should be addressed.
Photonics 2021, 8(1), 23; https://0-doi-org.brum.beds.ac.uk/10.3390/photonics8010023
Submission received: 15 December 2020
/
Revised: 15 January 2021
/
Accepted: 18 January 2021
/
Published: 19 January 2021
(This article belongs to the Special Issue Optical Fiber Interferometric Sensors: New Production Methodologies and Novel Applications)
Abstract
:We present a giant sensitivity displacement sensor combining the push-pull method and enhanced Vernier effect. The displacement sensor consists in two interferometers that are composed by two cleaved standard optical fibers coupled by a 3 dB coupler and combined with a double-sided mirror. The push pull-method is applied to the mirror creating a symmetrical change to the length of each interferometer. Furthermore, we demonstrate that the Vernier effect has a maximum sensitivity of two-fold that obtained with a single interferometer. The combination of the push-pull method and the Vernier effect in the displacement sensors allows a sensitivity of 60 ± 1 nm/μm when compared with a single interferometer working in the same free spectral range. In addition, exploring the maximum performance of the displacement sensors, a sensitivity of 254 ± 6 nm/μm is achieved, presenting a M-factor of 1071 and MVernier of 1.9 corresponding to a resolution of 79 pm. This new solution allows the implementation of giant-sensitive displacement measurement for a wide range of applications.
1. Introduction
With the evolution of technology, the impact of sensors on human life has increased. The significant impact of optical systems is due to the emergence of fiber optics in 1960 [1]. The features such as low attenuation and insensitivity to electromagnetic fields have allowed optical systems to replace electronic communications. In addition, they have enabled the design of ultra-sensitive optical sensors with applicability in nanotechnology [2].
The cleaved-tip optical sensors are the simplest [3]. When used alone, they are only intensity sensors. However, when they are coupled to reflective surfaces [4] or when coatings are deposited on the tip [5], in addition to the intensity operation, they can also operate at wavelength because they allow the implementation of Fabry–Perot interferometers (FPI) [6]. The operation of an FPI is unidirectional where, initially, part of the beam is reflected, and another part is transmitted forming two beams. The transmitted beam is then reflected travelling a distance that is twice the length of the interferometer. Finally, the two beams overlap resulting in the interference pattern. Although in certain areas there are sensory architectures with higher sensitivity and the possibility of multiple measurements [7,8,9], the cleaved-tip sensors are the easiest to control and manufacture in addition to covering a higher number of research areas.
Despite the vast advances in the development of optical sensors, it was only in 2011 that the Vernier effect was applied in interferometry [10]. This phenomenon is based on the optical waves beat where two waves appear, the envelope and the carrier [11]. Normally, measurements are based on the envelope wave because it shows the highest sensitivity. In the case of interferometry, the effect is in the wavelength dimension, so spectral optical waves are used.
Currently there are several interferometric displacement sensors. From these, the Mach–Zehnder with a sensitivity of 1.53 nm/μm [12] stands out for a wide range. For a narrow range, the application of surface plasmon resonance (SPR) with a sensitivity of 10.32 nm/μm for a micrometric range [13] and a sensitivity of 31.45 nm/nm for a nanometric range [14] stand out. Recently a new strain sensor architecture based on a push-pull deformation method was reported [15].
In this work, the enhanced Vernier effect combined with the push-pull method is presented. This sensor consists of two FPIs formed by two cleaved tips and a mirror. The signal from the two interferometers are overlapped by means of a 3 dB fiber coupler, resulting the Vernier effect. In this research, the sensitivity of the single interferometer is compared with the sensitivity of the enhanced Vernier effect envelope, both with the same free spectral range (FSR). In addition, it also presents the results regarding the maximization of displacement sensors with enhanced Vernier effect.
2. Materials and Methods
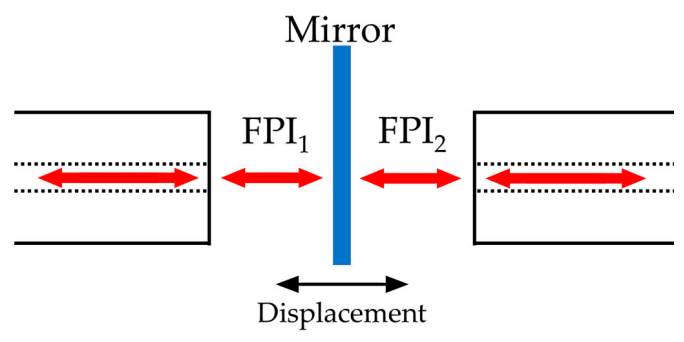
The Vernier effect consists on the overlapping of two optical waves, a concept similar to the beat of two sound waves [16]. This optical phenomenon results in the formation of two new waves: the envelope and the carrier. Usually, optical sensors are based on the traditional Vernier effect, where one of the interferometers is referenced and another is the sensing probe. However, in this paper, the enhanced Vernier effect is presented, and it uses two sensing interferometers which move in opposite directions [17]. One of the major problems with this type of Vernier effect is the lack of sensors with symmetrical sensitivities. Thus arises the application of the push-pull method in interferometry, allowing symmetrical variations of two equal interferometers. This results in two sensors with symmetric sensitivities allowing the maximization of the enhanced Vernier effect [15].
The architecture of the two interferometers is presented in Figure 1 and it is composed by two cleaved fibers and a double-sided reflecting surface. The two interferometers are linked together with a 3 dB coupler. The operating method consists in dividing the light beam into two beams that through the cleaved fibers and the reflecting surface form two Fabry–Perot interferometers (FPIs).
The optical signal of the two interferometers is overlapped by means of the coupler forming the output signal of the sensor. The intensity of a FPI can be written as:
where Δϕ = πnL/λ, n is the refractive index, L is the interferometer length, λ is the wavelength and I0 is the difference in intensity of the optical paths. If the optical signal is coupled between fibers, a π/2 phase must be added to Δϕ. Thus, the sensor output signal is described by:
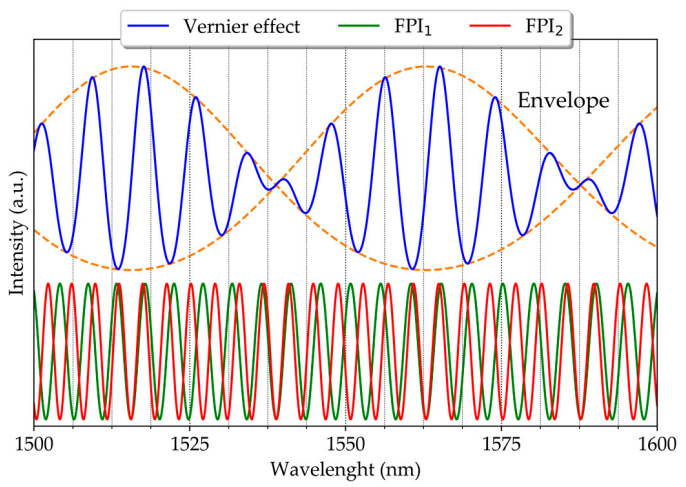
where the indices 1 and 2 allow identify the two interferometers, the components Δϕ1 − Δϕ2 and Δϕ1 + Δϕ2 correspond to the envelope and the carrier, respectively. Figure 2 presents the simulation of Equation (2) with two cavities-one with 500 μm and the other with 600 μm-and a refraction index of 1.00027316. The length of the interferometers can be written as L = L0 + ΔL, where L0 is the initial length and ΔL is the mirror displacement. Therefore, taking into account that the interferometers are submitted to a symmetric displacement, Equation (2) can be rewritten as follows:
where γ = πn/2λ. As can be seen, the envelope of the enhanced Vernier effect has a sensitivity two-fold that of the one achieved for a single FPI. Furthermore, the envelope does not depend on the length of the interferometers allowing the result of ultra-sensitive displacement sensors with macroscopic FPIs to be replicated.
To evaluate the efficiency of the implementation of the Vernier effect, the M-factor is considered and is given by [16]:
where Δλenv is the free spectral range (FSR) of the envelope and Δλ1 is the FSR of a single interferometer. With the appearance of the enhanced Vernier effect, new factors have emerged to evaluate the performance of the Vernier effect [18]:
where sensenv and senscarr are the envelope and the carrier sensitivities, respectively,
where Δλcarr is the FSR of the carrier and,
where MVernier is = 1 for the traditional Vernier effect, < 1 for reduced case and > 1 for the enhanced case.
3. Results
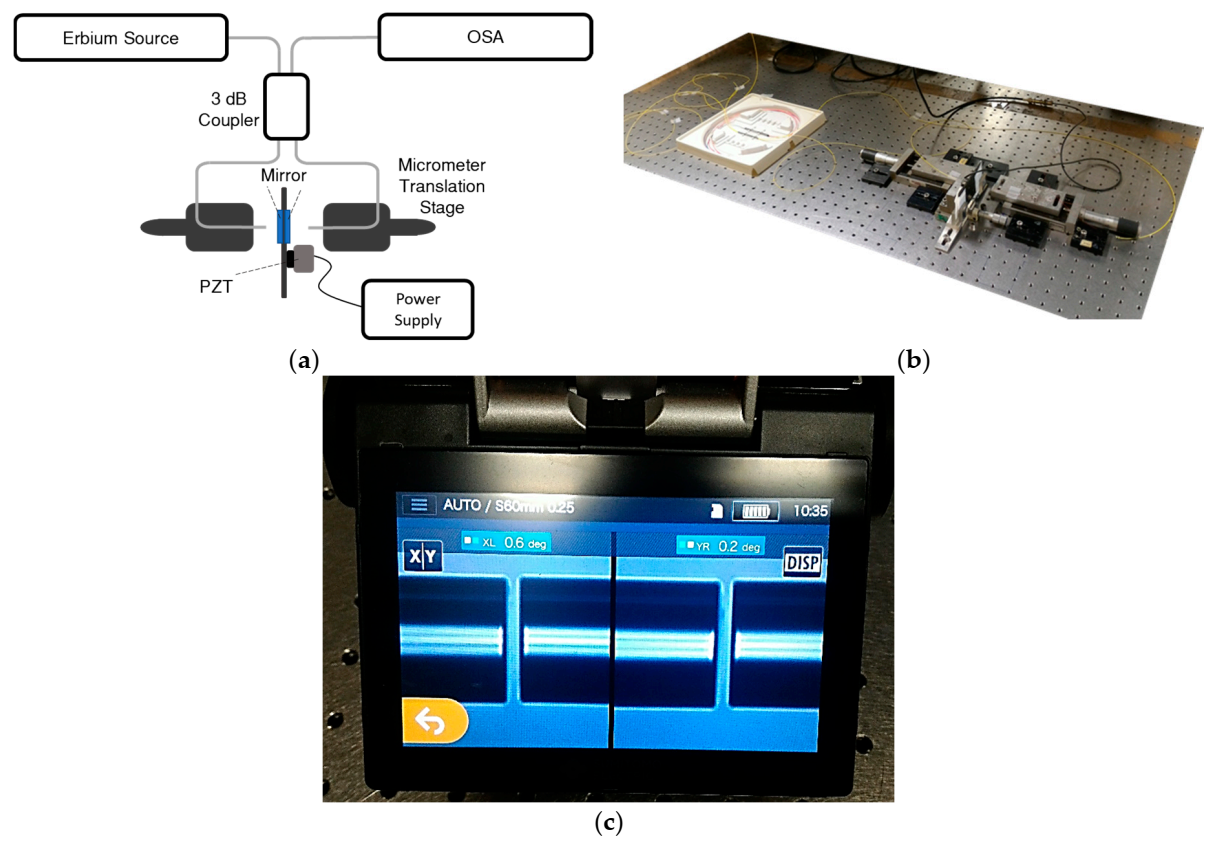
The setup used to characterize the sensor is shown in Figure 3. The mechanical part consists of a double-sided reflective silver surface coupled to a piezoelectric with a displacement of 180.0 ± 0.2 nm/V. Also, a standard optical fiber (SMF28), an erbium broadband source, centered at 1550 nm and a bandwidth of 90 nm, and an optical spectral analyzer (OSA, “YOKOGAWA AQ5370C”) with a resolution of 0.02 nm, were used. All the splices in the system were made with a conventional splice machine (“Sumitomo Electric—Type-72C”, Osaka, Japan). The overlap of the interferometers signals is obtained with a 3 dB fiber coupler. The fiber cleavage was performed by “Fiber Cleaver FC-6RS” which provides a cleavage angle of less than 1° (Figure 3c).
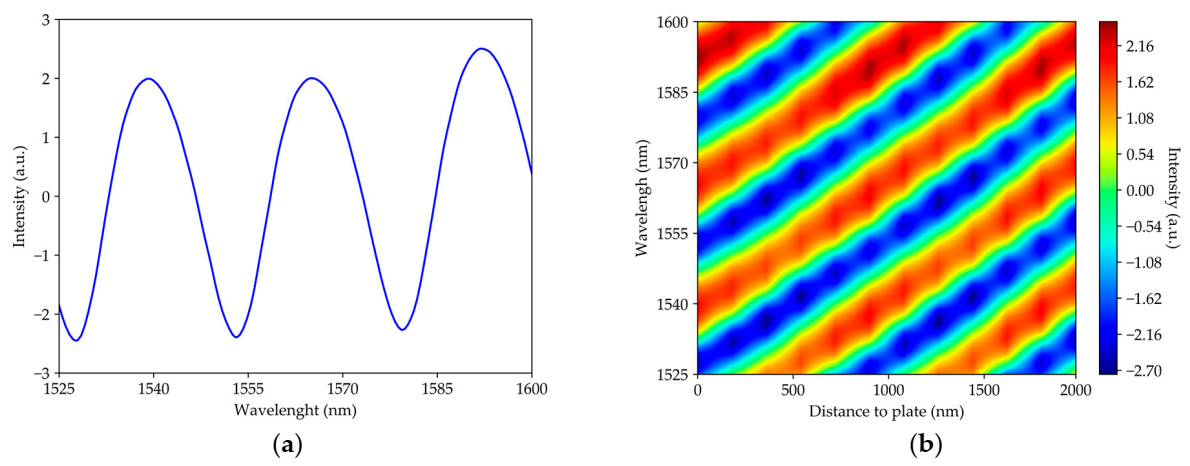
The sensor characterization involved nano-step measurement provided by the piezoelectric device. To determine the efficiency of the displacement sensor, a single interferometer with a length of 73 ± 2 μm was initially developed, which allowed only three fringes in the bandwidth supplied by the erbium source (Figure 4a) to be obtained. Varying the distance between the fiber and the reflecting surface resulted in Figure 4b where a sensitivity of 29.2 ± 0.3 nm/μm with a r2 of 0.9995 was obtained.
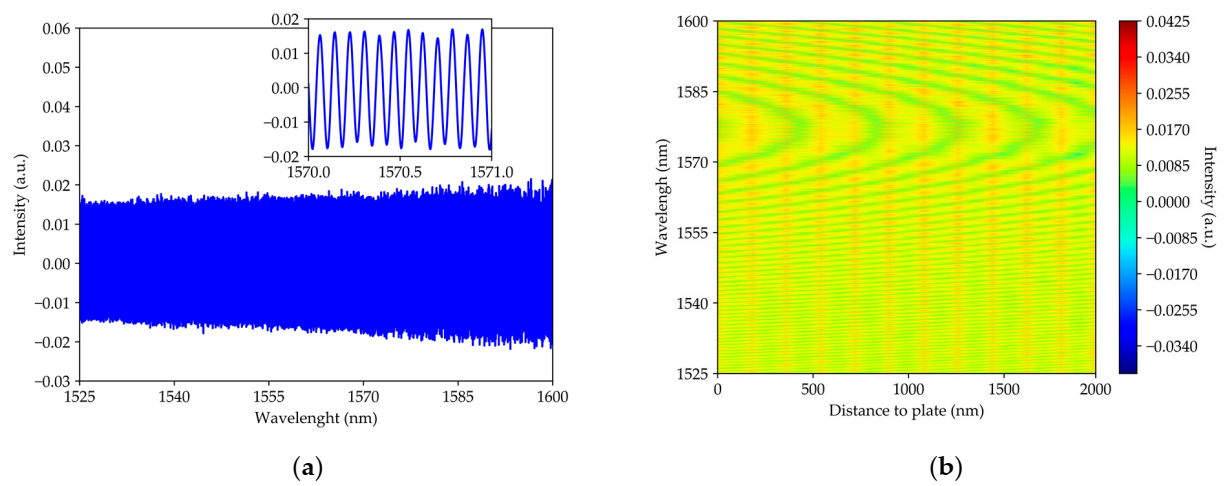
Following, the Vernier effect was investigated. Since the accuracy of the envelope measurement increases with the increase of the carrier frequency, the sensitivity of a single interferometer with a length of 15.4 ± 0.5 mm was first studied (Figure 5), where a sensitivity of 0.95 ± 0.05 nm/μm with a r2 of 0.995 was achieved. Thus, the interferometers used to generate the Vernier effect have a lower sensitivity than the reference single interferometer. In this case, the FSR is 0.07 nm.
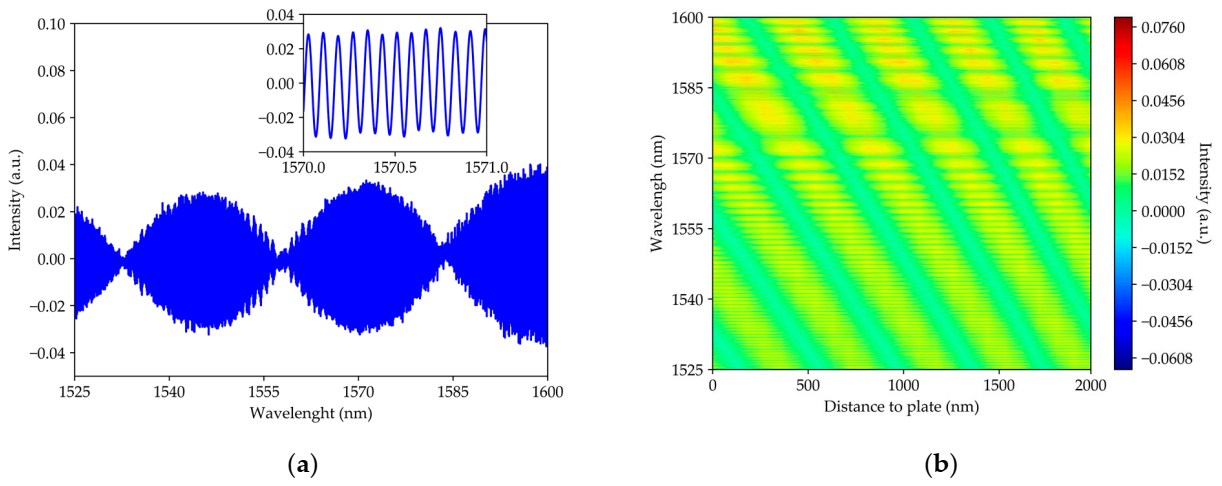
Now, a second fiber has been added allowing to obtain the Vernier effect. Although both interferometers have the same length (15.4 ± 0.5 mm), they differ by a value close to 70 μm. Hence an envelope with only three fringes appears (Figure 6). This last feature is important because it allows us to compare the envelope of this sensor with the first singular interferometer that is present in this paper.
In this case, the envelope sensitivity was 60 ± 1 nm/μm with a r2 of 0.998 (which is shown in Figure 8) and the carrier had a negligible sensitivity. The envelope sensitivity was two-fold that obtained by the reference single interferometer. the FSR for the envelope and carrier was 18 nm and 0.07 nm, respectively. Therefore, the M-factor is 257, Msens = 360, MFSR = 257, MVernier = 1.4.
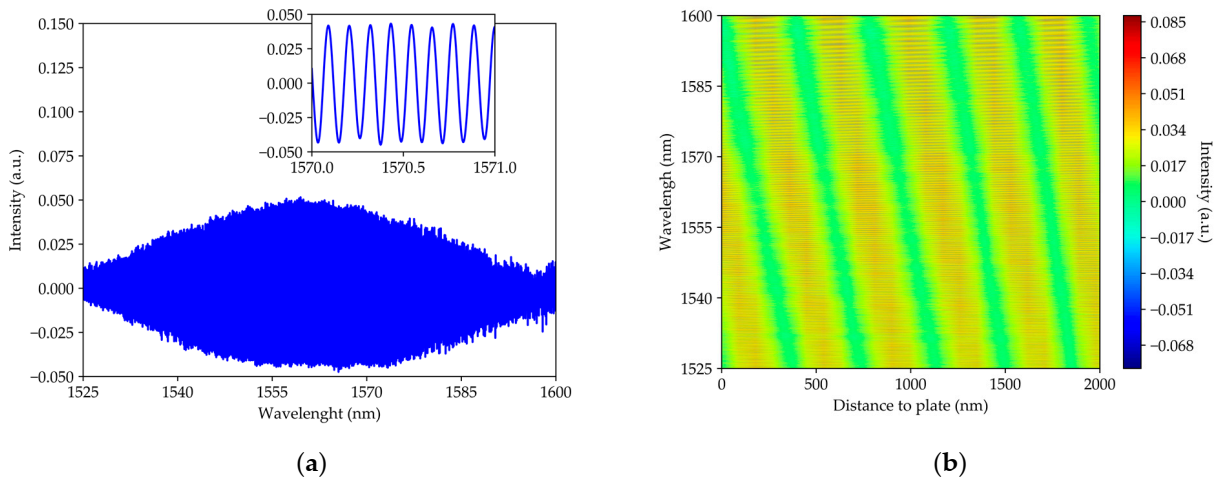
The last characterization was to optimize the proposed setup in order to obtain the maximum sensitivity of this configuration. In this case, we used two interferometers with a length of 6.1 ± 0.2 mm each and by reducing the difference between the two interferometers, an envelope with only one fringe was achieved, as depicted in Figure 7. The sensitivity obtained was 254 ± 6 nm/μm with an r2 of 0.9990 (which is shown in Figure 8) for the envelope, and 0.160 ± 0.005 nm/μm with a r2 of 0.992 for the carrier. Also, the FSR for the envelope and the carrier was 75 nm 0.09 nm respectively. Therefore, the M-factor was 1071, Msens = 1587, MFSR = 833, MVernier = 1.9. Table 1 summarizes all the values.
4. Discussion
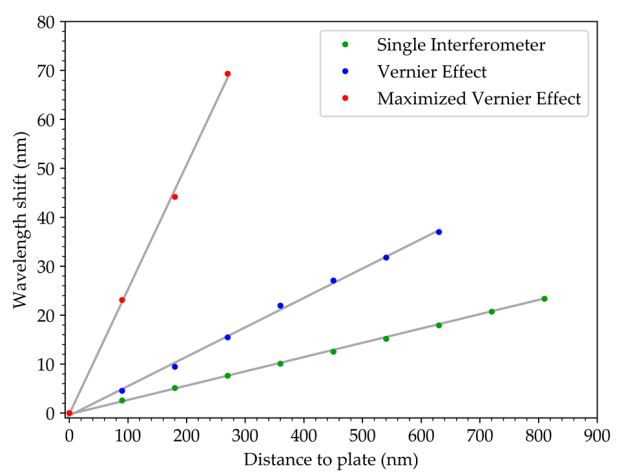
Figure 8 presents the comparison of the different sensitivities obtained in each case. As can be seen, the displacement sensitivity of the two interferometers with the Vernier effect (60 ± 1 nm/μm) is two-fold the one obtained with the single interferometer (29.2 ± 0.3 nm/ μm), with the same FSR. In addition, when the two interferometers are optimized, the maximum sensitivity obtained is 254 ± 6 nm/μm corresponding to an M-factor of 1071 and a MVernier of 1.9. Therefore, the sensor using the enhanced Vernier effect was more efficient than the traditional Vernier effect besides the fact that the maximum sensitivity obtained was 24 times higher than the SPR-based sensor for a micrometric range [13]. Furthermore, the Vernier effect allows a sensor whose implementation is easier to be obtained because the performance depends on the relation between the interferometers and not on the specific length of each FPI. Thus, it is possible to develop giant sensitivities in ranges where the sensitivity of a single interferometer is low.
5. Conclusions
This research compares the sensitivity of a single FPI and the Vernier effect performed with two FPIs for the same number of fringes. The results reveal that the Vernier effect envelope, where 60 ± 1 nm/μm is achieved, has twice the sensitivity of the single FPI, 29.2 ± 0.3 nm/ μm. Moreover, with the optimization of the system, an envelope sensitivity of 254 ± 6 nm/μm with M-factor of 1071 and a MVernier of 1.9 was obtained and corresponded to a resolution of 79 pm (considering the spectral resolution of 0.02 nm). In addition, the sensitivity of the Vernier effect envelope depends only on the relationship between interferometers, which allows problems in the production of ultra-sensitive sensors to be overcome as well as the same sensitivity for any distance of the fibers to the reflecting surface to be observed. This new displacement sensor architecture allows the implementation of giant-sensitive non evasive measurements with high relevance in areas such as micro and nano manufacturing and biology.
Author Contributions
P.R. performed the experimental work, analyzed the data, and wrote the article; O.F. supervised and reviewed. All authors have read and agreed to the published version of the manuscript.
Funding
This work is financed by National Funds through the Portuguese funding agency, FCT—Fundação para a Ciência e a Tecnologia, within project UIDB/50014/2020.
Data Availability Statement
Data available on request due to restrictions privacy. The data presented in this study are available on request from the corresponding author. The data are not publicly available due to it is from the Barcelona supercomputer.
Acknowledgments
Paulo Robalinho acknowledges the support of the Foundation for Science and Technology (FCT), Portugal through the Grant 2020.04562.BD.
Conflicts of Interest
The authors declare no conflict of interest
References
- Kapany, N. Fiber optics. Sci. Am. 1960, 203, 72–81. [Google Scholar] [CrossRef]
- M-Hernández, M.E.; Goicoechea, J.; Arregui, F.J. Hg2+ Optical Fiber Sensor Based on LSPR Generated by Gold Nanoparticles Embedded in LBL Nano-Assembled Coatings. Sensors 2019, 19, 4906. [Google Scholar] [CrossRef] [PubMed] [Green Version]
- Maciak, E. Low-Coherence Interferometric Fiber Optic Sensor for Humidity Monitoring Based on Nafion® Thin Film. Sensors 2019, 19, 629. [Google Scholar] [CrossRef] [PubMed] [Green Version]
- Alayli, Y.; Topçu, S.; Wang, D.; Dib, R.; Chassagne, L. Applications of a high accuracy optical fiber displacement sensor to vibrometry and profilometry. Sens. Actuators A Phys. 2004, 116, 85–90. [Google Scholar] [CrossRef]
- Tabassum, S.; Wang, Y.; Qu, J.; Wang, Q.; Oren, S.; Weber, R.J.; Lu, M.; Kumar, R.; Dong, L. Patterning of Nanophotonic Structures at Optical Fiber Tip for Refractive Index Sensing. In Proceedings of the 2016 IEEE SENSORS, Orlando, FL, USA, 30 October–3 November 2016; p. 16597373. [Google Scholar] [CrossRef]
- Costa, G.K.B.; Gouvêa, P.M.P.; Soares, L.M.B.; Pereira, J.M.B.; Favero, F.; Braga, A.M.B.; Palffy-Muhoray, P.; Bruno, A.C.; Carvalho, I.C.S. In-fiber Fabry-Perot interferometer for strain and magnetic field sensing. Opt. Express 2016, 24, 14690–14696. [Google Scholar] [CrossRef] [PubMed]
- Hu, T.; Zhao, Y.; Song, A.-N. Fiber optic SPR sensor for refractive index and temperature measurement based on MMF-FBG-MMF structure. Sens. Actuators B Chem. 2016, 237, 521–525. [Google Scholar] [CrossRef]
- Yao, T.; Pu, S.; Zhao, Y.; Li, Y. Ultrasensitive refractive index sensor based on parallel-connected dual Fabry-Perot interferometers with Vernier effect. Sens. Actuators A Phys. 2019, 290, 14–19. [Google Scholar] [CrossRef]
- Liang, L.; Li, M.; Liu, N.; Sun, H.; Rong, Q.; Hu, M. A high-sensitivity optical fiber relative humidity sensor based on microsphere WGM resonator. Opt. Fiber Technol. 2018, 45, 415–418. [Google Scholar] [CrossRef]
- Zhang, X.; Ren, L.; Wu, X.; Li, H.; Liu, L.; Xu, L. Coupled optofluidic ring laser for ultrahigh-sensitive sensing. Opt. Express 2011, 19, 22242–22247. [Google Scholar] [CrossRef] [PubMed]
- Liu, Y.; Li, X.; Zhang, Y.-N.; Zhao, Y. Fiber-optic sensors based on Vernier effect. Measurement 2021, 167, 108451. [Google Scholar] [CrossRef]
- Chen, J.; Zhou, J.; Yuan, X. M–Z Interferometer Constructed by Two S-Bend Fibers for Displacement and Force Measurements. IEEE Photonics Technol. Lett. 2014, 26, 837–840. [Google Scholar] [CrossRef]
- Zhu, Z.; Liu, L.; Liu, Z.; Zhang, Y.; Zhang, Y. High-precision micro-displacement optical-fiber sensor based on surface plasmon resonance. Opt. Lett. 2017, 42, 10. [Google Scholar] [CrossRef] [PubMed]
- Wang, X.-M.; Zhao, C.-L.; Wang, Y.-R.; Shen, C.-Y.; Dong, X.-Y. A Highly Sensitive Fibre-Optic Nano-Displacement Sensor Based on Surface Plasmon Resonance. J. Light. Technol. 2016, 34, 2324–2330. [Google Scholar] [CrossRef]
- Robalinho, P.; Gomes, A.D.; Frazão, O. Colossal enhancement of strain sensitivity using the push-pull deformation method. IEEE Sens. J. 2020, 1. [Google Scholar] [CrossRef]
- Gomes, A.D.; Ferreira, M.S.; Bierlich, J.; Kobelke, J.; Rothhardt, M.; Bartel, H.; Frazão, O. Optical Harmonic Vernier Effect: A New Tool for High Performance Interferometric Fiber Sensors. Sensor 2019, 19, 5431. [Google Scholar] [CrossRef] [PubMed] [Green Version]
- Li, J.; Zhang, M.; Wan, M.; Lin, C.; Huang, S.; Liu, C.; He, Q.; Qiu, X.; Fang, X. Ultrasensitive refractive index sensor based on enhanced Vernier effect through cascaded fiber core-offset pairs. Opt. Express 2020, 28, 4145–4155. [Google Scholar] [CrossRef] [PubMed]
- Robalinho, P.; Gomes, A.; Frazão, O. High Enhancement Strain Sensor Based on Vernier Effect Using 2-Fiber Loop Mirrors. IEEE Photonics Technol. Lett. 2020, 32, 1139–1142. [Google Scholar] [CrossRef]
Figure 1.
Sensor architecture concept.

Figure 2.
Vernier effect simulation.

Figure 3.
Experimental setup: (a) scheme, (b) picture, and (c) fibers cleavage angle obtained with “Sumitomo Electric—Type-72C”.
Figure 3.
Experimental setup: (a) scheme, (b) picture, and (c) fibers cleavage angle obtained with “Sumitomo Electric—Type-72C”.

Figure 4.
The single interferometer with a length of 73 ± 2 μm: (a) Spectrum at the beginning of measurements and (b) intensity as a function of the distance between the optical fiber and the reflecting surface and as a function of wavelength.
Figure 4.
The single interferometer with a length of 73 ± 2 μm: (a) Spectrum at the beginning of measurements and (b) intensity as a function of the distance between the optical fiber and the reflecting surface and as a function of wavelength.

Figure 5.
The single interferometer with a length of 15.4 ± 0.5 mm: (a) spectrum at the beginning of measurements and (b) intensity as a function of the distance between the optical fiber and the reflecting surface and as a function of wavelength.
Figure 5.
The single interferometer with a length of 15.4 ± 0.5 mm: (a) spectrum at the beginning of measurements and (b) intensity as a function of the distance between the optical fiber and the reflecting surface and as a function of wavelength.

Figure 6.
The two interferometers with a length of 15.4 ± 0.5 mm: (a) spectrum at the beginning of measurements and (b) intensity as a function of the distance between the optical fiber and the reflecting surface and as a function of wavelength.
Figure 6.
The two interferometers with a length of 15.4 ± 0.5 mm: (a) spectrum at the beginning of measurements and (b) intensity as a function of the distance between the optical fiber and the reflecting surface and as a function of wavelength.

Figure 7.
The two interferometers with a length of 6.1 ± 0.2 mm: (a) spectrum at the beginning of measurements, and (b) intensity as a function of distance to the reflecting surface and as a function of wavelength.
Figure 7.
The two interferometers with a length of 6.1 ± 0.2 mm: (a) spectrum at the beginning of measurements, and (b) intensity as a function of distance to the reflecting surface and as a function of wavelength.

Figure 8.
Wavelength shift for a single interferometer, the Vernier effect compared to single interferometer and the Vernier effect maximized. The error bars associated with each value are the same dimension as the geometry of the point that represents it.
Figure 8.
Wavelength shift for a single interferometer, the Vernier effect compared to single interferometer and the Vernier effect maximized. The error bars associated with each value are the same dimension as the geometry of the point that represents it.


Table 1.
Parameters values that characterize the implementation of the enhanced Vernier effect maximized.
Table 1.
Parameters values that characterize the implementation of the enhanced Vernier effect maximized.
| Sensitivity | r2 | FSR | |
|---|---|---|---|
| Envelope | 254 ± 6 nm/μm | 0.9990 | 75 nm |
| Carrier | 0.160 ± 0.005 nm/μm | 0.992 | 0.09 nm |
| M-factor | Msens | MFSR | MVernier |
| 1071 | 1587 | 833 | 1.9 |
Publisher’s Note: MDPI stays neutral with regard to jurisdictional claims in published maps and institutional affiliations. |
© 2021 by the authors. Licensee MDPI, Basel, Switzerland. This article is an open access article distributed under the terms and conditions of the Creative Commons Attribution (CC BY) license (http://creativecommons.org/licenses/by/4.0/).
Share and Cite
MDPI and ACS Style
Robalinho, P.; Frazão, O. Giant Displacement Sensitivity Using Push-Pull Method in Interferometry. Photonics 2021, 8, 23. https://0-doi-org.brum.beds.ac.uk/10.3390/photonics8010023
AMA Style
Robalinho P, Frazão O. Giant Displacement Sensitivity Using Push-Pull Method in Interferometry. Photonics. 2021; 8(1):23. https://0-doi-org.brum.beds.ac.uk/10.3390/photonics8010023
Chicago/Turabian StyleRobalinho, Paulo, and Orlando Frazão. 2021. "Giant Displacement Sensitivity Using Push-Pull Method in Interferometry" Photonics 8, no. 1: 23. https://0-doi-org.brum.beds.ac.uk/10.3390/photonics8010023
Note that from the first issue of 2016, this journal uses article numbers instead of page numbers. See further details here.