Article

Thermally Stimulated Desorption Optical Fiber-Based Interrogation System: An Analysis of Graphene Oxide Layers’ Stability

1
CEFITEC, Department of Physics, NOVA School of Science and Technology, NOVA University Lisbon, 2829-516 Caparica, Portugal
2
INESC TEC—Institute for Systems and Computer Engineering, Technology and Science, Rua do Campo Alegre 687, 4169-007 Porto, Portugal
*
Author to whom correspondence should be addressed.
Submission received: 2 February 2021 / Revised: 22 February 2021 / Accepted: 24 February 2021 / Published: 4 March 2021
(This article belongs to the Special Issue Photonics, Optics and Laser Technology)

Abstract

:
Thin graphene oxide (GO) film layers are being widely used as sensing layers in different types of electrical and optical sensor devices. GO layers are particularly popular because of their tuned interface reflectivity. The stability of GO layers is fundamental for sensor device reliability, particularly in complex aqueous environments such as wastewater. In this work, the stability of GO layers in layer-by-layer (LbL) films of polyethyleneimine (PEI) and GO was investigated. The results led to the following conclusions: PEI/GO films grow linearly with the number of bilayers as long as the adsorption time is kept constant; the adsorption kinetics of a GO layer follow the behavior of the adsorption of polyelectrolytes; and the interaction associated with the growth of these films is of the ionic type since the desorption activation energy has a value of 119 ± 17 kJ/mol. Therefore, it is possible to conclude that PEI/GO films are suitable for application in optical fiber sensor devices; most importantly, an optical fiber-based interrogation setup can easily be adapted to investigate in situ desorption via a thermally stimulated process. In addition, it is possible to draw inferences about film stability in solution in a fast, reliable way when compared with the traditional ones.

Graphical Abstract

1. Introduction

Optical fiber-based sensors [1,2,3,4,5,6,7] ordinarily have fiber interfaces coated with different materials, namely organic materials or even functionalization with biologic molecules to enhance sensing features. This issue is of relevance for sensing traces of a component in complex media, for example when sensing in a complex liquid medium such as wastewater [8,9,10]. Another relevant aspect to consider for the sake of sensor device reliability is the stability of the coated layers in liquid media, because they might desorb from the fiber interface. A way to assess molecular layer stability is via the so-called thermally stimulated desorption (TSD) technique [11], which has been developed to extract desorption energy parameters related to interactions among molecules used in the preparation of the molecular layers. This method has been applied, for example, to films prepared by the layer-by-layer (LbL) technique [12], in which interactions among molecules are governed by physical interactions. The TSD technique consists of placing the film onto a solid support in a solution, and the temperature is increased at a constant rate while some parameters related to the adsorbed amount are monitored, such as weight or absorbance. With this, one expects the thin film’s molecules to overcome a potential barrier at some point and to desorb, with characteristic dynamics described by an Arrhenius-type equation. As the temperature rises, the molecules deposited onto a solid support are usually measured by spectrophotometry or a quartz crystal microbalance. However, conventional spectrophotometry is not easy to adapt for in situ measurements, and a quartz crystal microbalance is limited by crystal thermal coefficients. This means that other experimental methods should be addressed, such as carrying out desorption measurements over optical fibers that have molecular layers previously adsorbed at each end or measuring light signals reflected through the fiber in an interrogation-like optical setup. This procedure allows in situ measurement of both adsorbed and desorbed amounts.
In recent years, optical fiber devices have been widely explored in the literature for hydrostatic pressure [13], lateral load [14], and strain [15,16] sensing. They have, therefore, general application as optical sensing devices; however, thin graphene oxide (GO) [17,18,19,20,21] films have gained acceptance in the development of several devices [22,23,24,25,26,27,28,29,30,31] and sensors [32,33,34,35,36,37,38,39,40]. Recently, it has been demonstrated that hollow microsphere fiber-based sensors, conforming to Fabry–Perot interferometers (FPI), can be used in sensing applications [41] by using GO as a tunable platform to enhance the spectral features of hollow microsphere FPI fiber sensor devices. This study revealed a change to the microsphere outer surface reflectivity that allowed the visibility of the reflected spectrum to be tuned by varying the number of GO layers. This allows the enhancement of the desired features of the three-wave FPI for different sensing applications. In addition, it has been suggested that this fiber-optic sensor can easily be applied to investigate in situ desorption simply by depositing the thin molecular film onto the optical fiber sensing interface and observing the device’s optical response as the solution temperature is linearly increased.
In this work, this concept was used to investigate the stability of thin GO films in aqueous media. They were obtained by the layer-by-layer (LbL) technique together with polyethylenimine (PEI), ((PEI/GO)n), where n represents the number of bilayers. Film stability was assessed in situ by measuring the optical response of hollow microsphere-ended optical fibers covered with PEI/GO layers over time and temperature change. To better evaluate the results, the growth and desorption of thin (PEI/GO)n films adsorbed onto quartz solid supports was also characterized using common spectrophotometric measurements under different conditions. The motivation for the use of GO LbL films to demonstrate the concept that optical fiber devices can be applied to carry out a TSD technique lies in the fact that these films have been successfully used as sensing layers for different kinds of chemical sensors (e.g., for detection of triclosan in water [40] and wastewater [42]) by making use of the electronic tongue concept. In these studies, it was shown that the stability of the thin GO films is strongly influenced by wastewater matrices pH [42]. Further desorption studies carried out on GO layer stability revealed that the layers are more stable at higher pH solutions when the adsorption time for each layer is short [43]. As such, systematic results for both the adsorption and desorption of PEI/GO thin films will be also presented in this work. Emphasis is given to in situ desorption, with temperature increase at a constant rate. Furthermore, the possibility of using GO layers as an active coating material is investigated with the intent of tuning optical features towards the improvement of the optical response of fiber-optic GO-based sensors.

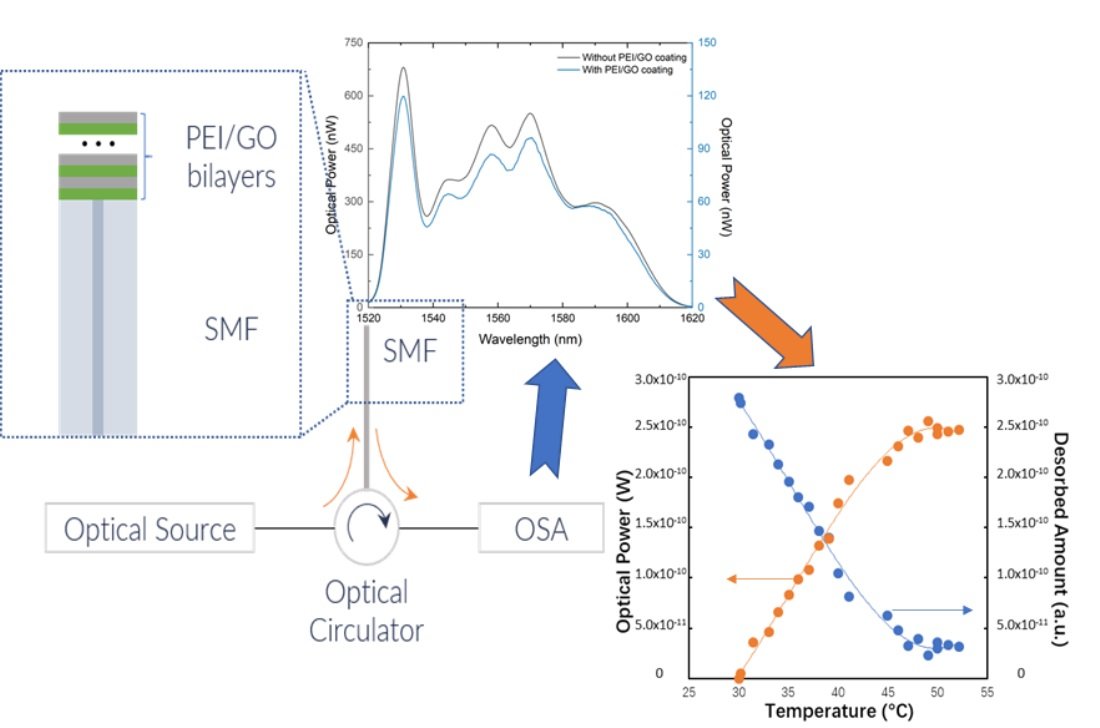
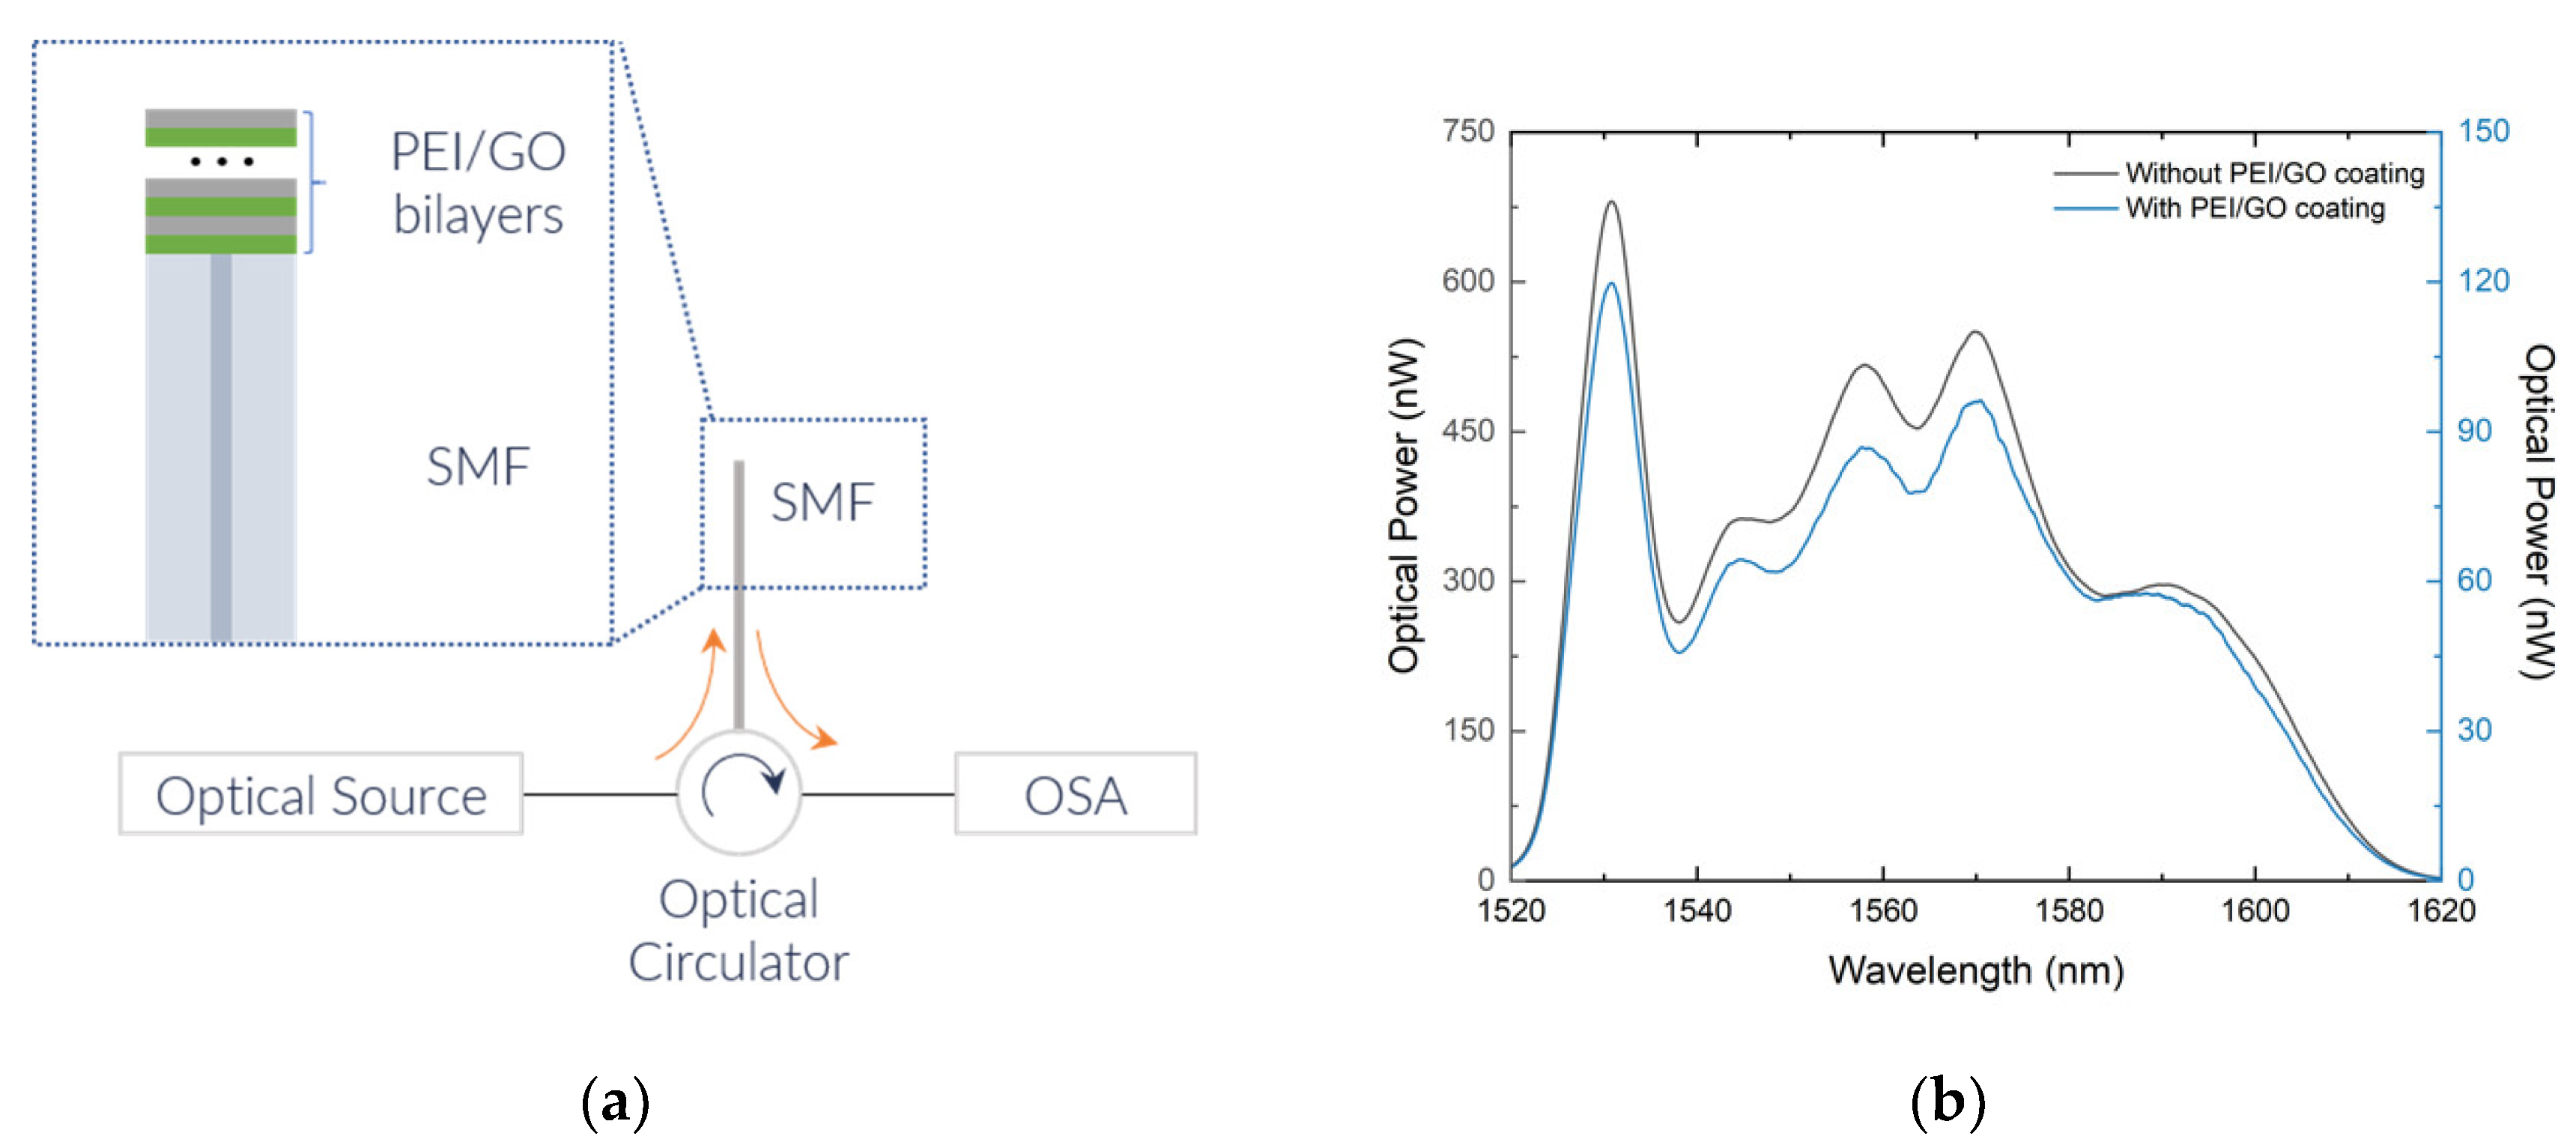
2. Materials and Methods

Thin films were prepared by the LbL technique [13,29] using polyelectrolyte polyethyleneimine (PEI) and graphene oxide (GO). These compounds came from Sigma-Aldrich (St Louis, MO, USA). The LbL films were adsorbed onto quartz supports and onto fused silica optical fibers by adsorbing alternate layers of PEI and GO at a solid/liquid interface. PEI aqueous solutions with a monomeric concentration of 2 × 10⁻² M and GO solution with a concentration of 2 mg/mL were prepared by diluting these compounds in ultrapure water produced by a Millipore system (Bedford, MA, USA). After the adsorption of each layer, the solid support was rinsed with ultrapure water to remove any molecules that were not completely adsorbed. After rinsing the solid support, the thin film was dried using a low flux of nitrogen gas. Film growth was studied by coating quartz substrates with PEI/GO films prepared with a different number of bilayers and with different adsorption times, with values equal to 5, 15, 30, 60 and 300 s. To analyze the effect of pH on PEI/GO LbL films prepared with 12 bilayers, (PEI/GO)12, they were immersed in aqueous solutions with different pH to characterize the desorption as a function of time. The adsorbed/desorbed amounts were characterized by ultraviolet spectroscopy using a double-beam spectrophotometer UV-2101PC (Shimadzu, Tokyo, Japan).
Twelve bilayers of PEI/GO LbL films, (PEI/GO)12, were deposited on the cross sections of cleaved single-mode optical fibers (SMF). To study film desorption, the PEI/GO-coated fibers were placed in a thermostatic bath and the temperature was increased at a constant rate. The reflected optical power measurements were performed using the interrogation system schematized in Figure 1a. The optical power source used in the interrogation system was a broadband spectrum optical source centered at 1570 nm with 100 nm bandwidth. Upon reaching the end of the fiber, where the PEI/GO LBL film was deposited, this signal was reflected, returned to the optical circulator, and measured by the optical spectrum analyzer (OSA; Yokogawa AQ6370D) [38]. Figure 1b shows the reflected optical spectrum of a (PEI/GO)12 thin film coating the optical fiber. The reflected spectrum from a cleaved optical fiber with no coating was added for comparison.

3. Results

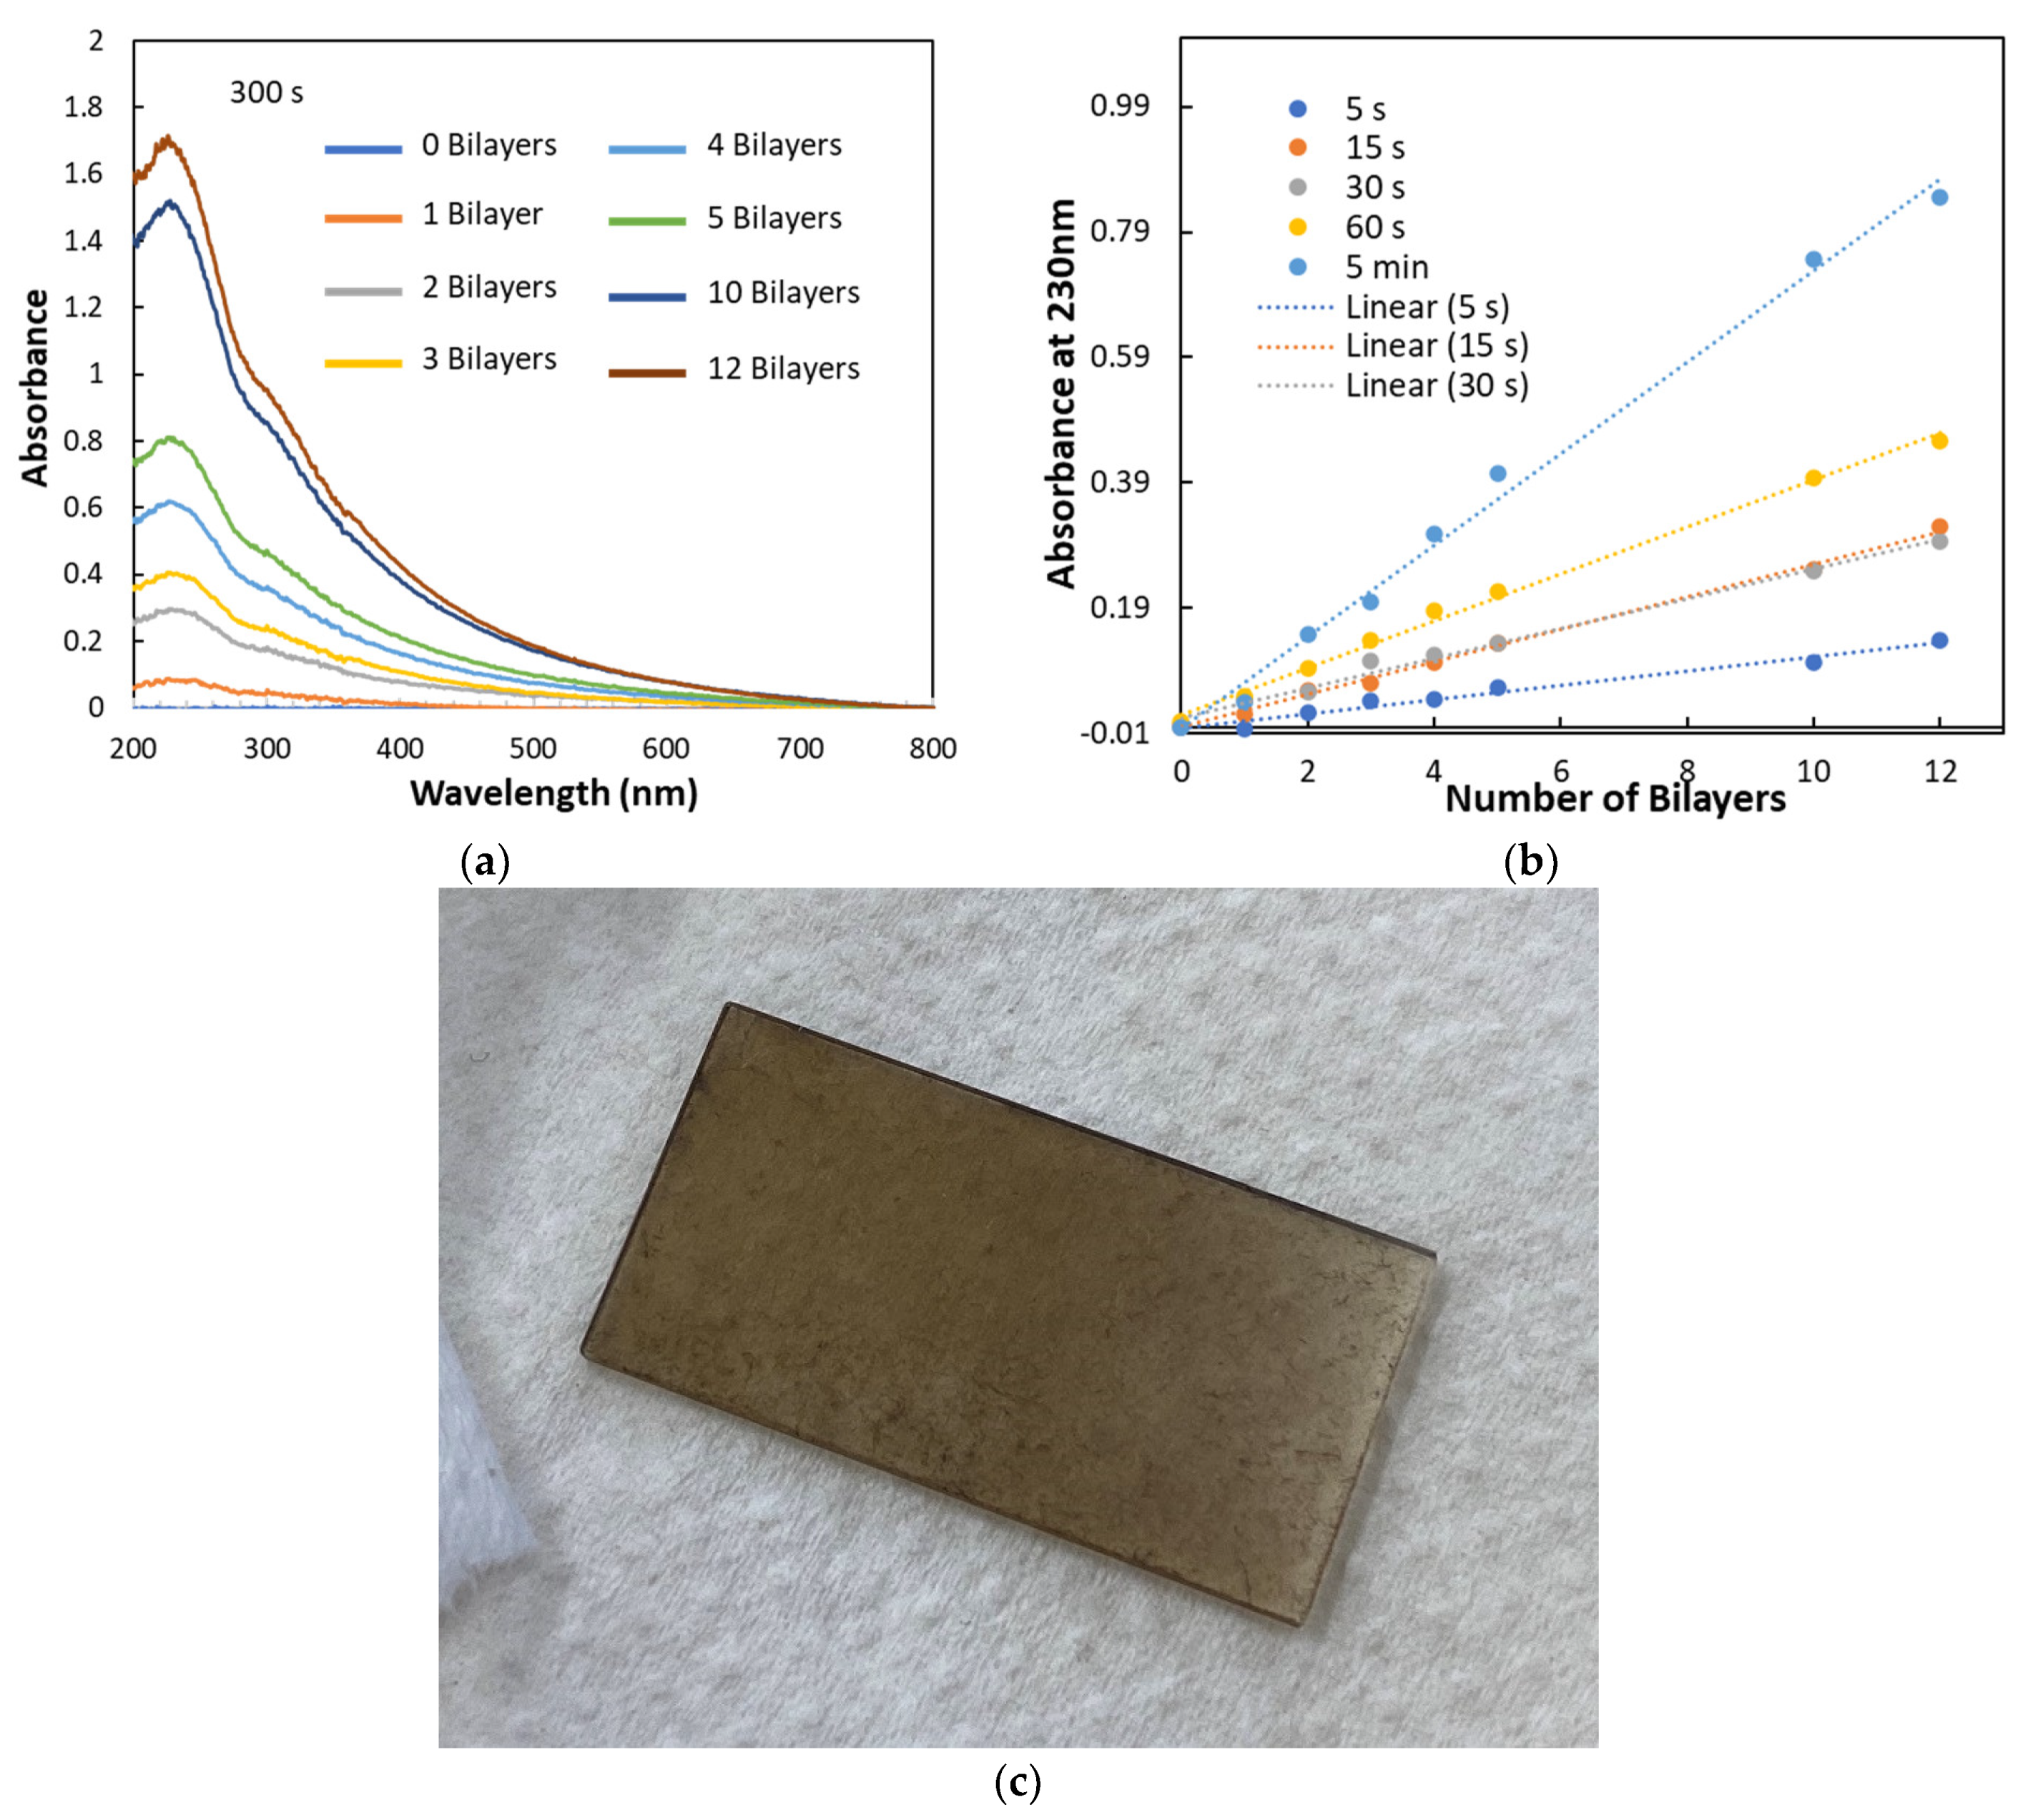
3.1. Buildup of PEI/GO LbL Films

The reflectivity measurements allowed the observation of a linear growth of PEI/GO LbL thin films with the number of bilayers, in films deposited onto cleaved or hollow microspheres optical fiber ends [38]. To analyze the growth of PEI/GO LbL films onto quartz solid supports by spectrophotometry, thin films were prepared with different numbers of bilayers and with different adsorption time periods, namely 5, 15, 30, 60 and 300 s. The films’ UV–VIS spectra were measured after the adsorption of each bilayer. As an example, Figure 2a shows the obtained spectra for films with different numbers of deposited bilayers with an adsorption time of 300 s. Similar spectra, not shown here, but with lower absorbance values, were achieved for lower adsorption times. The obtained spectra presented electronic bands at 230, 247 and 299 nm that are associated with π–π* transitions of the aromatic ring (phenol) and with the n–π* transition of the group carboxylic acid, with transitions of π-–π* type of the benzene aromatic ring and with n–π* transitions of the carbonyl group [44]. When the maximum absorbance values, achieved at the wavelength of 230 nm, are plotted as a function of the number of bilayers and for constant adsorption time, one can discern that PEI/GO films grew linearly with the number of bilayers (see Figure 2b), being in accordance with the behavior of PEI/GO bilayers deposited onto cleaved or hollow microspheres’ optical fiber ends [38]. Slopes of the fitted straight line reveal that the adsorbed amount per unit of area and per bilayer increased with adsorption time up to a constant value, thus allowing us to calculate the GO adsorption kinetics curve, which will be described in the next section. Figure 2c shows a photo of a (PEI/GO)12 LbL film prepared with an adsorption time of 60 s.

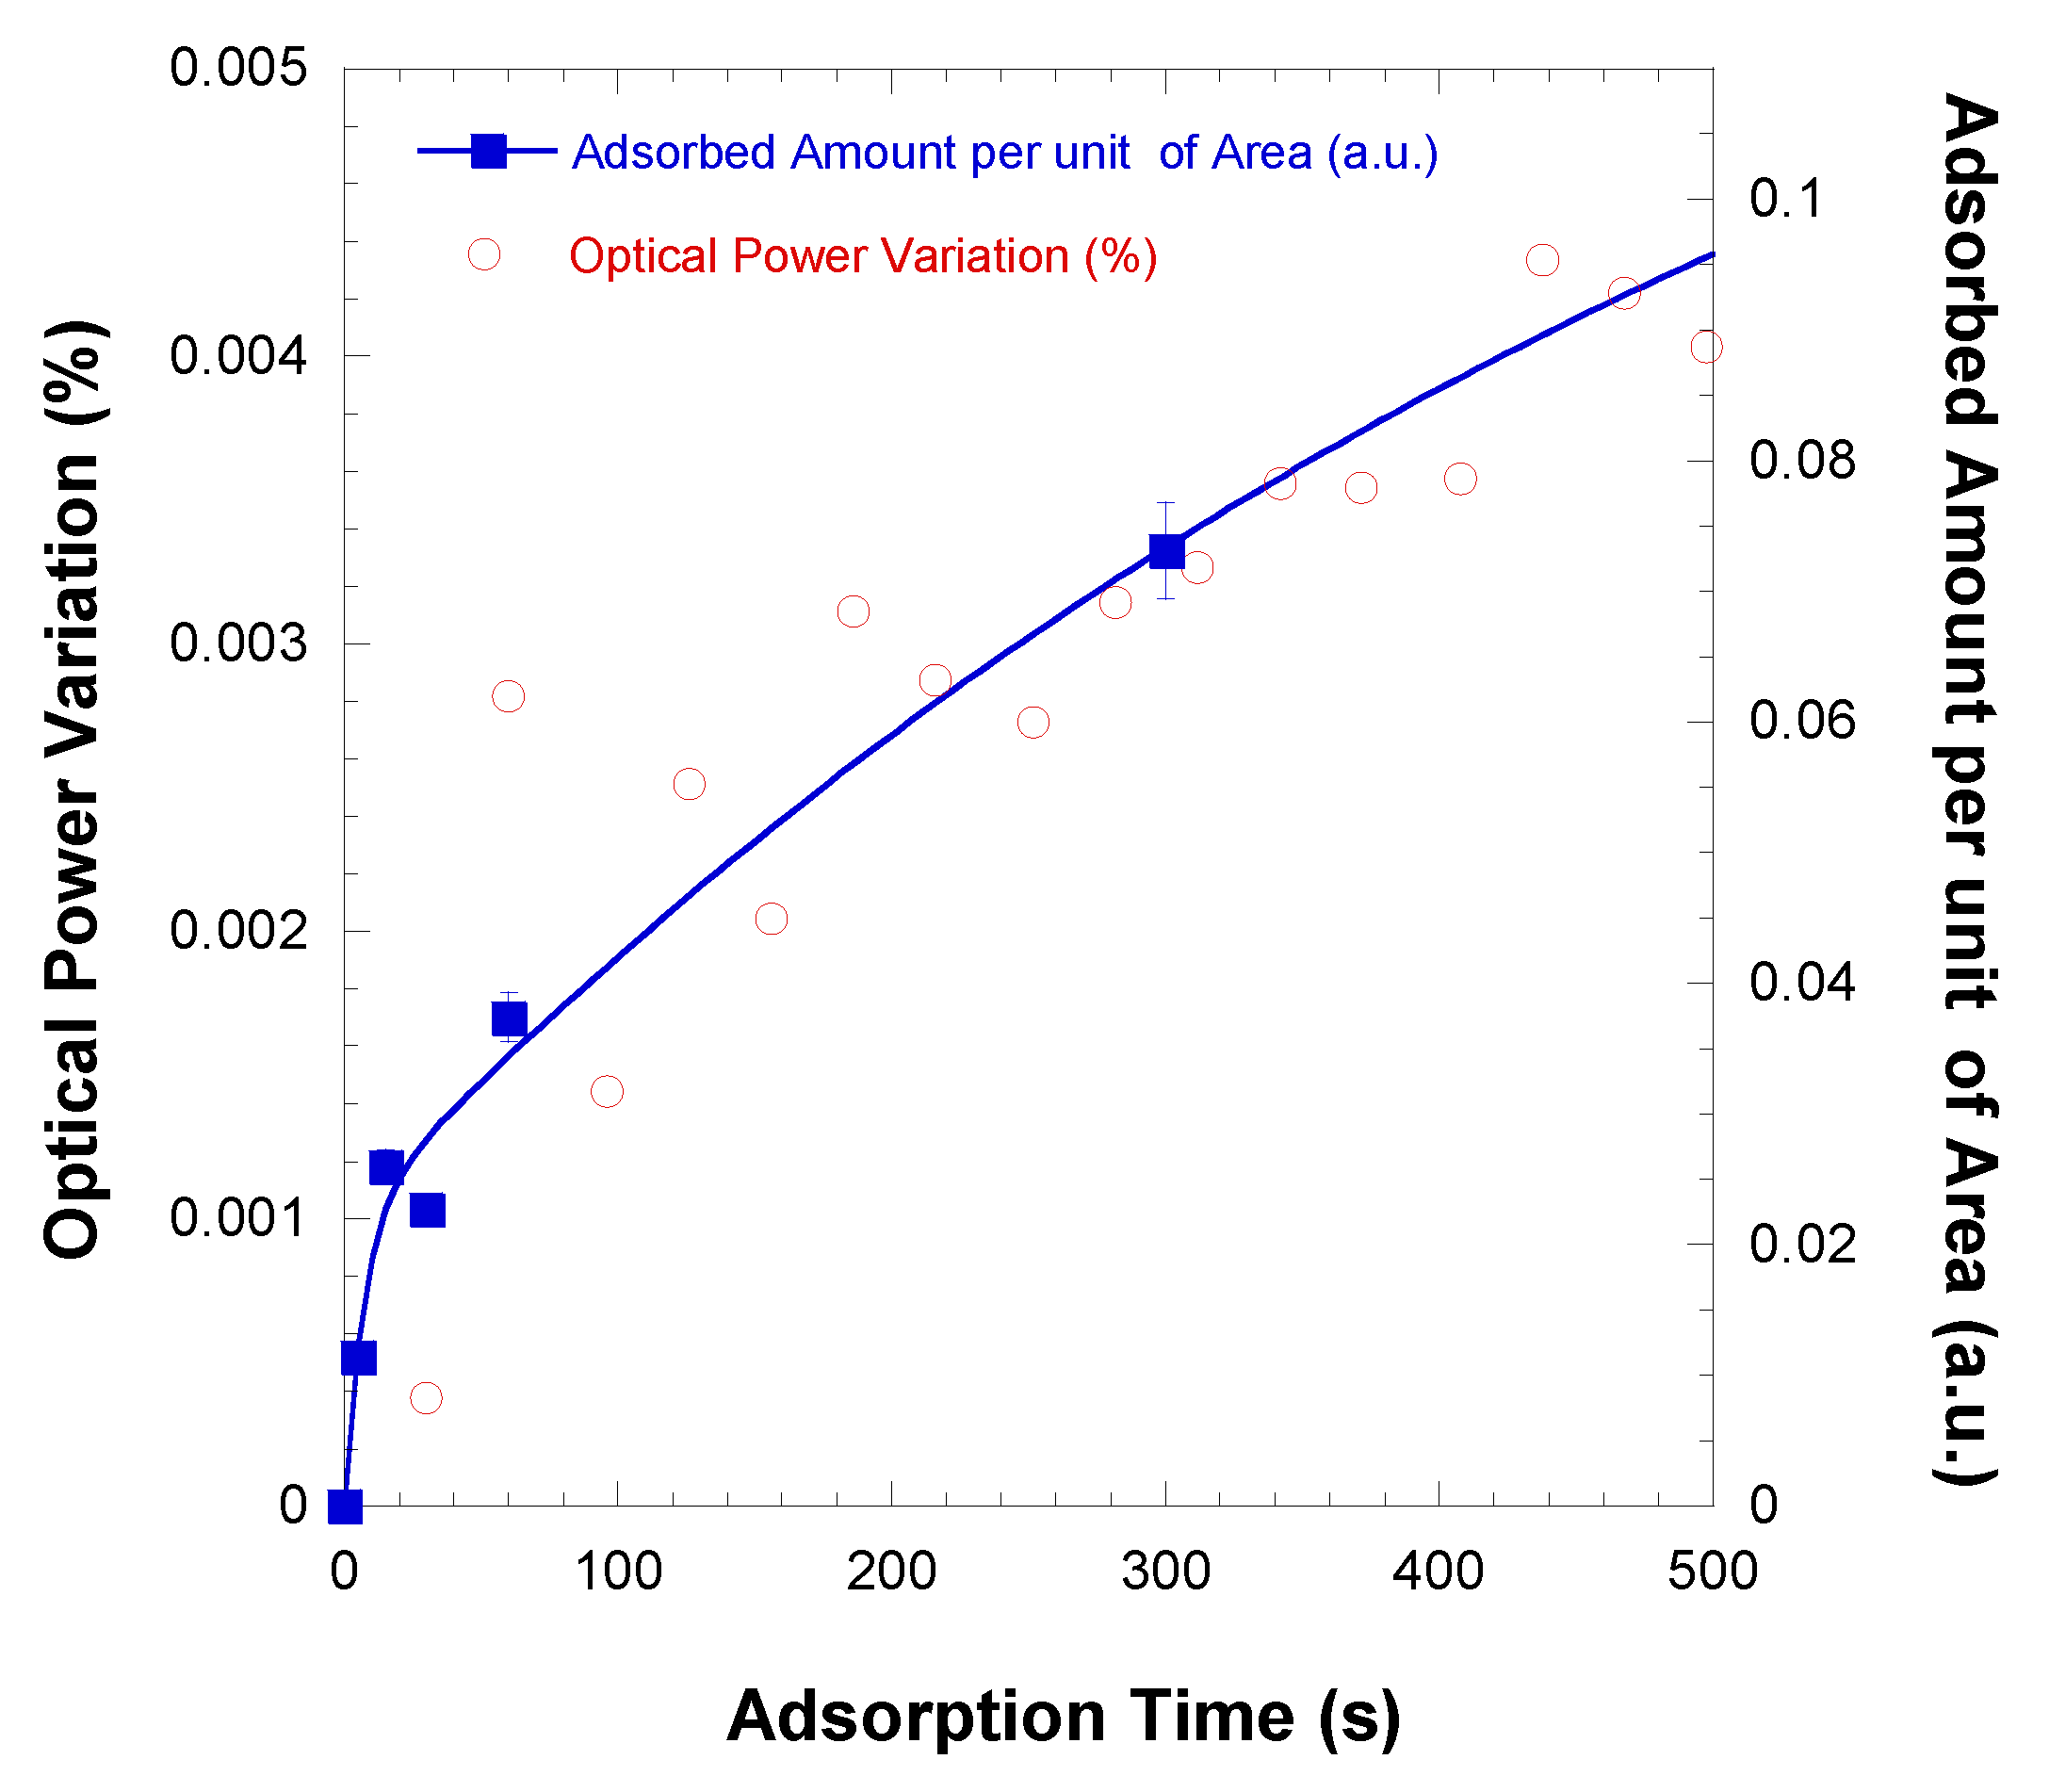
3.2. GO Adsorption Kinetics

As recently demonstrated [38], reflectivity measurements enabled the in situ adsorption kinetics curve of a GO layer on a (PEI/GO)n/PEI thin film to be determined, demonstrating that the GO adsorption follows an exponential curve with a characteristic adsorption time of 600 ± 30 s, not revealing the common behavior of polyelectrolytes where the kinetics curves follow two mechanisms. However, at short adsorption times, i.e., at the initial stages of adsorption, the curves present some noise. To confirm the results reported in the literature and to go further in understanding the adsorption/desorption processes of GO molecules onto positively charged surfaces, spectrophotometric measurements were carried out to obtain the amounts of adsorbed GO per unit of area during different adsorption processes. As the spectrophotometric measurements are relatively time-consuming, as it is necessary to measure the film spectra for each bilayer and the reflectance measurements present a high error bar at the beginning of the kinetics curve, only short adsorption periods of time were considered for the preparation of the thin films. The GO adsorption kinetics curve obtained from spectrophotometric measurements can be constructed by plotting the fitted slopes of the straight lines in Figure 2b versus the adsorption time. This method of obtaining adsorption kinetics curves was developed by Raposo and Oliveira [45] and has an advantage over the traditional method, in which the adsorbed amount is measured with the adsorption time. In the latter case, the adsorption kinetics curve is not true since the balance of molecules that are being adsorbed is being interrupted to make measurements of the UV–VIS spectra. Thus, when representing the slope of the growth curves of LbL films, the adsorption process of each layer is interrupted only once, not contributing to false measurements of adsorbed quantities [45,46]. Figure 3 shows the GO adsorption kinetics curve obtained by representing both the slopes of the straight lines in Figure 2b and the optical power variation as a function of adsorption time. In a first analysis, the kinetics curves obtained in Figure 3 seem to show a growth behavior in which the amount adsorbed increases to a constant value. However, when carefully analyzing the growth of an adsorbed layer in these films, it appears that the kinetic curve of adsorption of a polyelectrolyte layer appears to have two plateaus. The plotted points reveal that the adsorbed amount per unit of area and per bilayer increases with adsorption time up to a constant value for an adsorption time of about 10–15 s and then grows again until it reaches a plateau. This indicates that the adsorption kinetics curve of GO on PEI layers at shorter adsorption times presents a first short characteristic time associated with a nucleation process, followed by a second adsorption process associated with diffusion process as in accordance with the adsorption of polyelectrolyte molecules on solid supports [45], and also as observed in situ during the adsorption of GO onto optical fibers measured by reflectance [41]. The comparison of both types of kinetics curves allow to conclude that, although the optical fibers present some error at the beginning of the kinetics curves, the achieved results for longer times are reliable.
The plotted points of adsorbed amount obtained from the spectrophotometric data shown in Figure 3 are in accordance with the kinetics curves of the adsorption of polyelectrolyte molecules obtained by the same method of preparation, as demonstrated by Raposo et al. [45]. In fact, the polyelectrolyte adsorption kinetics curve shows a behavior that can be explained by the following equation:
Γ = Γ n ( 1 exp ( t τ n ) ) + Γ d ( 1 exp ( ( t τ d ) n J M A ) )
where Γ corresponds to the amount adsorbed per unit area; Γ n and Γ d are constants that represent the maximum amounts adsorbed during each process; τ n and τ d are the characteristic times of the nucleation and diffusion processes, respectively; and n J M A is the time exponent variable, a value that relates to the type of adsorption that occurs in the film. This equation appears to be adequate because the presence of these two levels is verified, suggesting that the kinetics of adsorption of polyelectrolytes on the solid support that is immersed in the polyelectrolyte solution is described by two different processes. It appears that in the first seconds of adsorption, the amounts adsorbed are linearly dependent on the concentration of polyelectrolyte in the solution and that this corresponds to the adsorption of molecules or aggregates of polyelectrolyte molecules that are close to the surface of the solid support when it is dipped. For this reason, this first process is called nucleation. The other slower process with longer characteristic times can be explained in terms of diffusion-like processes. As the polyelectrolyte molecules are adsorbed, their electrical charges, being of the same signal, the molecule of the same species that are in solution. However, the presence of counterions and/or co-ions reduces the ionic interaction between polyelectrolytes, allowing the adsorption of more polyelectrolyte molecules by a process controlled by diffusion.
To obtain the parameters of Equation (1) with so few experimental points, we started by using only the first points to determine the time constant characteristic of the nucleation process and make the fit only to the first term of Equation (1): Γ = Γ n ( 1 exp ( t τ n ) ) . Then, all points were used to determine the time constant of the diffusion process, using only the second term of Equation (1). All fitted values are listed in Table 1. The calculated characteristic time value, 70 ± 20 s, was very far from that obtained by reflectivity when the GO was adsorbed onto optical fibers, which was 10 min [41]. This difference was due to the low number of experimental values. Bearing in mind that most of the points were obtained for short adsorption times, it was decided to use the value calculated in [43], in conjunction with the characteristic nucleation time, 7 ± 3 s, to calculate the adsorbed quantities for each process. Using these values, it was possible to determine the maximum adsorbed amounts during each process, which are also listed in Table 1. Thus, we could conclude that the adsorption kinetics of GO molecules follow the adsorption behavior of polyelectrolytes, and therefore, that there are two processes in their adsorption. It should be noted that in the literature [41], the adsorption of GO is explained by only one process, but if one carefully analyzes the obtained curves, there is a small threshold for short adsorption times. The decrease of adsorption time also led to increased uniformity of the films as observed by optical microscopy (data not shown here), a result which is crucial for optical applications.

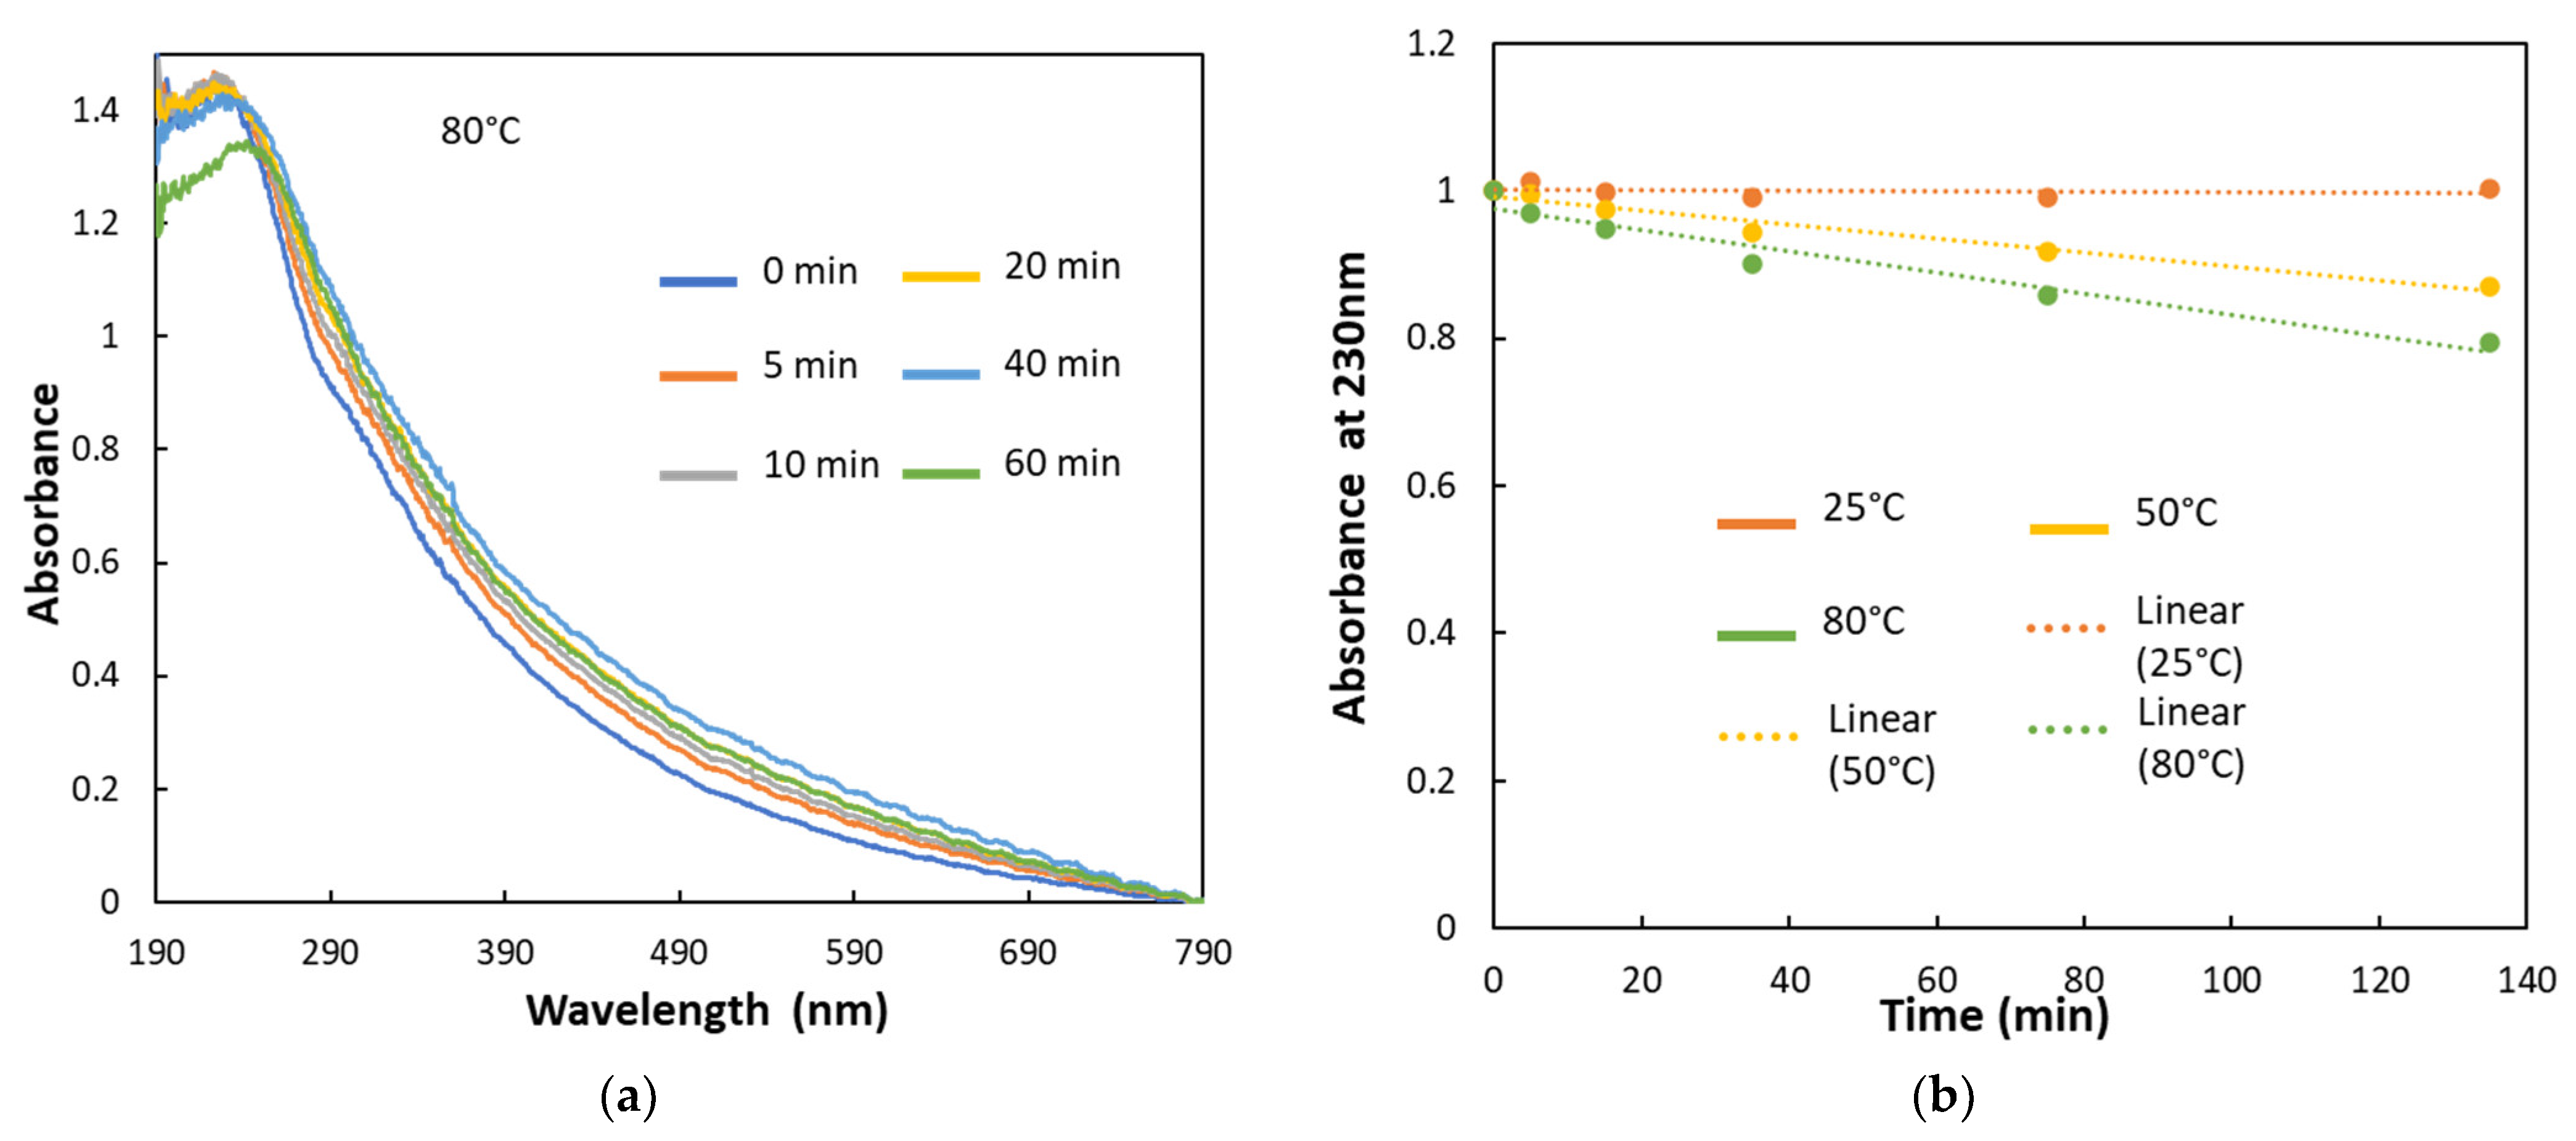
3.3. GO Desorption Kinetics

To study the effect of temperature on desorption of GO molecules from the PEI/GO LbL films, 12 bilayers films were prepared with an adsorption period of time of 60 s. These films were immersed in beakers with ultrapure water at temperatures of 25, 50 and 80 °C. The temperature control provided by a thermostatic bath. Only these temperatures values were chosen due to long characterization times. From time to time, the films were removed from the water and their UV–VIS spectra were measured. Figure 4a is an example of the evolution of the measured spectra with the immersion time when the film was immersed in ultrapure water at 80 °C. Similar curves with less difference between spectra were achieved for the other temperatures, but the respective spectra are not shown here. Instead of these spectra, Figure 4b presents a graph with the differences in absorbance values between 230 nm and 400 nm normalized to the value calculated at a desorption time of 0 s, plotted against time and the respective temperature of desorption. Although at 25 °C, the experimental points exhibit a small decay with the desorbed amount per unit area being almost null, the GO amount decreases linearly with the immersion time in the solutions at fixed temperature. The slopes of these curves plotted against the temperature reveal that as the temperature increases, the desorbed amount increases in a non-linear fashion. By analyzing the UV–visible spectra of Figure 4a, one can observe a shift of peak position to higher wavelengths, which is in accordance with the hydrothermal reduction of GO [47] and with the observed effect of PEI to act as a GO-reducing agent when both are placed at 80 °C [48]. Moreover, temperature influences both the GO reduction and GO desorption, even in the interlayer spacing between GO layers. Kim et al. [49], using experimental methods and density functional theory, demonstrated that multilayer graphene oxide produced by oxidizing epitaxial graphene is a metastable material at room temperature with a characteristic relaxation time of about one month. The authors also concluded that graphene oxide reaches a nearly stable reduced O/C ratio and exhibits a structure deprived of epoxide groups and enriched in hydroxyl groups. Therefore, the reduction of the GO with temperature and time justifies the loss of electrical charges with consequent decreased interaction between GO and PEI molecules.

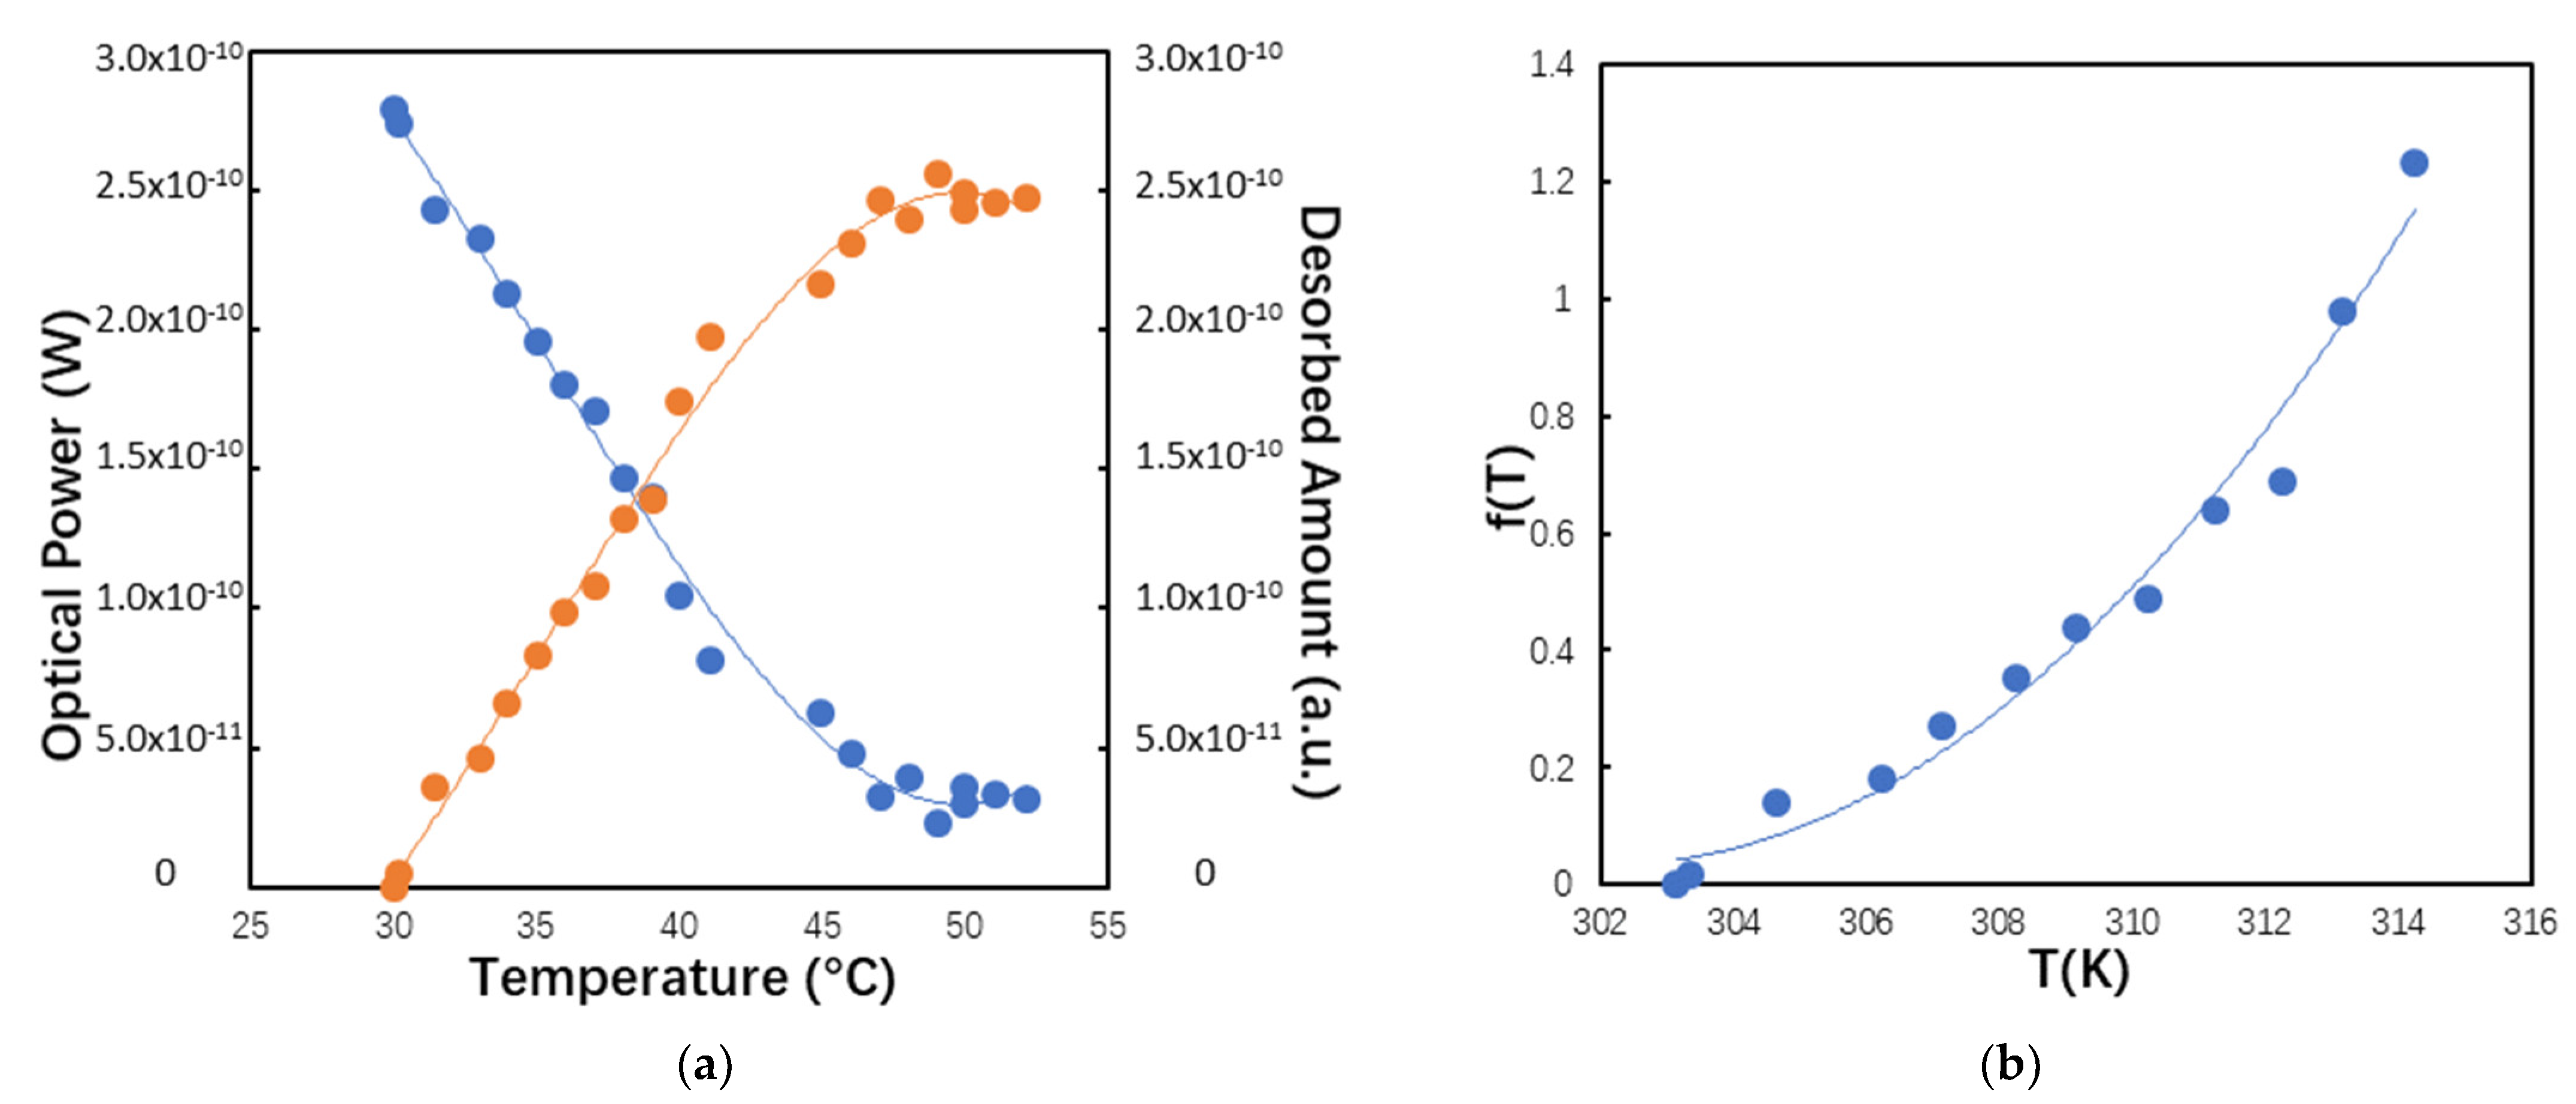
3.4. Thermostimulated Desorption of GO

The possibility of characterizing GO layer adsorption kinetics in situ from the measurement of reflectivity in optical fibers was recently demonstrated by Monteiro et al. [10]. The advantage of the in-situ measurement of very low amounts through reflectivity measurements, by means of an optical interrogation experimental configuration, suggests that a similar procedure could also be used to study in situ GO desorption. Thus, to complement the already obtained data from desorption kinetics of PEI/GO films in water as a function of immersion time presented in the previous subsection, similar desorption experiments were carried out in situ using the optical interrogation system presented in Figure 1. Thermostimulated desorption in solution, that is, at the solid–liquid interface, was first presented by Raposo and Oliveira [11], and it has been demonstrated that this technique allows to determine the interaction energies at play in the adsorption of polyelectrolytes. This information is not straightforward to attain from desorption kinetics curves obtained in the previous subsection. Thus, to address the in situ study of desorption kinetics in PEI/GO films in aqueous medium, (PEI/GO)12 films were deposited in cleaved single-mode optical fibers and their reflectance was monitored. The fibers were immersed in water, the temperature of which was linearly increased over time, and the reflectivity was measured as a function of the temperature in an in situ TSD-like procedure. The obtained results, shown in Figure 5a, revealed a consistent decrease in reflectivity with temperature, indicating that GO molecules were being desorbed from the cleaved fiber cross section. As reflectivity is proportional to the amount of GO molecules adsorbed onto the cleaved fiber surface, one can also sketch the curve for the desorbed amount per unit area as a function of temperature. Under these conditions, it is now possible to apply the Raposo and Oliveira procedure [11]. Taking into account that the adsorbed molecules need to overcome a potential barrier to be able to desorb, the characteristic time of the desorption can be described by an Arrhenius-like equation, τ ( T ) = t e E d e s R T , where t   denotes the reciprocal of the natural desorption frequency (vibrational frequency of the molecule–surface bond), E d e s is the desorption activation energy, R is a gas constant and T is the absolute temperature. The desorption process can then be described by the equation:
d Γ d e s d t = ( Γ i Γ d e s ) τ ( T )
where Γ d e s is the amount desorbed per area, Γ i is the initial amount adsorbed per area and t is the desorption time. Considering a constant heating rate, α = dT/dt, the activation energy for desorption can be obtained through the graph of ln ( d Γ d e s / d t ) as a function of 1 / T , which should be a straight line, or adjusting the integral of Equation (2), considering the asymptotic expansion of the exponential integral and only considering the first term of the series:
ln ( Γ i Γ des ( T o ) Γ i Γ des ( T ) ) = τ 1 R α E des ( T 2 exp ( E des R T ) T o 2 exp ( E des R T o ) )
As a remark, this equation should be used when the variations in the desorbed amount are very small and the error of the derivative of this same amount is large [38]. This is the case with the mass quantities of GO desorbed in the present case. Thus, considering the function f ( T ) = ln ( Γ i Γ des ( T o ) Γ i Γ des ( T ) ) and representing it as a function of absolute temperature, we obtained the graph in Figure 5b that can be adapted by the second term of Equation (3). This equation adapts perfectly, with a correlation coefficient of 0.99, taking the value of the data obtained experimentally and with the calculated parameter E des R taking the value 14,000 ± 2000 K−1, which allows us to calculate the value of 119 ± 17 kJ/mol for the desorption activation energy. This value falls within the range of interaction energy values of ionic groups of opposite charges, as would be expected, since the GO is making connections with the PEI that has the opposite electrical charge. It is thus proved that the interaction that leads to the adsorption of GO molecules is the electrostatic interaction and that the other physical connections contribute little to the formation of these films. Therefore, these films were revealed to be quite stable at low temperatures, in the 25 °C region, as can be inferred from Figure 4b.

4. Discussion

The absorption spectra of (PEI/GO)12 films produced with different adsorption times revealed a linear growth of absorbance with the number of bilayers, implying that larger adsorbed amounts are achieved for longer adsorption times. The adsorption kinetics of GO molecules analyzed for short adsorption times indicate that there are two main adsorption processes: a nucleation process that takes place at short adsorption times and a diffusion process that takes place at long adsorption times. This indicates that the adsorbed amount of GO per unit of area increases with the adsorption time, reaches a small plateau and then increases again until a constant value is attained. The characteristic times of these processes were 7 s and 600 s, respectively, following the typical polyelectrolyte adsorption behavior.
Stability of PEI/GO films prepared with different adsorption times indicated that desorption increases with both immersion time and temperature. Although desorption at low temperatures was insignificant, greater desorption took place for 60 min at a temperature of 80 °C, allowing us to deduct that PEI/GO films are no longer stable at higher temperatures for long desorption times. However, no detectable desorption occurred when films were immersed in water at room temperature, allowing us to attest that these films can be used as sensors under these conditions.
A desorption activation energy value of 119 ± 17 kJ/mol was obtained from the in situ thermally stimulated desorption experiments carried out in cleaved single-mode optical fibers through reflectivity measurements, revealing that the mechanism leading to the adsorption of GO molecules is mainly electrostatic interactions. The absence of other peaks in the desorption curve that could be associated with lower-energy interactions allows to conclude that other physical interactions have a low contribution to the process. It should also be noted that the reflection technique used in optical fibers is an excellent technique for studying thermally stimulated desorption at the liquid–solid interface of adsorbed molecules that provide some reflection features to the interface. In summary, the films were stable at temperatures below or equal to 25 °C, for periods of immersion time shorter than 2 h. In this way, it is possible to affirm that the PEI/GO films are reliable for tuning optical fiber reflectivity for use as sensing devices in aqueous medium at temperatures in the range of 5 to 30 °C. Furthermore, optical fibers can be used to study thermally stimulated in situ desorption at the liquid–solid interface, if of course the adsorbed molecules provide reflection features to the interface.

5. Conclusions

This study allowed us to conclude that the adsorption of GO on PEI/GO LbL films follows the general two-stage adsorption processes found for polyelectrolytes. The first adsorption stage takes place within the first seconds, in which adsorption is dominated by the attaching of molecules that are bound to the last polyelectrolyte layer through ionic interactions. At a given adsorption time, these adsorbed molecules somehow prevent more molecules from being adsorbed, and for larger adsorption times, the presence of counterions and the diffusion process enable more GO molecules to be adsorbed. As a result, these molecules adsorbed later are not so strongly bound to the last polyelectrolyte layer and can be easily removed by desorption. Therefore, the layers with shorter adsorption times are more stable than those obtained for higher adsorption times. This study also revealed that the GO films are stable at low temperatures when immersed in aqueous media for short periods of time. In this way, it is possible to assert that the PEI/GO films are suitable for application in optical fiber sensor devices at low temperature, and most importantly, that one can use optical fibers to study thermally stimulated desorption at the liquid–solid interface of reflecting molecules in a simple, fast, reliable, and user-friendly way.

Author Contributions

Conceptualization, M.R.; methodology, C.X., P.Z. and C.M.; software, P.Z., S.S., and C.M.; validation, C.X., P.Z., S.S., and C.M.; formal analysis, P.Z. and M.R.; literature review, P.Z., C.X. and M.R.; resources, M.R. and P.A.R.; data curation, P.Z. and M.R.; writing—original draft preparation, M.R. and C.X.; writing—review and editing, M.R., C.M., P.Z., S.S., O.F. and P.A.R.; visualization, M.R.; supervision, O.F., P.A.R. and M.R.; project administration, O.F., P.A.R. and M.R.; funding acquisition, O.F., P.A.R. and M.R. All authors have read and agreed to the published version of the manuscript.

Funding

This work was financed by National Funds through the Portuguese funding agency FCT—Funda-ção para a Ciência e a Tecnologia—within projects UID/EEA/50014/2019, UID/FIS/00068/2019, PTDC/FIS-NAN/0909/2014, UID/FIS/00068/2019, the Bilateral Project entitled “Deteção de Es-trogénio- um Contaminante Emergente - em Corpos Hídricos” within the scope of “Cooperação Transnacional_FCT (Portugal)-CAPES (Brazil) 2018” and M-ERA-NET2/0002/2016.

Institutional Review Board Statement

Not applicable.

Informed Consent Statement

Not applicable.

Data Availability Statement

Data are available on request due to privacy restrictions. The data presented in this study are available on request from the corresponding author.

Acknowledgments

C.M. and P.Z. were funded by the Portuguese Foundation for Science and Technology (FCT) through the Grants SFRH/BD/135820/2018 and PD/BD/142767/2018 (RABBIT Doctoral Programme), respectively.

Conflicts of Interest

The authors declare no conflict of interest.

References

  1. Culshaw, B.; Kersey, A. Fiber-optic sensing: A historical perspective. J. Light. Technol. 2008, 26, 1064–1078. [Google Scholar] [CrossRef]
  2. Bogue, R. Fibre optic sensors: A review of today’s applications. Sens. Rev. 2011, 31, 304–309. [Google Scholar] [CrossRef]
  3. Leal-Junior, A.G.; Diaz, C.A.R.; Avellar, L.M.; Pontes, M.J.; Marques, C.; Frizera, A. Polymer Optical Fiber Sensors in Healthcare Applications: A Comprehensive Review. Sensors 2019, 19, 3156. [Google Scholar] [CrossRef] [Green Version]
  4. Kumar, S.; Deen, M.J. Fiber Optic Communications: Fundamentals and Applications, 1st ed.; John Wiley & Sons, Ltd.: Hoboken, NJ, USA, 2014; ISBN 978-0-470-51867-0. [Google Scholar] [CrossRef]
  5. Chen, Z.; Lau, D.; Teo, J.T.; Ng, S.H.; Yang, X.; Kei, P.L. Simultaneous measurement of breathing rate and heart rate using a microbend multimode fiber optic sensor. J. Biomed. Opt. 2014, 19, 057001. [Google Scholar] [CrossRef]
  6. Rajan, G.; Iniewski, K. (Eds.) Optical Fiber Sensors: Advanced Techniques and Applications, 1st ed.; CRC Press: Boca Raton, FL, USA, 2015. [Google Scholar] [CrossRef]
  7. Krohn, D.; MacDougall, T.; Mendez, A. Fiber Optic Sensors: Fundamentals and Applications, 4th ed.; SPIE: Bellingham, WA, USA; Washington, DC, USA, 2014. [Google Scholar]
  8. Ulieru, D.G. Application of fiber optic sensors to wastewater management using microelectronics fabrication processes. Proc. SPIE 3105. Chem. Biochem. Environ. Fiber Sens. IX 1997, 3105, 229–239. [Google Scholar] [CrossRef]
  9. Michel, K.; Bureau, B.; Boussard-Plédel, C.; Jouan, T.; Adam, J.L.; Staubmann, K.; Baumann, T. Monitoring of pollutant in wastewater by infrared spectroscopy using chalcogenide glass optical fibers. Sens. Actuators B Chem. 2004, 101, 252–259. [Google Scholar] [CrossRef]
  10. Chong, S.S.; Aziz, A.R.; Harun, S.W. Fibre optic sensors for selected wastewater characteristics. Sensors 2013, 13, 8640–8668. [Google Scholar] [CrossRef] [Green Version]
  11. Raposo, M.; Oliveira, O.N., Jr. Energies of Adsorption of Poly(o-methoxyaniline) Layer-by-Layer Films. Langmuir 2000, 16, 2839–2844. [Google Scholar] [CrossRef]
  12. Decher, G. Fuzzy nanoassemblies: Toward layered polymeric multicomposites. Science 1997, 277, 1232–1237. [Google Scholar] [CrossRef]
  13. Xu, M.G.; Dakin, J.P. Novel hollow-glass microsphere sensor for monitoring high hydrostatic pressure. Proc. SPIE Fiber Opt. Laser Sens. X 1993, 1795, 2–7. [Google Scholar] [CrossRef]
  14. Novais, S.; Ferreira, M.S.; Pinto, J.L. Lateral Load Sensing with an Optical Fiber Inline Microcavity. IEEE Photonics Technol. Lett. 2017, 29, 1502–1505. [Google Scholar] [CrossRef]
  15. Liu, S.; Yang, K.; Wang, Y.; Qu, J.; Liao, C.; He, J.; Li, Z.; Yin, G.; Sun, B.; Zhou, J. High-sensitivity strain sensor based on in-fiber rectangular air bubble. Sci. Rep. 2015, 5, 7624. [Google Scholar] [CrossRef] [PubMed] [Green Version]
  16. Monteiro, C.; Silva, S.; Frazão, O. Hollow Microsphere Fabry–Perot Cavity for Sensing Applications. IEEE Photonics Technol. Lett. 2017, 29, 1229–1232. [Google Scholar] [CrossRef] [Green Version]
  17. Dimiev, A.M.; Eigler, S. Graphene Oxide; John Wiley & Sons, Ltd.: Chichester, UK, 2016. [Google Scholar] [CrossRef]
  18. Yang, Y.H.; Bolling, L.; Priolo, M.A.; Grunlan, J.C. Super gas barrier and selectivity of graphene oxide-polymer multilayer thin films. Adv. Mater. 2013, 25, 503–508. [Google Scholar] [CrossRef]
  19. McAllister, M.J.; Li, J.-L.; Adamson, D.H.; Schniepp, H.C.; Abdala, A.A.; Liu, J.; Herrera-Alonso, M.; Milius, D.L.; Car, R.; Prud’homme, R.K.; et al. Single Sheet Functionalized Graphene by Oxidation and Thermal Expansion of Graphite. Chem. Mater. 2007, 19, 4396–4404. [Google Scholar] [CrossRef]
  20. Azman, N.H.N.; Nazir, M.S.M.M.; Ngee, L.H.; Sulaiman, Y. Graphene-based ternary composites for supercapacitors. Int. J. Energy Res. 2018, 42, 2104–2116. [Google Scholar] [CrossRef]
  21. Zhao, J.; Liu, L.; Li, F. Graphene Oxide: Physics and Applications; Springer: Berlin/Heidelberg, Germany, 2015. [Google Scholar] [CrossRef]
  22. Yang, S.L.; Sha, S.M.; Lu, H.; Wu, J.D.; Ma, J.F.; Wang, D.W.; Hou, C.P.; Sheng, Z.L. Graphene oxide and reduced graphene oxide coated cotton fabrics with opposite wettability for continuous oil/water separation. Sep. Purif. Technol. 2021, 259, 118095. [Google Scholar] [CrossRef]
  23. Qu, Y.F.; Ding, J.J.; Fu, H.W.; Chen, H.X.; Peng, J.H. Investigation on tunable electronic properties of semiconducting graphene induced by boron and sulfur doping. Appl. Surf. Sci. 2021, 542, 148763. [Google Scholar] [CrossRef]
  24. Cui, X.H.; Luo, Y.N.; Zhou, Y.; Dong, W.H.; Chen, W. Application of functionalized graphene in Li-O-2 batteries. Nanotechnology 2021, 32, 132003. [Google Scholar] [CrossRef]
  25. Tian, Y.H.; Yu, Z.C.; Cao, L.Y.; Zhang, X.L.; Sun, C.H.; Wang, D.W. Graphene oxide: An emerging electromaterial for energy storage and conversion. J. Energy Chem. 2021, 55, 323–344. [Google Scholar] [CrossRef]
  26. Spinelli, G.; Lamberti, P.; Tucci, V.; Pasadas, F.; Jiménez, D. Sensitivity analysis of a Graphene Field-Effect Transistors by means of Design of Experiments. Math. Comput. Simul. 2021, 183, 187–197. [Google Scholar] [CrossRef]
  27. Shende, P.; Pathan, N. Potential of carbohydrate-conjugated graphene assemblies in biomedical applications. Carbohydr. Polym. 2021, 255, 117385. [Google Scholar] [CrossRef]
  28. Shahi, M.; Hekmat, F.; Shahrokhian, S. Hybrid supercapacitors constructed from dou-ble-shelled cobalt-zinc sulfide/copper oxide nanoarrays and ferrous sulfide/graphene oxide nanostructures. J. Colloid Interface Sci. 2021, 585, 750–763. [Google Scholar] [CrossRef] [PubMed]
  29. Ali, M.; Sokolov, A.; Ko, M.J.; Choi, C. Optically excited threshold switching synapse characteristics on nitrogen-doped graphene oxide quantum dots (N-GOQDs). J. Alloy. Compd. 2021, 855, 157514. [Google Scholar] [CrossRef]
  30. Zhu, S.; Wang, M.Y.; Qiang, Z.; Song, J.C.; Wang, Y.; Fan, Y.C.; You, Z.W.; Liao, Y.Z.; Zhu, M.F.; Ye, C.H. Multi-functional and highly conductive textiles with ultra-high durability through ‘green’ fabrication process. Chem. Eng. J. 2021, 406, 127140. [Google Scholar] [CrossRef]
  31. Arul, C.; Moulaee, K.; Donato, N.; Iannazzo, D.; Lavanya, N.; Neri, G.; Sekar, C. Temperature modulated Cu-MOF based gas sensor with dual selectivity to acetone and NO2 at low operating temperatures. Sens. Actuators B Chem. 2021, 329, 129053. [Google Scholar] [CrossRef]
  32. Qian, L.T.; Durairaj, S.; Prins, S.; Chen, A.C. Nano-material-based electrochemical sensors and biosensors for the detection of pharmaceu-tical compounds. Biosens. Bioelectron. 2021, 175, 112836. [Google Scholar] [CrossRef] [PubMed]
  33. Kumar, R.; Singh, R.; Kumar, A.; Kashyap, R.; Kumar, D.; Kumar, M. Chemically functionalized graphene oxide thin films for selective ammonia Gas sensing. Mater. Res. Express 2020, 7, 15612. [Google Scholar] [CrossRef]
  34. Bettazzi, F.; Ingrosso, C.; Sfragano, P.S.; Pifferi, V.; Falciola, L.; Curri, M.L.; Palchetti, I. Gold nanoparticles modified graphene platforms for highly sensitive electrochemical detection of vitamin C in infant food and formulae. Food Chem. 2020, 344, 128692. [Google Scholar] [CrossRef]
  35. Gross, M.A.; Moreira, S.G.C.; Pereira-da-Silva, M.A.; Sodre, F.F.; Paterno, L.G. Multilayered iron oxide/reduced graphene oxide nano-composite electrode for voltammetric sensing of bisphenol-A in lake water and ther-mal paper samples. Sci. Total Environ. 2021, 763, 142985. [Google Scholar] [CrossRef]
  36. Hue, N.T.; Wu, Q.; Liu, W.H.; Bu, X.R.; Wu, H.Y.; Wang, C.; Li, X.; Wang, X.L. Graphene oxide/graphene hybrid film with ultrahigh am-monia sensing performance. Nanotechnology 2021, 32, 115501. [Google Scholar] [CrossRef] [PubMed]
  37. Politano, G.G.; Vena, C.; Desiderio, G.; Versace, C. Variable Angle Spectroscopic Ellipsometry Characterization of Reduced Graphene Oxide Stabilized with Poly(Sodium 4-Styrenesulfonate). Coatings 2020, 10, 743. [Google Scholar] [CrossRef]
  38. Monteiro, C.S.; Raposo, M.; Ribeiro, P.A.; Silva, S.O.; Frazão, O. Tuning of Fiber Optic Surface Reflectivity through Graphene Oxide-Based Layer-by-Layer Film Coatings. Photonics 2020, 7, 11. [Google Scholar] [CrossRef] [Green Version]
  39. Stankovich, S.; Dikin, D.A.; Dommett, G.H.B.; Kohlhaas, K.M.; Zimney, E.J.; Stach, E.A.; Piner, R.D.; Nguyen, S.T.; Ruoff, R.S. Graphene-based composite materials. Nature 2006, 442, 282–286. [Google Scholar] [CrossRef]
  40. Marques, I.; Magalhães-Mota, G.; Pires, F.; Sério, S.; Ribeiro, P.A.; Raposo, M. Detection of Traces of Triclosan in Water. Appl. Surf. Sci. 2017, 421, 142–147. [Google Scholar] [CrossRef]
  41. Monteiro, C.S.; Raposo, M.; Ribeiro, P.A.; Silva, S.; Frazão, O. Graphene oxide as a tunable platform for microsphere-based optical fiber sensors. In Proceedings of the SPIE 11207, Fourth International Conference on Applications of Optics and Photonics, Lisbon, Portugal, 31 May–4 June 2019; Volume 112070X. [Google Scholar] [CrossRef]
  42. Magro, C.; Zagalo, P.; Pereira-da-Silva, J.; Pires Mateus, E.; Branco Ribeiro, A.; Ribeiro, P.; Raposo, M. Polyelectrolyte Based Sensors as Key to Achieve Quantitative Electronic Tongues: Detection of Triclosan on Aqueous Environmental Matrices. Nanomaterials 2020, 10, 640. [Google Scholar] [CrossRef] [Green Version]
  43. Xavier, C.; Zagalo, P.; Ribeiro, P.; Raposo, M. Optimization of Graphene Oxide Layer-by-Layer Films to Be Used as an Enhancer Coating of Optical Fibers Sensors. In Proceedings of the 8th International Conference on Photonics, Optics and Laser Technology—Volume 1: PHOTOPTICS, Valletta, Malta, 27–29 February 2020; pp. 192–195, ISBN 978-989-758-401-5. [Google Scholar] [CrossRef]
  44. Silverstein, R.M.; Bassler, G.C.; Morrill, T.C. Spectrometric Identification of Organic Compounds; John Wiley & Sons: New York, NY, USA, 1991. [Google Scholar] [CrossRef]
  45. Raposo, M.; Pontes, R.S.; Mattoso, L.H.C.; Oliveira, O.N., Jr. Kinetics of Adsorption of Poly (o-methoxyaniline) Self-assembled films. Macromolecules 1997, 30, 6095–6101. [Google Scholar] [CrossRef]
  46. Raposo, M.; Oliveira, O.N., Jr. Adsorption of poly(o-methoxyaniline) in layer-by-layer films. Langmuir 2002, 18, 6866–6874. [Google Scholar] [CrossRef]
  47. Zhou, Y.; Bao, Q.; Tang, L.A.L.; Zhong, Y.; Loh, K.P. Hydrothermal Dehydration for the “Green” Reduction of Exfoliated Graphene Oxide to Graphene and Demonstration of Tunable Optical Limiting Properties. Chem. Mater. 2009, 21, 2950–2956. [Google Scholar] [CrossRef]
  48. Liu, H.; Kuila, T.; Kim, N.H.; Ku, B.-C.; Lee, J.H. In situ synthesis of the reduced graphene oxide–polyethyleneimine composite and its gas barrier properties. J. Mater. Chem. A 2013, 1, 3739–3746. [Google Scholar] [CrossRef]
  49. Kim, S.; Zhou, S.; Hu, Y.; Acik, M.; Chabal, Y.J.; Berger, C.; de Heer, W.; Bongiorno, A.; Riedo, E. Room-temperature metastability of multilayer graphene oxide films. Nat. Mater. 2012, 11, 544–549. [Google Scholar] [CrossRef] [PubMed]
Figure 1. (a) Schematic of the experimental configuration used to measure the reflected optical signal power of the cleaved fibers possessing a (PEI/GO)12 LbL film adsorbed on its cross section. (b) Reflected optical spectra of a (PEI/GO)12 coated optical fiber and of a cleaved optical fiber with no coating. (PEI/GO)12: polyethyleneimine/graphene oxide layer-by-layer films prepared with 12 bilayers; SMF: single-mode optical fiber; OSA: optical spectrum analyzer.
Photonics 08 00070 g001
Figure 2. (a) Absorbance spectra of PEI/GO LbL films with different numbers of bilayers prepared with 300 s of adsorption time for each layer; (b) absorbance at 230 nm as a function of the number of bilayers of PEI/GO LbL films prepared with different adsorption time periods, namely 5, 15, 30, 60 and 300 s; and (c) image of a (PEI/GO)12 LbL film prepared with an adsorption time of 60 s. The area of the quartz solid substrate where the film is deposited was 13 × 26 mm2.
Photonics 08 00070 g002
Figure 3. In situ kinetics of the adsorption of GO onto a (PEI/ GO)n /PEI thin film as measured by reflectance and by UV–visible spectroscopy (adsorbed amount per unit of area). The blue line corresponds to the fitting with Equation (1).
Photonics 08 00070 g003
Figure 4. (a) Time evolution of absorbance spectra for the film immersed in ultrapure water at 80 °C; (b) normalized absorbance values at 230 nm as a function of the immersion time of (PEI/GO)12 films in water at constant temperature, namely 25, 50 or 80 °C.
Photonics 08 00070 g004
Figure 5. (a) Thermally stimulated desorption of GO in SMF fibers: shown in blue is the variation of reflected optical power as a function of temperature, and shown in orange is the quantity of desorbed GO. (b) Graph of f ( T ) = ln ( Γ i Γ des ( T o ) Γ i Γ des ( T ) ) as a function of absolute temperature. The blue line corresponds to the fitting of the f ( T )   points with the second term of Equation (3).
Photonics 08 00070 g005
Table 1. Adsorption kinetics parameters obtained from the fit of Equation (1) to experimental data.
Equation (1) ParametersCalculated Values
Γ n (a.u.)0.022 ± 0.003
τ n (s)7 ± 3
Γ d (a.u.)0.13 ± 0.02
τ d   ( s ) 600 ± 30 1
nJMA1
R0.992
1 Value calculated in [29].
Publisher’s Note: MDPI stays neutral with regard to jurisdictional claims in published maps and institutional affiliations.

