Visual Adaptation to Scattering in Myopes


1
Laboratorio de Óptica, Instituto Universitario de Investigación en Óptica y Nanofísica, Universidad de Murcia, Campus de Espinardo (Ed. 34), 30100 Murcia, Spain
2
Servicio de Oftalmología, Hospital Virgen de la Arrixaca, 30120 Murcia, Spain
*
Author to whom correspondence should be addressed.
Photonics 2021, 8(7), 274; https://0-doi-org.brum.beds.ac.uk/10.3390/photonics8070274
Submission received: 4 May 2021
/
Revised: 21 June 2021
/
Accepted: 11 July 2021
/
Published: 13 July 2021
(This article belongs to the Special Issue Visual Optics and Ophthalmology)
Abstract
:Myopes exhibit a larger capability of adaptation to defocus. Adaptation produces a boost in visual performance that can be characterized through different metrics. The ability of myopes to adapt to other sources of blur, such as diffusion, has not been studied so far. In this work, a group of 20 myopes with normal vision underwent high-contrast visual acuity (VA) measurements under different viewing conditions, wearing their refractive correction with or without a diffuser (Bangerter filter, BF). VA decreased immediately after wearing the BF of density 0.6, showing a significant relationship with the ocular refraction. After 40 minutes of binocular vision through the BF, a statistically significant increase (p = 0.02) in VA from 0.54 to 0.62 in decimal scale (from 0.3 to 0.2 logMAR) was obtained. No correlation with the refraction was observed. After removing the diffuser, VA returned to baseline. A control group (17 subjects) underwent the same experimental protocol but without diffuser filters. No significant changes in VA were found in this group. We describe a new type of contrast adaptation to blur in myopes caused by scattering, rather than by defocus. The effects of low scattering levels in vision might be relevant in the analysis of early stage of cataract, amblyopia treatments, and myopia understanding.
1. Introduction
The imperfect optics of the eye imposes the first limit to visual performance. Despite this circumstance, the eye is a robust system, able to operate under a variety of situations [1]. The main factors degrading retinal images are refractive errors, high order ocular aberrations, and scattering [2,3,4]. Beyond these optical limitations, it is accepted that the human visual system is capable of changing the characteristics of its response based on both recent visual experience and environmental conditions [5]. Possible neural adjustments, generically grouped under visual adaptation phenomena, may be important to compensate, at least partially, for changes in the environmental conditions, including those arising from optical factors. Adaptation can be understood as a mechanism to prevent saturation and keep detection in the range of best sensitivity.
A plethora of phenomena associated with adaptation have been studied for years. Visual adaptation describes the processes by which the visual system alters its operating properties in response to changes in the environment, thus having important consequences in perceptual experience [6]. This visual adaptation can be described as a form of neuroplasticity. This neural plasticity of the visual system combines two fundamental mechanisms: a neural adaptation process that recalibrates the internal norm to maintain a match between visual coding and visual environment, and perceptual learning that refers to the performance after a training task. Visual coding is a dynamic process, able to adapt the visual system to continuous changes, such as variations in contrast, luminance, blur, or color. It also adapts to changes affecting the observer, including disease, surgical treatments, aging, or a new spectacle prescription [7]. On the other hand, perceptual learning refers to the phenomenon where training or practice in perceptual tasks often improves visual performance. This improvement is closely linked to the task and the stimulus used (i.e., retinal location, spatial frequency, orientation, background texture, or visual field position) [8]. Adaptation allows a match between visual coding and visual environment to be maintained throughout the life span. These processes can occur over a wide range of timescales, either from millisecond to minutes [9,10] or life-spans [7].
Across the vast number of visual adaptation experiments, some of them explored how vision is affected by modifying ocular aberrations [11,12] and, consequently, altering the shape of the retinal images. Others only include the blurring of the visual stimuli by adding pure defocus. This family of phenomena connects optics with the neural and perceptual stages of vision. It is known that adaptation to modified versions of the image, either blurred or sharped, recalibrates perception, biasing the election of best focus [13]. Therefore, the perceived sharpness of an image is strongly biased by prior adaptation to blurring. This supports the idea that the visual response is calibrated to compensate for these variations in sensitivity that occur on the spatial scale. In addition to changes in perception, essentially biasing the selection of the best image, adaptation to blur-induced retinal images may also alter the performance of visual function. For instance, the exposure to defocused images might eventually produce changes in visual acuity (VA) [14,15,16].
In this regard, myopic subjects are a special population where adaptation to defocus blur has been widely studied, because it exhibits a significant impact in their vision. Several studies have explored how myopes adapt to defocus blur, not only to their own refractive error, but also in situations where extra defocus is added [17,18,19,20].
Apart from defocus and astigmatism (i.e., refractive errors) and other optical aberrations, scattering is another optical source of retinal image degradation [21,22] and, eventually, another source of neural adaptation in vision. Scattering, also known as straylight in the context of Visual Science, can be rigorously modelled as an interaction between light and matter. When light passes through an optical medium exhibiting refractive index heterogeneity, the trajectories are scattered in random directions and cannot be deterministically traced. The main sources of scattering in the human eye are the cornea, the lens, and the retina [23,24,25]. In young subjects, intraocular scattering is barely present, but it is known to naturally increase with age [26]. Severe scattering from the lens is generally associated with cataracts, being an important cause of retinal image degradation and consequently affecting vision [27].
Artificial sources of scattering, such as diffuser filters, are usually employed in the treatment of amblyopia [28]. These filters are used to modulate the degree of visual deprivation, avoiding total occlusions, causing retinal image degradation by diffusion and declining the VA of the eye to baseline levels [29]. The degradation of vision over the selected eye, leaving unaffected the contralateral eye (generally with poorer visual quality), induces a boost in its performance, enhancing vision. Binocular vision is typically maintained, with significant advantages over monocular, total occlusion treatments.
Among the spectrum of static diffuser filters (i.e., those whose characteristics cannot be changed in real time), Bangerter filters (BFs) are one of the most widely employed [30,31,32]. In a similar way to a Gaussian filter, BFs produce a monotonous reduction in contrast at increasing spatial frequencies. They are named after its inventor, who, in 1960, introduced the filter with the aim of producing a gradual and controlled reduction of image quality. BFs of different density have been characterized objectively through both their microscopic structure [33] and subjective visual testing [34,35].
In this work, we explored whether the incorporation of scattering can trigger adaption in adult myopes covering a wide range of ocular refraction in a similar way that defocus has proved to ignite. Specifically, we studied the possible enhancement of VA after a period of modified binocular vision when mild levels of scattering (by means of a BF) were added as the only source of retinal blur.
2. Materials and Methods
2.1. Subjects
A total of 37 volunteers were involved in the present study. Only myopes free from ocular pathology were enrolled (with no limit on their myopic refraction). Subjects presenting a difference above ±0.5 diopters (D) in the objective refraction, as compared to their prescribed corrections, were also excluded from the experiment. The participants were randomly separated into 2 groups. The first group, named as the Control Group (CG), included 17 subjects (mean age: 29 ± 9 years). A second group of 20 volunteers (27 ± 2 years of average age) was referred to as the Bangerter Filter Group (BFG). Both underwent the same experimental protocol based on a VA assessment with or without BFs, as it is described in the following. During visual testing, all participants wore their habitual optical corrections, either spectacles or contact lenses. Immediately before and after the experiment, the refractive error and the keratometric parameters were obtained by using an autorefractor (Topcon KR-8900®, Topcon Corporation, Tokyo, Japan). The experiment was approved by the ethical committee of the institution, and the participants signed an informed consent explaining the nature of the measurements. The study followed the tenets of the Declaration of Helsinki.
2.2. Experimental Protocol
The experimental protocol included the estimation of the monocular VA of the right eye of all subjects at four time points under different conditions. During VA measures, the left eye was occluded. For the rest of the time, binocular vision was allowed.
The first condition corresponded to the baseline VA assessment (VA1). For this initial VA1, the subjects wore their own refractive correction (if needed). For the next condition, adhesive BFs of density 0.6 were mounted on top of both neutral glasses of extra-size frame spectacles. The BFs were manufactured with different densities in minimum steps of 0.1 associated with the severity of the scattering. The scattering level indicates the manufacturer’s predicted decimal VA when the filter is positioned in front of an eye with a normal VA. Binocular vision was enabled while simultaneously wearing the BFs and either regular spectacles or contact lenses. Five minutes after obtaining VA1, and immediately after wearing the BF, a subsequent VA (VA2) was obtained.
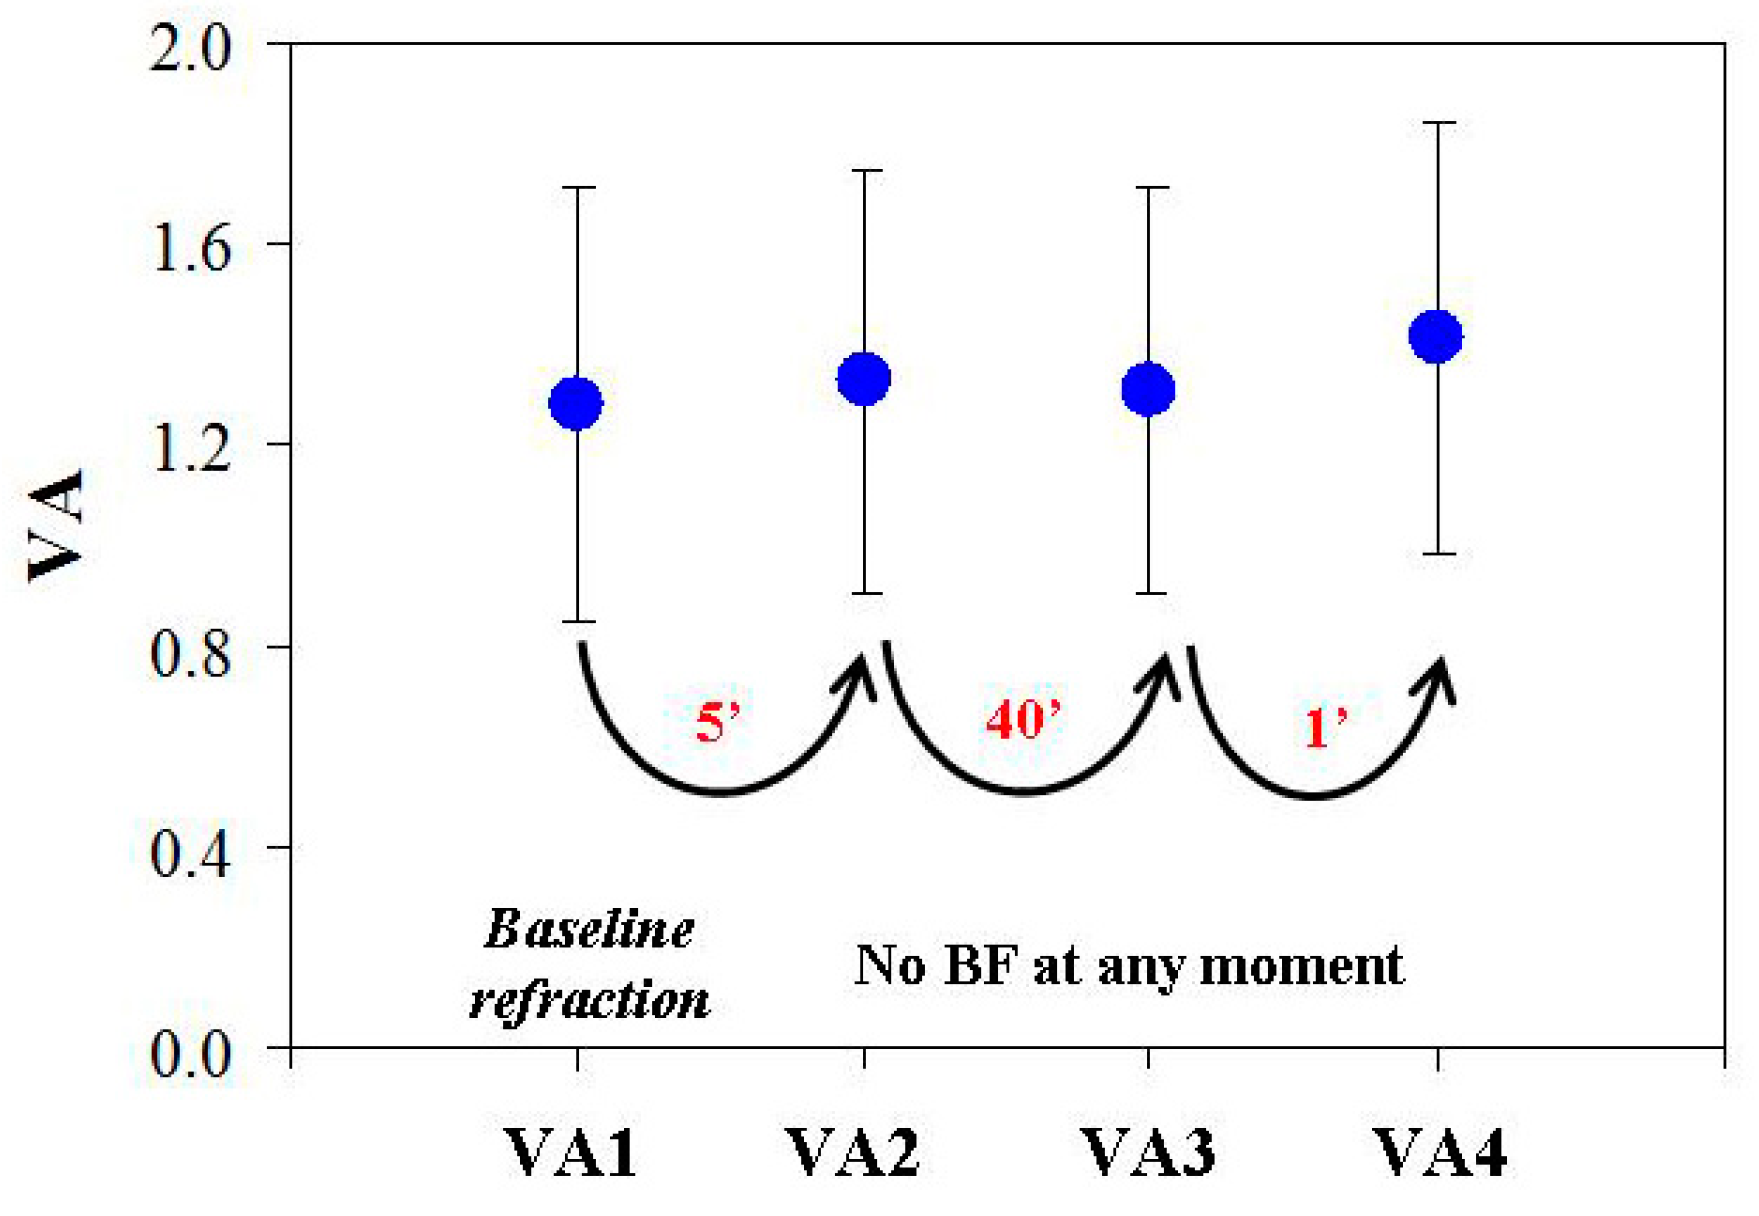
After VA2 was estimated, the subjects could move freely and leave the room for 40 minutes, always wearing the BF under binocular vision. No other instructions or restrictions were given. Once this break was over, the VA was measured again (VA3). Immediately after the retrieval of VA3, the BFs were removed, and a final VA estimation (VA4) was obtained. More specifically, VA4 was performed under identical optical conditions as VA1. For the sake of clarity, a schematic diagram of the protocol is shown in Figure 1.
The VA estimation was obtained through the Freiburg test [36]. The Freiburg test is a multiplatform and open access software that allows for the measurement of several visual quality parameters. It uses psychometric methods combined with anti-aliasing algorithms to allow accurate VA estimations, contrast sensitivity, and Vernier acuity. The evolution of the size of the optotype along the runs followed a Bayesian approach, determined by BEST PEST strategy. The Freiburg test enables a broad range of VA to be retrieved, ranging from 0 to 2.5 in decimal scale or, equivalently, from −0.4 to 2.3 in logMAR notation.
The screen of a laptop was used to display the VA test, exhibiting 13.3 inches of diagonal dimension and IPS technology, resolution of 2560 × 1600 pixels, and 227 PPI (Macbook pro Retina, Apple® USA). The brightness of the screen was set to its maximum (300 cd/m2). The Freiburg test was placed at 4 m from the subjects. The relationship between the subject–test distance and the screen’s pixel size was calibrated accordingly. For the estimation of the VA, a Landolt C optotype was shown during 0.3 s, at 4 fixed orientations, four-choice orientation election for the gap of the C letter, and 30 repetitions for each run. The VA value was obtained in every case as the average from 3 consecutive runs taken under identical conditions. Participants were instructed how to perform the forced choice VA test before starting the measurements.
3. Results
Figure 2 presents the values of ocular refraction (spherical equivalent) for all the subjects involved in this experiment (both CG and BFG). As stated in the previous section, these were measured at the beginning of the experiment (i.e., just before VA1 was assessed). Values were located within the interval [−0.50, −9.75] D. Refractions between the two groups were not statistically different (t-test, p = 0.74).
The values of VA1 for the two groups of subjects as a function of the spherical equivalent are shown in Figure 3. These VAs correspond to the basal measurements and serve as a reference for changes as a function of time during the experiment. VA1 values were in the range between 0.73 and 2.00 in decimal scale, and no statistically significant differences were found between the two groups of subjects (t-test, p = 0.94). Moreover, the highest fraction of VA1 values (73%) corresponded to the interval [0.9, 1.5], which is associated with normal vision. The Shapiro–Wilk test indicated a normal distribution for VA1 (W = 0.93; p = 0.19).
Following the experimental protocol described in Methods, the VA was measured at the same time points for both sets of subjects. For the CG, Figure 4 depicts the mean VA values for each experimental condition (i.e., from VA1 to VA4). VAs hardly changed among the different conditions. This fact could also be observed graphically in Figure 5, where the averaged VA values for each control subject across time are shown. In addition, no significant differences between the averaged VAs were found (as measured with the paired t-test). These results indicate that there was not a learning effect with time for this group of subjects.
For the BFG, Figure 6 compares VA1–VA2 and refraction, where, as previously stated, VA1 is the baseline refraction (i.e., before the use of the BF), and VA2 are the values measured immediately after wearing the BF. For the BFG (red symbols), a linear significant relationship was found (R = 0.76, p < 0.001). This means that the higher the amount of myopia, the lower the difference between VA1–VA2. It might also be interpreted as an increased tolerance to scattering as the eye exhibits larger myopia. Moreover, VA just after wearing the BF was similar for all subjects. More specifically, differences among subjects decreased, as the standard deviations show, reducing on average from VA1 = 1.29 ± 0.37 to VA2 = 0.54 ± 0.18. Nevertheless, it must be noticed that the standard deviation remained about the 30% of the mean value in both cases. The decrease in VA was statistically significant (paired t-test, p < 0.0001). For direct comparisons, the results for the CG area were also included (blue symbols). As expected from Figure 4, these data were distributed close to the VA1–VA2 = 0 line.
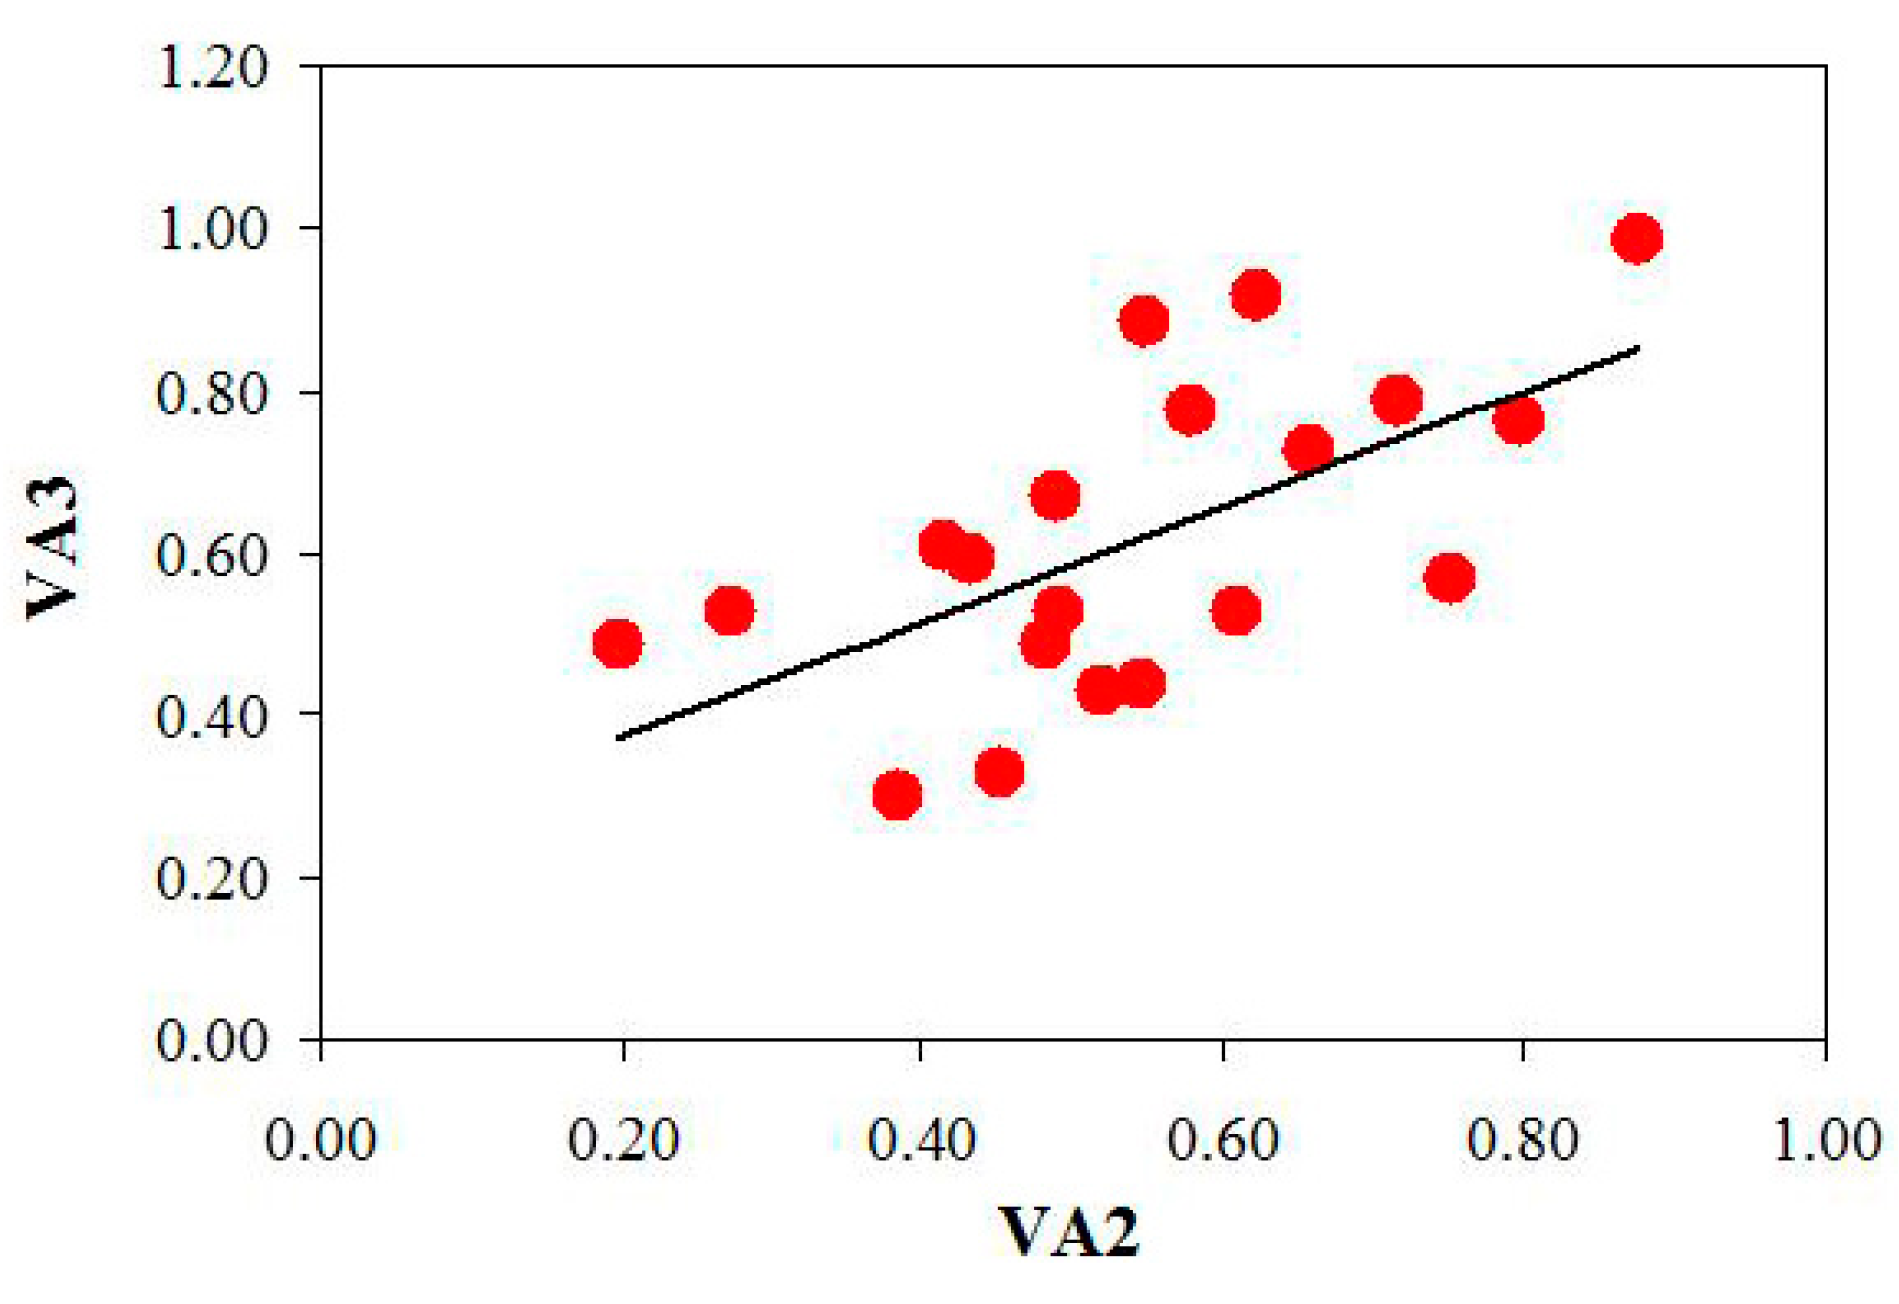
After 40 minutes of wearing the BF, the VA was determined again (VA3). Figure 7 presents the VA3 values as a function of the VA2 values. The plot shows the changes in VA as a result of wearing the BF. A statistically significant linear relationship was found (R = 0.60, p = 0.002). VA2 and VA3 presented normal distributions, as measured with the Shapiro–Wilk test (W = 1; p = 0.9 for both of them). On average, VAs increased from VA2 = 0.54 ± 0.18 to VA3 = 0.63 ± 0.18. When the paired t-test was used, these two VA sets showed statistically significant differences (p = 0.02). This might suggest a visual adaptation phenomenon to the scattering induced with BF. This increase in VA after wearing the BF was not correlated with the spherical equivalent (R = 0.21, p = 0.38).
Finally, after removing the BF, the VA was also measured (VA4). As expected, VA4 values were noticeably higher than VA3 ones (VA4 = 1.20 ± 0.37 compared to VA3 = 0.63 ± 0.18). In addition, the distribution of VA4 value was also normal (Shapiro–Wilk method, W = 0.9, p = 0.2). This increase in VA was statistically significant (paired t-test, p < 0.0001). This indicates that the VA after removing the BF did not depend on VA3 values. On the contrary, VA4 and VA1 presented a linear significant dependence (R = 0.66, p = 0.0003), as depicted in Figure 8. No statistical differences were found between both sets of VA values (paired t-student test, p = 0.13).
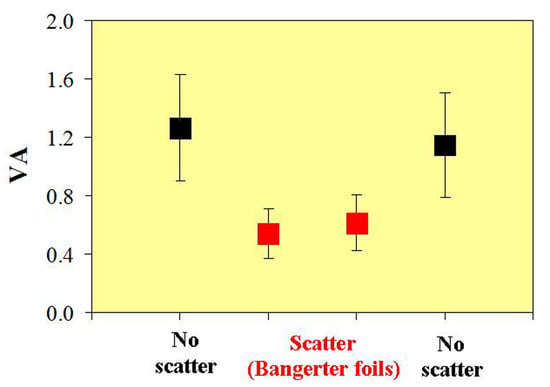
In Figure 9, all the VA values for the different experimental conditions for the BFG are shown. Results show noticeable and statistically significant variations in VA. VA suffers a significant (and immediate) reduction when the filter was applied (i.e., VA2 vs. VA1; see also Figure 6). After wearing the BF for 40 minutes, the VA exhibited a moderate increase of ~15% (VA3 vs. VA2 comparison), which was found to be significant (p = 0.02; see above). Finally, when the BF was removed, the VA values (VA4) presented similar values (no significant differences, p = 0.32) to those measured at the beginning of the experiment (basal values, VA1).
At this point, it is also interesting to note that the values of objective refraction and keratometry did not suffer changes when comparing the data before and after wearing the BF (R = 0.99 for both parameters). This is depicted in Figure 10.
4. Discussion
When evaluating visual performance through high-contrast VA measures, variations in VA increase with the addition of defocus blur. This effect can be explained in terms of the associated increasing in depth of focus [37,38]. Interestingly, we have obtained, in this work, an opposite effect when using diffuser filters as source of blur. This finding could be taken as an indicator that diffusers do not induce a defocus-like blur in terms of image degradation, but instead, they mainly induce a reduction of contrast over all the spatial frequencies. The standard deviation of the VA obtained with vision through the BF was significantly lower than its equivalent under natural (corrected) viewing conditions (0.17 vs. 0.37). This indicates that high-contrast VA assessment is an appropriate test to study phenomena associated with diffusion. It should be added that low contrast VA tests, and stronger BFs, could potentially increase the amplitude of the effects reported in this work.
In some studies, the degradation in VA predicted by the severity of the BF in normal adults has been found to be inconsistent and not always matching the manufacturer’s specifications, particularly when using low diffusion BFs [26]. It was reported that BFs of density 1, 0.8, and 0.4 performed very similarly, all of them degrading VA to values around 0.6 in decimal scale (0.22 logMAR). Since the effect of BFs of density 0.6 (as the ones used herein) has not been reported in a normal (i.e., non-amblyopic) adult population, our results add useful information to the performance of this specific BF in terms of VA. As mentioned, the expected reduction in VA for this BF was 0.6, and we obtained 0.54 (0.27 logMAR) and 0.62 (0.21 logMAR) for VA2 and VA3, respectively. This indicates that the BF of density 0.6 operated very close to the manufacturer’s specifications.
A decline on VA induced by the BF of density 0.6 could be related to the amount of defocus required to reduce VA to the same extent. According to the existing literature, this defocus is approximately 0.5 D [39,40,41]. To the best of our knowledge, contrast adaptation has not been tested with such a low amount of defocus, where, typically, larger values are usually applied (with higher impact in VA). In fact, 0.5 D is near the depth of focus introduced by natural chromatic aberration [42]. Consequently, testing the possible adaptation to the blur induced by such a small defocus would possibly fail to produce any result in this context, although adaptation phenomena associated with chromatic aberration and characterized in terms of VA have recently been found [43]. Also related to the defocus blur, equivalent to a BF in terms of vision degradation, another interesting point arose. A critical factor when modeling the decline of VA as a function of defocus is the pupil size of the observer [39,40,41]. This variable was not controlled in our experiment, but it might be a future parameter to be incorporated when measuring the effects of adaptation to diffuser filters. This is of particular importance when very different pupil sizes are expected among the subjects involved, for instance, when the population covers a wide range of ages or under extreme illumination conditions. In our case, the effects of pupil size are likely negligible, since the age of the subjects was similar (27 ± 2 years old) [44], and the illumination of both the room and the test were kept constant along the entire experiment [45].
It is worth also mentioning that, in this work, the spherical equivalent was used as a parameter to correlate with, and the direction of the astigmatism (if this exists) was not taken into consideration. Possible effects of scattering combined with astigmatism can be useful for future experiments, and additional specific visual tests will be required.
Our results are in line with studies regarding the amelioration of the visual function following a period of vision through BFs. A significant increase in VA was observed after extended periods (6 and 12 weeks) of wearing of BFs in children [34]. An important practical outcome from that study was the recommendation of changing the BF to avoid this adaptation effect, boosting VA, to make the amblyopia’s treatment more effective. Although our subjects were adults with normal VA, we hypothesize that such changes can operate at shorter scales, even for low graded BFs. Other authors found a relatively short time course of adaptation to blur produced by spherical defocus (~6 min) and no dependence with ocular refraction [15]. This time was nearly independent of the induced defocus (between 1 and 3 D). Other experiments found longer adaptation periods of about 30 min and beyond [16]. In the literature, it is possible to find a large variety of time periods and conditions, although it must be accepted that the absolute adaptation time course to diffusion cannot be definitively assessed, especially if long exposures under modified visual conditions affect adaptation. Accordingly, therapeutic treatment based on the use of BFs should account for this fact.
A variety of diffuser filters have been used to degrade vision in normal subjects [46] in order to simulate the drop in VA that is experienced by patients with low visual performance. This is particularly important for testing certain ophthalmic instruments designed to be used on low vision patients. According to our results, even relatively mild amounts of diffusion produce enhancement of VA following adaptation, which should be accounted for during visual testing protocols. Since low levels of diffusion are typical for early cataracts, the use of diffuser filters with low dispersion, such as the one employed herein, is of practical interest. Subjective VA testing for the diagnosis of early stage cataracts might fail, or underestimate the severity of the cataract, because of the reported adaptation effect.
5. Conclusions
In the present experiment, we found that the reduction in VA after application of BFs (i.e. VA1–VA2) in a myopic population exhibited a correlation with the refraction. Following a 40 min period of binocular vision, we found a statistically significant increase in the VA from 0.54 to 0.62 in decimal scale. This improvement was not obtained in the CG. The increase in VA could be attributed to visual adaptation and was not correlated with refractive state. It must be said that such a correlation cannot be totally excluded, however. The amplitude of the adaptation in terms of the increase in VA was relatively modest, so in clinical practice, using low precision visual tests, the change might be hidden within the experimental error. Moreover, subjects tend to recover their initial VA after BF removal. Values of VA1 and VA4 were similar (paired t-test), although the p-value was relatively low (0.13). This might be an indicator of certain aftereffects following adaptation, which might be found with a more sensitive test or a larger population (including higher values of myopia) in future studies. Our results can contribute to a better understanding of vision in myopes and to the use of diffuser filters as a promising way to explore adaptation phenomena.
Author Contributions
Conceptualization and experiment design, J.M.B. and E.J.F.; experimental measurements, J.A.V.-C.; data curation and analysis, J.A.V.-C., J.M.B. and E.J.F.; draft preparation, J.A.V.-C.; writing and review, J.M.B. and E.J.F. All authors have read and agreed to the published version of the manuscript.
Funding
This research received no external funding.
Institutional Review Board Statement
The study was conducted according to the guidelines of the Declaration of Helsinki. Ethical review and approval were waived for this study since it followed protocols from the Ethics Committee of Hospital Universitario Virgen de la Arrixaca regarding the privacy of data collected from volunteers (completely anonymized), and only commercial instruments and techniques of general and ordinary use in the Ophthalmology Service were applied.
Informed Consent Statement
Informed consent was obtained from all subjects involved in the study.
Data Availability Statement
Requests for materials should be addressed to J.M.B. or E.J.F.
Acknowledgments
The authors thank José M. Marín for allowing the use of the hospital facilities for VA measurements.
Conflicts of Interest
The authors declare no conflict of interest.
References
- Artal, P.; Benito, A.; Tabernero, J. The human eye is an example of robust optical design. J. Vis. 2006, 6, 1. [Google Scholar] [CrossRef] [Green Version]
- Wade, N.J. Image, eye, and retina (invited review). J. Opt. Soc. Am. A 2007, 24, 1229–1249. [Google Scholar] [CrossRef] [PubMed]
- Liang, J.; Williams, D.R. Aberrations and retinal image quality of the normal human eye. J. Opt. Soc. Am. A 1997, 14, 2873–2883. [Google Scholar] [CrossRef] [PubMed]
- Berg, T.J.V.D.; Franssen, L.; Kruijt, B.; Coppens, J.E. History of ocular straylight measurement: A review. Z. Med. Phys. 2013, 23, 6–20. [Google Scholar] [CrossRef]
- Webster, M.A. Visual Adaptation. Annu. Rev. Vis. Sci. 2015, 1, 547–567. [Google Scholar] [CrossRef] [PubMed] [Green Version]
- Clifford, C.W.; Webster, M.; Stanley, G.B.; Stocker, A.; Kohn, A.; Sharpee, T.; Schwartz, O. Visual adaptation: Neural, psychological and computational aspects. Vis. Res. 2007, 47, 3125–3131. [Google Scholar] [CrossRef] [PubMed] [Green Version]
- Webster, M.A. Adaptation and visual coding. J. Vis. 2011, 11, 3. [Google Scholar] [CrossRef] [PubMed] [Green Version]
- Lu, Z.-L.; Hua, T.; Huang, C.-B.; Zhou, Y.; Dosher, B.A. Visual perceptual learning. Neurobiol. Learn. Mem. 2011, 95, 145–151. [Google Scholar] [CrossRef]
- Kohn, A. Visual Adaptation: Physiology, Mechanisms, and Functional Benefits. J. Neurophysiol. 2007, 97, 3155–3164. [Google Scholar] [CrossRef]
- Wark, B.; Lundstrom, B.N.; Fairhall, A. Sensory adaptation. Curr. Opin. Neurobiol. 2007, 17, 423–429. [Google Scholar] [CrossRef]
- Fernández, E.J.; Manzanera, S.; Piers, P.; Artal, P. Adaptive Optics Visual Simulator. J. Refract. Surg. 2002, 18, 634–638. [Google Scholar] [CrossRef]
- Artal, P.; Chen, L.; Fernandez, E.J.; Singer, B.; Manzanera, S.; Williams, D.R. Neural compensation for the eye’s optical aberrations. J. Vis. 2004, 4, 4. [Google Scholar] [CrossRef] [PubMed]
- Webster, M.; Georgeson, M.; Webster, S.M. Neural adjustments to image blur. Nat. Neurosci. 2002, 5, 839–840. [Google Scholar] [CrossRef] [PubMed]
- Poulere, E.; Moschandreas, J.; Kontadakis, G.A.; Pallikaris, I.G.; Plainis, S. Effect of blur and subsequent adaptation on visual acuity using letter and Landolt C charts: Differences between emmetropes and miopes. Ophthal. Physiol. Opt. 2013, 33, 130–137. [Google Scholar] [CrossRef] [PubMed]
- Khan, K.; Dawson, K.; Mankowska, A.; Cufflin, M.P.; Mallen, E.A. The time course of blur adaptation in emmetropes and myopes. Ophthalmic Physiol. Opt. 2013, 33, 305–310. [Google Scholar] [CrossRef] [PubMed]
- Mon-Williams, M.; Tresilian, J.R.; Strang, N.C.; Kochhar, P.; Wann, J.P. Improving vision: Neural compensation for optical defocus. Proc. R. Soc. B Boil. Sci. 1998, 265, 71–77. [Google Scholar] [CrossRef] [PubMed]
- Cufflin, M.P.; Mallen, E.A.H. Blur adaptation: Clinical and refractive considerations. Clin. Exp. Optom. 2020, 103, 104–111. [Google Scholar] [CrossRef]
- George, S.; Rosenfield, M. Blur Adaptation and Myopia. Optom. Vis. Sci. 2004, 81, 543–547. [Google Scholar] [CrossRef]
- Rosenfield, M.; Hong, S.E.; George, S. Blur Adaptation in Myopes. Optom. Vis. Sci. 2004, 81, 657–662. [Google Scholar] [CrossRef]
- Wang, B.; Ciuffreda, K.J.; Vasudevan, B. Effect of blur adaptation on blur sensitivity in myopes. Vis. Res. 2006, 46, 3634–3641. [Google Scholar] [CrossRef] [Green Version]
- Boettner, E.; Wolter, R. Transmission of the ocular media. Investig. Opthalmol. Vis. Sci. 1962, 1, 776–783. [Google Scholar]
- Navarro, R. Incorporation of intraocular scattering in schematic eye models. J. Opt. Soc. Am. A 1985, 2, 1891–1894. [Google Scholar] [CrossRef] [PubMed] [Green Version]
- Westheimer, G.; Liang, J. Evaluating diffusion of light in the eye by objective means. Investig. Ophthalmol. Vis. Sci. 1994, 35, 2652–2657. [Google Scholar]
- Piñero, D.P.; Ortiz, D.; Alio, J.L. Ocular Scattering. Optom Vis. Sci. 2010, 87, E682–E696. [Google Scholar] [CrossRef]
- Arias, A.; Ginis, H.; Artal, P. Light scattering in the human eye modelled as random phase perturbations. Biomed. Opt. Express 2018, 9, 2664–2670. [Google Scholar] [CrossRef]
- Berg, T.J.T.P.V.D. Analysis of Intraocular Straylight, Especially in Relation to Age. Optom. Vis. Sci. 1995, 72, 52–59. [Google Scholar] [CrossRef]
- Van der Meulen, I.J.; Gjertsen, J.; Kruijt, B.; Witmer, J.P.; Rulo, A.; Schlingemann, R.O.; Berg, T.J.V.D. Straylight measurements as an indication for cataract surgery. J. Cataract. Refract. Surg. 2012, 38, 840–848. [Google Scholar] [CrossRef]
- Papageorgiou, E.; Asproudis, I.; Maconachie, G.; Tsironi, E.E.; Gottlob, I. The treatment of amblyopia: Current practice and emerging trends. Graefe’s Arch. Clin. Exp. Ophthalmol. 2019, 257, 1061–1078. [Google Scholar] [CrossRef]
- Odell, N.V.; Leske, D.A.; Hatt, S.; Adams, W.E.; Holmes, J.M. The effect of Bangerter filters on optotype acuity, Vernier acuity, and contrast sensitivity. J. Am. Assoc. Pediatr. Ophthalmol. Strabismus 2008, 12, 555–559. [Google Scholar] [CrossRef] [Green Version]
- Agervi, P. Treatment with Bangerter filters. J. Am. Assoc. Pediatr. Ophthalmol. Strabismus 2011, 15, 121–122. [Google Scholar] [CrossRef]
- Chen, Z.; Li, J.; Thompson, B.; Deng, D.; Yuan, J.; Chan, L.; Hess, R.F.; Yu, M. The Effect of Bangerter Filters on Binocular Function in Observers with Amblyopia. Investig. Opthalmol. Vis. Sci. 2014, 56, 139–149. [Google Scholar] [CrossRef] [Green Version]
- Agervi, P.; Kugelberg, U.; Kugelberg, M.; Simonsson, G.; Fornander, M.; Zetterström, C. Treatment of Anisometropic Amblyopia with Spectacles or in Combination with Translucent Bangerter Filters. Ophthalmology 2009, 116, 1475–1480. [Google Scholar] [CrossRef]
- Pérez, G.M.; Archer, S.M.; Artal, P. Optical Characterization of Bangerter Foils. Investig. Opthalmol. Vis. Sci. 2010, 51, 609–613. [Google Scholar] [CrossRef] [PubMed] [Green Version]
- Rutstein, R.P.; Foster, N.C.; Cotter, S.A.; Kraker, R.T.; Lee, D.H.; Melia, M.; Quinn, G.E.; Tamkins, S.M.; Wallace, D.K. Visual acuity through Bangerter filters in nonamblyopic eyes. J. Am. Assoc. Pediatr. Ophthalmol. Strabismus 2011, 15, 131–134. [Google Scholar] [CrossRef] [Green Version]
- Castro-Torres, J.J.; Martino, F.; Casares-López, M.; Ortiz-Peregrina, S.; Ortiz, C. Visual performance after the deterioration of retinal image quality: Induced forward scattering using Bangerter foils and fog filters. Biomed. Opt. Express 2021, 12, 2902–2918. [Google Scholar] [CrossRef]
- Bach, M. The Freiburg Visual Acuity Test-Variability unchanged by post-hoc re-analysis. Graefe’s Arch. Clin. Exp. Ophthalmol. 2007, 245, 965–971. [Google Scholar] [CrossRef] [PubMed]
- Rosser, D.A.; Murdoch, I.E.; Cousens, S.N. The effect of optical defocus on the test-retest variability of visual acuity measurements. Investig. Opthalmol. Vis. Sci. 2004, 45, 1076–1079. [Google Scholar] [CrossRef] [Green Version]
- Carkeet, A.; Lee, L.; Kerr, J.R.; Keung, M.M. The Slope of the Psychometric Function for Bailey-Lovie Letter Charts: Defocus Effects and Implications for Modeling Letter-By-Letter Scores. Optom. Vis. Sci. 2001, 78, 113–121. [Google Scholar] [CrossRef]
- Raasch, T.W. Spherocylindrical Refractive Errors and Visual Acuity. Optom. Vis. Sci. 1995, 72, 272–275. [Google Scholar] [CrossRef]
- Smith, G. Relation between Spherical Refractive Error and Visual Acuity. Optom. Vis. Sci. 1991, 68, 591–598. [Google Scholar] [CrossRef]
- Blendowske, R. Unaided visual acuity and blur: A simple model. Optom. Vis. Sci. 2015, 92, 21–25. [Google Scholar] [CrossRef] [Green Version]
- Suchkov, N.; Fernández, E.J.; Artal, P. Impact of longitudinal chromatic aberration on through-focus visual acuity. Opt. Express 2019, 27, 35935–35947. [Google Scholar] [CrossRef] [PubMed]
- Fernández, E.J.; Suchkov, N.; Artal, P. Adaptation to the eye’s chromatic aberration measured with an adaptive optics visual simulator. Opt. Express. 2020, 28, 37450–37458. [Google Scholar] [CrossRef]
- Watson, A.B.; Yellott, J. A unified formula for light-adapted pupil size. J. Vis. 2012, 12, 12. [Google Scholar] [CrossRef]
- Gholami, S.; Reus, N.J.; Berg, T.J.V.D. The significance of changes in pupil size during straylight measurement and with varying environmental illuminance. J. Optom. 2018, 11, 167–173. [Google Scholar] [CrossRef]
- Heinrich, S.P.; Strübin, I. Use of diffusing filters for artificially reducing visual acuity when testing equipment and procedures. Doc. Ophthalmol. 2019, 140, 83–93. [Google Scholar] [CrossRef] [PubMed]
Figure 1.
Flux diagram showing the protocol followed during the experiment. Both groups of subjects (control and Bangerter ones) followed the same experimental sequence, keeping time points between measurements. In the case of the control group, no filters were used at any time point.
Figure 1.
Flux diagram showing the protocol followed during the experiment. Both groups of subjects (control and Bangerter ones) followed the same experimental sequence, keeping time points between measurements. In the case of the control group, no filters were used at any time point.

Figure 2.
Values of spherical equivalent refractive errors for all participants (randomly numbered) involved in this study. Blue and red symbols represent control and BF subjects, respectively.
Figure 2.
Values of spherical equivalent refractive errors for all participants (randomly numbered) involved in this study. Blue and red symbols represent control and BF subjects, respectively.

Figure 3.
VA1 values for the CG (blue symbols) and the BFG (red symbols).

Figure 4.
VA values as a function of time. For every time point, each symbol represents the mean across all CG subjects. Error bars represent the standard deviation.
Figure 4.
VA values as a function of time. For every time point, each symbol represents the mean across all CG subjects. Error bars represent the standard deviation.

Figure 5.
Mean VA values for the CG along the entire experiment. Each symbol is the mean across all time points.
Figure 5.
Mean VA values for the CG along the entire experiment. Each symbol is the mean across all time points.

Figure 6.
Relationship between VA1–VA2 and refraction for subjects within the BFG (red symbols) and the CG (blue symbols). For the BFG, the line represents the best linear fit (VA1–VA2 = 0.12 ∗ SE + 1.16).
Figure 6.
Relationship between VA1–VA2 and refraction for subjects within the BFG (red symbols) and the CG (blue symbols). For the BFG, the line represents the best linear fit (VA1–VA2 = 0.12 ∗ SE + 1.16).

Figure 7.
VA3 vs. VA2 values for all BF subjects. The black line represents the best linear fit to the data (VA3 = 0.71 ∗ VA2 + 0.23).
Figure 7.
VA3 vs. VA2 values for all BF subjects. The black line represents the best linear fit to the data (VA3 = 0.71 ∗ VA2 + 0.23).

Figure 8.
Relationship between VA4 and VA1 for all subjects of the BFG. Best linear fit to the data: VA4 = 0.64 ∗ VA1 + 0.36).
Figure 8.
Relationship between VA4 and VA1 for all subjects of the BFG. Best linear fit to the data: VA4 = 0.64 ∗ VA1 + 0.36).

Figure 9.
Averaged VA values at every experimental condition for the subjects of BFG. Error bars indicate the standard deviation. (***: p < 0.0001; *: p < 0.01). The time period among VA measurements is the same as in Figure 4.
Figure 9.
Averaged VA values at every experimental condition for the subjects of BFG. Error bars indicate the standard deviation. (***: p < 0.0001; *: p < 0.01). The time period among VA measurements is the same as in Figure 4.

Figure 10.
Comparison of spherical equivalent (a) and keratometric values (b) before and after BF wearing (i.e., just subjects from BFG). Black solid lines correspond to the best linear fits (SEpost = 0.96 ∗ SEpre − 0.13 and Kpost = 0.96 ∗ Kpre + 1.91, respectively).
Figure 10.
Comparison of spherical equivalent (a) and keratometric values (b) before and after BF wearing (i.e., just subjects from BFG). Black solid lines correspond to the best linear fits (SEpost = 0.96 ∗ SEpre − 0.13 and Kpost = 0.96 ∗ Kpre + 1.91, respectively).

Publisher’s Note: MDPI stays neutral with regard to jurisdictional claims in published maps and institutional affiliations. |
© 2021 by the authors. Licensee MDPI, Basel, Switzerland. This article is an open access article distributed under the terms and conditions of the Creative Commons Attribution (CC BY) license (https://creativecommons.org/licenses/by/4.0/).
Share and Cite
MDPI and ACS Style
Villa-Carpes, J.A.; Bueno, J.M.; Fernández, E.J. Visual Adaptation to Scattering in Myopes. Photonics 2021, 8, 274. https://0-doi-org.brum.beds.ac.uk/10.3390/photonics8070274
AMA Style
Villa-Carpes JA, Bueno JM, Fernández EJ. Visual Adaptation to Scattering in Myopes. Photonics. 2021; 8(7):274. https://0-doi-org.brum.beds.ac.uk/10.3390/photonics8070274
Chicago/Turabian StyleVilla-Carpes, José A., Juan M. Bueno, and Enrique J. Fernández. 2021. "Visual Adaptation to Scattering in Myopes" Photonics 8, no. 7: 274. https://0-doi-org.brum.beds.ac.uk/10.3390/photonics8070274
Note that from the first issue of 2016, this journal uses article numbers instead of page numbers. See further details here.