Patent Portfolio Analysis of the Synergy between Machine Learning and Photonics


Science and Technology Policy Research and Information Center National Applied Research Laboratories, Taipei 10663, Taiwan
Photonics 2022, 9(1), 33; https://0-doi-org.brum.beds.ac.uk/10.3390/photonics9010033
Submission received: 28 November 2021
/
Revised: 5 January 2022
/
Accepted: 5 January 2022
/
Published: 7 January 2022
(This article belongs to the Special Issue The Interplay between Photonics and Machine Learning)
Abstract
:Machine learning in photonics has potential in many industries. However, research on patent portfolios is still lacking. The purpose of this study was to assess the status of machine learning in photonics technology and patent portfolios and investigate major assignees to generate a better understanding of the developmental trends of machine learning in photonics. This can provide governments and industry with a resource for planning strategic development. I used data-mining methods (correspondence analysis and K-means clustering) to explore competing technological and strategic-group relationships within the field of machine learning in photonics. The data were granted patents in the USPTO database from 2019 to 2020. The results reveal that patents were primarily in image data processing, electronic digital data processing, wireless communication networks, and healthcare informatics and diagnosis. I assessed the relative technological advantages of various assignees and propose policy recommendations for technology development.
1. Introduction
In recent years, scholars have focused on combining machine learning and photonics [1,2,3]. Machine learning is used in the field of optics for identifying abstract features and extraction characteristics, such as the generation and imaging of holograms, nonparametric reconstruction of digital holography, and prediction of the resonance curves of spectra. In recent years, machine learning has proven to have excellent performance in decoding complicated data; it can rapidly and accurately analyze spectra and images [2] and has many applications in different fields. In addition, scholars have proposed replacing conventional electronic technology with photonic technology to develop faster and more energy-efficient computing systems. These systems can be used in the processing and storing of data, artificial intelligence (AI), and machine learning. Photonic neuromorphic computers use neuromorphic photonics and can transmit and process signals within subnanoseconds, thereby increasing the speed of the processor and reducing energy loss [4].
In conclusion, combining machine learning and photonics has become a new field of research [5]. Scholars have focused on the applications of combining machine learning and photonics, such as optical communication, semiconductors, and image processing. In addition, they have started to develop faster and more effective neural networks using photonic technology and experimentally verified the results; in one study, computing speed and efficiency increased greatly by using light instead of electricity [6]. The application of machine learning in the field of photonics has improved the performance of machine learning and AI.
More studies are starting to focus on the development of machine learning in photonics [7,8]. However, these studies have focused on algorithm technologies [2,9,10,11] or specific applications [1,3,6,11,12,13], such as machine learning-based optical data decoding [2], machine learning techniques for computing various optical properties [1], and a fully optical neural network that increases the computational speed and power efficiency of state-of-the-art electronics for conventional inference tasks [6]. Some studies have examined the developmental potential of machine learning in photonics [14,15,16,17]. They did not study the topic from a macro perspective or indicate the individual positioning of technology distribution and technology developers of machine learning in photonics. Specifically, no study has examined technological fields that employ the synergy between machine learning and photonics and the technological advantages of various assignees. Accordingly, this study investigated these topics through patent portfolio analysis.
This study explored the status of technology distribution and technology developers—namely, the current development focus of this technology. This study employed patent analysis to analyze and compare the focus of each technology developer, along with correspondence analysis and K-means clustering. The patent analysis focused on the United States Patent and Trademark Office (USPTO) database from 2019 to 2020. First, this study analyzed the mainstream technology of machine learning in photonics to understand current developments of the technology. Next, this study analyzed the main assignees and patent portfolios and identified different strategic groups to clarify the trends and positioning of technology developers. This study used the patent portfolio figure to understand the relationship between assignees and technology and used the intuitive effect of the geometric figure to effectively present and reveal the technology portfolio of technology developers, to provide information to serve as a reference for government policies.
2. Literature Review
2.1. Current Developments in Machine Learning in Photonics
The field of photonics has developed rapidly in recent years. Photonics has been combined with machine learning algorithms and optical systems to add new functions to optical systems and improve the performance of optical systems. This development has generated new research foci [1,4,18], such as the design and operation of pulsed lasers and the characterization and control of ultrafast propagation dynamics [18]. Computer calculation abilities improved dramatically after graphical processing units began to be used in nongraphic calculations, and this trend accelerated after the 2010s. This trend has resulted in engineers focusing on the development of electronic hardware accelerators of machine learning, such as Google’s Tensor Processing Unit (TPU). Current machine learning processors are limited by the electricity required to process data when executing complicated operations. In general, more complicated data require more electricity and result in slower electronic data transmission. Therefore, past studies have used light to replace electricity for calculations. The neural network TPU uses photons instead of electrons to overcome these limitations and create a stronger and more energy-efficient AI [19]. In addition, AI plays a crucial role in the optical communication industry, such as optical network planning and operation in both transport and access networks [20]. Therefore, combining machine learning and photonics and improving hardware performance is a future research direction.
Past AI deployment in photonics has spawned much research activity. AI has a certain synergy with photonics, especially in terms of power efficiency and parallelism. Two major directions exist in applying machine learning to photonics. One of the two main directions is using AI algorithms, implemented on conventional computers, to design optical structures and devices with improved, task-specific performance. The other perhaps more ambitious direction is the attempt to implement AI computation using optical systems rather than electronic ones [21]. Now that semiconductor features have shrunk to nanometer scale and room is running out for Moore’s law to continue to hold, a new generation of integrated photonics could boost the speed and processing power of AI beyond what electronics can provide [15]. The combination of machine learning and photonics has considerable potential in technological development and market applications. This study used patent analysis to identify the technological positioning of technology developers. The following section explains the patent analysis method.
2.2. Patent Analysis
Patent analysis analyzes and compares different types of patent data to clarify the innovative activities in the industry [22]. Patent analysis can reveal current technological developments, stimulate new technological solutions, demonstrate the relationship between technologies, and motivate investment policies [23]. Patent analysis can also help researchers understand the current research foci of different inventive organizations and provide a basis for the analysis of technological trends [24]. Patent analysis can involve statistical calculations of the external characteristic indices of patent documents, such as analyzing the number of patents or using the contents of patent documents to perform analysis by grouping technological characteristics [25].
Past studies related to machine learning in photonics have focused on algorithm technologies [2,10] or current developments and applications [1,3,6] and rarely explored and classified the knowledge or patents of machine learning in photonics. Machine learning in photonics is an interdisciplinary field that combines computer science, communication, and optics, and technological exploration of the different aspects of the industry is essential for its development. Past studies have used patent analysis to perform technological grouping and determine the technological development trend and model of industries involving many fields [26,27,28]. Patent analysis was also used to create a knowledge framework for biomedical three-dimensional printing (3D printing) [29]. This study used patent analysis to explore the technology distribution of machine learning in photonics and create a patent map. Few patent maps of machine learning in photonics currently exist, particularly for the technological positioning of technology developers; therefore, this study created a patent map to serve as a reference for government and industry.
3. Research Design
3.1. Search Strategy and Data Source
The United States is the largest business transaction market in the world and has a long history; its system development and data can be traced back to 1975 [30]. Therefore, this study selected data from the USPTO database to perform data analysis. The data were granted patents in the USPTO database from 2019 to 2020. This study used Derwent smart search to perform a patent search. Derwent smart search is a keyword searching method. Hundreds of experts read the official public patent data in the patent database, translated the data, rewrote the abstracts, corrected the contents, and normalized the assignees, after which they recorded the rewritten and normalized data back into the database and created the Derwent smart search. In order to find the intersection of machine learning and photonics, the search criteria were that the patent contained two topics, including machine learning and photonics. The search criteria of this study were as follows: (SSTO/Machine Learning) and (SSTO/photonics); smart search-topic (SSTO) refers to Derwent smart search. Data related to machine learning and photonics were extracted from patent documents; the technological data for both topics were explored through SSTO analysis. The search results obtained 821 patents.
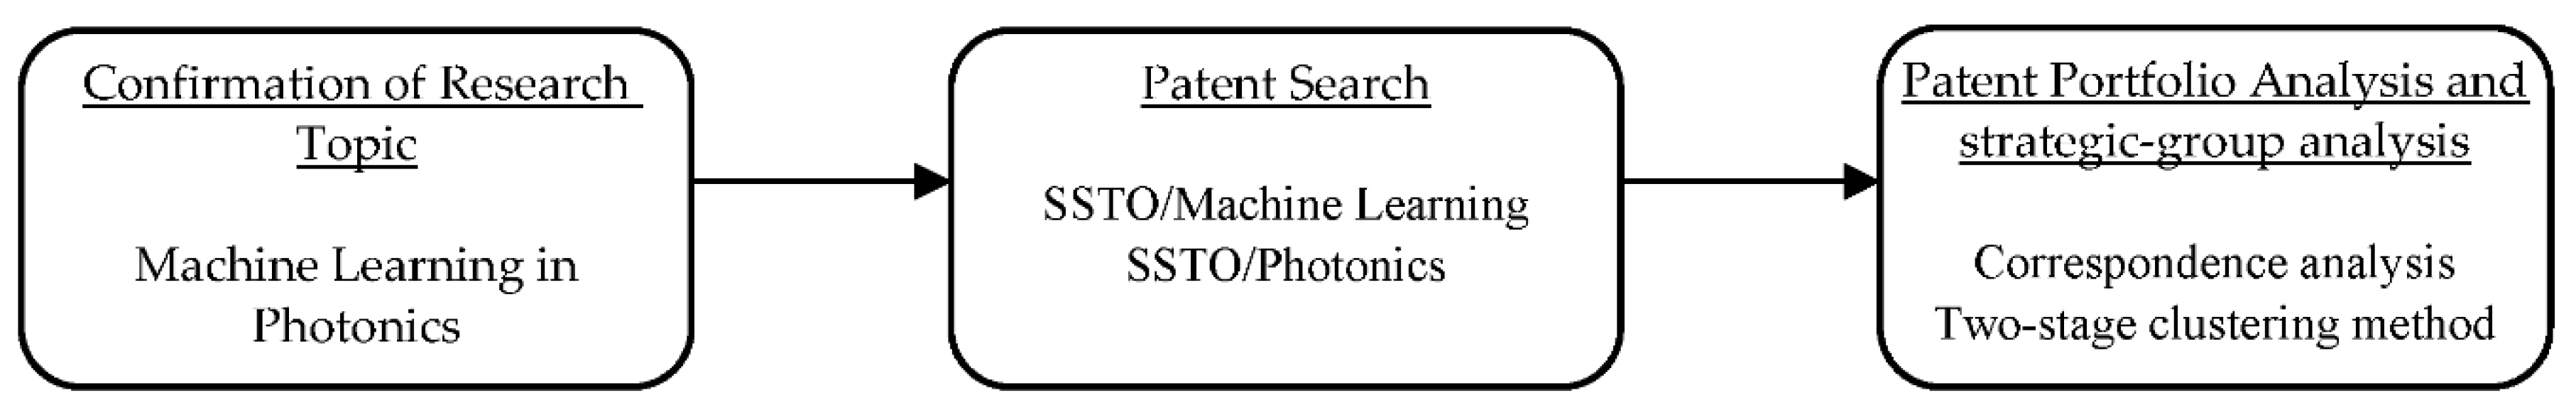
This framework is presented in Figure 1, and it describes the process of the study in detail. After the topics and patent search direction of this study were confirmed, the patent search began. The data acquired from the patent search were analyzed to identify mainstream technological trends. Subsequently, correspondence and clustering analyses were performed on these findings for patent portfolio and strategic group analyses (Figure 1).
3.2. Correspondence Analysis
Correspondence analysis uses a low-dimensional perceptual map to process categorical variables, analyze the relative position of studied targets, and present the relationship between related attributes [31]. Correspondence analysis uses figures to present the data in a cross tabulation. It considers multiple categorical variables simultaneously and presents the relationship between the variables. In addition, it uses points to present the ratio of the elements in the rows and columns of the cross tabulation in a lower dimensionality. In other words, correspondence analysis can change the frequency of the cross tabulation into a ratio and calculate the corresponding relationship. This study used two-stage cluster analysis to classify the assignees and the international patent classification (IPC) numbers and used the coordinates obtained from the correspondence analysis in the cluster analysis to perform grouping. The spatial positions were used to determine the patent portfolio and clustering of the assignees.
This study used correspondence analysis to analyze machine learning in photonics; the categorical variables were assignees and IPC numbers. Next, the perceptual map of the correspondence map was used to demonstrate the relationships among the assignees and the relationships between the assignees and IPC numbers. Assignees with a closer distribution signify that they have more patents on similar technologies and can be classified into the same group. An assignee with a closer distance to an IPC number signifies that the assignee has a superior number of patents in that IPC category.
4. Results
4.1. Patent Search Results
To understand current technological developments, the patent search results must be analyzed prior to the correspondence analysis and cluster analysis. Table 1 presents the top ten three-level IPC numbers related to machine learning and photonics. Table 1 shows a comprehensive overview of the IPC distribution of the patents.
The data presented in Table 1 reveal that technologies are concentrated around G06T, G06F, G02B, A61B, G06K, H04L, and H04N. G06T concerns image data processing or generation; G06F concerns electric digital data processing; G02B concerns optical elements, systems, or apparatus; A61B concerns diagnosis, surgery, and identification; G06K concerns the recognition of data; H04L concerns the transmission of digital information; and H04N concerns pictorial communication. The technologies related to machine learning and photonics mainly involve image processing, computing, and medical applications; optical components (G06T, G06F, G02B, A61B, G06K, H04N); and digital information transmission and data processing methods (H04L, G06N, G16H, G06Q) (Table 1). Appendix A displays the definition of IPC categories.
The results of the analysis of the top ten assignees are listed in Table 2. It shows the top ten assignees with the highest number of patents. The results indicate that AT&T Intellectual Property (San Antonio, TX, USA) has the highest number of granted patents; it innovates in the development of communications. In the era of Internet of Things, optical communication and machine learning have become the primary means to improve communication transmission. AT&T Intellectual Property owns a large number of patents and patent portfolios used in the field of communications. AT&T Intellectual Property is followed by Intel Corporation (Santa Clara, CA, USA), Magic Leap (Plantation, FL, USA), and International Business Machines Corporation (Armonk, NY, USA), in that order; they are three leading companies of global smart software, augmented reality devices, and related services. This study indicates that these companies prioritize not only AI development but also the synergy between machine learning and photonics. Microsoft Technology Licensing (Redmond, DC, USA) is responsible for authorizing the patents of Microsoft and those of related technologies companies. As a computer technology company, Microsoft has dedicated itself to integrating machine learning into photonics to create Computer Vision, which visualizes the world. The top ten assignees were mostly related to optical communication and equipment (such as AT&T Intellectual Property), smart computing (such as Intel, Magic Leap (Plantation, FL, USA), International Business Machines, and Microsoft Technology Licensing (Redmond, DC, USA)), medical applications involving machine learning and photonics (such as HeartFlow (Redwood City, CA, USA) and Align Technology (San Jose, CA, USA)), and academic institutions that utilize machine learning and photonics (such as California Institute of Technology (Pasadena, CA, USA)) (Table 2).
4.2. Patent Portfolio Positioning Analysis
This study used correspondence analysis to perform patent portfolio positioning analysis. Past scholars have used correspondence analysis to study the distribution of ecosystems [32], brand positioning [33], applications of medical management [34], and innovation management strategies [35]. This study used assignees and IPC numbers as categorical variables and selected data of the top ten assignees in machine learning in photonics patents; these patents were distributed over 77 classes of the three-level IPC patents and are related to diverse technological fields.
Sometimes the positioning figure of the correspondence analysis cannot completely explain the relationship between the variables, particularly when too many variables exist and overlap or blur the figure, resulting in difficulty in understanding the figure. Therefore, this study used correspondence–cluster analysis to clarify the relationship and connection between multiple variables and classes; the original data were quantified with correspondence analysis, and cluster analysis was used to conduct research [36].
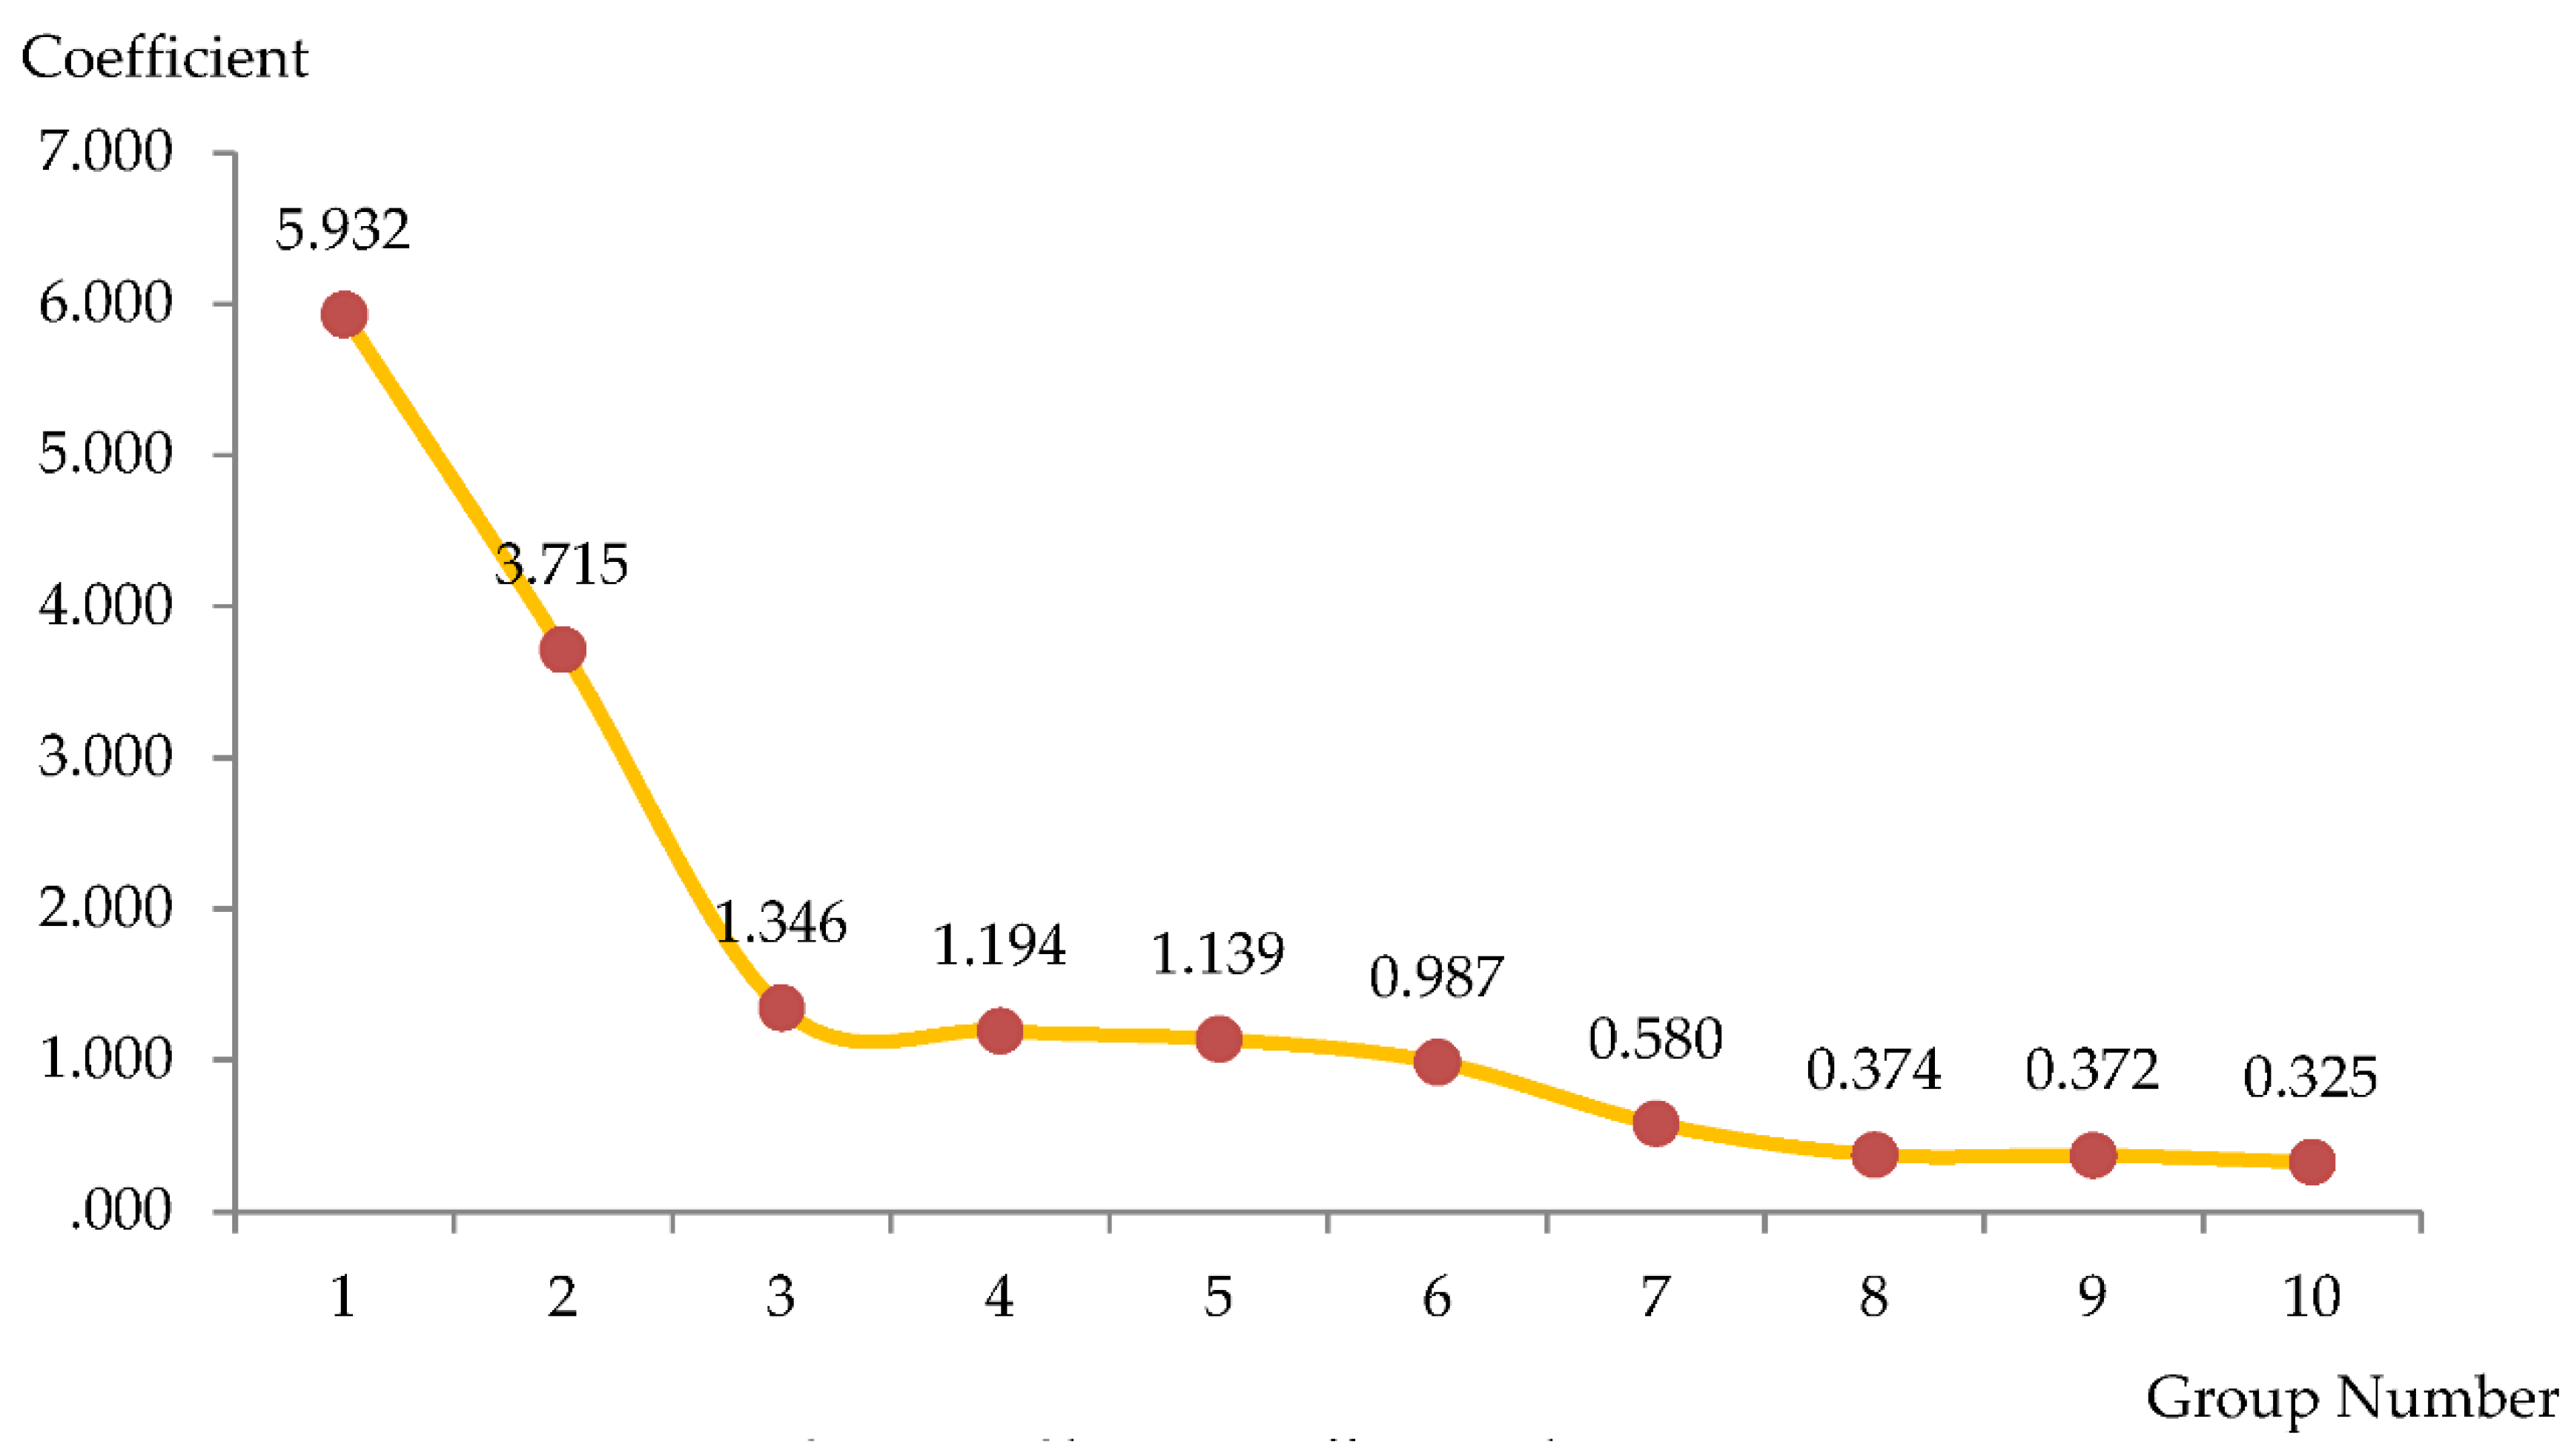
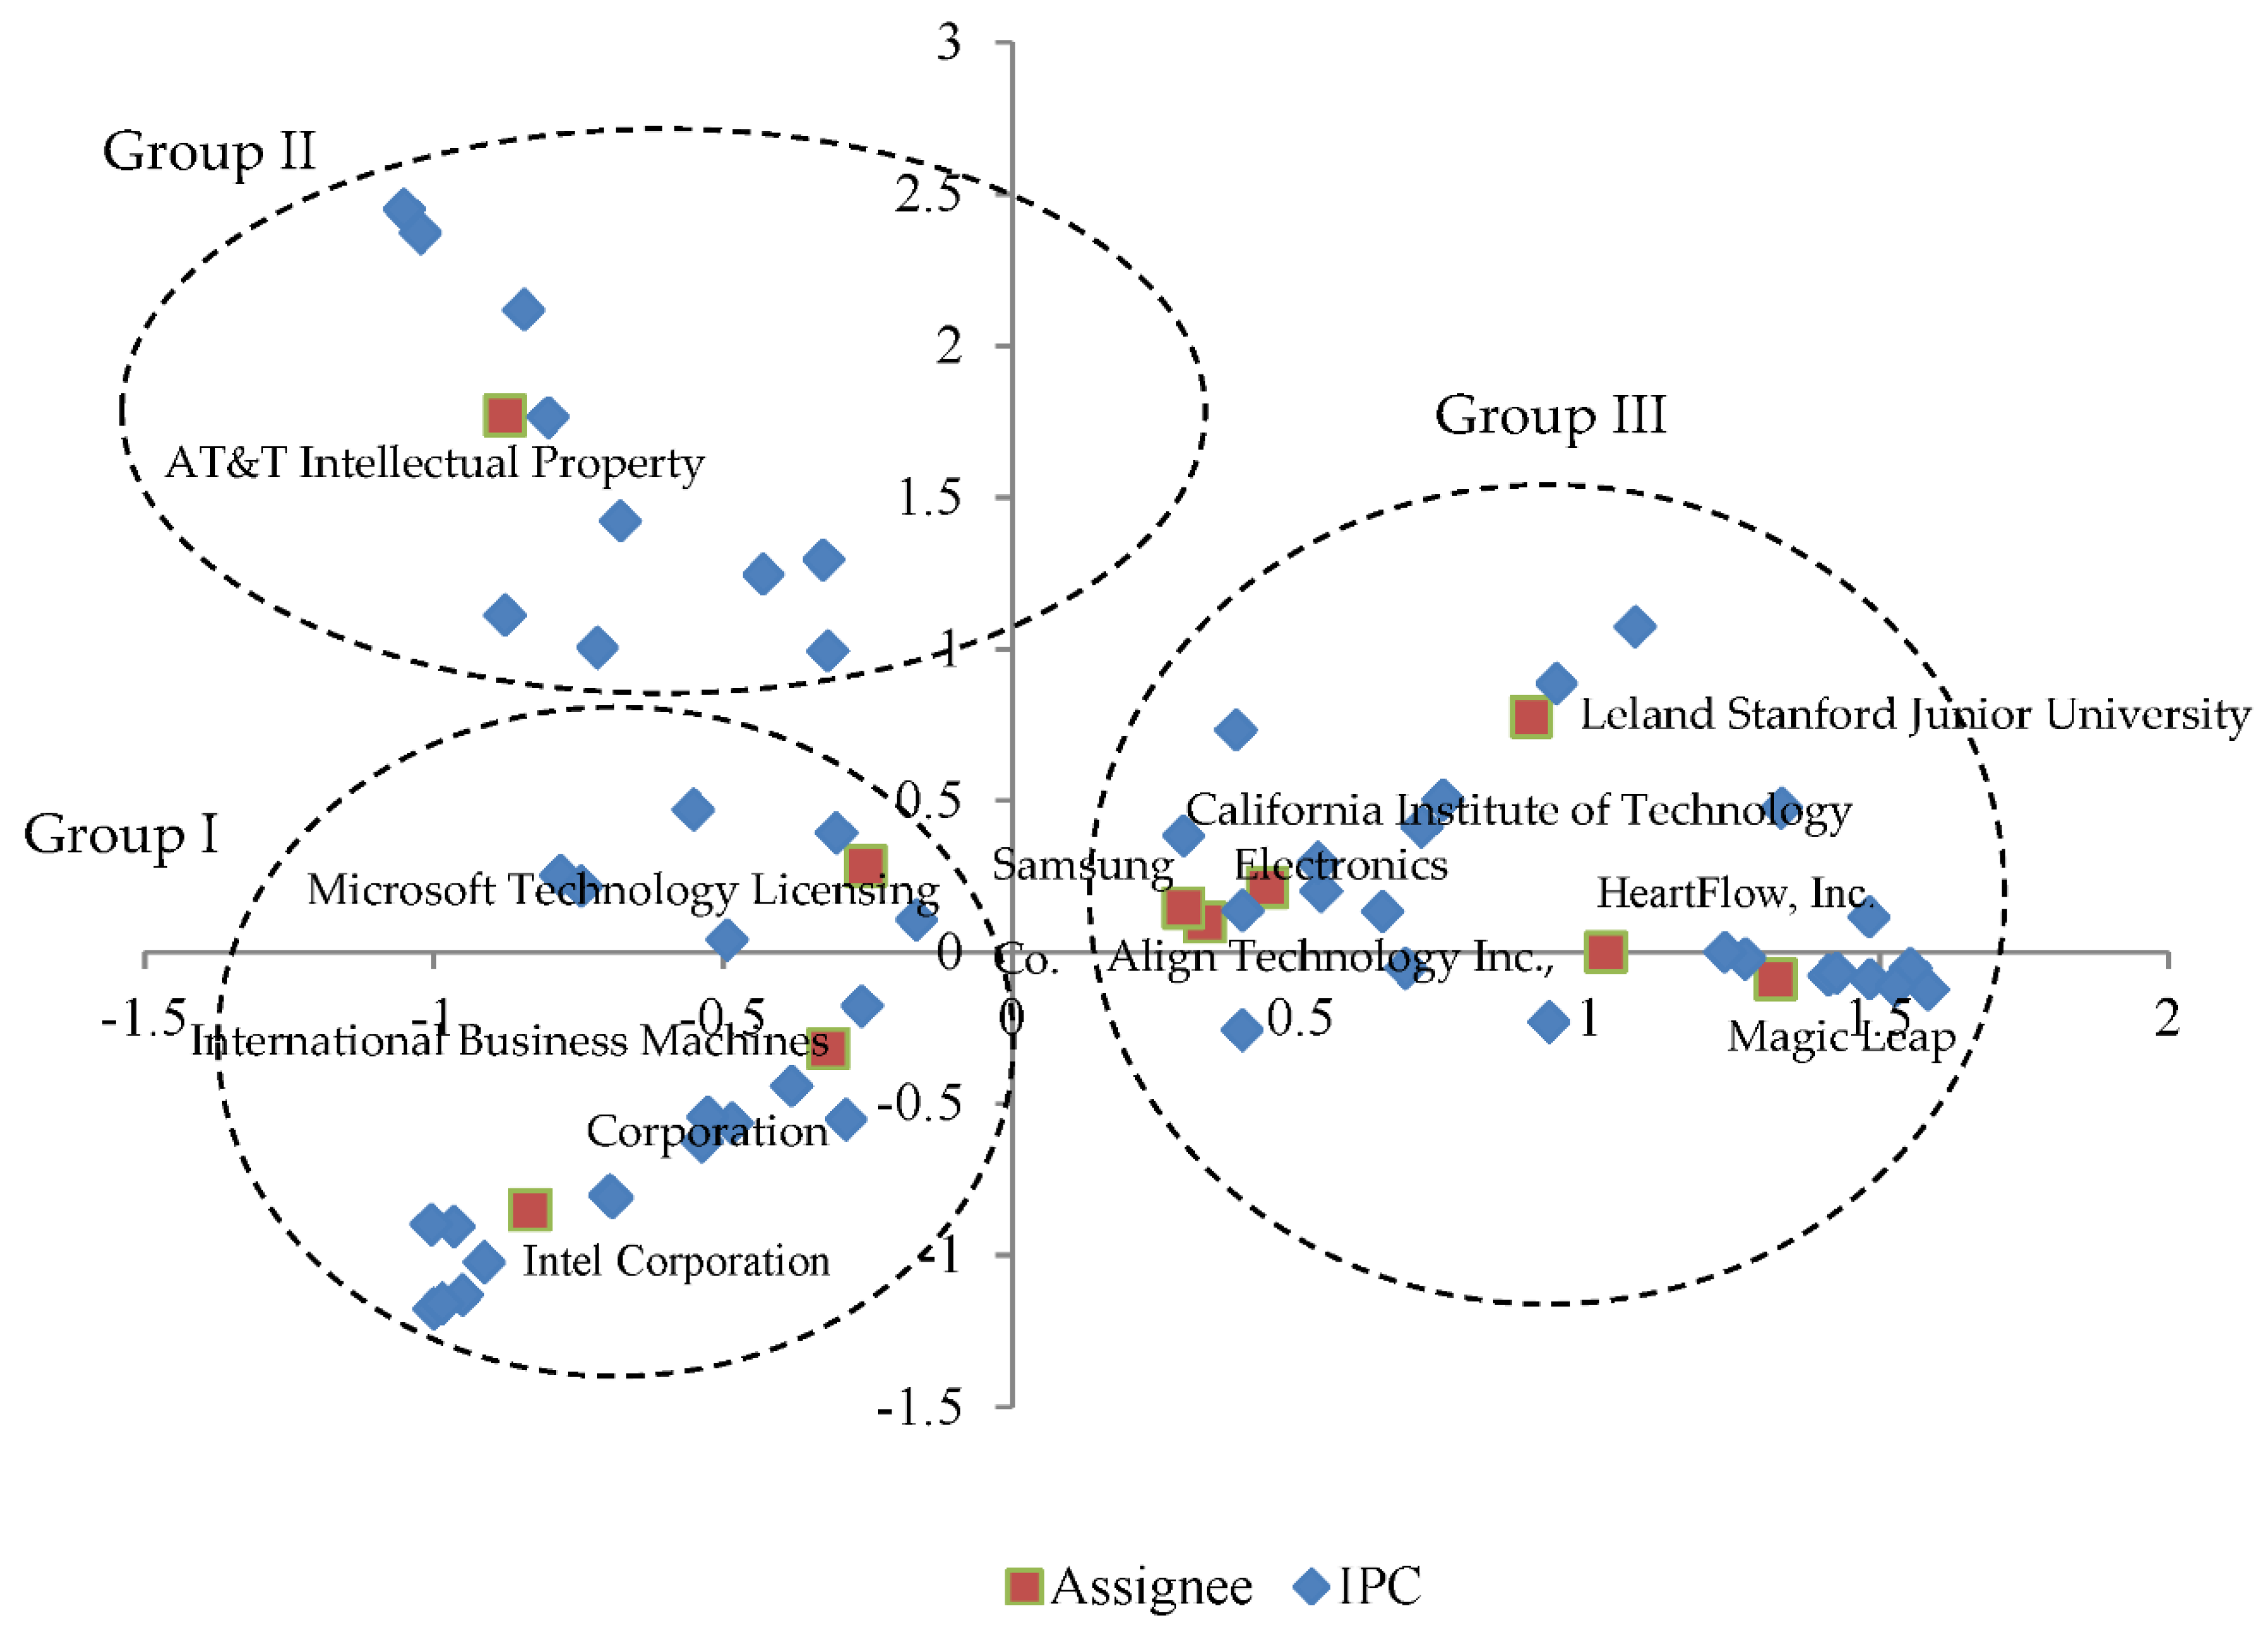
This study used a two-stage clustering method by splitting the clustering calculations into two stages. The first stage involved using the hierarchical clustering method to collect the agglomeration schedule of the samples during merging to observe the clustering process. Next, the cluster distance coefficient was used as the standard to determine the number of clusters. After the optimal number of clusters was decided, the second stage used the nonhierarchical clustering method to perform clustering. The results are displayed in Figure 2. Figure 2 reveals the cluster distance coefficients for different numbers of clusters. The cluster distance coefficients were used to determine the number of clusters. The coefficients underwent the most considerable change when the number of clusters changed from three groups to two groups, which signifies that more effort is required to merge three groups into two groups. Therefore, the optimal number of groups was determined to be three groups based on the coefficient changes. Next, the K-means cluster method divided the top ten assignees and 77 IPC patent classes into three groups. The grouped patent portfolios of assignees and IPC numbers of machine learning in photonics are illustrated in Figure 3. It reveals the visual results of correspondence analysis and cluster analysis. The axes represent the two main factors determined through principal component analysis, and the axis scores are presented as x and y coordinates on a 2-dimensional plane. Table 3 shows the coordinates of each assignee in Figure 3. Table 4 demonstrates the main members of each group.
Figure 3, Table 3 and Table 4 indicate that most assignees are in Group III, which signifies that most assignees have achieved similar developments in machine learning in photonics technologies. These main developments include image data processing (G06T), optical elements, systems, or apparatuses (G02B), healthcare informatics and diagnosis (G16H, A61B), and recognition of data (G16H). In addition, International Business Machines Corporation, Intel Corporation, and Microsoft Technology Licensing have similar positions in the machine learning in photonics patent portfolio, and their patents are mainly related to electric digital data processing (G06F), the transmission of digital information (H04L), computer systems based on specific computational models (G06N), commercial data processing methods (G06Q), and coding (H03M). AT&T Intellectual Property is related to transmission (H04B), wireless communication networks (H04W), antennas (H01Q), and waveguides (H01P); it focuses on technologies related to wireless communication.
4.3. Post analysis: Change in Number of Patents and Papers
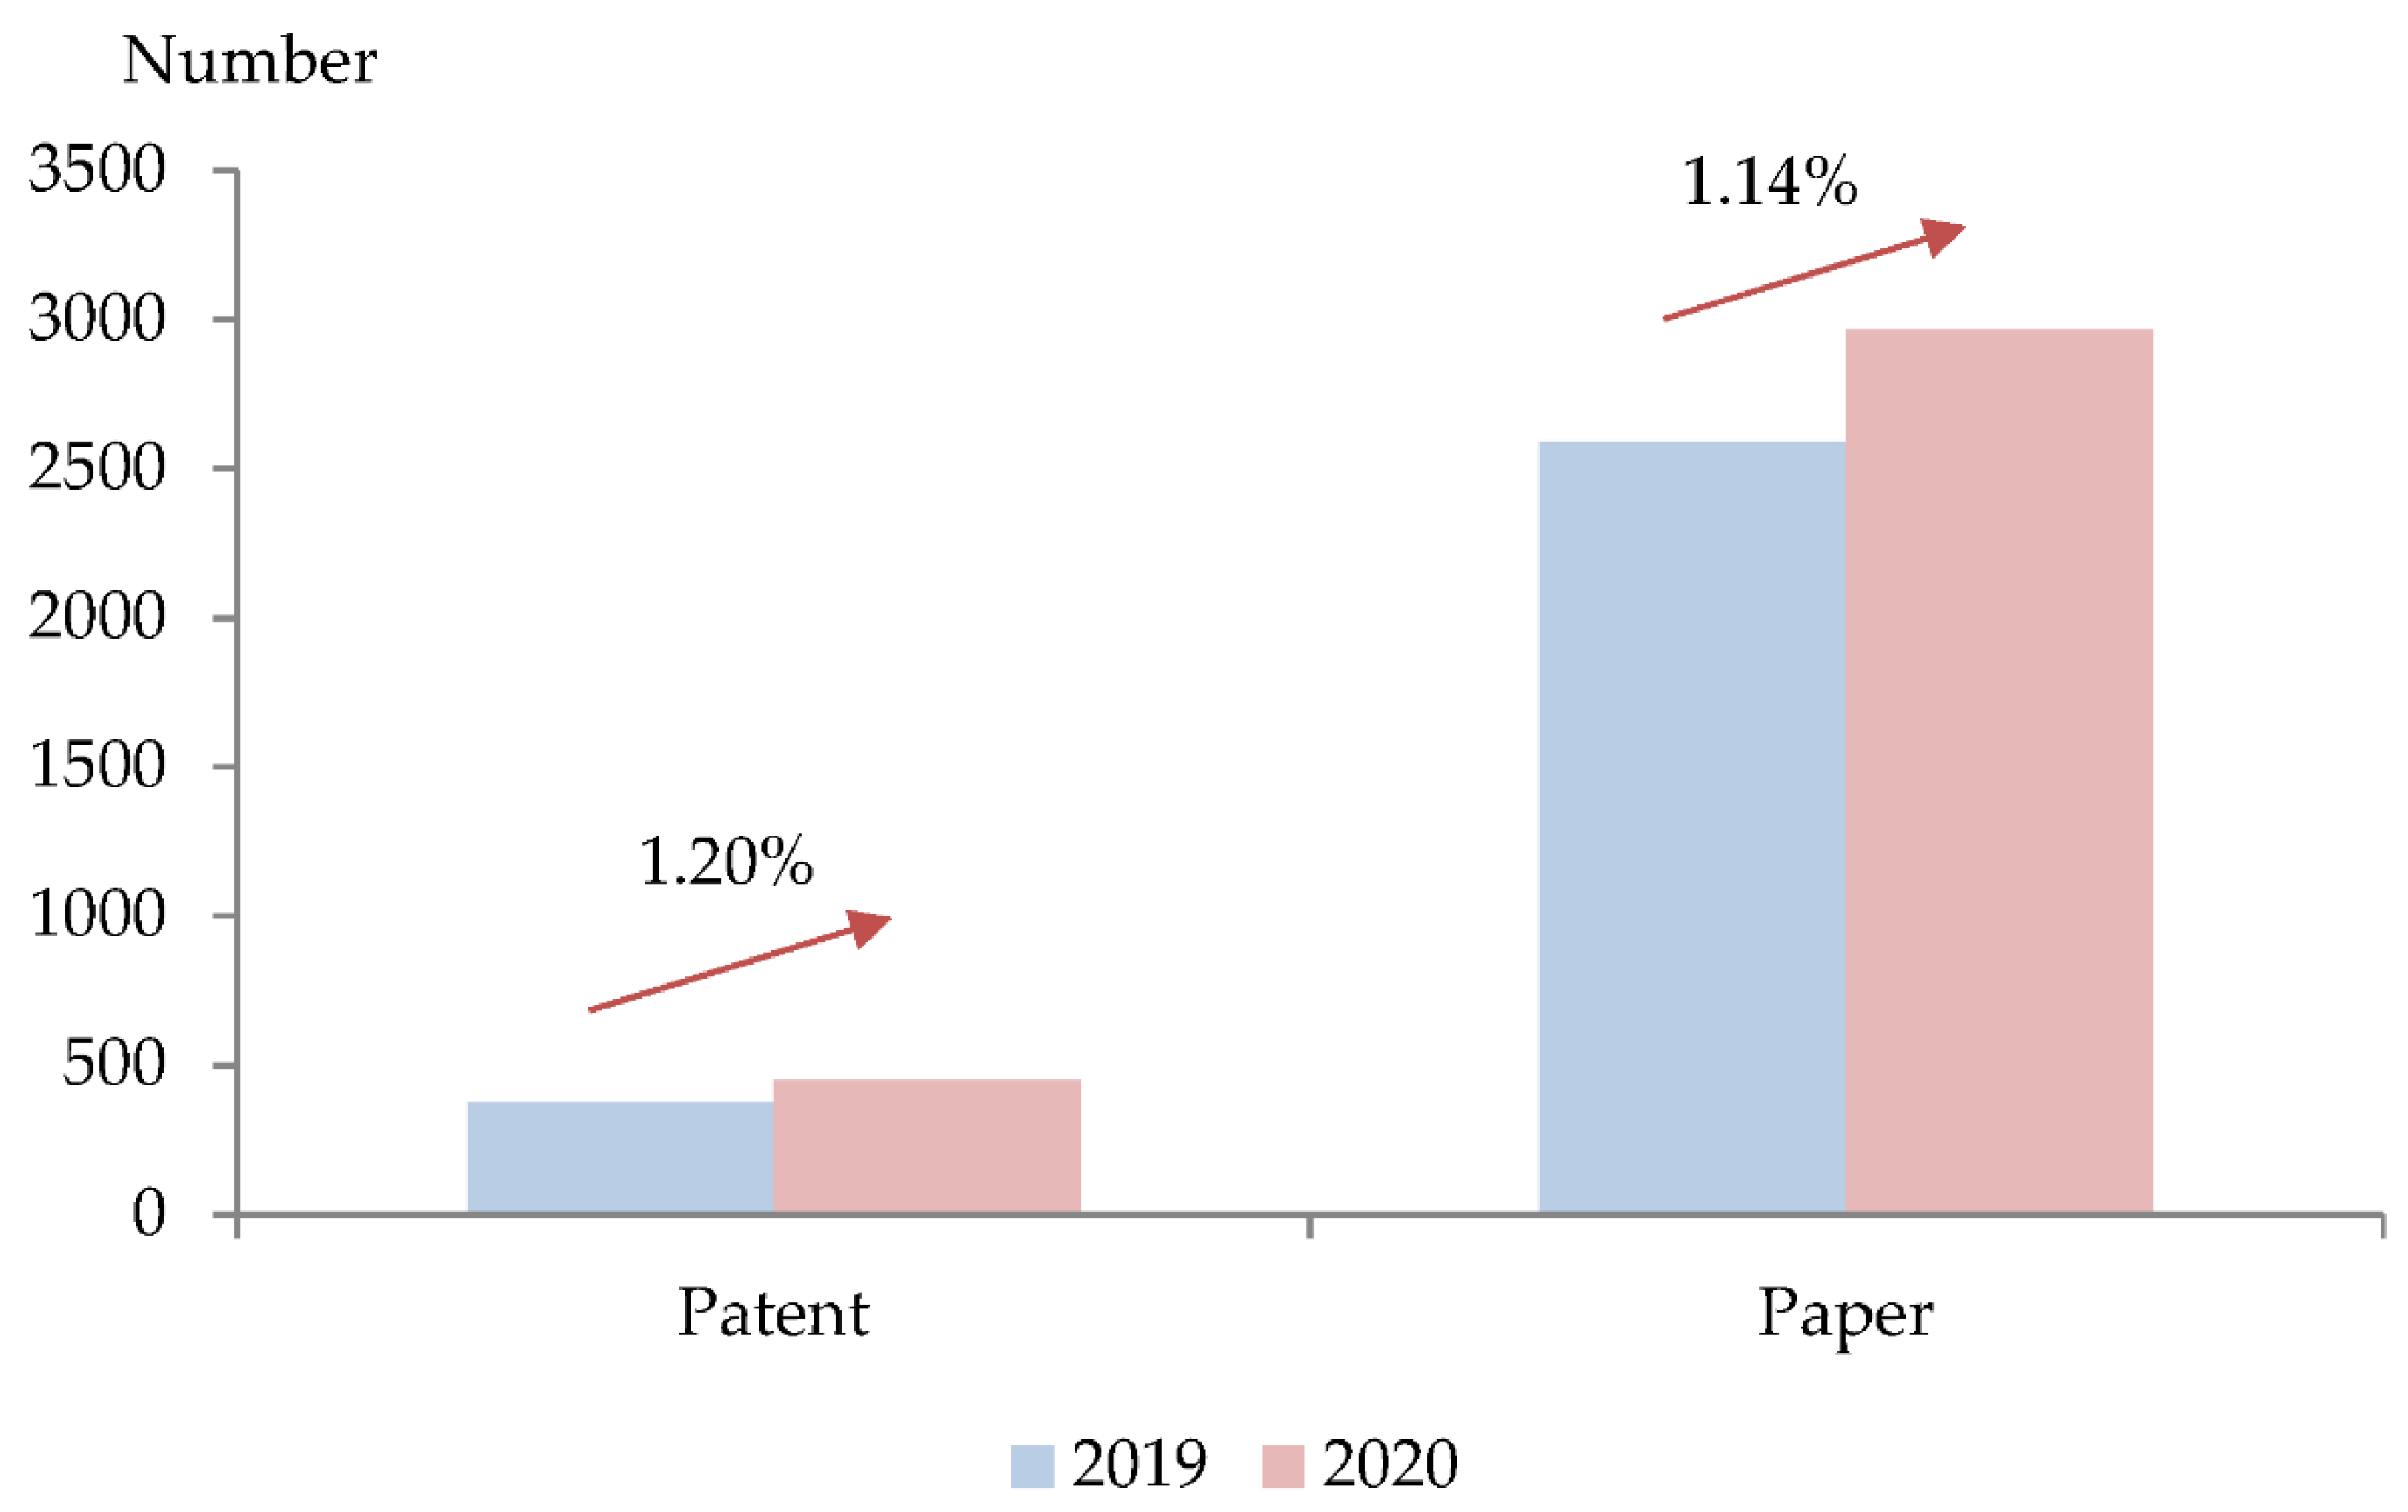
The relationship between number of published papers and number of patents was further investigated to identify developmental trends in machine learning in photonics. Web of Science (WOS) was used to search relevant papers with the following criteria: ((TTL/machine learning) or (ABST/machine learning) or (KW/machine learning)) and ((TTL/photonics) or (ABST/photonics) or (KW/photonics)). TTL, ABST, and KW indicate titles, abstracts, and keywords, respectively. Figure 4 presents the change in number of patents and papers.
Patents and papers on machine learning in photonics have received increasing attention, and the increase in the number of patents (1.20%) is similar to that of papers (1.14%).
5. Conclusions
5.1. Discussion and Implications
This study used correspondence analysis and cluster analysis to explore the mainstream technologies of machine learning in photonics and conduct patent portfolio analysis. The empirical results indicate that the mainstream technologies include image data and electric digital data processing, optical elements, wireless communication networks, and healthcare informatics and diagnosis; these technologies are not located within a specific field. In addition, the main developers of machine learning in photonics are leading companies of information and communication technology (ICT), wafers, and smart software and services. These companies include AT&T Intellectual Property, Intel Corporation, International Business Machines Corporation, Microsoft Technology Licensing, and Samsung Electronics Co., Ltd. Magic Leap focuses on augmented reality technologies that map the light field into the retina. California Institute of Technology and Leland Stanford Junior University (Stanford University) (Stanford, CA, USA) are known in academia for their natural sciences, engineering, and entrepreneurial atmospheres. HeartFlow, Inc. and Align Technology Inc. are devoted to using deep learning technologies to develop innovative medical materials. In conclusion, companies concerned with ICT, wafers, and medical materials, along with academia, all play a crucial role in the development of new technologies of machine learning in photonics. Governments should consider allocating more research funds to academia to support technological developments in this field.
A field that is being developed by more companies is more competitive. Align Technology Inc., California Institute of Technology, HeartFlow, Inc., Magic Leap, Samsung Electronics Co., Ltd., and Stanford University are all investing in research in image data processing and optical elements, systems, or apparatuses. Therefore, these fields are more competitive. The main company investing in research and development in wireless communication networks is AT&T Intellectual Property, which signifies that this field is relatively less competitive. Conventional information technology companies such as International Business Machines Corporation, Intel Corporation, and Microsoft Technology Licensing focus on electric digital data processing and specific computational models, such as computer systems based on biological models.
The analysis demonstrated that the synergy between the technological development of machine learning and photonics is centralized on optical communication equipment, smart computing, and medical applications. The use of machine learning and photonics increased communication efficiency and improved the performance of artificial intelligence and quality of medical diagnosis. In addition, the patent portfolio positioning analysis demonstrated that academic institutions among the top ten assignees, such as California Institute of Technology and Leland Stanford Junior University, were grouped in the same cluster as firms related to medical applications, such as HeartFlow and Align Technology. This suggests that academic institutions have a strong interest in the integration of machine learning and photonics in the field of medicine. Subsequent studies can investigate patents in academia.
In terms of the theoretical contributions of this study, past studies of machine learning in photonics focused on algorithm technologies [2,9,10,11] or specific applications [1,3,6,11,12,13]; however, they did not determine the technology distribution or the patent portfolio of technology developers from a macro perspective. This study revealed the distribution of primary technology and positioning of patentees in the synergy between machine learning and photonics. In addition, this study identified mainstream technological trends in photonics machine learning and strategies and positioning in the patent layout to provide reference for enterprises to devise patent layout strategies, identify investment opportunities, and develop the industry strategically. Few studies have investigated the patent layout and patentee positioning in the synergy between machine learning and photonics. Machine learning in photonics will become indispensable, and analyzing the distribution of its technology is crucial and was therefore the motivation for this study. This study bridged this research gap and used a new perspective to explore the technological foci of each technology developer.
This study proposes a technology road map of machine learning in photonics. The conclusions of this study can be used by businesses to allocate their research and development resources and used by the government to promote new technologies. More attention is required on companies and academia involved in photonics, applications of machine learning, and the usage of photonics to improve the performance of AI. This study determined that current research on machine learning in photonics was related to image data processing, electric digital data processing, wireless communication networks, and healthcare informatics and diagnosis. Therefore, the government can provide funding to train researchers in these fields to improve the future development of the photonics industry.
5.2. Limitations and Future Research Directions
First, this study generalized the developments of each assignee in the three-level IPC. Future studies can conduct further research in each essential direction. For example, future studies can perform four-level IPC analysis or use more combinations of patent variables, such as inventor and nationality, to acquire additional patent information. Second, patent portfolio analysis was performed through correspondence analysis and K-means clustering. Subsequent studies should use WOS, in which a cluster with specific densities for research items and available patents can be created to acquire detailed information. Future studies can use different patent searches or search criteria, such as including triadic patent family data, to reveal crucial patent information. Due to limitations on the human resources and funding of this study, this study only used the USPTO database as a data source. The present patent analysis focused on a limited geographical and temporal segment. Subsequent studies should include other data sources, such as the European Patent Office, the Japan Patent Office, arXiv for articles, and preprints for existing patents, to draw informative conclusions.
Funding
This research was funded by the Ministry of Science and Technology of the Taiwan, grant number MOST 109-2410-H-492-001.
Acknowledgments
The author would like to thank the Ministry of Science and Technology of the Taiwan for financially supporting this research under Contract No. MOST 109-2410-H-492-001.
Conflicts of Interest
The author declare no conflict of interest.
Appendix A

Table A1.
Definition of IPC categories.
| IPC Categories | Meaning |
|---|---|
| A61B | Diagnosis; surgery; identification |
| G02B | Optical elements, systems, or apparatus |
| G06F | Electric digital data processing |
| G06K | Recognition of data; presentation of data; record carriers; handling record carriers |
| G06T | Image data processing or generation, in general |
| H01P | Waveguides; resonators, lines, or other devices of the waveguide type |
| H01Q | Antennas, i.e., radio aerials |
| H03M | Coding, decoding, or code conversion, in general |
| H04B | Transmission |
| H04L | Transmission of digital information, e.g., telegraphic communication |
| H04N | Pictorial communication, e.g., television |
| H04W | Wireless communication networks |
| G06N | Computer systems based on specific computational models |
| G06Q | Data processing systems or methods, specially adapted for administrative, commercial, financial, managerial, supervisory, or forecasting purposes; systems or methods specially adapted for administrative, commercial, financial, managerial, supervisory. or forecasting purposes, not otherwise provided for |
| G06T | Image data processing or generation, in general |
| G16H | Healthcare informatics, i.e., information and communication technology (ICT) specially adapted for the handling or processing of medical or healthcare data |
References
- Chugh, S.; Gulistan, A.; Ghosh, S.; Rahman, B.M.A. Machine learning approach for computing optical properties of a photonic crystal fiber. Opt. Express 2019, 27, 36414–36425. [Google Scholar] [CrossRef] [Green Version]
- Fang, J.; Swain, A.; Unni, R.; Zheng, Y. Decoding optical data with machine learning. Laser Photonics Rev. 2021, 15, 2000422. [Google Scholar] [CrossRef]
- Palai, G.; Patra, T.K.; Behera, S. Realization of fluoride sensor using two dimensional photonic structures and machine learning model. Microsyst. Technol. 2021, 27, 2761–2772. [Google Scholar] [CrossRef]
- Bhavin, J.S.; Alexander, N.T.; de Lima, T.F.; Pernice, W.H.P.; Bhaskaran, H.; David, W.; Prucnal, P.R. Photonics for artificial intelligence and neuromorphic computing. Nat. Photonics 2021, 15, 102–114. [Google Scholar]
- He, J.; Lee, J.; Kandeepan, S.; Wang, K. Machine learning techniques in radio-over-fiber systems and networks. Photonics 2020, 7, 105. [Google Scholar] [CrossRef]
- Shen, Y.; Harris, N.C.; Skirlo, S.; Prabhu, M.; Baehr-Jones, T.; Hochberg, M.; Sun, X.; Zhao, S.; Larochelle, H.; Englund, D.; et al. Deep learning with coherent nanophotonic circuits. Nat. Photonics 2017, 11, 441–446. [Google Scholar] [CrossRef]
- Awais, M.; Raza, M.; Ashraf, M.I.; Song, J. Experimental demonstration and performance enhancement of 5G NR multiband radio over fiber system using optimized digital predistortion. Appl. Sci. 2021, 11, 11624. [Google Scholar]
- Liu, S.; Mididoddi, C.K.; Zhou, H.; Li, B.; Xu, W.; Wang, C. Single-shot sub-nyquist RF signal reconstruction based on deep learning network. In Proceedings of the 2018 International Topical Meeting on Microwave Photonics (MWP), Toulouse, France, 22–25 October 2018; pp. 1–4. [Google Scholar]
- Hadi, M.U.; Awais, M.; Raza, M.; Khurshid, K.; Jung, H. Neural network DPD for aggrandizing SM-VCSEL-SSMF-based radio over fiber link performance. Photonics 2021, 8, 19. [Google Scholar] [CrossRef]
- Melnikov, A.A.; Nautrup, H.P.; Dunjko, V.; Tiersch, M.; Briegel, H.J.; Krenn, M.; Zeilinger, A. Active learning machine learns to create new quantum experiments. Proc. Natl. Acad. Sci. USA 2018, 115, 1221–1226. [Google Scholar] [CrossRef] [Green Version]
- Psaltis, D.; Sideris, A.; Yamamura, A.A. A multilayered neural network controller. IEEE Control Syst. Mag. 1988, 8, 17–21. [Google Scholar] [CrossRef]
- Hadi, M.U.; Murtaza, G. Enhancing distributed feedback-standard single mode fiber-radio over fiber links performance by neural network digital predistortion. Microw. Opt. Technol. Lett. 2021, 63, 1558–1565. [Google Scholar] [CrossRef]
- Liu, S.; Xu, M.; Wang, J.; Lu, F.; Zhang, W.; Tian, H.; Chang, G. A multilevel artificial neural network nonlinear equalizer for millimeter-wave mobile fronthaul systems. J. Lightwave Technol. 2017, 35, 4406–4417. [Google Scholar] [CrossRef]
- Boltasseva, A.; Shalaev, V.; Kudyshev, Z. Advancing photonics with machine learning. In Photonic and Phononic Properties of Engineered Nanostructures XI; SPIE: Bellingham, WA, USA, 2021; Volume 11694, p. 116940L. [Google Scholar]
- Hecht, J. Artificial intelligence: How photonic integration can boost artificial intelligence. Laser Focus World 2021, 57, 36–41. [Google Scholar]
- Musumeci, F.; Rottondi, C.; Nag, A.; Macaluso, I.; Zibar, D.; Ruffini, M.; Tornatore, M. An overview on application of machine learning techniques in optical networks. IEEE Commun. Surv. Tutor. 2019, 21, 1383–1408. [Google Scholar] [CrossRef] [Green Version]
- Sun, S.; Narayana, V.K.; Miscuglio, M.; Kimerling, L.C.; El-Ghazawi, T.; Sorger, V.J. CLEAR: A holistic figure-of-merit for post- and predicting electronic and photonic-based compute-system evolution. Sci. Rep. 2020, 10, 6482. [Google Scholar] [CrossRef] [Green Version]
- Genty, G.; Salmela, L.; Dudley, J.M.; Brunner, D.; Kokhanovskiy, A.; Kobtsev, S.; Turitsyn, S.K. Machine learning and applications in ultrafast photonics. Nat. Photonics 2021, 15, 91–101. [Google Scholar] [CrossRef]
- Miscuglio, M.; Sorge, V.J. Photonic tensor cores for machine learning. Appl. Phys. Rev. 2020, 7, 031404. [Google Scholar] [CrossRef]
- Mata, J.; de Miguel, I.; Durán, R.J.; Merayo, N.; Singh, S.K.; Jukan, A.; Chamania, M. Artificial intelligence (AI) methods in optical networks: A comprehensive survey. Opt. Switch. Netw. 2018, 28, 43–57. [Google Scholar] [CrossRef]
- Editorial. Rise of the learning machines. Nat. Photonics 2021, 15, 65. [Google Scholar] [CrossRef]
- Kim, K.; Jung, S.; Hwang, J. Technology convergence capability and firm innovation in the manufacturing sector: An approach based on patent network analysis. R&D Manag. 2019, 49, 595–606. [Google Scholar]
- Matricano, D. The effect of R&D investments, highly skilled employees, and patents on the performance of Italian innovative startups. Technol. Anal. Strateg. Manag. 2020, 32, 1195–1208. [Google Scholar]
- Abbas, Z.; Yong, L.; Li, Y.; Wang, R. Patent-based trend analysis for advanced thermal energy storage technologies and their applications. Int. J. Energy Res. 2020, 44, 5093–5116. [Google Scholar] [CrossRef]
- Huang, J.Y. An analysis of the intellectual structure of the cloud patents of SaaS. Technol. Anal. Strateg. Manag. 2017, 29, 917–931. [Google Scholar] [CrossRef]
- Konski, A.F.; Spielthenner, D.J.F. Stem cell patents: A landscape analysis. Nat. Biotechnol. 2009, 27, 722–726. [Google Scholar] [CrossRef] [PubMed]
- Liu, L.; Li, Y.; Xiong, Y.; Cavallucci, D. A new function-based patent knowledge retrieval tool for conceptual design of innovative products. Comput. Ind. 2020, 115, 103154. [Google Scholar] [CrossRef]
- Sung, H.Y.; Yeh, H.Y.; Lin, J.K.; Chen, S.H. A visualization tool of patent topic evolution using a growing cell structure neural network. Scientometrics 2017, 111, 1267–1285. [Google Scholar] [CrossRef]
- Trappey, A.J.C.; Trappey, C.V.; Lee, K.L.C. Tracing the evolution of biomedical 3D printing technology using ontology-based patent concept analysis. Technol. Anal. Strateg. Manag. 2017, 29, 339–352. [Google Scholar] [CrossRef]
- Bass, S.D.; Kurgan, L.A. Discovery of factors influencing patent value based on machine learning in patents in the field of nanotechnology. Scientometrics 2010, 82, 217–241. [Google Scholar] [CrossRef]
- Greenacre, M. (Ed.) Correspondence Analysis in Practice; Chapman & Hall/CRC: New York, NY, USA, 2007. [Google Scholar]
- van Dam, A.; Dekker, M.; Morales-Castilla, I.; Rodríguez, M.Á.; Wichmann, D.; Baudena, M. Correspondence analysis, spectral clustering and graph embedding: Applications to ecology and economic complexity. Sci. Rep. 2021, 11, 8926. [Google Scholar] [CrossRef] [PubMed]
- Hanna, S.; Rowley, J. The projected destination brand personalities of European capital cities and their positioning. J. Mark. Manag. 2019, 35, 1135–1158. [Google Scholar] [CrossRef]
- Nava-Doctor, J.E.; Sandoval-Ruiz, C.A.; Fernández-Crispín, A. Knowledge, attitudes, and practices regarding vector-borne diseases in central Mexico. J. Ethnobiol. Ethnomedicine 2021, 17, 45. [Google Scholar] [CrossRef] [PubMed]
- Páez-Avilés, C.; Juanola-Feliu, E.; Samitier, J. Cross-fertilization of key enabling technologies: An empirical study of nanotechnology-related projects based on innovation management strategies. J. Eng. Technol. Manag. 2018, 49, 22–45. [Google Scholar] [CrossRef]
- Wen, C.H.; Chen, W.Y. Using multiple correspondence cluster analysis to map the competitive position of airlines. J. Air Transp. Manag. 2011, 17, 302–304. [Google Scholar] [CrossRef]
Figure 1.
Analysis of patent portfolio of machine learning in photonics.

Figure 2.
Cluster coefficient change.

Figure 3.
Grouped patent portfolios of machine learning in photonics.

Figure 4.
Number of patents and papers in 2019 and 2020.

Table 1.
Top ten three-level IPC numbers related to machine learning and photonics.
| Ranking | IPC Number | Quantity | Percentage |
|---|---|---|---|
| 1 | G06T | 212 | 7.11% |
| 2 | G06F | 197 | 6.61% |
| 3 | G02B | 172 | 5.77% |
| 4 | A61B | 162 | 5.44% |
| 5 | G06K | 137 | 4.60% |
| 6 | H04L | 134 | 4.50% |
| 7 | H04N | 110 | 3.69% |
| 8 | G06N | 80 | 2.68% |
| 9 | G16H | 77 | 2.58% |
| 10 | G06Q | 68 | 2.28% |
Table 2.
Number of granted patents of the top ten assignees.
| Relevance to Machine Learning and Photonics | Assignee |
|---|---|
| Optical communication equipment | AT&T Intellectual Property (81, 9.87%), Samsung Electronics Co., Ltd. (Suwon, Korea) (13, 1.58%) |
| Smart computing | Intel Corporation (56, 6.82%), Magic Leap (40, 4.87%), International Business Machines Corporation (35, 4.26%), Microsoft Technology Licensing (20, 2.44%) |
| Medical applications | HeartFlow, Inc. (15, 1.83%), Align Technology Inc. (13, 1.58%) |
| Academic institutions using machine learning and photonics | California Institute of Technology (15, 1.83%), Leland Stanford Junior University (13, 1.58%) |
Note: The first number in the bracket represents the number of patents. The second number in the bracket represents the patent share.
Table 3.
Top ten assignees.
| Assignee | x | y |
|---|---|---|
| AT&T Intellectual Property | –0.877 | 1.770 |
| Intel Corporation | –0.834 | –0.850 |
| Magic Leap | 1.320 | –0.089 |
| International Business Machines Corporation | –0.318 | –0.319 |
| Microsoft Technology Licensing | –0.253 | 0.284 |
| California Institute of Technology | 0.441 | 0.214 |
| HeartFlow, Inc. | 1.027 | –0.001 |
| Align Technology Inc. | 0.332 | 0.099 |
| Samsung Electronics Co., Ltd. | 0.296 | 0.146 |
| Leland Stanford Junior University | 0.898 | 0.776 |
Table 4.
Main members of each group.
| Group | Main Group Member | Main Patent Application Field |
|---|---|---|
| I | International Business Machines Corporation, Intel Corporation, Microsoft Technology Licensing | G06F, H04L, G06N, G06Q, H03M |
| II | AT&T Intellectual Property | H04B, H04W, H01Q, H01P |
| III | Align Technology Inc., California Institute of Technology, HeartFlow, Inc., Magic Leap, Samsung Electronics Co., Ltd., Leland Stanford Junior University | G06T, G02B, A61B, G06K, G16H |
Publisher’s Note: MDPI stays neutral with regard to jurisdictional claims in published maps and institutional affiliations. |
© 2022 by the author. Licensee MDPI, Basel, Switzerland. This article is an open access article distributed under the terms and conditions of the Creative Commons Attribution (CC BY) license (https://creativecommons.org/licenses/by/4.0/).
Share and Cite
MDPI and ACS Style
Chang, S.-H. Patent Portfolio Analysis of the Synergy between Machine Learning and Photonics. Photonics 2022, 9, 33. https://0-doi-org.brum.beds.ac.uk/10.3390/photonics9010033
AMA Style
Chang S-H. Patent Portfolio Analysis of the Synergy between Machine Learning and Photonics. Photonics. 2022; 9(1):33. https://0-doi-org.brum.beds.ac.uk/10.3390/photonics9010033
Chicago/Turabian StyleChang, Shu-Hao. 2022. "Patent Portfolio Analysis of the Synergy between Machine Learning and Photonics" Photonics 9, no. 1: 33. https://0-doi-org.brum.beds.ac.uk/10.3390/photonics9010033
Note that from the first issue of 2016, this journal uses article numbers instead of page numbers. See further details here.