Article

Understanding In Vivo Chromatic Aberrations in Pseudophakic Eyes Using on Bench and Computational Approaches

1
Institute of Optics, Spanish National Research Council (CSIC), 28006 Madrid, Spain
2
Wellman Center for Photomedicine, Massachusetts General Hospital, Harvard Medical School, Boston, MA 02139, USA
3
2EyesVision, 28760 Madrid, Spain
4
BVI Medical, 4031 Liege, Belgium
5
Department Optometry and Vision, Complutense University Madrid (UCM), 28037 Madrid, Spain
6
Miranza IOA Madrid, 28003 Madrid, Spain
7
Center for Visual Science, Department of Ophthalmology, The Institute of Optics, University of Rochester, New York, NY 14642, USA
*
Author to whom correspondence should be addressed.
Submission received: 16 February 2022 / Revised: 22 March 2022 / Accepted: 26 March 2022 / Published: 30 March 2022
(This article belongs to the Special Issue Ocular Imaging for Eye Care)

Abstract

:
Diffractive multifocal intraocular lenses (IOLs) modulate chromatic aberration and reduce it at certain distances due to interactions between the refractive and diffractive chromatic components. However, the extent to which computer modeling and on bench measurements of IOL chromatic aberration translate to chromatic aberration in patients implanted with these multifocal IOLs (MIOLs) is not yet fully understood. In this study, we compare the chromatic difference of focus and longitudinal chromatic aberrations in pseudophakic patients implanted with different IOL designs (monofocal and trifocal IOLs) and materials (hydrophobic and hydrophilic), and compared them with predictions from computer eye models and on bench measurements with the same IOLs. Patient data consisted of results from 63 pseudophakic eyes reported in four different studies and obtained psychophysically in the visual testing channel of a custom-developed polychromatic adaptive optics system. Computational predictions were obtained using ray tracing on computer eye models, and modulation transfer function (MTF) on bench measurements on physical eye models. We found that LCA (in vivo/simulated) for far vision was 1.37 ± 0.08 D/1.19 D for monofocal hydrophobic, 1.21 ± 0.08 D/0.88 D for monofocal hydrophilic, 0.99 ± 0.06 D/1.19 D for MIOL hydrophobic, and 0.82 ± 0.05 D/0.88 D for MIOL hydrophilic. For intermediate and near vision, LCA (in vivo/simulated) was 0.67 ± 0.10 D/0.75 D and 0.23 ± 0.08 D/0.19 D for MIOL hydrophobic and 0.27 ± 0.15 D/0.38 D and 0.15 ± 0.15 D/−0.13 D for MIOL hydrophilic, respectively. In conclusion, computational ray tracing and on bench measurements allowed for evaluating in vivo chromatic aberration with different materials and designs for multifocal diffractive intraocular lenses.

1. Introduction

Diffractive multifocal intraocular lenses (MIOLs) allow for modulating chromatic aberration to expand the range of vision in multifocal optical designs [1], therefore improving vision in pseudophakic eyes. However, the balance of the eye’s natural aberrations and IOL design, and their combined impact on vision are not yet fully understood. In particular, the polychromatic retinal image and visual quality are affected by interactions between monochromatic and chromatic aberrations, which are altered when the crystalline lens of the eye is replaced by an intraocular lens (IOL).
Chromatic effects in the eye arise from the wavelength-dependence of the refractive index of the ocular media [2,3,4]. In particular, chromatic dispersion causes short wavelengths to focus in front of long wavelengths, producing a chromatic difference of focus between the shorter and longer wavelengths, known as longitudinal or axial chromatic aberration (LCA) [5]. In addition, misalignments between the ocular components, the off-axis position of the fovea, and optical irregularities, result in a transversal shift of focus for different wavelengths, known as transverse chromatic aberration (TCA) [6,7,8,9,10]. Polychromatic optical quality on the phakic eye depends on the delicate balance between monochromatic and chromatic aberrations (LCA and TCA) and their interactions [10,11,12]. It is fairly accepted that LCA is rather constant across the population [4], around 2D in the visible range using subjective techniques [11] and slightly lower using reflectometric methods [13,14,15], with low inter subject variability (below ±0.10 D with both) [11]. In pseudophakic eyes, where an intraocular lens (IOL) replaces the natural crystalline lens of the eye, the amount of LCA changes [16,17,18,19], as well as the balance between ocular aberrations (mono- and chromatic) [20], and the optical performance of pseudophakic eyes implanted with monofocal IOL in polychromatic light will depend on the Abbe number of the IOL material (ranging in most of lenses from 35 to 60; the higher the Abbe number, the lower the LCA) [19,21]. Moreover, various studies report the LCA of lenses with different materials, both on bench and once implanted in the eye [16,17,18,20,22,23,24,25], with differences consistent with the Abbe number of the materials and independent of the IOL power [15]. However, the question remains about the impact on visual performance due to the significantly different phakic-pseudophakic LCA (i.e., with hydrophilic materials [15]).
In multifocal diffractive IOLs [26,27,28], both the material and the design [28,29,30,31,32] determine the through-focus visual performance (either in intraocular [33] or contact lenses [34,35]), with hybrid refractive-diffractive designs that split light energy between a number of foci, aiming at providing multifocality at the expense of reducing optical quality at all distances. In most designs, the far focus receives light that is purely refracted (0 diffraction order), whereas the other focus (intermediate and near) are generated with light refracted by the lens and diffracted by the multifocal add (first and second order of diffraction). Refractive or diffractive focalization leads to opposite signs of LCA, thus allowing modulating the chromatic aberration of the eye at different distances. Using diffractive optics, it is possible to alter [36,37] and even change the sign of the chromatic aberration induced by the lens, at least in several foci [32,38]. All patients implanted with first-generation multifocal IOLs (generally bifocal) reported good vision at far and near [39,40], but experienced a significant reduction in visual acuity at intermediate distances [41]. For this reason, state-of-the-art multifocal IOLs are generally designed to avoid the gaps of bifocal designs [42]. For this purpose, shifts in the position of the foci peaks of diffractive bifocal lenses with wavelengths have also been used as a strategy to “fill in” those intermediate distances, with lower energy contributions, and mimic an extended depth-of-focus in polychromatic light.
Evaluations of the optical through-focus performance of these MIOLs [43,44] are generally performed on bench, by measuring through-focus image quality and modulation transfer function (MTF) [37,45], from the light distribution and efficiency of the different foci [46], for different visible wavelengths. This approach allows for evaluating the LCA and through-focus energy efficiency of different designs and materials of bifocal IOLs [47], where for far-vision, the chromatic defocus due to the refractive base power was additive to the LCA of the ocular media, while in near-vision, the achromatizing effect of diffractive bifocal-IOLs compensated, in part, the natural eye’s LCA. Loicq et al. characterized on bench [38] the through-focus MTF of a trifocal diffractive IOL in red, green, and blue wavelengths (480 nm, 546 nm, and 650 nm, respectively), to obtain the chromatic difference of focus and to confirm a compensatory effect between refractive and diffractive contributions for certain foci in diffractive lenses, the actual magnitude depends on material and design. These differences in the through-focus optical performance likely reflect on the through-focus visual performance in patients. In two recent studies [48,49], we presented the subjective LCA measured in vivo in eyes implanted with the same design of trifocal diffractive IOL but different materials. In the first study, LCA was measured in 10 subjects (20 eyes) implanted with the hydrophilic trifocal diffractive IOL (FineVision POD F), at three different viewing distances (0D/+1.75D/+3.50 D) in a spectral range of 480–700 nm. We found that subjective-LCA was higher for far (0.82 ± 0.05 D) than for intermediate (0.27 ± 0.15 D) and near (0.15 ± 0.15 D) distances. Similar trends, but higher amounts of LCA, were found in a subsequent study with hydrophobic MIOLs (FineVision HP), where subjective-LCA was 0.99 ± 0.06 D, 0.67 ± 0.10 D, and 0.23 ± 0.08 D for far, intermediate, and near distances, respectively. The dependence of the magnitude of LCA on distance is in agreement with previous studies using optical simulations or on-bench measurements [32], with on-bench-LCA showing higher values than in vivo measurements, particularly for far vision. In general, we found a lower LCA magnitude for the multifocal IOLs at far, with respect to the LCA for the monofocal IOLs [15], with similar shifts in both lenses (hydrophilic 0.39 D difference and hydrophobic 0.38 D difference). A decrease was also found for double-pass results (0.16 D difference) for hydrophilic data. However differences were found with on-bench data [38] on the same MIOLs, which showed higher amounts of LCA than those for in vivo patients, where intermediate and near LCA were reduced or almost fully cancelled, respectively.
An interesting approach to address those differences is the use of computational ray tracing models to simulate the polychromatic optical quality in pseudophakic eyes implanted with an IOL. Computer eye models allowed for improving the selection of the optimal IOL power to be implanted in cataract surgery [50,51,52]. Moreover, customized eye models constructed using the anatomical parameters of individual patients have been shown to reproduce accurately the higher-order aberrations measured with an aberrometer [53,54]. Thus, these models can be used as platforms to test the polychromatic optical performance with a particular IOL design. In this study, we present the chromatic difference of focus and longitudinal chromatic aberration in 5 phakic and 63 pseudophakic eyes implanted with different IOLs designs and materials, obtained from computational ray tracing, on bench and in vivo measurements using a custom-developed polychromatic adaptive optics system across four different studies

2. Materials and Methods

Computational ray tracing, on bench calibrations and in vivo measurements, using a custom-developed polychromatic AO system, were performed in 63 eyes implanted with different IOLs designs and materials to assess multifocal pseudophakic vision.

2.1. Intraocular Lenses

Four IOLs of different designs and materials (monofocal, multifocal, hydrophobic, and hydrophilic) were evaluated in the study. Monofocal lenses were the PhysIOL PodEye double C Loop hydrophobic lens and the PhysIOL PodAY hydrophilic lens, both monofocal and aspheric. Multifocal lenses were aspheric trifocal diffractive IOLs, built with a combination of two bifocal diffractive patterns, of which one was for far and near-vision and the other for far and intermediate-vision. IOLs have a diffractive anterior surface entirely convoluted. By varying the step height of the diffractive structure of the IOL across the pupil, the energy distribution for different distances can be controlled. Indeed, the amount of energy directed to far-vision focus is superior to that directed to intermediate- and near-vision foci with increasing apertures, by means of a gradual decrease in the height of diffractive steps from the center to the periphery, which is also the case for the refractive multifocal IOL [37]. The apodized design of the lens benefits the far focus against near/intermediate focus for larger pupils. The energy balance was, as expected, wavelength-dependent, due to variations of diffraction efficiency with wavelength. The combination of the two diffractive structures provided three useful focal distances: 0.0 D for far-vision, +1.75 D addition for intermediate-vision, and +3.50 D addition for near-vision [55]. The implanted lenses were hydrophilic FineVision POD F and hydrophobic FineVision HP (POD F GF), manufactured by PhysIOL (Liege, Belgium). Figure 1 summarizes the material and designs characteristics for all IOLs (a), as well as depicts the monochromatic theoretical through-focus performance of the IOL alone in green light (546 nm), in terms of Visual Strehl for all four IOLs (b).

2.2. Computational Simulations

Pseudophakic computer eye models were implemented in OpticStudio (Zemax, Kirkland, WA, USA) and computational ray tracing was used to study the through-focus optical quality as a function of the wavelength. The chromatic difference of focus and the longitudinal chromatic aberration were calculated with different intraocular lenses. Figure 2 illustrates the computational ray tracing methodology, where a pseudophakic physiological eye model was used (Figure 2a) to simulate the IOL-on-eye. The model was based on the Liou and Brennan eye model [56], where the crystalline lens was replaced by the intraocular lens under study and the anterior chamber depth was set to 4.5 mm. The wavelength-dependent refractive index of the cornea, aqueous, and vitreous were obtained from the four-term Cauchy equations derived by Atchison and Smith [4]. The LCA of pseudophakic eye models was calculated in computational model eyes from the power differences between the peaks in the through-focus curves for different wavelengths (480, 546, and 700 nm).
The through-focus optical quality was studied with monofocal and multifocal IOL designs of hydrophobic and hydrophilic materials. MIOLs were simulated adding a flat thin phase surface representing the diffractive multifocal component to a monofocal IOL of equivalent far power. The ray tracing software was used to calculate the wave aberration with the base surface and the impacts of the rays on the IOL anterior surface for different pupil positions. A phase was added at those locations to simulate the multifocal add. The phase at each point was calculated as the difference between the multifocal surface and the base surface multiplied by the difference in refractive indices.
Retinal image quality metrics were computed for each wavelength (480–700 nm) and distance (far, intermediate, and near vision) (Figure 2b). The Point Spread Function and Modulation Transfer Function were calculated using standard Fourier Optics- based routines written in MATLAB (MathWorks, Natik, MA, USA), in a 6D focus range, in 0.1-D steps for a 4-mm pupil diameter. Retinal image quality was described in terms of the Visual Strehl ratio (VS), calculated from the wave aberration (4 mm pupil size) as the relative volume under the MTF (normalized to that of diffraction limit system) weighting the frequency components with an average neural contrast sensitivity function [57,58].

2.3. On-Bench Measurements

Through-focus optical quality for the four IOLs was obtained on bench in terms of the MTF (50 LP/mm) through-focus curves for three different wavelengths (blue: 480 nm; 546 nm; red: 650 nm), following the procedures described in Loicq et al. (2019) [38]. The optical bench used for this series of measurements was the PMTF (Power and Modulation Transfer Function bench, Lambda-X), which allowed for measurements of image quality MTF in three different monochromatic wavelengths (480 nm, 546 nm, and 650 nm). Measurements were performed with a model cornea, displaying zero spherical aberration (0 mm of longitudinal spherical aberration), to assess the optical performance of the IOLs themselves, excluding the potential influence of the cornea lens.
In the experimental setup, the tested multifocal IOL was placed in an 11.0 mm diameter lens holder before being inserted into a quartz cell filled with 0.9% aqueous sodium chloride. The anterior side of the IOL was placed facing the incident light. The lens holder guaranteed a tilt-free orientation of the IOL under inspection. The through-focus MTF curves were recorded at 50 LP/mm at a 3.0 mm aperture in three wavelengths for IOLs +20.0 D. Residual chromatic aberration generated by the optical bench was removed by subtracting the LCA contribution of the setup without any IOL (optical bench + liquid cell + NaCl solution).

2.4. In Vivo Measurements

Chromatic difference of focus (CDF) and longitudinal chromatic aberration were obtained from prior subjective measurements at different wavelengths and viewing distances in phakic and pseudophakic patients implanted with different IOLs designs and materials reported in four different studies previously published studies by our group. [11,15,48,49].
The collective data used as a reference in the current study consisted of 63 eyes, 58 implanted with IOLs of different designs and materials (monofocal, multifocal, hydrophobic, and hydrophilic) and five phakic eyes, all of which are summarized in Table 1. All patients underwent surgery at Miranza IOA (Madrid, Spain). The IOL power of the implanted IOLs ranged between 16.00 and 26.00 D. Data on the patient inclusion criteria, surgical procedure, visual outcomes, and approved protocols can be found in the corresponding studies.
LCA measurements were obtained using a custom-developed 8-channels polychromatic Adaptive Optics (AO) system at the Visual Optics and Biophotonics Laboratory (Instituto de Optica, Consejo Superior de Investigaciones Científicas), described in detail in previous publications [11,12,33,34,59]. For the purposes of the current comparison, we used data from psychophysical best focus measurements at five different wavelengths in visible light (480, 532, 555, 650, and 700 nm) at far (phakic and monofocal IOLs), and additionally at intermediate (+1.75 D) and near (+3.5 D) distances. Subjects selected the best subjective focus using a remote control to move a Badal Optometer while viewing a Maltese cross as a fixation target (1.62 deg angular subtend) displayed on a Digital Micromirror Device (DLP® Discovery™ 4100 0.7 XGA, Texas Instruments, Dallas, TX, USA), placed in a conjugate retinal plane, and illuminated with the monochromatic light from a supercontinuum laser in combination with a dual acousto-optic tunable filter. All reported measurements were performed under mydriasis (Tropicamide 1%; 2 drops 30 min prior to the beginning of the study, and 1 drop every 1 h), using fixed pupil diameters (6-mm pupils in phakic eyes and 4-mm pupils in pseudophakic eyes)

2.5. Data Analysis

Computer simulations. The chromatic difference of focus (CDF) was obtained from the focus positions of the peaks in the computed TFVS curves at different wavelengths and distances. The LCA was estimated as the chromatic difference of focus between 480 and 700 nm.
On-bench measurements. The CDF and LCA were obtained from the positions of the peaks of the MTF through-focus curves (50 LP/mm) at different wavelengths and distances. The LCA was estimated as the chromatic difference of focus between 480 and 650 nm.
In vivo measurements. Chromatic difference of focus (CDF) curves were obtained from the selected best foci (readings of the Badal optometer) at each wavelength (480–700 nm). The LCA was obtained from linear fittings to the CDF curves, as the difference of focus between 480 and 700 nm.
In all cases, the curves were shifted in the vertical axis so that they crossed zero at 550 nm (the reference wavelength) for a unique reference. Statistical analysis was performed with SPSS software (International Business Machines Corp.) to test differences in the estimated longitudinal chromatic aberration across experiments and conditions. A paired-samples t-test was performed to analyze specific differences between conditions. Standard deviation was used to test intersubject variability in the in vivo experiments.

3. Results

Computational ray tracing, on bench calibrations and in vivo measurements, using a custom-developed polychromatic adaptive optics system, in 63 eyes implanted with different IOLs designs and materials were used to assess multifocal pseudophakic vision.

3.1. Computational Ray Tracing: Polychromatic Phakic and Pseudophakic Optical Quality

Optical quality metrics were obtained using computational ray tracing for the phakic model eyes in combination with both materials and IOL designs, for blue (480 nm), green (546 nm), and red (700 nm), in the form of TF Visual Strehl curves (Figure 3a). Chromatic difference of focus was obtained from the focus positions of the peaks of the TFVS curves for the different wavelengths and distances, as shown in Figure 3b. Slopes of the CDF curves were very similar for the monofocal implanted eyes for far vision, independently of the material of the lens (Table 2), where slopes differed significantly for near vision. In intermediate vision, slopes were similar, but CDF curves differed in the red light region.
LCA (480–700 nm), obtained from the focus positions of the peaks of the TFVS curves for the different wavelengths and distances, was higher for hydrophobic than for hydrophilic material for both monofocal and multifocal IOLs for far vision (mono-hydrophobic: 1.19 D; mono-hydrophilic: 0.88 D; MIOL-hydrophobic: 1.19 D; MIOL-hydrophilic: 0.88 D), but lower than that of the phakic eye (1.13 D). A similar trend, higher LCA for hydrophobic material, was also found at intermediate and near distances (MIOL-hydrophobic: Intermediate 0.75 D and Near 0.19 D; MIOL-hydrophilic: Int 0.38 D and Near −0.13 D). These differences in the LCA of the hydrophobic and the hydrophilic lenses were determined by the different Abbe numbers of the material (LCA hydrophobic Abbe 41.91 > LCA hydrophilic Abbe 58, for far vision).

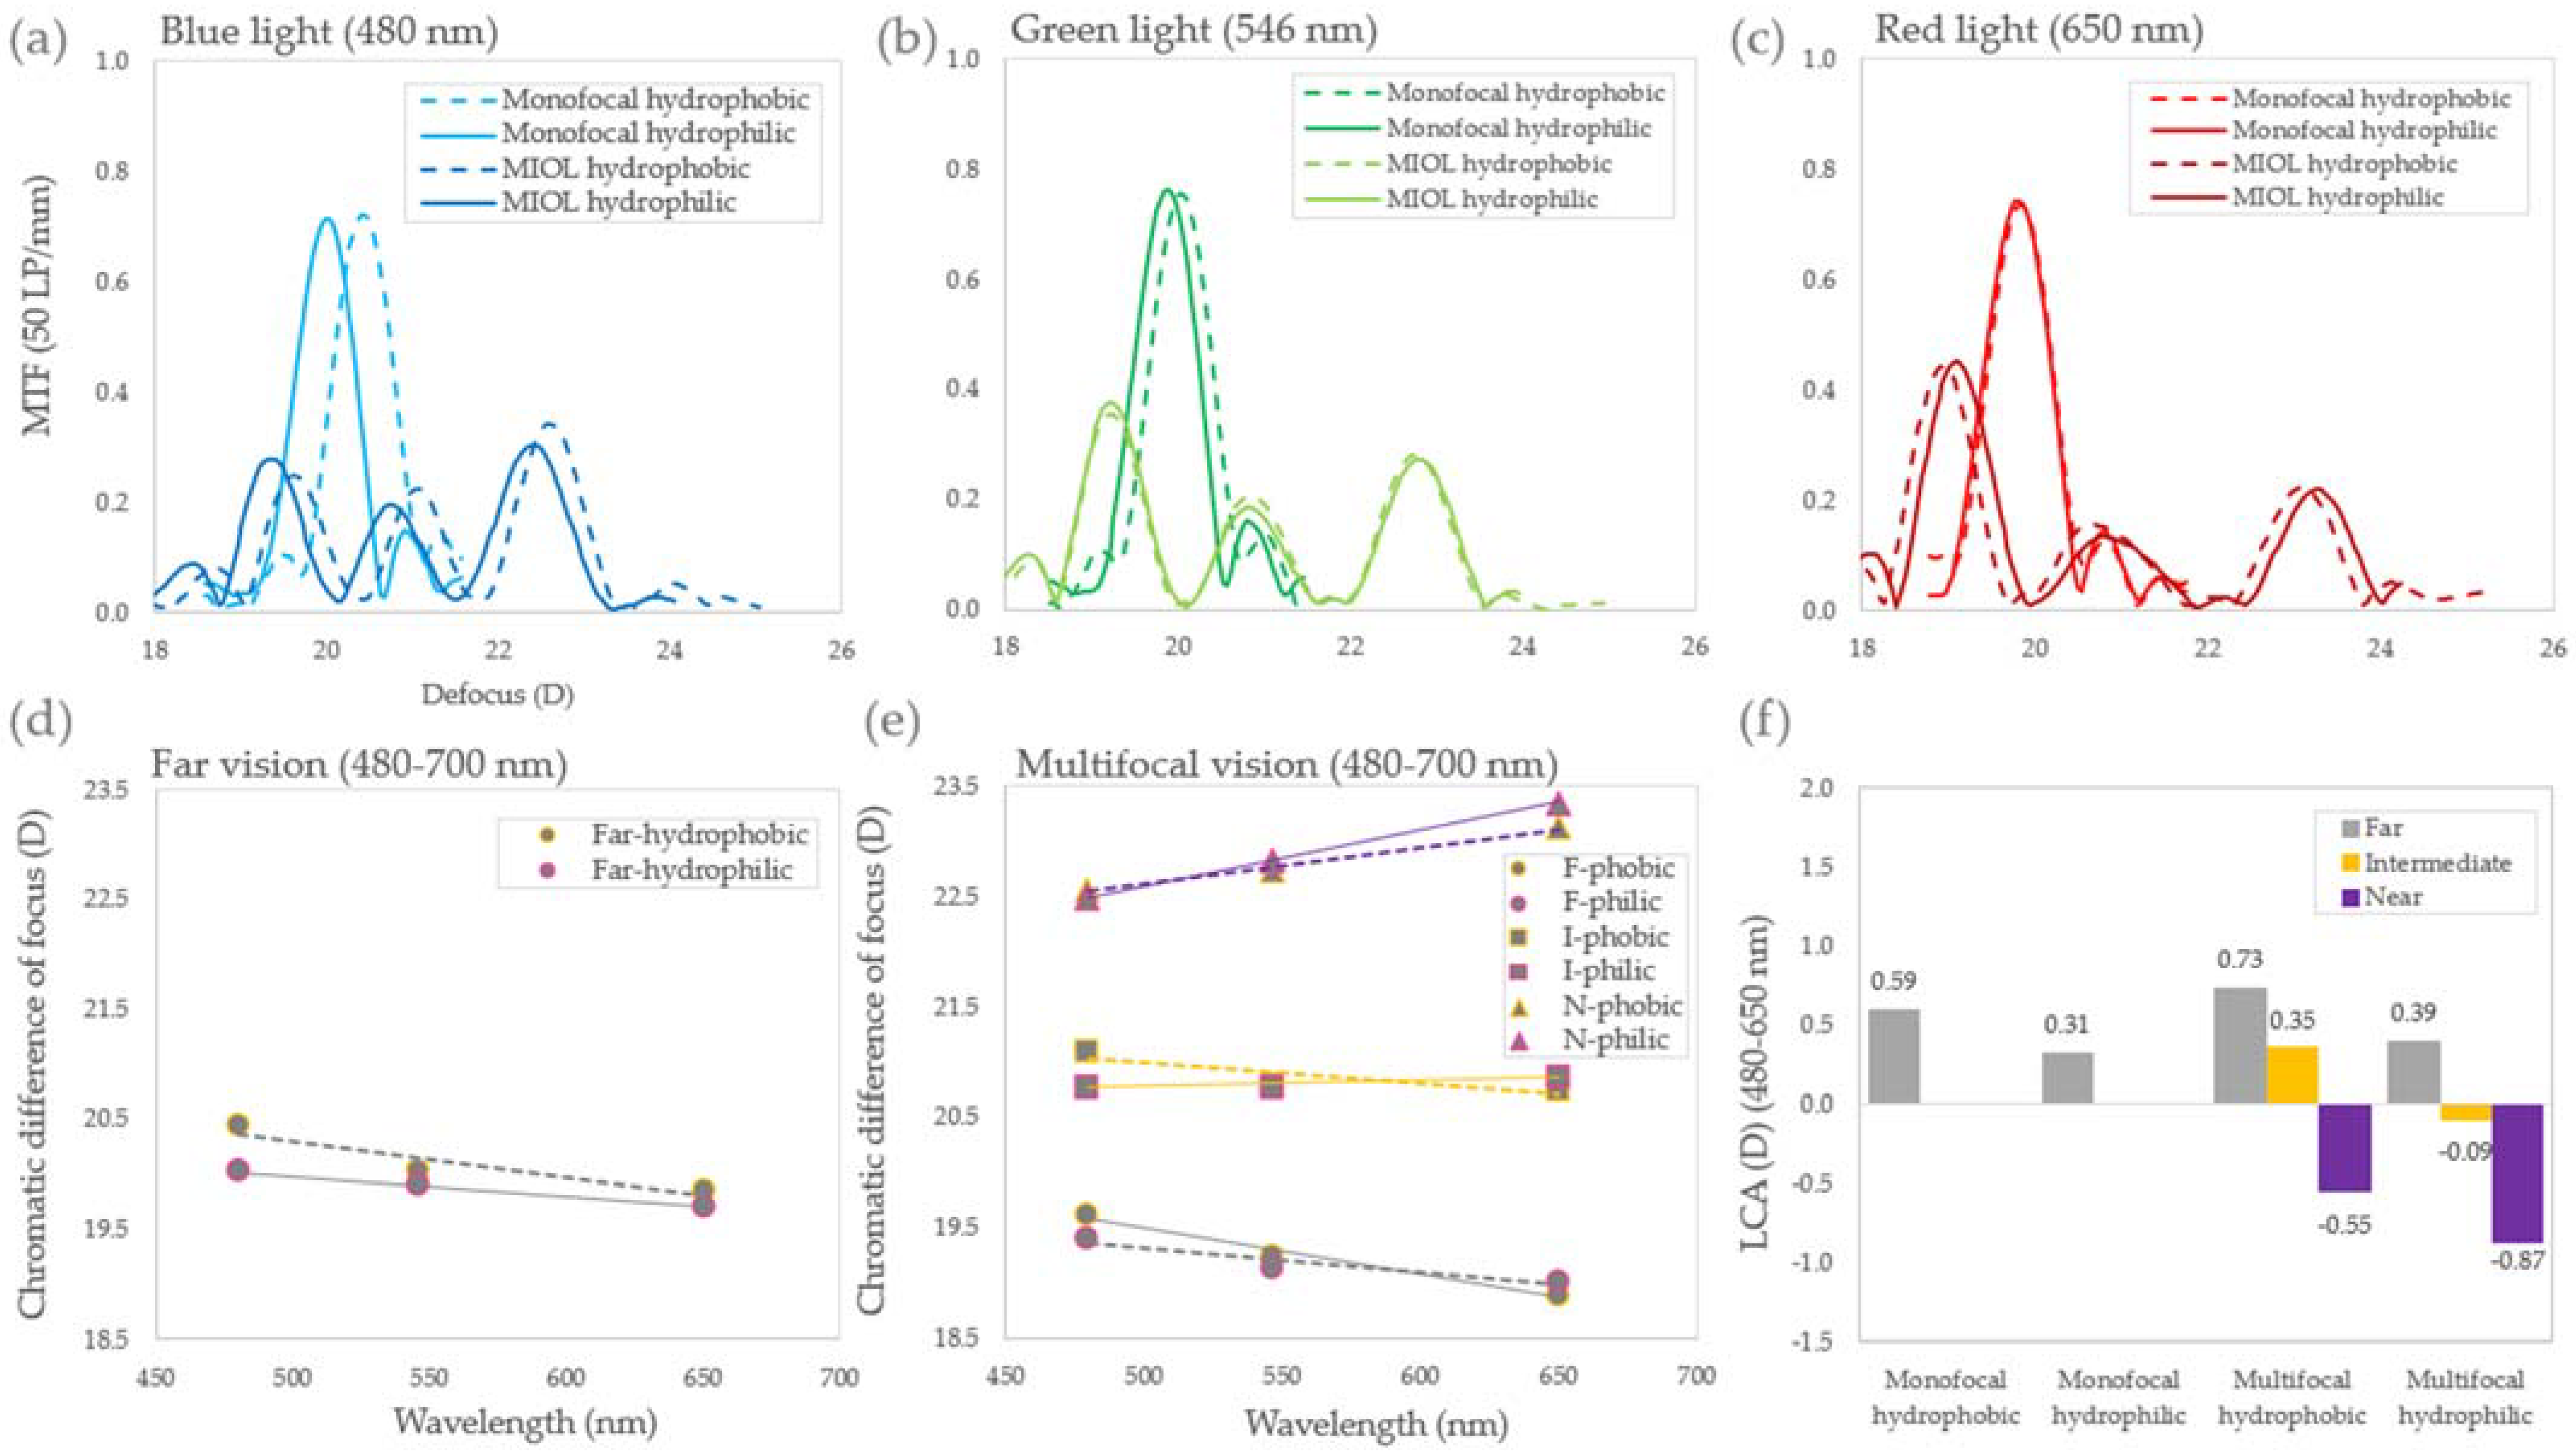
3.2. On-Bench Measurements

Figure 4 summarizes the on-bench measurements in terms of MTF (50 LP/mm) for monofocal, multifocal, hydrophobic, and hydrophilic IOLs, for blue (480 nm), green (546 nm), and red (650 nm) (a–c), as well as the chromatic difference of focus (CDF) for the monofocal and multifocal IOLs for far (gray lines), intermediate (yellow lines), and near (purple lines) distances (d–e). Finally, the longitudinal chromatic aberration (LCA) for the 480–650 spectral range for far (gray), intermediate (yellow), and near (purple) distances is shown. In the monofocal IOLs, LCA was higher for the hydrophobic material (0.59 D and 0.31D for the hydrophobic and the hydrophilic, respectively).
For both MIOLs, material and design determined the LCA of the lens at each visual distance. For far vision, where only the refractive component of the lens was present, LCA was 0.73 D and 0.39 D for the hydrophobic and the hydrophilic lens, respectively, higher than in the monofocal IOL case. In the case of near vision, where refractive and diffractive components were at play, LCA was −0.55 D and −0.87 D, respectively. Both refractive and diffractive components have opposite signs. In particular, red light focused first due to the diffractive component (−LCA), while blue light focused first due to the refractive component (+LCA). This resulted in a negative LCA, higher for hydrophilic than for hydrophobic, as a consequence of the lower material dispersion of the hydrophilic multifocal lens. For intermediate vision, behavior differed between the two materials. In the case of hydrophobic lens, LCA was 0.35 D, while for the hydrophilic was −0.09 D, due to the different interactions between the refractive and diffractive components.

3.3. Chromatic Difference of Focus: Far Vision

Figure 5 shows the average chromatic difference of focus (480–700 nm) for far vision for (a) phakic subjects, and for (b) monofocal hydrophobic, (c) monofocal hydrophilic, (d) multifocal hydrophobic, and (e) multifocal hydrophilic IOLs, obtained with the different methods: subjective (gray circles) and computational (yellow squares) techniques. Computational ray tracing predicted the general chromatic trends for all conditions well. Discrepancies were found in red light for the phakic eye, and in blue light for the monofocal hydrophilic. Experimental inter-subject variability was significantly higher with the MIOL-hydrophilic (±0.37 D) than with the hydrophobic (±0.06 D) or the monofocal (±0.06 D averaged across materials) IOLs (p < 0.01).

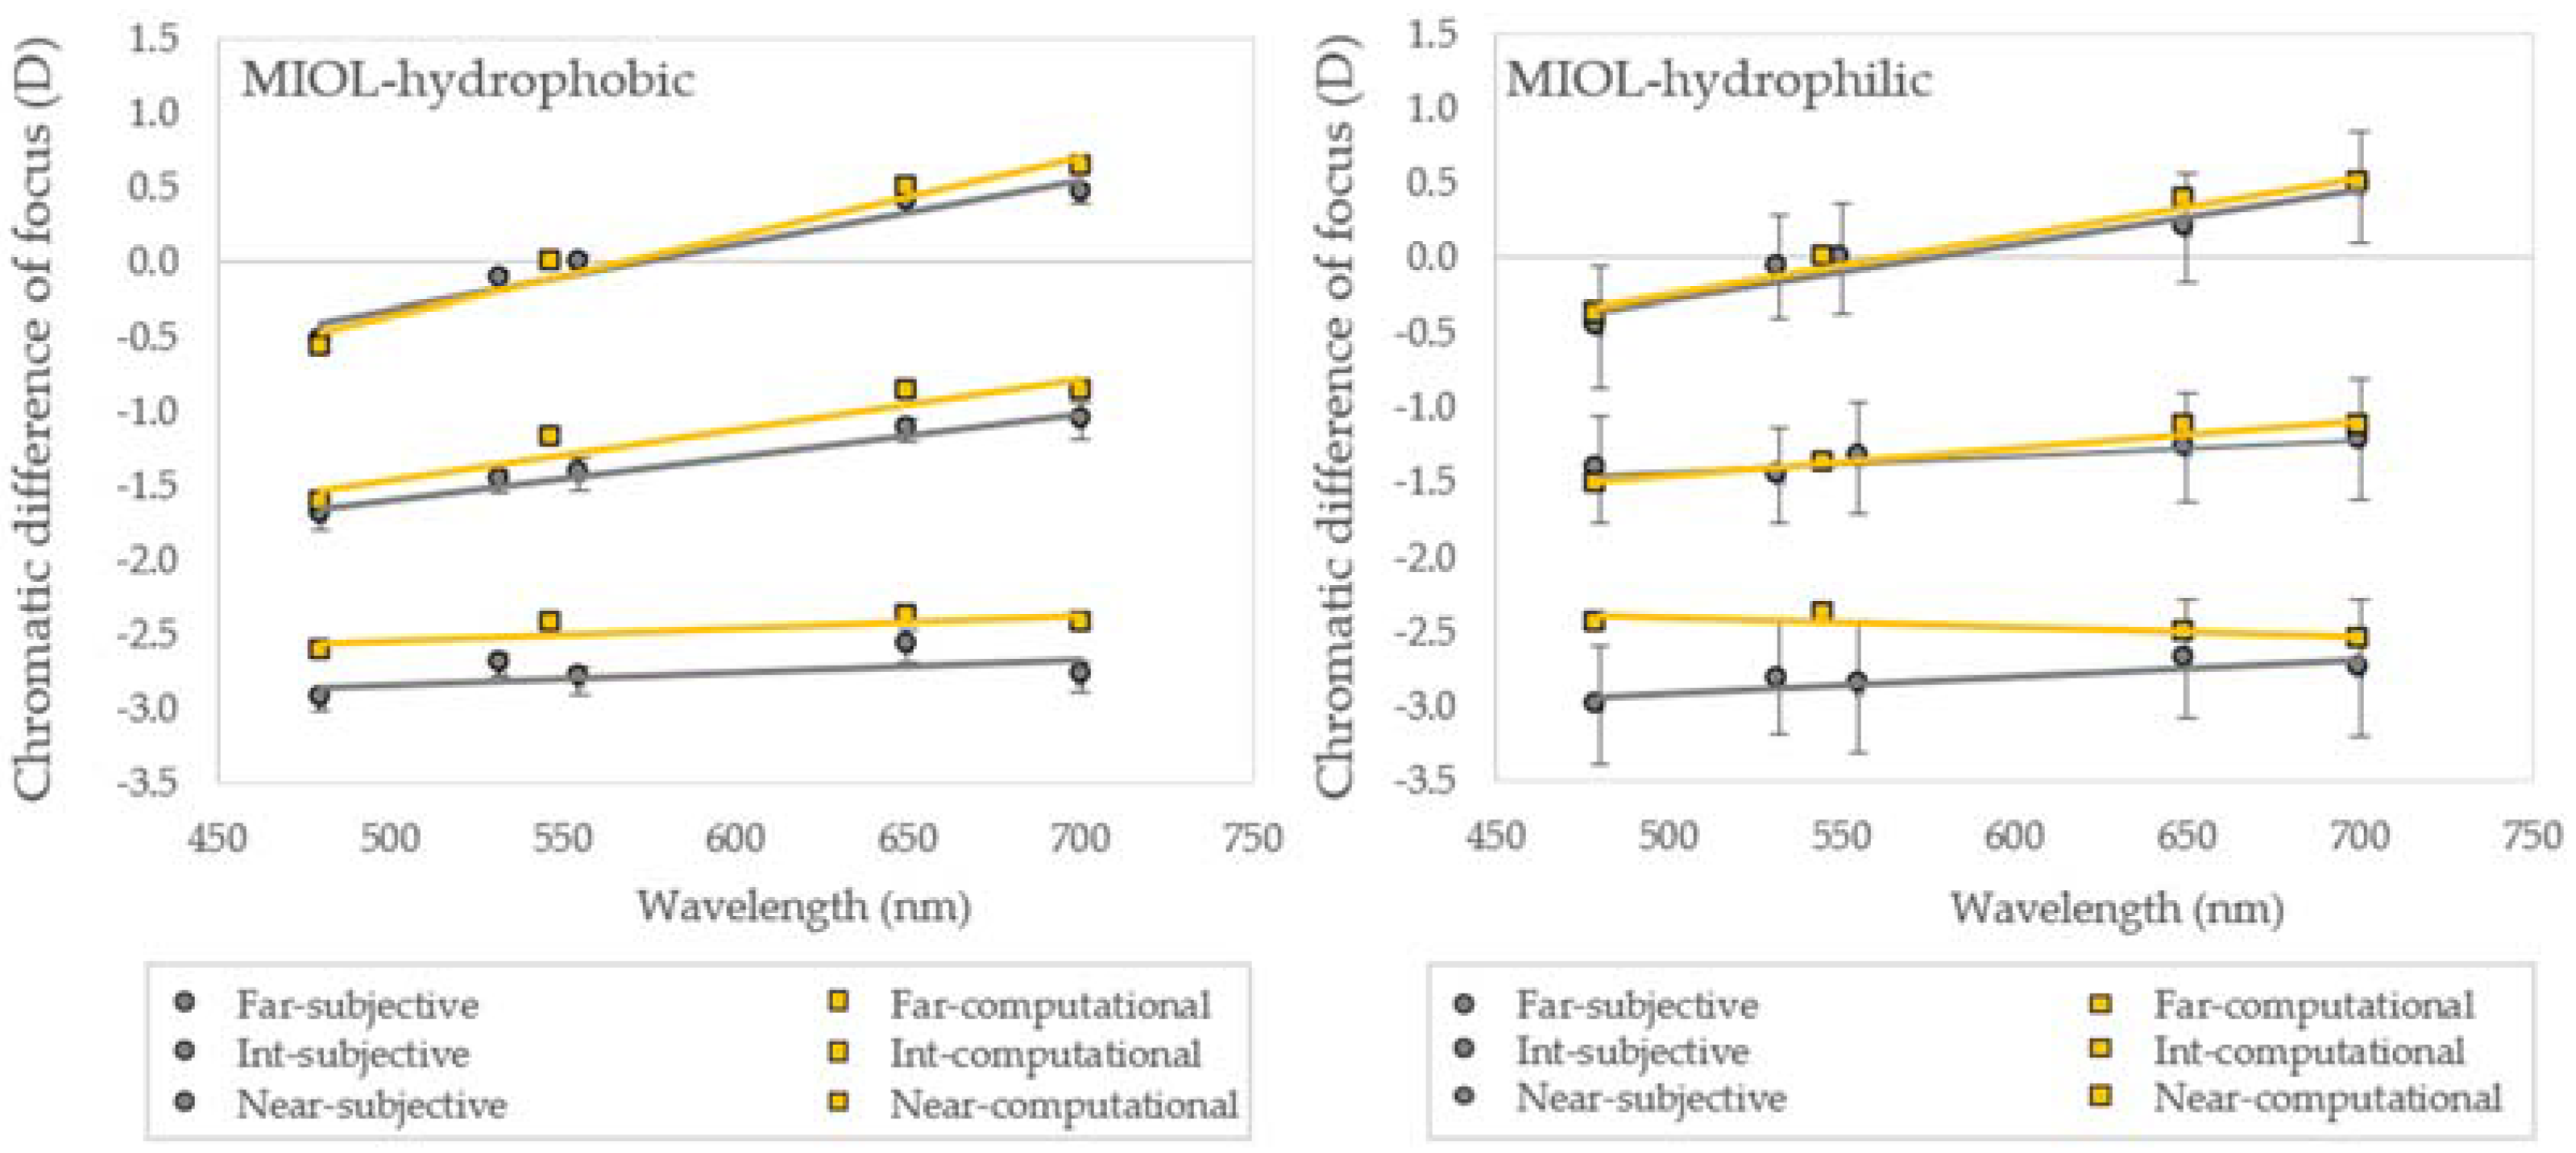
3.4. Chromatic Difference of Focus: Multifocal IOLs

Figure 6 shows the average chromatic difference of focus (480–700 nm) for multifocal (a) hydrophobic and (b) hydrophilic MIOLs for far (0 D), intermediate (1.75 D), and near (3.50 D) vision, measured subjectively (gray circles), and calculated computationally (yellow squares). Differences across testing distances were obtained directly from the experimental data. General trends for multifocal vision with the two materials MIOLs were well predicted by computational ray tracing. In particular, the slopes of the curves for all distances agreed, except in near vision for MIOL-hydrophilic (p < 0.01), where discrepancies arose from the blue-green region. In the hydrophobic MIOLs, the TFVS maximum peaks for near vision shifted from the experimental best subjective focus (555 nm Intermediate: −1.18 D-Computational vs. −1.42 D-Experimental and Near: −2.44 D-Computational vs. −2.82 D-Experimental). Similar to far vision, experimental inter-subject variability was significantly higher with the MIOL-hydrophilic (p < 0.01) for intermediate (±0.36 D vs. ±0.10 D) and near (±0.41 D vs. ±0.09 D) vision.
Table 2 shows the slopes of the linear fittings of the chromatic difference of focus curves for all IOLs and visual distances. The computational ray tracing and on bench, which account only for the LCA of the IOL, data showed negative slopes for near vision, but the experimental data in patients did not.
Table 2. Slopes of the linear fittings of the chromatic difference of focus curves for all conditions and IOLs.
Computational Ray TracingOn BenchIn Vivo
Monofocal hydrophobicFar0.00630.00330.0063
Monofocal hydrophilicFar0.00540.00180.0054
MIOL hydrophobicFar0.00440.00220.0044
Int0.00340.00190.0029
Near0.0008−0.00330.0008
MIOL hydrophilicFar0.00370.00420.0037
Int0.0018−0.00060.0011
Near−0.0007−0.00510.0011

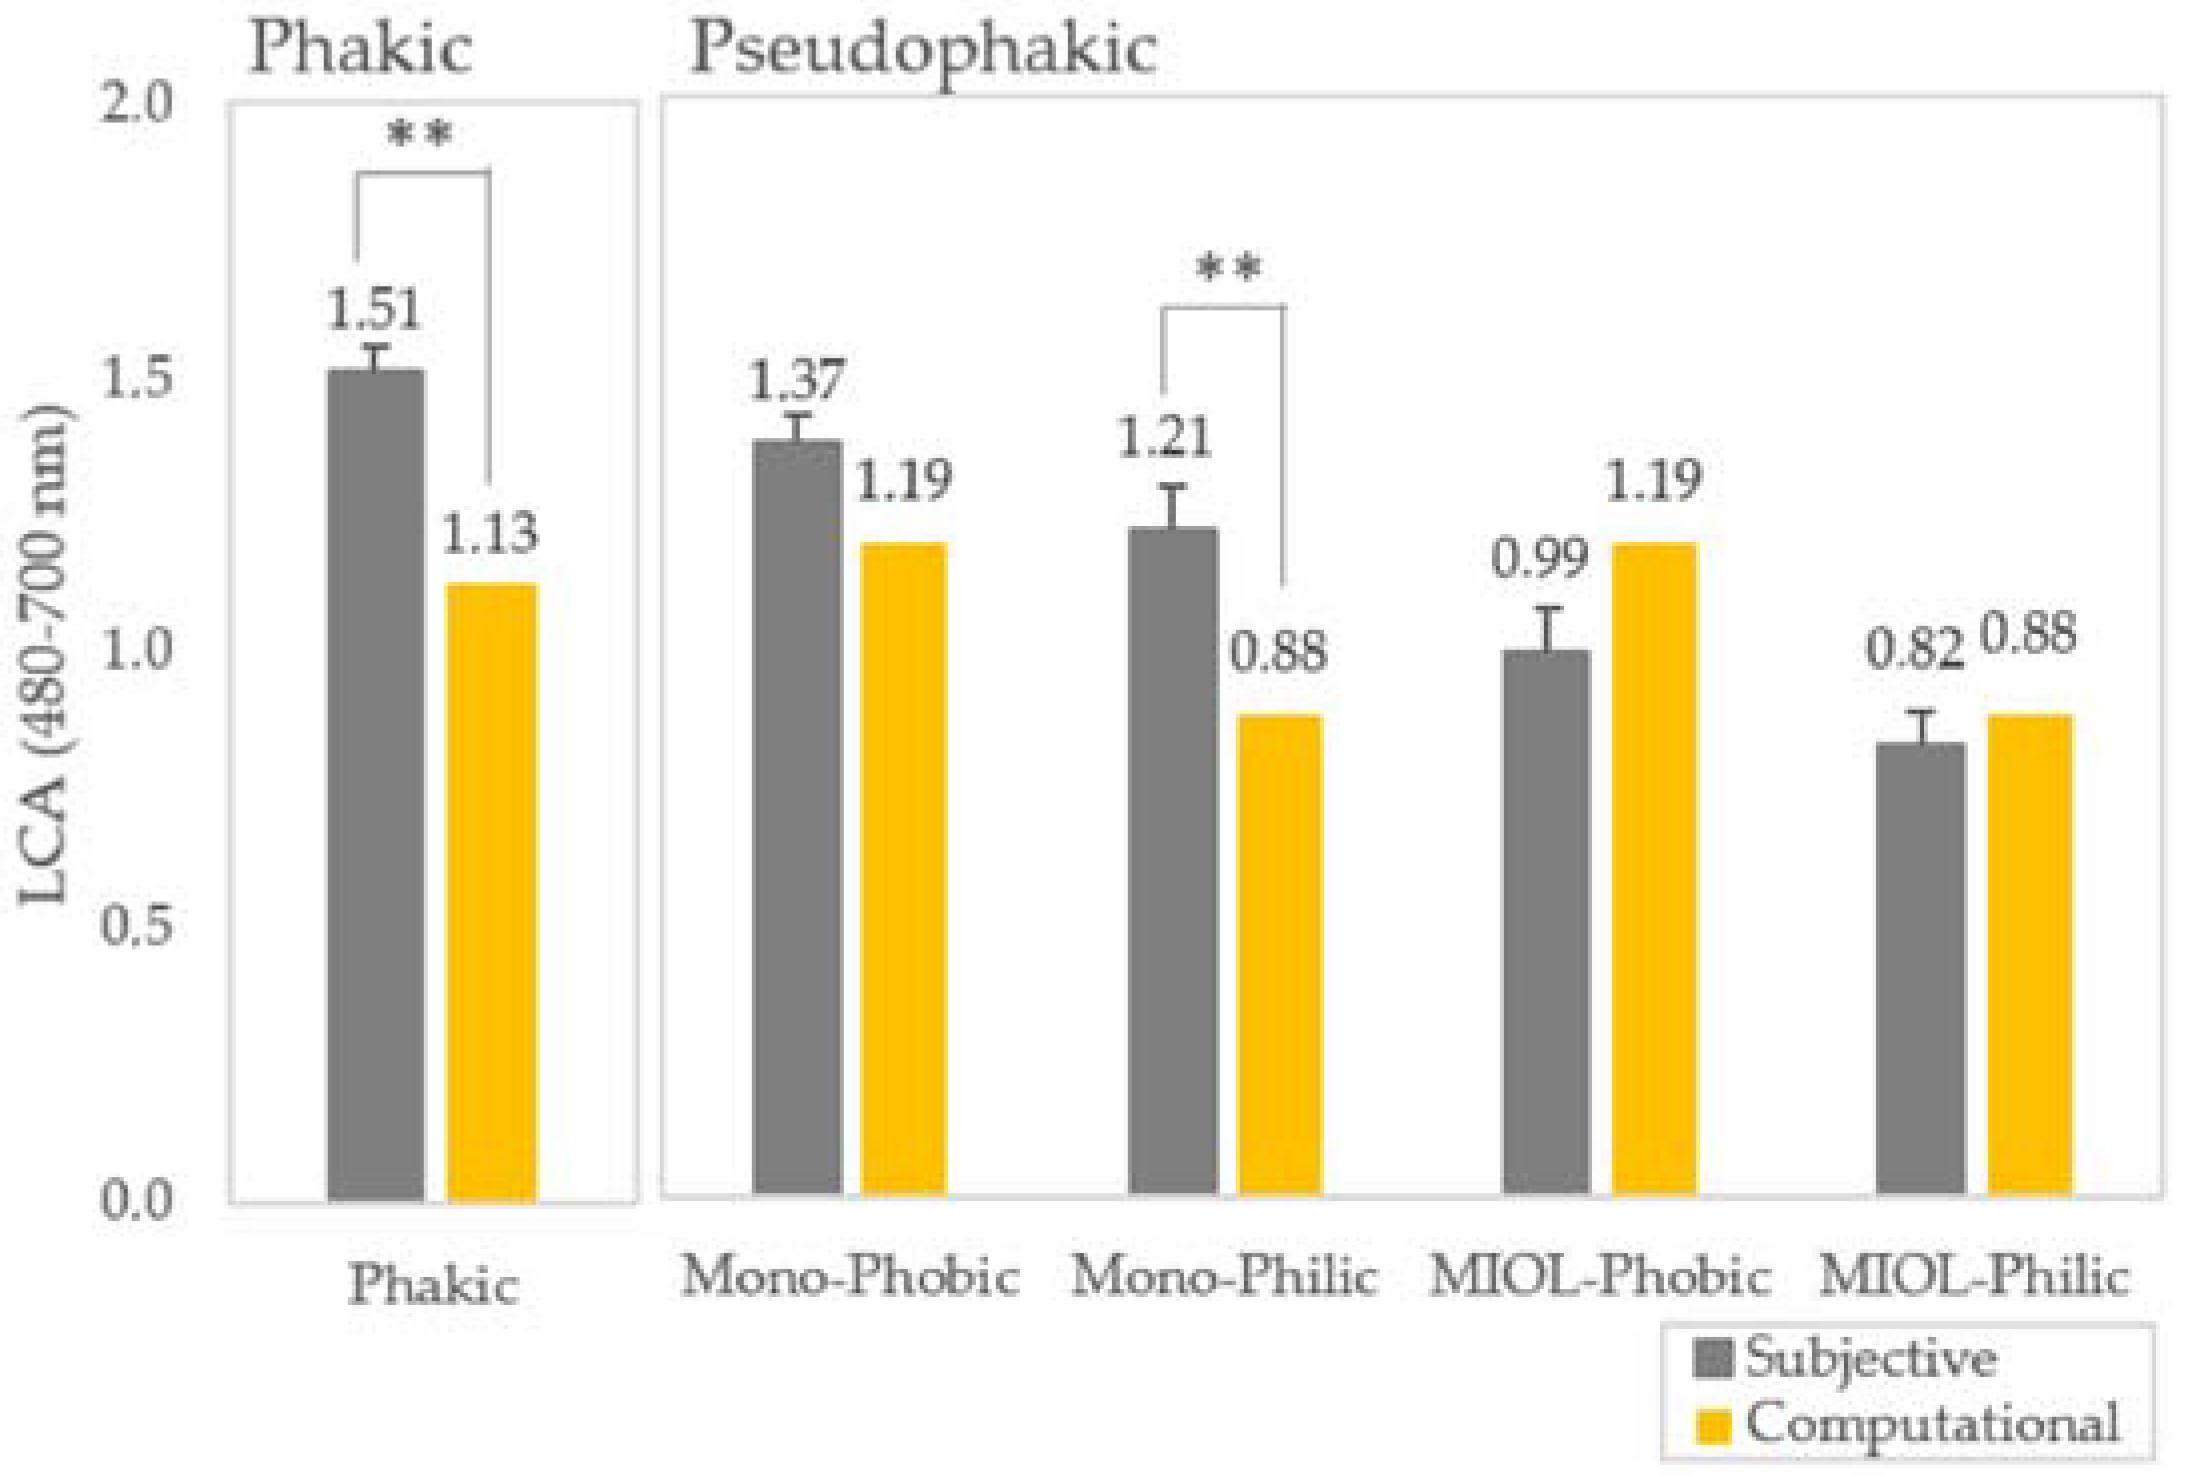
3.5. Pseudophakic Longitudinal Chromatic Aberration

Figure 7 shows the average LCA for far vision (480–700 nm) for phakic and pseudophakic eyes with subjective (solid gray bars) and computational (solid yellow bars) methods. LCA in phakic and pseudophakic eyes obtained with the different techniques showed the same trends with higher values for subjective than computational LCA. LCA with the hydrophobic material is slightly, but is significantly higher than with the hydrophilic material both in monofocal and trifocal IOLs for far vision, with values of the same order of magnitude or lower than LCA in the phakic eye. For monofocal IOLs, computational ray tracing predictions matched results for hydrophobic, but differed slightly for hydrophilic lenses. For MIOLs, predictions matched the experimental LCA perfectly, but were higher than the experimental results in the hydrophobic case. In this particular case, computational LCA for far vision is similar to that of the monofocal IOL with the same material.
Figure 8 shows the average multifocal LCA for hydrophobic and hydrophilic MIOLs for far, intermediate, and near vision obtained with subjective (gray bars) and computational techniques (yellow bars). LCA decreases for intermediate and near vision in MIOLs with similar results with all techniques. Simulations predicted subjective LCA well, with statistically significant differences only for MIOL hydrophilic in near vision.

4. Discussion

Optical quality of multifocal IOLs is typically evaluated computationally using computer model eyes and on bench using optical quality metrics. Moreover, many studies have reported through-focus optical and visual quality in in vivo in patients implanted with multifocal IOLs, using Visual Strehl Ratio and Visual Acuity through-focus (defocus curves). The Visual Strehl ratio calculated from the combined wave aberrations have been shown to correlate well with visual acuity [57,58]. In particular, the defocus determined psychophysically appears to be captured well by the offset of the Visual Strehl peak [11,60], except for bias in the perceived best focus encountered in several refractive profiles, particularly astigmatic patients [61]. However, differences between on bench and in vivo data have been previously reported, without a clear reasoning behind them. In our study, we found a good correspondence between the positions of the peaks of the through-focus curves (best focus) and the computational predictions of those peaks at far, intermediate and near in red light, and far and intermediate at all wavelengths with the hydrophobic lens, but there appears to be a systematic shift of the positions of the intermediate and near (towards less addition) in the real eye with respect to predicted values (Figure 6). Potential reasons for this discrepancy can be a broadening of the intermediate and near peaks, particularly in the presence of other aberrations, which challenges finding a clear peak. The lower addition, in terms of the difference between the CDF curves at the different distances, by 0.2 D at intermediate (hydrophobic) and 0.40/0.75 D at near (hydrophilic/hydrophobic), with respect to predicted by simulations and on-bench values is yet to be understood. Possible ways to test these hypotheses would involve measuring through-focus VA curves at different wavelengths, to assess not only the position of the peaks but the overall curve shape. Additionally, the models could be further sophisticated, including corneal aberrations of the patients, and account for potential shifts of the intermediate and near peaks in the presence of high order aberrations. Several refractive parameters, including spherical refractive error and astigmatism (with-the-rule or against-the-rule), may also affect perceptual setting of best focus, both in a young and a presbyopic population.
We found that experimental chromatic difference of focus (slopes and LCA) predicted by simulations in computer eye models matches well the experimental findings (Figure 5). The slight discrepancy between experimental subjective LCA and the computer eye model simulation in the phakic eye for red light is similar to that the one obtained with other water eye models, such us the Indiana chromatic reduced eye model [62], where the Abbe number is adjusted to fit the psychophysical data. In a previous study [11], we showed that this chromatic eye model fitted the psychophysical data well for shorter wavelengths and the reflectometric data for longer wavelengths, with a general good agreement with data in shorter ranges from previous studies, both psychophysical and reflectometric. The Indiana chromatic reduced eye model, built using experimental data [63], predicts a chromatic focus shift of 1.00 D for VIS (480–700 nm), in agreement with the computational eye model predictions for the same range (1.10 D), and reflectometric objective measurements (Aerial imaging 0.95 D and Wavefront sensing 0.90 D), but lower than the experimental subjective LCA (1.52 D). The correction of high order aberrations did not alter those differences [11].
Experimental on bench [1,38] and in vivo in pseudophakic eyes [15,48,49] consistently indicate lower slopes and lower LCA values with hydrophilic than with hydrophobic materials. These results are consistent with the higher Abbe number in hydrophilic IOLs (58), followed by that of the natural eye (45) and that of hydrophobic IOLs (42). Furthermore, other on-bench studies [32,43,44,45,46] compared the optical performance of diffractive M-IOLs with visible and near infrared light, showing a bias in the optical performance of IOL towards far focus for near infrared illumination. Simulations predict the chromatic difference of focus curves for the monofocal hydrophobic IOL well, but show a significant discrepancy for monofocal hydrophilic IOLs in the blue region.
As expected, patients implanted with multifocal IOLs with diffractive designs exhibit decreased slopes in the chromatic defocus curves and decreased LCA for intermediate and near with respect to those for far (Figure 7). This finding is consistent in both computer simulations and experimental subjective data in patients, for both hydrophilic and hydrophobic materials. It is also consistent with on bench results for the isolated IOL (Gatinel et al. [1]), which showed negative slopes in chromatic defocus curves (and negative LCA) at near, due to the compensation of the IOL refractive LCA with the diffractive component. Simulations predict pseudophakic LCA well in vivo in all conditions, except for the hydrophilic MIOL in near vision, where predictions show a more negative LCA than that of the experimental measurements (0.15 D vs. −0.13 D). This is probably due to the fact that simulations do not include, in this particular case, the effect of other ocular aberrations that might counteract the negative chromatic aberration induced by the multifocal diffractive design [64,65]. Nevertheless, the variability in the error setting is small in all cases at far (0.05–0.10 D), except for multifocal hydrophilic IOLs (0.37 D).

5. Conclusions

  • Diffractive multifocal intraocular lenses modulate chromatic aberration and reduce it at certain distances due to interactions of refractive and diffractive chromatic components, displacing the position and peak magnitude of the foci at different visual distances, and even reversing chromatic aberration at some distances.
  • Predicted differences due to the material and designs of the IOLs are confirmed by the experimental data (on bench and in vivo). Patients implanted with multifocal IOLs with diffractive designs exhibit decreased LCA at intermediate and near distances with respect to those at far, consistent with both computer simulations and experimental data, for both hydrophilic and hydrophobic materials.
  • We demonstrate that experimental chromatic difference of focus (slopes and LCA) predicted by simulations in computer eye models matches the experimental findings well. We found a good correspondence between the positions of the peaks of the through-focus curves (best focus) and the computational predictions of those peaks at far, intermediate, and near vision. Computational ray tracing and on bench measurements allow for evaluating in vivo chromatic aberration with different materials and designs of multifocal diffractive intraocular lenses.

Author Contributions

Study concept and design, S.M., C.D. and M.V.-P.; data collection, M.V.-P., A.G.-R., A.d.C. and N.G.; computational analysis, A.d.C.; on bench measurements, N.W. and S.R.; analysis and interpretation of data, S.M., A.d.C. and M.V.-P.; writing the manuscript, S.M. and M.V.-P.; administrative, technical, and material support, M.V.-P. and S.M.; supervision, M.V.-P. and S.M.; funding acquisition, S.M. All authors have read and agreed to the published version of the manuscript.

Funding

This research received funding from the European Research Council under the ERC-2011-AdG-294099 to S.M. and the H2020-MSCA-IF-GF-2019-MYOMICRO-893557 to M.V.-P.; the Spanish Government grant FIS2017-84753 and PID2020-115191RB-I00 to S.M., and collaborative agreements (2014-2020) with PhyIOL (Liege, Belgium), the National Eye Institute P30 Core Grant EY001319-46 (Center for Visual Science), and Unrestricted grant Research to Prevent Blindness (Flaum Eye Institute).

Institutional Review Board Statement

All protocols met the tenets of the Declaration of Helsinki and were approved by the Spanish National Research Council (CSIC) Bio-ethical Committee.

Informed Consent Statement

All participants were acquainted with the nature and possible consequences of the study and provided written informed consent.

Data Availability Statement

All data generated or analyzed during this study are included in this published article. The datasets generated during and/or analyzed during the current study are available from the corresponding author upon reasonable request.

Conflicts of Interest

S.R. and N.W. are BVI Medical employees. The rest of the authors declare no conflict of interest.

References

  1. Gatinel, D.; Loicq, J. Clinically Relevant Optical Properties of Bifocal, Trifocal, and Extended Depth of Focus Intraocular Lenses. J. Refract. Surg. 2016, 32, 273–280. [Google Scholar] [CrossRef] [PubMed] [Green Version]
  2. Thibos, L.N.; Bradley, A.; Zhang, X.X. Effect of ocular chromatic aberration on monocular visual performance. Optom. Vis. Sci. 1991, 68, 599–607. [Google Scholar] [CrossRef] [PubMed]
  3. Graef, K.; Schaeffel, F. Control of accommodation by longitudinal chromatic aberration and blue cones. J. Vis. 2012, 12, 14. [Google Scholar] [CrossRef] [PubMed] [Green Version]
  4. Atchison, D.A.; Smith, G. Chromatic dispersions of the ocular media of human eyes. J. Opt. Soc. Am. A Opt. Image Sci. Vis. 2005, 22, 29–37. [Google Scholar] [CrossRef]
  5. Bedford, R.E.; Wyszecki, G. Axial chromatic aberration of the human eye. J. Opt. Soc. Am. 1957, 47, 564–565. [Google Scholar] [CrossRef]
  6. Howarth, P.A. The lateral chromatic aberration of the eye. Ophthalmic Physiol. Opt. 1984, 4, 223–226. [Google Scholar] [CrossRef]
  7. Rynders, M.; Lidkea, B.; Chisholm, W.; Thibos, L.N. Statistical distribution of foveal transverse chromatic aberration, pupil centration, and angle psi in a population of young adult eyes. J. Opt. Soc. Am. A 1995, 12, 2348–2357. [Google Scholar] [CrossRef]
  8. Thibos, L.N.; Bradley, A.; Still, D.L.; Zhang, X.; Howarth, P.A. Theory and measurement of ocular chromatic aberration. Vision Res. 1990, 30, 33–49. [Google Scholar] [CrossRef]
  9. Marcos, S.; Burns, S.A.; Prieto, P.M.; Navarro, R.; Baraibar, B. Investigating sources of variability of monochromatic and transverse chromatic aberrations across eyes. Vision Res. 2001, 41, 3861–3871. [Google Scholar] [CrossRef] [Green Version]
  10. Aissati, S.; Vinas, M.; Benedi-Garcia, C.; Dorronsoro, C.; Marcos, S. Testing the effect of ocular aberrations in the perceived transverse chromatic aberration. Biomed. Opt. Express 2020, 11, 4052–4068. [Google Scholar] [CrossRef]
  11. Vinas, M.; Dorronsoro, C.; Cortes, D.; Pascual, D.; Marcos, S. Longitudinal chromatic aberration of the human eye in the visible and near infrared from wavefront sensing, double-pass and psychophysics. Biomed. Opt. Express 2015, 6, 948–962. [Google Scholar] [CrossRef] [PubMed] [Green Version]
  12. Marcos, S.; Benedi-Garcia, C.; Aissati, S.; Gonzalez-Ramos, A.M.; Lago, C.M.; Radhkrishnan, A.; Romero, M.; Vedhakrishnan, S.; Sawides, L.; Vinas, M. VioBio lab adaptive optics: Technology and applications by women vision scientists. Ophthalmic Physiol. Opt. 2020, 40, 75–87. [Google Scholar] [CrossRef] [PubMed] [Green Version]
  13. Ware, C. Human axial chromatic aberration found not to decline with age. Graefes Arch. Clin. Exp. Ophthalmol. 1982, 218, 39–41. [Google Scholar] [CrossRef] [PubMed]
  14. Fernandez, E.; Unterhuber, A.; Prieto, P.; Hermann, B.; Drexler, W.; Artal, P. Ocular aberrations as a function of wavelength in the near infrared measured with a femtosecond laser. Opt. Express 2005, 13, 400–409. [Google Scholar] [CrossRef] [PubMed] [Green Version]
  15. Vinas, M.; Dorronsoro, C.; Garzon, N.; Poyales, F.; Marcos, S. In vivo subjective and objective longitudinal chromatic aberration after bilateral implantation of the same design of hydrophobic and hydrophilic intraocular lenses. J. Cataract. Refract. Surg. 2015, 41, 2115–2124. [Google Scholar] [CrossRef]
  16. Zhao, H.; Mainster, M.A. The effect of chromatic dispersion on pseudophakic optical performance. Br. J. Ophthalmol. 2007, 91, 1225–1229. [Google Scholar] [CrossRef] [PubMed] [Green Version]
  17. Nagata, T.; Kubota, S.; Watanabe, I.; Aoshima, S. Chromatic aberration in pseudophakic eyes. Nihon Ganka Gakkai Zasshi 1999, 103, 237–242. [Google Scholar] [CrossRef]
  18. Negishi, K.; Ohnuma, K.; Hirayama, N.; Noda, T.; Policy-Based Medical Services Network Study Group for Intraocular Lens and Refractive Surgery. Effect of chromatic aberration on contrast sensitivity in pseudophakic eyes. Arch. Ophthalmol. 2001, 119, 1154–1158. [Google Scholar] [CrossRef] [PubMed] [Green Version]
  19. Bradley, A.; Xu, R.; Wang, H.; Jaskulski, M.; Hong, X.; Brink, N.; Van Noy, S. The Impact of IOL Abbe Number on Polychromatic Image Quality of Pseudophakic Eyes. Clin. Ophthalmol. 2020, 14, 2271–2281. [Google Scholar] [CrossRef] [PubMed]
  20. Marcos, S.; Romero, M.; Benedi-García, C.; Gonzalez-Ramos, A.; Vinas, M.; Alejandre, N.; Jiménez-Alfaro, I. Interaction of monochromatic and chromatic aberrations in pseudophakic patients. J. Refract. Surg. 2020; in press. [Google Scholar] [CrossRef] [PubMed]
  21. Eppig, T.; Rawer, A.; Hoffmann, P.; Langenbucher, A.; Schroder, S. On the Chromatic Dispersion of Hydrophobic and Hydrophilic Intraocular Lenses. Optom. Vis. Sci 2020, 97, 305–313. [Google Scholar] [CrossRef] [PubMed]
  22. Nakajima, M.; Hiraoka, T.; Yamamoto, T.; Takagi, S.; Hirohara, Y.; Oshika, T.; Mihashi, T. Differences of Longitudinal Chromatic Aberration (LCA) between Eyes with Intraocular Lenses from Different Manufacturers. PLoS ONE 2016, 11, e0156227. [Google Scholar] [CrossRef] [PubMed] [Green Version]
  23. Perez-Merino, P.; Dorronsoro, C.; Llorente, L.; Duran, S.; Jimenez-Alfaro, I.; Marcos, S. In vivo chromatic aberration in eyes implanted with intraocular lenses. Investig. Ophthalmol. Vis. Sci. 2013, 54, 2654–2661. [Google Scholar] [CrossRef] [PubMed] [Green Version]
  24. Siedlecki, D.; Jozwik, A.; Zajac, M.; Hill-Bator, A.; Turno-Krecicka, A. In vivo longitudinal chromatic aberration of pseudophakic eyes. Optom Vis Sci 2014, 91, 240–246. [Google Scholar] [CrossRef] [PubMed]
  25. Bobier, C.W.; Sivak, J.G. Chromoretinoscopy. Vision Res. 1978, 18, 247–250. [Google Scholar] [CrossRef]
  26. Artal, P.; Manzanera, S.; Piers, P.; Weeber, H. Visual effect of the combined correction of spherical and longitudinal chromatic aberrations. Opt. Express 2010, 18, 1637–1648. [Google Scholar] [CrossRef] [PubMed] [Green Version]
  27. Weeber, H.A.; Piers, P.A. Theoretical performance of intraocular lenses correcting both spherical and chromatic aberration. J. Refract. Surg. 2012, 28, 48–52. [Google Scholar] [CrossRef]
  28. Simpson, M.J. Diffractive multifocal intraocular lens image quality. Appl. Opt. 1992, 31, 3621–3626. [Google Scholar] [CrossRef]
  29. Charman, W.N. Developments in the correction of presbyopia II: Surgical approaches. Ophthalmic Physiol. Opt. J. Br. Coll. Ophthalmic Opt. 2014, 34, 397–426. [Google Scholar] [CrossRef]
  30. Ravikumar, S.; Bradley, A.; Thibos, L.N. Chromatic aberration and polychromatic image quality with diffractive multifocal intraocular lenses. J. Cataract. Refract. Surg. 2014, 40, 1192–1204. [Google Scholar] [CrossRef]
  31. Castignoles, F.; Flury, M.; Lepine, T. Comparison of the efficiency, MTF and chromatic properties of four diffractive bifocal intraocular lens designs. Opt. Express 2010, 18, 5245–5256. [Google Scholar] [CrossRef] [Green Version]
  32. Vega, F.; Millan, M.S.; Vila-Terricabras, N.; Alba-Bueno, F. Visible Versus Near-Infrared Optical Performance of Diffractive Multifocal Intraocular Lenses. Investig. Ophthalmol. Vis. Sci. 2015, 56, 7345–7351. [Google Scholar] [CrossRef] [PubMed] [Green Version]
  33. Vinas, M.; Benedi-Garcia, C.; Aissati, S.; Pascual, D.; Akondi, V.; Dorronsoro, C.; Marcos, S. Visual simulators replicate vision with multifocal lenses. Sci. Rep. 2019, 9, 1539. [Google Scholar] [CrossRef] [Green Version]
  34. Vinas, M.; Aissati, S.; Gonzalez-Ramos, A.M.; Romero, M.; Sawides, L.; Akondi, V.; Gambra, E.; Dorronsoro, C.; Karkkainen, T.; Nankivil, D.; et al. Optical and Visual Quality With Physical and Visually Simulated Presbyopic Multifocal Contact Lenses. Transl. Vis. Sci. Technol. 2020, 9, 20. [Google Scholar] [CrossRef] [PubMed]
  35. Vedhakrishnan, S.; Vinas, M.; Benedi-Garcia, C.; Casado, P.; Marcos, S. Visual performance with multifocal lenses in young adults and presbyopes. PLoS ONE 2022, 17, e0263659. [Google Scholar] [CrossRef] [PubMed]
  36. Davison, J.A.; Simpson, M.J. History and development of the apodized diffractive intraocular lens. J. Cataract. Refract. Surg. 2006, 32, 849–858. [Google Scholar] [CrossRef] [PubMed]
  37. Gatinel, D.; Houbrechts, Y. Comparison of bifocal and trifocal diffractive and refractive intraocular lenses using an optical bench. J. Cataract. Refract. Surg. 2013, 39, 1093–1099. [Google Scholar] [CrossRef] [PubMed]
  38. Loicq, J.; Willet, N.; Gatinel, D. Topography and longitudinal chromatic aberration characterizations of refractive-diffractive multifocal intraocular lenses. J. Cataract. Refract. Surg. 2019, 45, 1650–1659. [Google Scholar] [CrossRef]
  39. Alio, J.L.; Elkady, B.; Ortiz, D.; Bernabeu, G. Clinical outcomes and intraocular optical quality of a diffractive multifocal intraocular lens with asymmetrical light distribution. J. Cataract. Refract. Surg. 2008, 34, 942–948. [Google Scholar] [CrossRef] [PubMed]
  40. Blaylock, J.F.; Si, Z.; Vickers, C. Visual and refractive status at different focal distances after implantation of the ReSTOR multifocal intraocular lens. J. Cataract. Refract. Surg. 2006, 32, 1464–1473. [Google Scholar] [CrossRef] [PubMed]
  41. Petermeier, K.; Szurman, P. Subjective and objective outcome following implantation of the apodized diffractive AcrySof ReSTOR. Ophthalmologe 2007, 104, 399–408. [Google Scholar] [CrossRef] [PubMed]
  42. Mesa, R.R.; Monteiro, T. Continuous Transitional Focus (CTF): A New Concept in Ophthalmic Surgery. Ophthalmol. Ther. 2018, 7, 223–231. [Google Scholar] [CrossRef] [PubMed] [Green Version]
  43. Maxwell, W.A.; Lane, S.S.; Zhou, F. Performance of presbyopia-correcting intraocular lenses in distance optical bench tests. J. Cataract. Refract. Surg. 2009, 35, 166–171. [Google Scholar] [CrossRef] [PubMed]
  44. Kim, M.J.; Zheleznyak, L.; Macrae, S.; Tchah, H.; Yoon, G. Objective evaluation of through-focus optical performance of presbyopia-correcting intraocular lenses using an optical bench system. J. Cataract. Refract. Surg. 2011, 37, 1305–1312. [Google Scholar] [CrossRef] [PubMed] [Green Version]
  45. Pepose, J.S.; Wang, D.; Altmann, G.E. Comparison of through-focus image sharpness across five presbyopia-correcting intraocular lenses. Am. J. Ophthalmol. 2012, 154, 20–28.e21. [Google Scholar] [CrossRef]
  46. Vega, F.; Alba-Bueno, F.; Millan, M.S. Energy distribution between distance and near images in apodized diffractive multifocal intraocular lenses. Investig. Ophthalmol. Vis. Sci. 2011, 52, 5695–5701. [Google Scholar] [CrossRef] [Green Version]
  47. Millan, M.S.; Vega, F.; Rios-Lopez, I. Polychromatic Image Performance of Diffractive Bifocal Intraocular Lenses: Longitudinal Chromatic Aberration and Energy Efficiency. Investig. Ophthalmol. Vis. Sci. 2016, 57, 2021–2028. [Google Scholar] [CrossRef] [Green Version]
  48. Vinas, M.; Gonzalez-Ramos, A.; Dorronsoro, C.; Akondi, V.; Garzon, N.; Poyales, F.; Marcos, S. In Vivo Measurement of Longitudinal Chromatic Aberration in Patients Implanted With Trifocal Diffractive Intraocular Lenses. J. Refract. Surg. 2017, 33, 736–742. [Google Scholar] [CrossRef]
  49. Vinas, M.; Gonzalez-Ramos, A.M.; Aissati, S.; Garzon, N.; Poyales, F.; Dorronsoro, C.; Marcos, S. Longitudinal Chromatic Aberration in Patients Implanted With Trifocal Diffractive Hydrophobic IOLs. J. Refract. Surg. 2020, 36, 804–810. [Google Scholar] [CrossRef]
  50. Canovas, C.; Artal, P. Customized eye models for determining optimized intraocular lenses power. Biomed. Opt. Express 2011, 2, 1649–1662. [Google Scholar] [CrossRef] [Green Version]
  51. Olsen, T.; Hoffmann, P. C constant: New concept for ray tracing-assisted intraocular lens power calculation. J. Cataract. Refract. Surg. 2014, 40, 764–773. [Google Scholar] [CrossRef] [PubMed]
  52. Minami, K.; Kataoka, Y.; Matsunaga, J.; Ohtani, S.; Honbou, M.; Miyata, K. Ray-tracing intraocular lens power calculation using anterior segment optical coherence tomography measurements. J. Cataract. Refract. Surg. 2012, 38, 1758–1763. [Google Scholar] [CrossRef] [PubMed]
  53. Rosales, P.; Marcos, S. Customized computer models of eyes with intraocular lenses. Opt. Express 2007, 15, 2204–2218. [Google Scholar] [CrossRef] [PubMed] [Green Version]
  54. Tabernero, J.; Piers, P.; Benito, A.; Redondo, M.; Artal, P. Predicting the optical performance of eyes implanted with IOLs to correct spherical aberration. Investig. Ophthalmol. Vis. Sci. 2006, 47, 4651–4658. [Google Scholar] [CrossRef]
  55. Gatinel, D.; Pagnoulle, C.; Houbrechts, Y.; Gobin, L. Design and qualification of a diffractive trifocal optical profile for intraocular lenses. J. Cataract. Refract. Surg. 2011, 37, 2060–2067. [Google Scholar] [CrossRef]
  56. Liou, H.L.; Brennan, N.A. Anatomically accurate, finite model eye for optical modeling. J. Opt. Soc. Am. A Opt. Image Sci. Vis. 1997, 14, 1684–1695. [Google Scholar] [CrossRef]
  57. Iskander, D.R. Computational aspects of the visual Strehl ratio. Optom. Vis. Sci. 2006, 83, 57–59. [Google Scholar] [CrossRef]
  58. Marsack, J.D.; Thibos, L.N.; Applegate, R.A. Metrics of optical quality derived from wave aberrations predict visual performance. J. Vis. 2004, 4, 322–328. [Google Scholar] [CrossRef]
  59. Marcos, S.; Martinez-Enriquez, E.; Vinas, M.; de Castro, A.; Dorronsoro, C.; Bang, S.P.; Yoon, G.; Artal, P. Simulating Outcomes of Cataract Surgery: Important Advances in Ophthalmology. Annu. Rev. Biomed. Eng. 2021, 23, 277–306. [Google Scholar] [CrossRef]
  60. Guirao, A.; Williams, D.R. A method to predict refractive errors from wave aberration data. Optom Vis. Sci 2003, 80, 36–42. [Google Scholar] [CrossRef] [Green Version]
  61. Benedi-Garcia, C.; Velasco-Ocana, M.; Dorronsoro, C.; Pascual, D.; Hernandez, M.; Marin, G.; Marcos, S. Perceptual impact of astigmatism induction in presbyopes. Vision Res. 2019, 165, 143–151. [Google Scholar] [CrossRef] [PubMed]
  62. Thibos, L.N.; Ye, M.; Zhang, X.; Bradley, A. The chromatic eye: A new reduced-eye model of ocular chromatic aberration in humans. Appl. Opt. 1992, 31, 3594–3600. [Google Scholar] [CrossRef] [PubMed]
  63. Llorente, L.; Diaz-Santana, L.; Lara-Saucedo, D.; Marcos, S. Aberrations of the human eye in visible and near infrared illumination. Optom. Vis. Sci. 2003, 80, 26–35. [Google Scholar] [CrossRef] [PubMed]
  64. McLellan, J.S.; Marcos, S.; Prieto, P.M.; Burns, S.A. Imperfect optics may be the eye’s defence against chromatic blur. Nature 2002, 417, 174–176. [Google Scholar] [CrossRef]
  65. Benedi-Garcia, C.; Vinas, M.; Dorronsoro, C.; Burns, S.A.; Peli, E.; Marcos, S. Vision is protected against blue defocus. Sci. Rep. 2021, 11, 352. [Google Scholar] [CrossRef]
Figure 1. Intraocular lenses. (a) Material and designs characteristics for all IOLs; (b) monochromatic optical quality metric (546 nm) in the form of Visual Strehl (4 mm) for all four IOLs: mono-hydrophobic (solid light green); MIOL-hydrophobic (dashed light green); Mono-hydrophilic (solid dark green); MIOL-hydrophilic (dashed dark green).
Photonics 09 00226 g001
Figure 2. Illustration of the computational ray tracing methodology. (a) Representation of the pseudophakic physiological eye model in Zemax to simulate implanted IOL eye conditions. (b) Optical quality metric flow chart. LCA and chromatic difference of focus were obtained from the TFVS curves for the different wavelengths (480–700 nm).
Photonics 09 00226 g002
Figure 3. Computational ray tracing. (a) Visual quality metric in the form of Visual Strehl for pseudophakic model eyes (4 mm) in combination with both materials (empty circles with dotted lines hydrophobic and filled circles with continuous lines hydrophilic) and designs IOLs for blue (480 nm), green (546 nm), and red (700 nm), and (b) chromatic difference of focus (CDF) for all conditions.
Photonics 09 00226 g003
Figure 4. On-bench LCA. (ac) TF MTF (50 LP/mm) for the monofocal, multifocal, hydrophobic (dashed lines), and hydrophilic (solid lines) for blue (480 nm), green (546 nm), and red (650 nm); (d,e) chromatic difference of focus (CDF) for the monofocal and multifocal IOLs, for far (gray lines), intermediate (yellow lines) and near (purple lines) distances; (f) longitudinal chromatic aberration (LCA) for the 480–650 spectral range for far (gray), intermediate (yellow), and near (purple) distances.
Photonics 09 00226 g004
Figure 5. Average chromatic difference of focus (CDF) for far vision. CDF for phakic subjects, and for monofocal hydrophobic (N = 9), monofocal hydrophilic (N = 9), multifocal hydrophobic (N = 20), and multifocal hydrophilic (N = 20) implanted IOLs, measured with subjective (gray circles), and computational (yellow squares) techniques. Error bars stand for inter-subject variability in all cases.
Photonics 09 00226 g005
Figure 6. Average chromatic difference of focus (CDF) for multifocal vision. CDF for hydrophobic and hydrophilic MIOLs for far (0 D), intermediate (1.75 D), and near (3.50 D) vision measured with subjective (gray circles) and computational (yellow squares) techniques. Error bars stand for inter-subject variability in all cases.
Photonics 09 00226 g006
Figure 7. Average LCA (480–700 nm) for far vision for phakic and pseudophakic eyes obtained from subjective (solid gray bars) and computational (solid yellow bars) methods for far vision. ** Highly statistically significant (p < 0.01) differences between conditions. Error bars indicate inter-subject variability.
Photonics 09 00226 g007
Figure 8. Average LCA (480–700 nm) for multifocal vision for hydrophobic and hydrophilic MIOLs from subjective (solid gray bars) and computational (solid yellow bars) methods for far, intermediate, and near vision. Error bars stand for inter-subject variability in all cases. ** Statistically significant (p < 0.01) differences between conditions. Error bars indicate inter-subject variability.
Photonics 09 00226 g008
Table 1. Refractive and IOL profile of the patients participating in the different studies.
A Phakic eyes
Sample5 young subjects (5 eyes)Crystalline lens
Age28.60 ± 1.89 years
Subjective refraction0 to −4.50 D (−1.15 ± 0.95 D); astigmatism ≤ −0.5 D
MeasurementsMonocular
StudyVinas et al. BOE 2015
doi: 10.1364/OE.23.00948
B Pseudophakic eyes
B.1 Patients implanted with hydrophilic and hydrophobic monofocal IOL
Sample9 subjects (18 eyes)Monofocal hydrophilic and hydrophobic IOL
Age73.92 ± 4.28 years
Subjective refraction−3.25 to +3.00 D (Sph: +0.18 ± 0.26 D; cyl: −0.42 ± 0.52 D)
MeasurementsMonocular. Both eyes (Bilateral implantation)
IOL designMonofocal asferic
IOL materialHydrophilic (Abbe number: 58; RI: 1.46; PODAY)
Hydrophobic (Abbe number: 41.91; RI: 1.52; PODEYE)
StudyVinas et al. JCRS 2015
doi: 10.1016/j.jcrs.2015.11.009
B.2 Patients implanted with hydrophilic M-IOL
Sample10 subjects (20 eyes)Trifocal hydrophilic
MIOL
Age66.70 ± 3.25 years
Subjective refraction−0.75 to + 0.75 D (Sph: +0.06 ± 0.170 D; cyl: −0.28 ± 0.40 D)
MeasurementsMonocular. Both eyes (Bilateral implantation)
IOL designTrifocal diffractive
IOL materialHydrophilic (Abbe number: 58; RI: 1.46; POD F)
StudyVinas et al. JRS 2017
doi: 10.3928/1081597X-20170814-01
B.3 Patients implanted with hydrophobic M-IOL
Sample10 subjects (20 eyes)Trifocal hydrophobic
MIOL
Age64.56 ± 3.52 years
Subjective refraction−1.00 to + 1.25 D (Sph: −0.05 ± 0.13 D; cyl: −0.19 ± 0.34 D)
MeasurementsMonocular. Both eyes (Bilateral implantation)
IOL designTrifocal diffractive
IOL materialHydrophobic (Abbe number: 41.91; RI: 1.52; POD F GF)
StudyVinas et al. JRS 2020
doi: 10.3928/1081597X-20200930-01
RI: refractive index; MIOL: multifocal intraocular lens;
Publisher’s Note: MDPI stays neutral with regard to jurisdictional claims in published maps and institutional affiliations.

