
Solid Solutions LnxU1−xC2 with Ln = Tb, Dy, Ho, Tm, and Lu Showing Ideal Vegard Behavior

1
Institut für Anorganische Chemie im Department für Chemie, Universität zu Köln, Greinstraße 6, 50939 Köln, Germany
2
Fakultät für Physik and Center for Nanointegration Duisburg-Essen (CENIDE), Universität Duisburg-Essen, Lotharstraße 1, 47057 Duisburg, Germany
*
Author to whom correspondence should be addressed.
Inorganics 2023, 11(12), 457; https://0-doi-org.brum.beds.ac.uk/10.3390/inorganics11120457
Submission received: 26 October 2023
/
Revised: 16 November 2023
/
Accepted: 22 November 2023
/
Published: 25 November 2023
(This article belongs to the Special Issue 10th Anniversary of Inorganics: Inorganic Solid State Chemistry)
Abstract
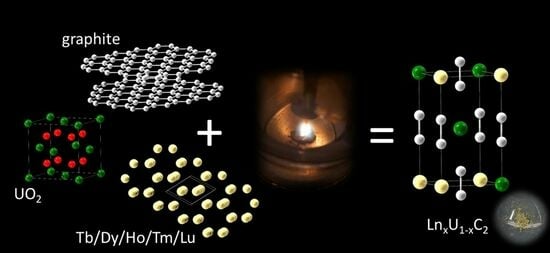
:The reaction of UO2 with the respective lanthanide metal and purified graphite in an arc-melting furnace led to the formation of solid solutions of the composition LnxU1−xC2, with Ln = Tb, Dy, Ho, Tm, and Lu. They all crystallize in the tetragonal CaC2 type structure (I4/mmm, Z = 2). Elemental analyses of selected samples (EDX) confirm that the composition of the resulting solid solution is in reasonable agreement with the nominal (weighed-in) composition of the starting materials, i.e., a significant evaporation of the lanthanide metals during the arc-melting synthesis does not occur. The lattice parameters of the solid solutions were extracted using Le Bail fits of high-resolution synchrotron powder diffraction data (beamline P02.1, DESY, Hamburg, Germany; beamline BL 09, DELTA, Dortmund, Germany), revealing ideal Vegard behavior for all five solid solutions. XANES investigations on all compounds at the Ln-LIII and U-LIII edges reveal that the occupancies of the U-6d orbitals decrease with increasing x, whereas the occupancies of the Ln-5d orbitals increase, pointing to an electron transfer from the uranium to the lanthanide cations. Examination of the shifts of the absorption edge (E0) leads to the same finding.
1. Introduction
The tetragonal CaC2 type structure (I4/mmm, Z = 2) is well-known in the crystal chemistry of metal carbides [1]. Not only the alkaline earth metal carbides AEC2 (AE = Ca, Sr, Ba) with divalent metal cations crystallize in this structure type [2], but also trivalent rare earth metals (LnC2 with Ln = Y, La-Lu with the exception of Eu) [3] and uranium (UC2) are found in this structural arrangement [4]. For the latter, a tetravalent uranium cation was observed [5]. The CaC2 type structure can be understood as a distorted variant of the cubic rocksalt type structure (NaCl): C2 dumbbells occupy the Cl- position in octahedral voids of an fcc arrangement of the respective metal cations in an ordered fashion—all aligned along [001]—thus leading to a tetragonal distortion of the unit cell (Figure 1). It is notable that this structure type was also found for some peroxides (e.g., BaO2) [6], superoxides (e.g., KO2) [7], or diazenides (e.g., SrN2) [8]. A monoclinically distorted variant of the tetragonal CaC2 type structure, sometimes named CaC2-I, is the so-called ThC2 type structure (C2/c, Z = 4). It is not only realized in ThC2 [9], but it is also a low-temperature modification of alkaline earth metal carbides (AEC2 with AE = Ca, Sr, Ba) [10,11,12], and, as an exception to all other lanthanide dicarbides, EuC2 crystallizes in the ThC2 type structure as well [13]. Going to higher temperatures, enhanced rotational mobility of the C2 units is observed, leading to a high-temperature modification with disordered anions, thus crystallizing in the cubic undistorted rocksalt type structure (Fmm, Z = 4) [14]. The transition temperatures in the binary system MC2 depend very much on the charge/radius ratio of the respective metal cations [13] (Figure 8 therein).
A few years ago, we started to investigate solid solutions of the general composition LnxAE1−xC2. For EuxSr1−xC2, we observed an ideal Vegard behavior [15], which is not surprising due to the very similar ionic radii of Sr2+ (118 pm) and Eu2+ (117 pm) for CN = 6 [16]. Using XANES, we observed interesting valence changes of ytterbium in YbxCa1−xC2 depending upon the composition x and the crystal structure (CaC2 vs. ThC2 type structures) [17]. Notably, these valence changes led to a drastic volume decrease of ~12%. Taking the ionic radii (CN = 6) for Ca2+ (100 pm), Yb2+ (102 pm), and Yb3+ (87 pm) [16] into account, it is evident that at the Ca-rich side, Yb is forced into its divalent state, whereas at the Yb-rich side, an almost trivalent Yb dominates [17], similar to pristine YbC2 [18]. Further investigations on CaxEu1−xC2, BaxEu1−xC2, SrxYb1−xC2, and BaxYb1−xC2 revealed the following [19]:
- Valence changes are only observed for ytterbium but not for europium, which is solely found in its divalent state in these carbides.
- Ideal Vegard behavior is only observed for metal cations with very similar ionic radii, i.e., EuxSr1−xC2.
- No ternary phases with defined compositions have been found in any of these investigations.
- For large differences in the ionic radii of the constituting metal cations, either no complete miscibility was found, i.e., a miscibility gap was observed, or the cubic high-temperature modification was already observed at room temperature to reduce the lattice strain.
Based on these findings, we have started to investigate solid solutions of the composition LnxU1−xC2. UC2 is of specific interest, as it is one of the possible uranium sources for nuclear power plants of the 4th generation [20]. Earlier investigations on LnxU1−xC2 solid solutions by other groups revealed inconclusive results at first sight. For GdxU1−xC2, “a continuous series of solid solutions” was reported with solely tetragonal CaC2-type structures of quenched samples [21], whereas for LaxU1−xC2 and CexU1−xC2, unusual discontinuities in the curve Vunit cell = f(x) were observed [22,23]. The analysis was somewhat hampered by the fact that at certain compositions, the cubic high-temperature modification (Fmm, Z = 4) is formed, which is a well-known effect for metal cations with very differing ionic radii, as mentioned above. Additionally, miscibility gaps cannot be excluded completely. In Table 1, we have summarized these results and correlated them with the ionic radii of the constituting metal cations (CN = 6) with r(U4+) = 89 pm [16]. It is obvious that the behavior of the solid solutions depends very much on the ratio r(Ln3+)/r(U4+), i.e., for larger Ln3+ cations (Ln = La, Ce), discontinuities are found obviously due to lattice strain as discussed above, whereas for the smaller Ln3+ cations starting with Gd3+, an ideal Vegard behavior is observed. The results of our work reported in the following have already been included in Table 1. They confirm these assumptions; details will be given in the following. Additionally, we have included XANES investigations to shed some light on the electronic states of the constituting metal cations in the solid solutions LnxU1-xC2 with Ln = Tb, Dy, Ho, Tm, and Lu. XANES has been shown to be a versatile tool for the analysis of lanthanide [17,18,24] as well as uranium [25,26] cations.
2. Results and Discussion
2.1. Synthesis and Structure Analysis
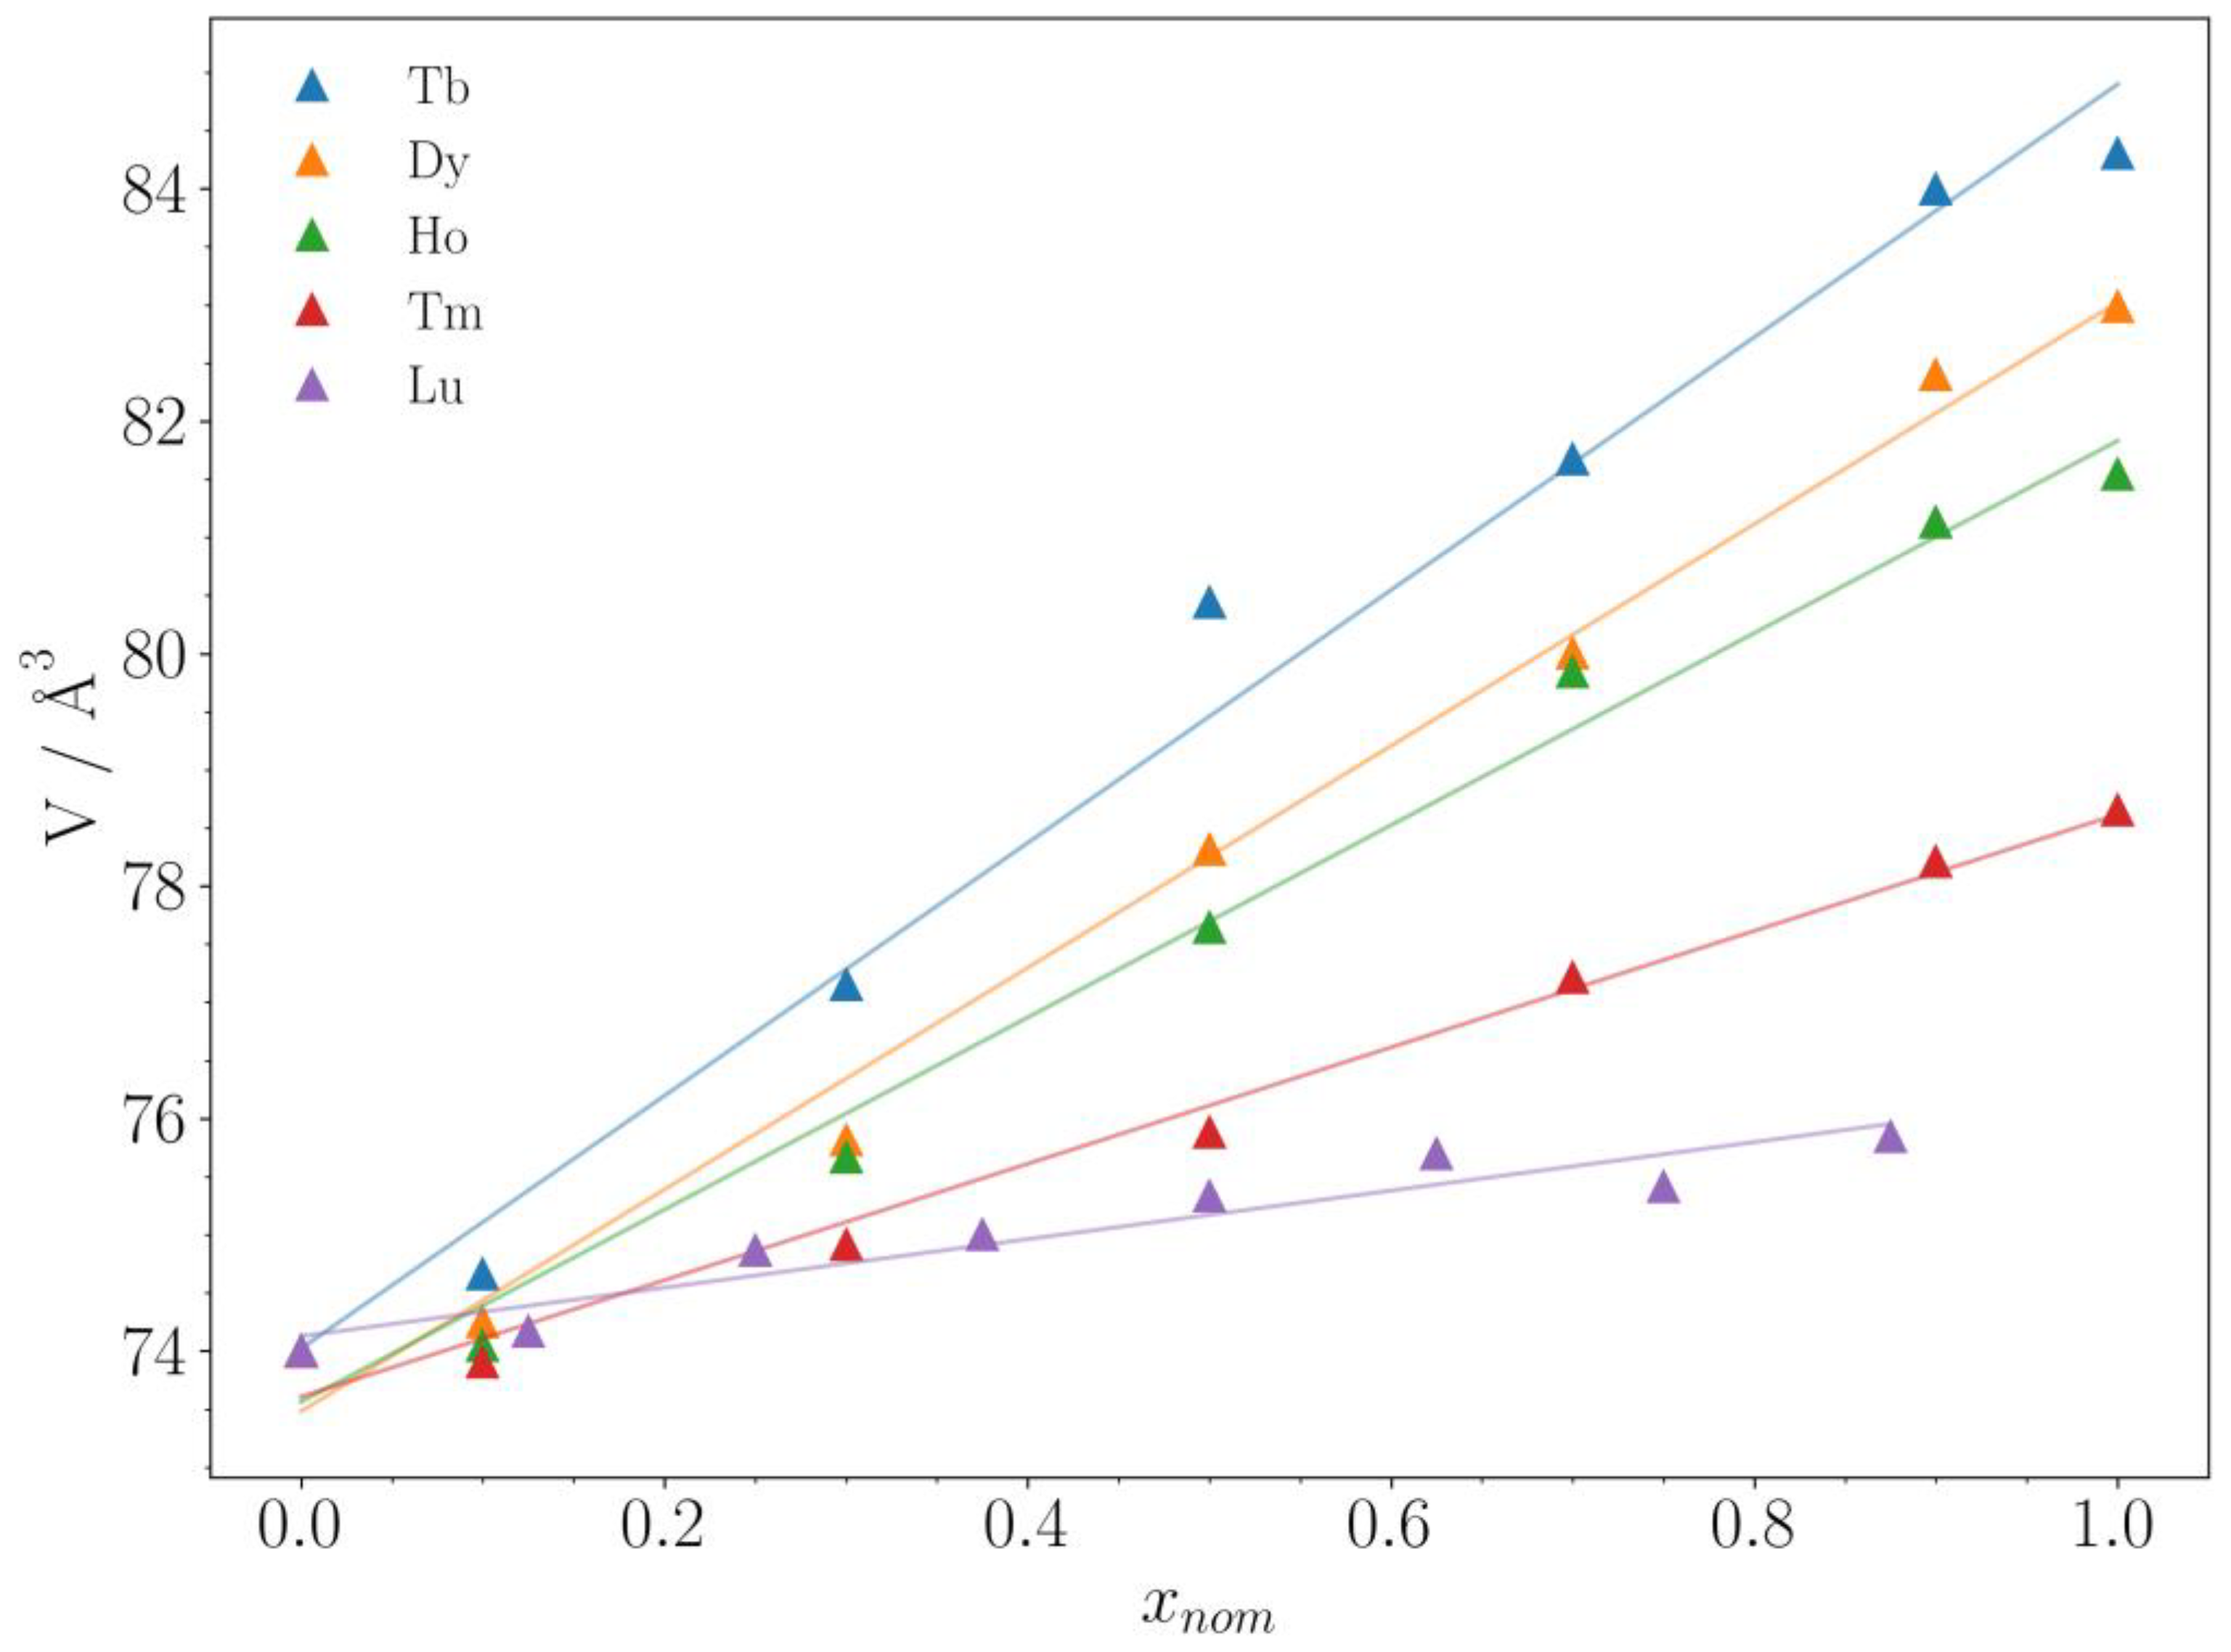
As already mentioned in Table 1 (Introduction), all solid solutions LnxU1−xC2 with Ln = Tb, Dy, Ho, Tm, and Lu crystallize in the CaC2 type structure (I4/mmm, Z = 2), showing Vegard behavior. This can clearly be seen in the plots of the lattice parameters a and c vs. x given in the Supporting Information (Figures S1.1–S5.1). No miscibility gaps or occurrence of the cubic high-temperature modification (Fmm, Z = 4) are observed. This is obviously due to the very similar radii of U4+ and the respective Ln3+. The ratios r(Ln3+)/r(U4+) of the “Vegard systems” range from 1.05 (Ln = Gd) [21] to 0.97 (Ln = Lu). For larger Ln3+ cations, e.g., Ce3+ or La3+, larger r(Ln3+)/r(U4+) ratios are calculated, and accordingly, no longer a Vegard behavior is observed [22,23]. Figure 2 summarizes the results for the “Vegard systems” of this work in a plot of the unit cell volumes vs. x. The straight lines are just guides for the eye and do not represent Vegard’s law.
In the series of 4f elements plotted in Figure 2, samarium, europium (the elements before gadolinium in the periodic table of elements), and ytterbium (the element before lutetium) are missing. Despite several attempts, we were unable to synthesize the solid solution LnxU1−xC2 with Ln = Sm, Eu, and Yb. Due to the low boiling points of these elements (Sm: 1794 °C, Eu: 1529 °C, and Yb: 1196 °C), they evaporated during the synthesis in the arc-melting furnace so that no formation of a complete solid solution series was achieved. Other synthetic approaches, e.g., starting from the respective oxides, were also unsuccessful up until now.
Another “missing” solid solution in Figure 2 is ErxU1−xC2. The boiling point of erbium is 2868 °C, so it should be accessible by the synthetic method described in the “Materials and Methods” section. Actually, we were able to synthesize this solid solution as well, but it shows unexpected structural behavior, which is also reflected in unusual XANES spectra. These effects are still under investigation, and therefore the solid solution ErxU1−xC2 is omitted from the discussion in this work. For the solid solution LuxU1−xC2, there is no unit cell volume given for x = 1.0 in Figure 2, i.e., pure LuC2. In fact, we were unable to synthesize this dicarbide and obtained Lu4C7 in all our attempts (Figures S5.2 and S5.3, Supporting Information).
As can be seen in Figure 2, the slope of the curves V = f(x) decreases from Tb to Lu. This is not surprising, as the ionic radii decrease in the same direction from r(Tb3+) = 92.3 pm to r(Lu3+) = 86.1 pm. However, as the ionic radius of U4+ is 89 pm, one would expect a negative slope for TmxU1−xC2 (r(Tm3+) = 88 pm) and LuxU1−xC2 (r(Lu3+) = 86.1 pm), which is not observed. The reasons for this are unclear. It could point to a wrong (too large) ionic radius of U4+ in the literature [16] or a wrong assignment of the valence state of uranium in UC2 [5]; it might be larger than +4. We prefer the interpretation that very strong (covalent) U-C bonding occurs in UC2, leading to a reduction of its unit cell volume. This has also been concluded from first-principles calculations [27]. It is truly worth following this interesting aspect in more detail in future investigations.
2.2. XANES Investigations
As mentioned in the introduction, XANES has been shown to be a versatile tool for the analysis of electronic states of lanthanide [17,18,24] as well as uranium [25,26] cations. Figure 3 shows a typical spectrum at the U-LIII edge of a solid solution investigated in this work. The resulting observables from these spectra (E0, EWL, and AWL) as well as the procedure for the fit of the spectrum are given. More details are presented in “Materials and Methods”. The white line of the Ln-LIII spectra was fitted with one gaussian function, and the white line of the U-LIII spectra had two gaussians, as shown in Figure 3.
In short, the energy of the absorption edge (E0) is typically used as an indicator for the oxidation state of the respective metal. It is obtained from the maximum of the first derivative of the absorption spectrum. Using an appropriate reference standard, this approach has been shown to be very successful [28,29]. However, the shift of E0 is not only driven by the oxidation state of the respective edge metal but also by the chemical nature of the ligands, and the whole spectrum is dependent on the coordination geometry [25,30]. As all solid solutions investigated in this work crystallize in the CaC2 type structure (I4/mmm, Z = 2) with C2 dumbbells connecting the U/Ln metal centers, the influence of the latter on the shift of E0 can be neglected, which in turn allows us to interpret these shifts as a direct indicator of changing electron densities at the lanthanide and uranium centers.
The shift of the energy of the white line (EWL) is small in the compounds of this investigation. It will be analyzed briefly at the end of this chapter. We attribute these small shifts of EWL to the metallic character of the solid solution LnxU1−xC2. For ionic/covalent uranium compounds, significant shifts in EWL have been reported [31]. The area of the white line (AWL) is a direct indicator for the occupation of the respective d orbitals, i.e., 5d orbitals for Ln-LIII and 6d orbitals for U-LIII edges. If the respective d orbitals are fully occupied, the white line vanishes [32]. Thus, AWL allows for the analysis of trends in changing electron densities within the solid solutions of this work.
The starting point of our investigation was the assumption that electron density might be transferred from U(IV)C2 to Ln(III)C2 and vice versa via the C2 dumbbells, in which—in a molecular picture—antibonding π* states are occupied (one π* electron in LnC2 and two π* electrons in UC2). To analyze this, we recorded XANES spectra at the U-LIII edge (E = 17.2 keV, beamline BL10 of the DELTA synchrotron facility) and the Ln-LIII edge (E = 7.51 keV (Tb)–9.24 keV (Lu), beamline BL8 of the DELTA synchrotron facility). Spectroscopy at the LIII edge probes the 2p3/2 → (n + 1)d transitions. Due to the high energy of the U-LIII edge, the absorption effects of air and the matrix can be neglected. However, spectra at the Ln-LIII edges are affected by these effects. Especially for low lanthanide loadings and high uranium ratios, spectra of only modest quality (cp. Figures S6.1–S10.1, Supporting Information) result. This has to be taken into account in the following interpretation of the results.
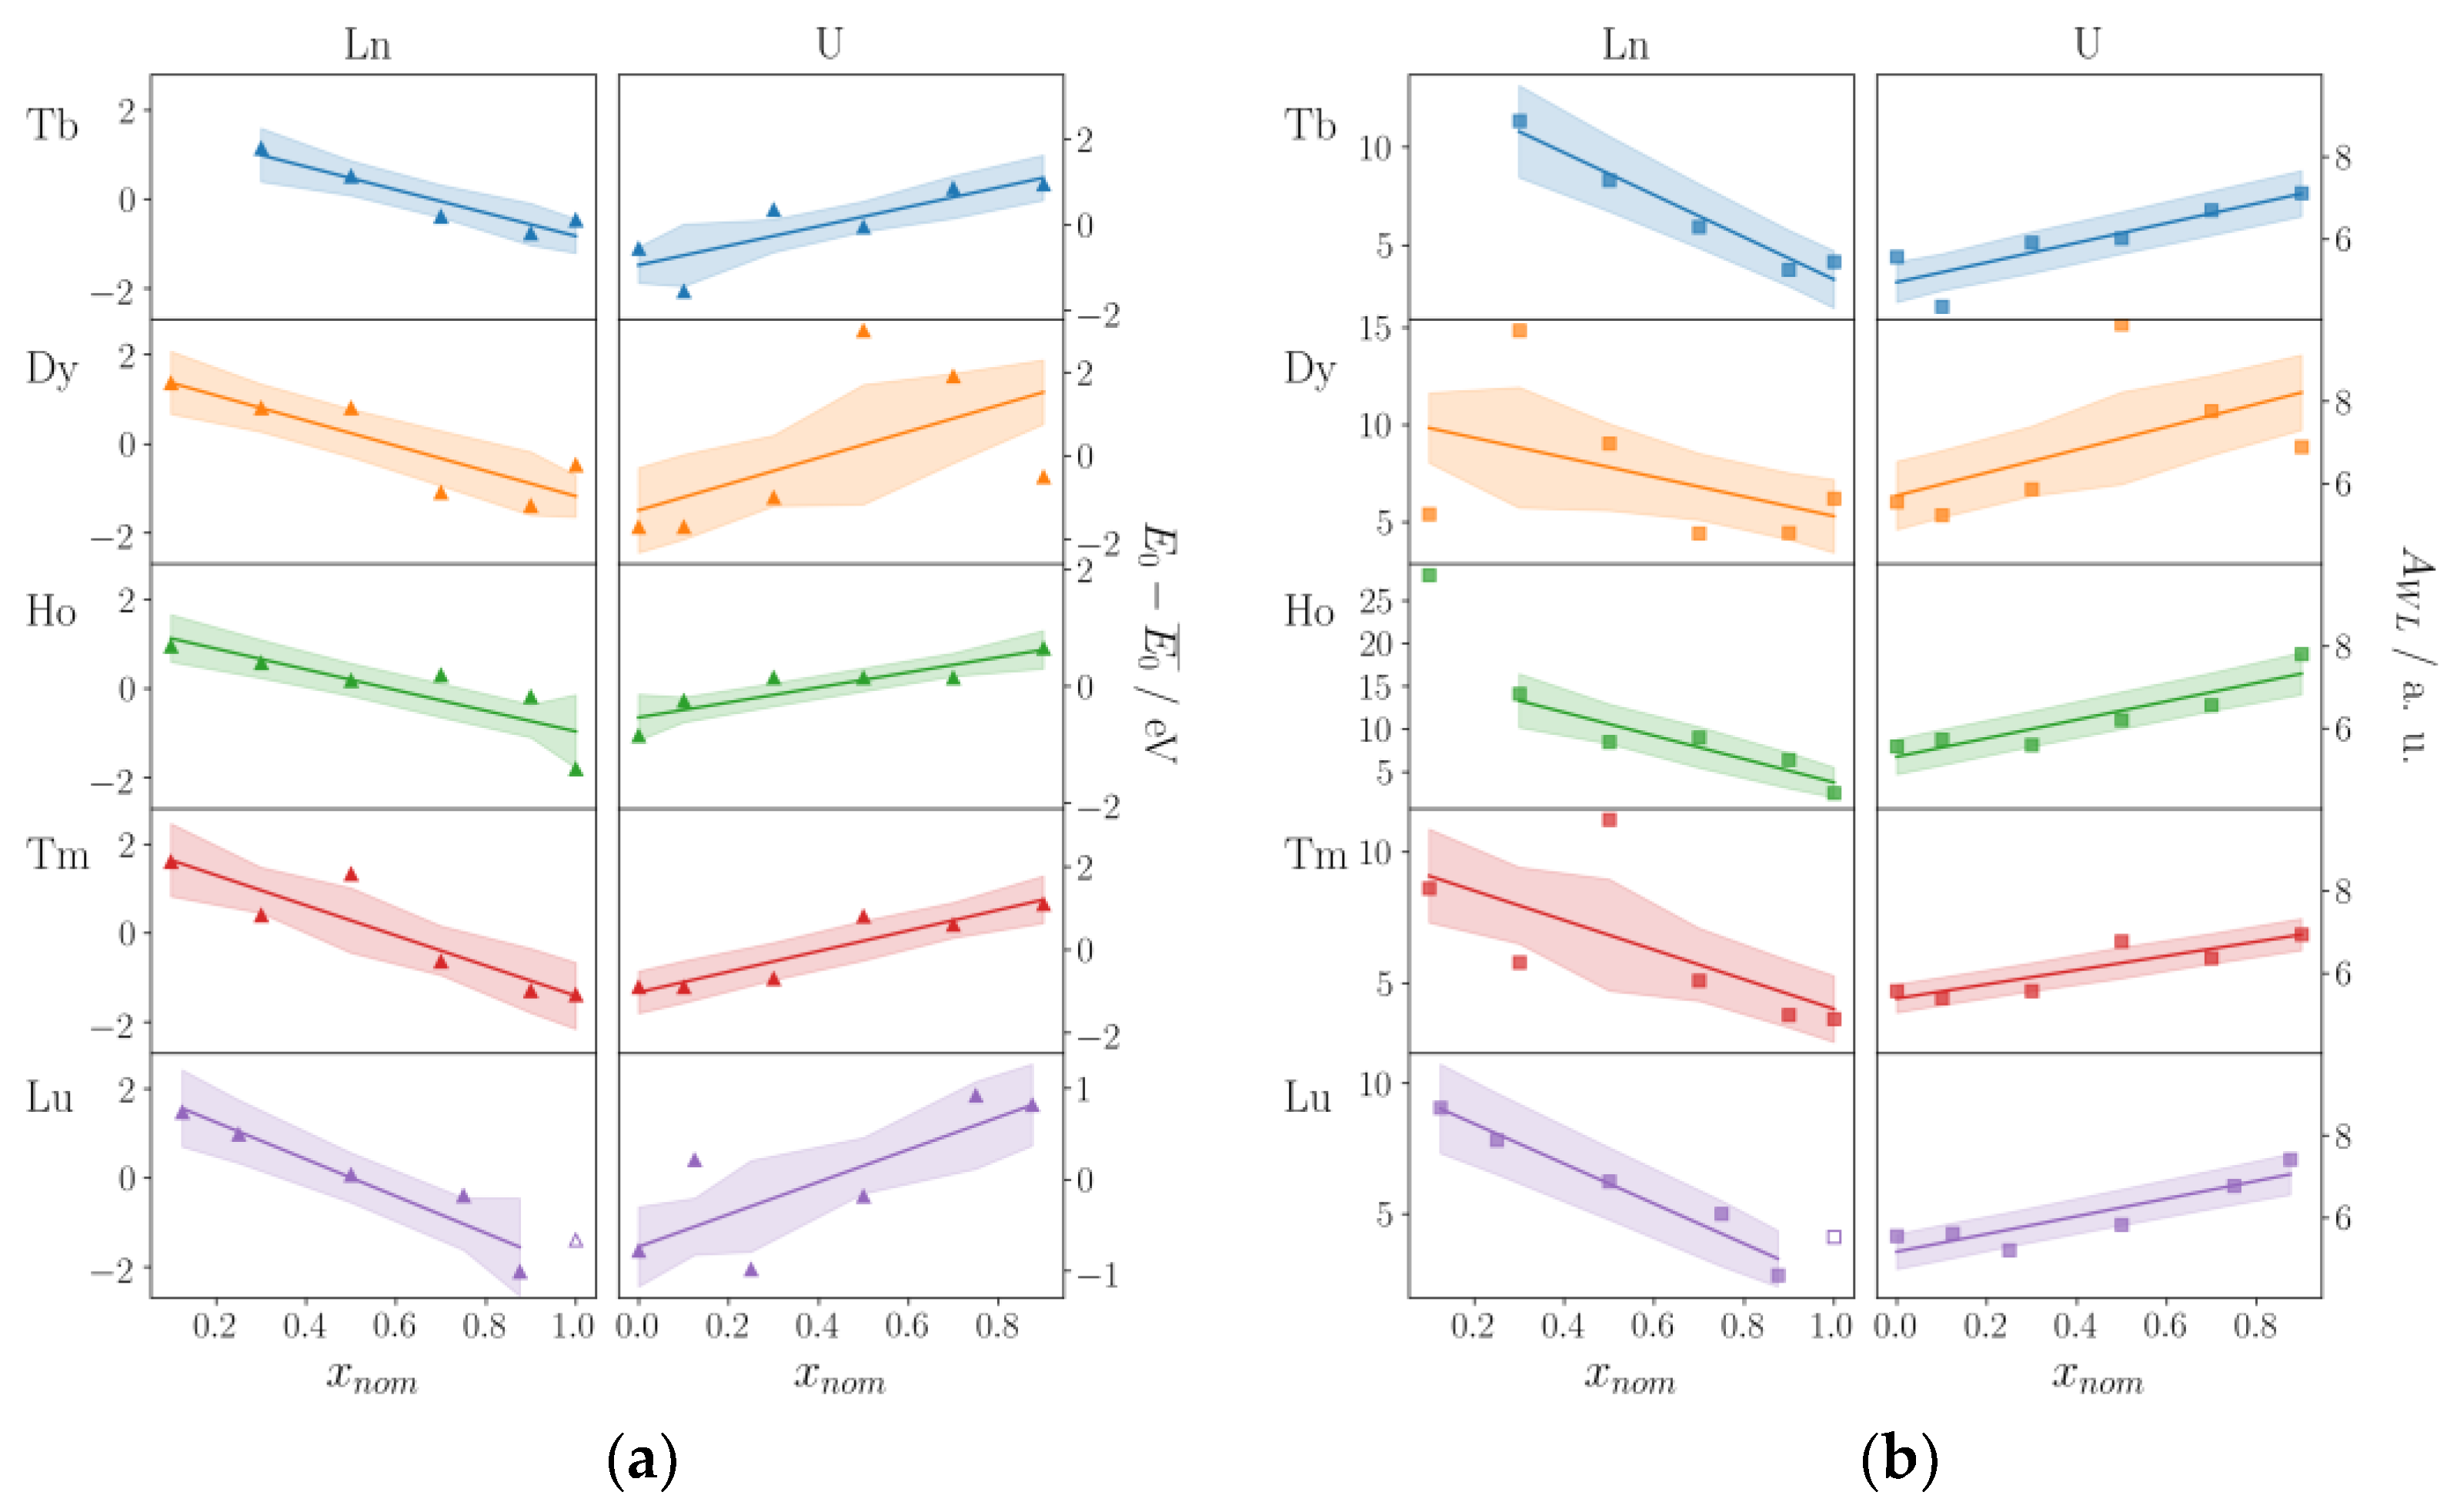
In Figure 4, the results of the XANES investigations are summarized. The shaded area gives a confidence interval of 68%, and the straight line is a linear regression to the obtained observables E0 and AWL. Some data points were omitted from these fits due to the low quality of the respective spectra (see earlier). The exact values of E0, AWL, and EWL as obtained from the fits of the XANES spectra are given in Tables S6–S10 (Supporting Information). Figure 4 clearly shows that a similar trend for E0 (Figure 4a) and AWL (Figure 4b) is obtained at the Ln-LIII edges (left columns) and U-LIII edge (right columns), respectively. Whereas E0 decreases at the Ln-LIII edges with increasing xnom for LnxU1−xC2, it increases at the U-LIII edge for a decreasing uranium content. This is interpreted as a gradual transfer of electron density from uranium to the lanthanide with increasing xnom, i.e., an increasing lanthanide content in the solid solution LnxU1−xC2. In Table 2, the slopes of the linear regression lines shown in Figure 4 are summarized. For E0 = f(xnom), a negative slope ranging from −2.39 eV/x to −3.69 eV/x is found for investigations at the Ln-LIII edges, whereas investigations at the U-LIII edge result in a positive slope ranging from 1.22 to 2.91 eV/x. Despite large standard deviations, as expected from the spread of the data points shown in Figure 4, the fairly similar slopes in these investigations show that the transfer of electron density is very comparable in the five solid solutions LnxU1−xC2 with Ln = Tb, Dy, Ho, Tm, and Lu of this work. For pristine UC2, for which an oxidation state of U4+ was determined by means of Raman spectroscopy [5], we obtained an E0 value of 17.1672 keV at the U-LIII edge. It is notable that for UO2 with U4+ as well, E0 = 17.1702 keV was reported [33]. This reflects the tremendous influence of different ligands on the position of E0 and the difficulties in determining oxidation states from such measurements of the absorption edges alone (see earlier) [25,30].
A similar picture is observed for AWL, the area of the white line (Figure 4b). With increasing lanthanide content, the area of the white line decreases at the Ln-LIII edges, whereas it increases at the U-LIII edge. This means that with increasing lanthanide content, the occupation of the Ln-5d-orbitals increases, whereas the occupation of the U-6d-orbitals decreases in the same direction. This is due to an electron transfer from the U-6d to the Ln-5d-orbitals, which is in agreement with the results obtained from the E0 = f(xnom) data. In Table 2, the slopes of the linear fits of AWL = f(xnom) are given for the Ln-LIII and U-LIII edges. For the negative slopes at the Ln-LIII edges, there is a significant spread, but the positive slopes ranging from 1.62 to 2.75 a.u./x for the measurements at the U-LIII edge point to a comparable electron transfer in all five solid solutions examined in this work.
In Tables S6–S10 (Supporting Information), the EWL values obtained from the fits of all spectra are also given. For measurements at the U-LIII edge, they show only very small shifts ranging from 17.1747 to 17.1763 keV, excluding one outlier for Dy0.5U0.5C2 (EWL = 17.1775 keV). Kosog et al. investigated the XANES spectra of several uranium coordination complexes at the U-LIII edge. Intriguingly, these complexes possess a nearly identical first coordination sphere and geometry, but oxidation states range from UIII to UVI [31]. For EWL, they found the following values: 17.1736 keV (UIII), 17.1766 keV (UIV), 17.1784 keV (UV), and 17.1806 keV (UVI). Thus, the shift of EWL in the solid solutions LnxU1−xC2 of approx. 1.6 eV is significantly smaller than the shift found from an UIII to an UIV complex (ΔEWL = 3.0 eV) in the investigations by Kosog et al. [31]. Accordingly, the electron transfer in the LnxU1−xC2 compounds from the uranium to the lanthanide cations can be estimated as being small.
3. Materials and Methods
3.1. Synthesis
In general, the solid solutions LnxU1−xC2 with Ln = Tb, Dy, Ho, Tm, and Lu were synthesized from UO2, the respective lanthanide metal, and purified graphite in a self-constructed arc-melting furnace [34] according to:
x Ln + (1 − x) UO2 + (4 − 2x) C → LnxU1−xC2 + (2 − 2x) CO
Prior to the reaction, purchased graphite (Fa. Alfa Aesar, 99%) was heated at 800 °C for 24 h under high vacuum (~1×10⁻³ mbar) and stored in an argon atmosphere afterwards. UO2 (donation, no impurities detected in its X-ray powder diffraction pattern) and the respective lanthanide metal (Fa. ChemPUR: Tb: 99.9%; Dy: 99.9%; Ho: 99.9%; Tm: 99.9%; Fa. Smart Elements: Lu: 99.99%) were weighed in in the respective ratios (“nominal composition”) and a slight surplus of purified graphite was added.
In a typical experiment, 42.2 mg freshly filed Tb (0.266 mmol, 1 eq) and 71.7 mg UO2 (0.266 mmol, 1 eq) were mixed with 22.0 mg purified graphite (1.83 mmol, 3.44 eq) in an argon-filled glovebox (Fa. MBraun), leading to the nominal composition Tb0.5U0.5C2. A little surplus of graphite was used to account for possible oxide impurities of the lanthanide metals (reduction to the respective metal under the formation of CO/CO2). In the glovebox, the mixture was pressed into a small pellet (∅ ≈ 7 mm), which was transferred to the arc-melting furnace outside the glovebox using a self-constructed shuttle system. Thus, the contact with air was minimized to a few seconds. In the furnace, the pellet was heated for a short time with an electric current of 30 A. After cooling to room temperature, an almost spherical melting droplet remained (Figure S1, Supporting Information), which was transferred back to the glovebox using the shuttle system mentioned above. All further handling was carried out under inert conditions. XRPD was used to check the purity of the synthesized samples. No oxide impurities were observed. In some cases, the strongest graphite reflection was visible, as the latter was added in surplus. In all samples synthesized in this work, carbides crystallizing in the tetragonal CaC2 type structure were observed. For selected samples (Tables S1–S4, Supporting Information), the composition (Ln:U ratio) was verified by EDX analysis. To estimate the accuracy of this analysis, for some samples, three different spots were measured, from which a standard deviation was deduced. The reasonable agreement between the nominal and the analyzed composition confirmed that no significant evaporation of the lanthanide metals took place during the reaction.
3.2. X-ray Powder Diffraction (XRPD)
The purity of the samples was checked by XRPD collected at room temperature on a Stoe Stadi P powder diffractometer (germanium monochromator, MoKα1 radiation, λ = 0.70926 Å, Mythen detector). Samples were sealed in glass capillaries (∅ = 0.1 mm) under inert conditions. Typical recording times were 30–90 min. Employing the WinXPow software suite [35], the recorded patterns were compared with theoretical patterns calculated from known structure data.
3.3. Synchrotron Powder Diffraction
Synchrotron powder diffraction data was collected at two different beamlines.
- (a)
- Beamline P02.1 of the DESY synchrotron radiation facility, Hamburg/Germany [36]: all samples were sealed in glass capillaries (∅ = 0.3 mm) in an argon atmosphere and were measured with the beamline area detector Varex XRD 4343CT (150 × 150 µm2 pixel size, 2880 × 2880 pixel area, CsI scintillator directly deposited on amorphous Si photodiodes) with a wavelength of λ = 0.20735 Å at room temperature. The resulting 2-dimensional TIFF images were processed into 1-dimensional diffraction data using the integration software Dioptas [37]. A LaB6 (NIST 660c) standard was measured in addition to conducting the detector calibration, which is required to perform the azimuthal integration with the Dioptas software. The WinXPow software package [35] was used for raw data handling and visual inspection of the data. The final diffraction patterns and refinements were visualized with Matplotlib [38] using a self-written Python script [39].
- (b)
- Beamline BL 09 of the DELTA synchrotron facility, Dortmund/Germany [40]: the measurements were performed in glass capillaries (sealed in an argon atmosphere, Ø = 0.3 mm) at room temperature with a wavelength of 0.4959 Å using a PILATUS 100 K detector (steps of 0.0825° in 2θ, 10 s integration time per data point, recording time: ~70 min). The WinXPow software package [35] was used for raw data handling and visual inspection of the data. The final diffraction patterns and refinements were visualized with Matplotlib [38] using a self-written Python script [39].
3.4. Le Bail Fits
To determine the unit cell parameters of the data obtained at the DESY and DELTA synchrotron facilities precisely, Le Bail fits applying the TOPAS 5 software [41] were conducted using the following set of variables in the refinements: background (Chebychev function with 4–10 variables), tetragonal lattice parameters a and c, zero shift, and profile parameters (pseudo-Voigt TCHZ function with LX, GU, GV, and GW). The anisotropic reflection broadening was corrected according to Stephens [42] (S004 for tetragonal symmetry). Selected parameters obtained from these Le Bails fits are summarized in Tables S1–S5 (Supporting Information), and the respective fits are given in Figures S1.3–S5.3, Supporting Information. As an example of the quality of the data and the refinement, a plot of the Le Bail fit of Dy0.9U0.1C2 is given in Figure 5.
3.5. EDX Analysis
The EDX analyses were conducted on a Zeiss Neon40 CrossBeam REM equipped with an Oxford Inca DryCool EDX detector. In a glovebox, powdered samples of the solid solutions were spread on graphite tape attached to an aluminum base. Typically, several spots of the samples were investigated, from which a mean value for the Ln:U ratio was calculated. The results are given in Tables S1–S4 in the Supporting Information.
3.6. XANES
XANES spectra were recorded at beamlines BL 08 (U-LIII) [43] and BL 10 (Ln-LIII) [44] of the DELTA synchrotron facility in Dortmund, Germany. The samples were sealed in glass capillaries (∅ = 0.1 mm) in a glovebox under inert conditions (argon atmosphere). Spectra at the Ln-LIII edge were corrected against a Ni standard using Athena [45]. Least-squares fits were conducted with NumPy [46] and SciPy [47] using Python scripts [39]. The final spectra as well as their fits were visualized with Matplotlib [38] using Python scripts [39]. All spectra, fits, and results of the fits are given in the Supporting Information in Tables S6–S10 and Figures S6.1–S10.4.
4. Conclusions
By reaction of UO2 with purified graphite and the respective lanthanide metal in an arc-melting furnace, highly crystalline solid solutions LnxU1−xC2 with Ln = Tb, Dy, Ho, Tm, and Lu were obtained. They crystallize in the tetragonal CaC2 type structure (I4/mmm, Z = 2) and show ideal Vegard behavior. This behavior can be rationalized by the very similar ionic radii of U4+ and Ln3+ for the late lanthanides, which are the observed oxidation states for pristine U(IV)C2 and Ln(III)C2. For Ln = Gd, Vegard behavior was also reported in the literature [21], but the earlier lanthanides La3+ and Ce3+ are obviously too large, so no longer Vegard behavior is observed [22,23]. Attempts to synthesize the “missing” solid solutions with the late lanthanides Ln = Sm, Eu, and Yb failed, as due to their low boiling points, they evaporated during the synthesis. Nonetheless, for higher Sm contents (x > 0.6), a linear Vegard behavior was also observed, but for x < 0.5, high evaporation rates of samarium hindered a meaningful interpretation of the resulting data. Alternative approaches starting from the respective oxides LnO/Ln2O3 or combining the elements U/Ln/C at lower temperatures were not successful.
Another “missing” solid solution is ErxU1−xC2, which was synthesized successfully. All compounds crystallize in the tetragonal CaC2 type structure as well, but very surprisingly, no longer an ideal Vegard behavior is observed. This unusual behavior is part of our ongoing investigations in this field.
To examine the electronic structure of these new solid solutions, LnxU1−xC2 (Ln = Tb, Dy, Ho, Tm, and Lu), XANES spectra of all compounds were recorded at the U-LIII and the respective Ln-LIII edges. Shifts of the absorption edge E0 as well as changing areas of the white line AWL clearly show that with increasing lanthanide content, electron density is gradually transferred from the uranium to the lanthanide cations. Comparison with other uranium compounds and their reported XANES spectra shows that the transfer of electron density is low, far beyond the transfer of an electron and thus a change of the oxidation state.
To corroborate the findings of this work, the investigations shall be extended to XANES investigations at the U-MIV edge. It has been shown that these measurements are much more sensitive for transfers of electron densities within such systems [33]. Furthermore, it will be indispensable to support the findings from the XANES spectra through theoretical calculations. Several codes for the analysis of XANES spectra have been reported, but machine learning approaches have also been presented recently [48]. However, such calculations are extremely difficult and time-consuming for heavy elements like uranium.
Supplementary Materials
The following supporting information can be downloaded at: https://0-www-mdpi-com.brum.beds.ac.uk/article/10.3390/inorganics11120457/s1, Figure S1: Snapshots of melting droplets of LuC2 and TbC2; Tables S1–S5: Summary of Le Bail fits and EDX analyses of LnxU1−xC2 (Ln: Tb, Dy, Ho, Tm, and Lu); Figures S1.1–S5.1: Lattice parameters a and c of LnxU1−xC2 (Ln: Tb, Dy, Ho, Tm, and Lu) in dependence of x; Figures S1.2–S5.2: Sections of the synchrotron powder diffraction patterns of LnxU1−xC2 (Ln: Tb, Dy, Ho, Tm, and Lu) in dependence of x; Figures S1.3–S5.3: Le Bail fits of LnxU1−xC2 (Ln: Tb, Dy, Ho, Tm, and Lu); Tables S6–S10: Summary of results of XANES spectra of LnxU1−xC2 (Ln: Tb, Dy, Ho, Tm, and Lu); Figures S6.1–S10.1: XANES spectra of LnxU1−xC2 (Ln: Tb, Dy, Ho, Tm, and Lu) at the Tb-LIII and U-LIII edge; Figures S6.2–S10.2: Graphical summary of the results of the XANES spectra of LnxU1−xC2 (Ln: Tb, Dy, Ho, Tm, and Lu) at the Tb-LIII and U-LIII edge; Figures S6.3–S10.3: Fits of the XANES spectra of LnxU1−xC2 (Ln: Tb, Dy, Ho, Tm, and Lu) at the Tb-LIII edge; Figures S6.4–S10.4: Fits of the XANES spectra of LnxU1−xC2 (Ln: Tb, Dy, Ho, Tm, and Lu) at the U-LIII edge.
Author Contributions
Conceptualization, C.T. and U.R.; methodology, C.T. and H.W.; software, C.T.; formal analysis, C.T.; investigation, C.T.; data curation, C.T.; writing—original draft preparation, U.R.; writing—review and editing, C.T., H.W., and U.R.; visualization, C.T.; supervision, U.R. All authors have read and agreed to the published version of the manuscript.
Funding
This research received no external funding.
Data Availability Statement
Research data are not shared but can be obtained from the authors upon request.
Acknowledgments
We acknowledge DESY (Hamburg, Germany), a member of the Helmholtz Association HGF, for the provision of experimental facilities. Parts of this research were carried out at PETRA III, beamline P02.1, within the rapid access program 2021A under proposal ID RAt- 20010284. Furthermore, we thank Christian Sternemann (DELTA, Dortmund/Germany) for his help in recording synchrotron powder diffraction data, Dirk Lützenkirchen-Hecht (DELTA, Dortmund/Germany) for his support in recording XANES spectra, and the DELTA facility for providing synchrotron radiation. We thank Klaus Meerholz and Ruth Bruker (Institute for Physical Chemistry, University of Cologne) for their help with the EDX analyses as well as for providing the instrument for our measurements.
Conflicts of Interest
The authors declare no conflict of interest.
References
- Von Stackelberg, M. Untersuchungen über Carbide. Z. Phys. Chem. Abt. B 1930, 9, 437–475. [Google Scholar] [CrossRef]
- Ruschewitz, U. Binary and ternary carbides of alkali and alkaline-earth metals. Coord. Chem. Rev. 2003, 244, 115–136. [Google Scholar] [CrossRef]
- Atoji, M. Neutron Diffraction Studies of CaC2, YC2, LaC2, CeC2, TbC2, YbC2, LuC2, and UC2. J. Chem. Phys. 1961, 35, 1950–1960. [Google Scholar] [CrossRef]
- Rundle, R.E.; Baenziger, N.C.; Wilson, A.S.; McDonald, R.A. The Structures of the Carbides, Nitrides and Oxides of Uranium. J. Am. Chem. Soc. 1948, 70, 99–105. [Google Scholar] [CrossRef]
- Jilek, R.E.; Bauer, E.; Burrell, A.K.; McCleskey, T.M.; Jia, Q.X.; Scott, B.L.; Beaux, M.F.; Durakiewicz, T.; Joyce, J.J.; Rector, K.D.; et al. Preparation of Epitaxial Uranium Dicarbide Thin Films by Polymer-Assisted Deposition. Chem. Mater. 2013, 25, 4373–4377. [Google Scholar] [CrossRef]
- Bernal, J.D.; Djatlowa, E.; Kasarnowsky, I.; Reichstein, S.; Ward, A.G. The Structure of Strontium and Barium Peroxides SrO2 and BaO2. Z. Kristallogr. 1935, 92, 344–354. [Google Scholar] [CrossRef]
- Ziegler, M.; Rosenfeld, M.; Kaenzig, W.; Fischer, P. Strukturuntersuchungen an Alkalihyperoxiden. Helv. Phys. Acta 1976, 49, 57–90. [Google Scholar] [CrossRef]
- Auffermann, G.; Prots, Y.; Kniep, R. SrN and SrN2: Diazenides by Synthesis under High N2-Pressure. Angew. Chem. Int. Ed. Engl. 2001, 40, 547–549. [Google Scholar] [CrossRef]
- Hunt, E.B.; Rundle, R.E. The Structure of Thorium Dicarbide by X-Ray and Neutron Diffraction. J. Am. Chem. Soc. 1951, 73, 4777–4781. [Google Scholar] [CrossRef]
- Knapp, M.; Ruschewitz, U. Structural Phase Transitions in CaC2. Chem.–Eur. J. 2001, 7, 874–880. [Google Scholar] [CrossRef]
- Vohn, V.; Knapp, M.; Ruschewitz, U. Synthesis and Crystal Structure of SrC2. J. Solid State Chem. 2000, 151, 111–116. [Google Scholar] [CrossRef]
- Vohn, V.; Kockelmann, W.; Ruschewitz, U. On the synthesis and crystal structure of BaC2. J. Alloys Compds. 1999, 284, 132–137. [Google Scholar] [CrossRef]
- Wandner, D.; Link, P.; Heyer, O.; Mydosh, J.; Ahmida, M.A.; Abd-Elmeguid, M.M.; Speldrich, M.; Lueken, H.; Ruschewitz, U. Structural Phase Transitions in EuC2. Inorg. Chem. 2010, 49, 312–318. [Google Scholar] [CrossRef] [PubMed]
- Bredig, M.A. The polymorphism of calcium carbide. J. Phys. Chem. 1942, 46, 801–819. [Google Scholar] [CrossRef]
- Link, P.; Wandner, D.; Schellenberg, I.; Pöttgen, R.; Paulus, M.; Sahle, C.J.; Sternemann, C.; Ruschewitz, U. EuxSr1-xC2 (0 < x < 1): A Dicarbide Solid Solution with Perfect Vegard Behavior. Z. Anorg. Allg. Chem. 2010, 636, 2276–2281. [Google Scholar] [CrossRef]
- Shannon, R.D. Revised effective ionic radii and systematic studies of interatomic distances in halides and chalcogenides. Acta Crystallogr. 1976, A32, 751–767. [Google Scholar] [CrossRef]
- Link, P.; Glatzel, P.; Kvashnina, K.; Trots, D.M.; Smith, R.I.; Ruschewitz, U. Structure Induced Yb Valence Changes in the Solid Solution YbxCa1-xC2. Inorg. Chem. 2013, 52, 7020–7030. [Google Scholar] [CrossRef]
- Link, P.; Glatzel, P.; Kvashina, K.; Smith, R.I.; Ruschewitz, U. Yb Valence States in YbC2: A HERFD-XANES Spectroscopic Investigation. Inorg. Chem. 2011, 50, 5587–5595. [Google Scholar] [CrossRef]
- Busch, S. Gemischtkationische Dicarbide der Lanthanoide, Alkali- und Erdalkalimetalle, Kristallstrukturen und Phasenumwandlungen. Ph.D. Thesis, University of Cologne, Cologne, Germany, 2016. [Google Scholar]
- Pioro, I.; Kirillov, P.; Mendez-Vilas, A. Materials and Processes for Energy: Communicating Current Research and Technological Developments, 1st ed.; Formatex Research Center: Norristown, PA, USA, 2013; pp. 818–830. [Google Scholar]
- Wallace, T.C.; Krikorian, N.H.; Stone, P.L. The High Carbon Portion of the Uranium-Gadolinium-Carbon System. J. Electrochem. Soc. 1964, 111, 1404–1408. [Google Scholar] [CrossRef]
- McColm, I.J.; Colquhoun, I.; Clark, N.J. The cubic-tetragonal transformation in metal dicarbides—I The uranium-lanthanum and uranium-cerium dicarbide systems. J. Inorg. Nucl. Chem. 1972, 34, 3809–3814. [Google Scholar] [CrossRef]
- Jones, D.W.; McColm, I.J.; Yerkess, J. Tetragonal and cubic crystal structures of some binary and ternary metal dicarbides in the series Ce-Er, Ce-Lu, U-La, and U-Ce. J. Solid State Chem. 1991, 92, 301–311. [Google Scholar] [CrossRef]
- Asakura, H.; Hosokawa, S.; Teramura, K.; Tanaka, T. Local Structure Study of Lanthanide Elements by X-Ray Absorption Near Edge Structure Spectroscopy. Chem. Rec. 2019, 19, 1420–1431. [Google Scholar] [CrossRef] [PubMed]
- Vitova, T.; Kvashnina, K.O.; Nocton, G.; Sukharina, G.; Denecke, M.A.; Butorin, S.M.; Mazzanti, M.; Caciuffo, R.; Soldatov, A.; Behrends, T.; et al. High energy resolution x-ray absorption spectroscopy study of uranium in varying valence states. Phys. Rev. B 2010, 82, 235118. [Google Scholar] [CrossRef]
- Wilkins, M.C.D.; Townsend, L.T.; Stennett, M.C.; Kvashnina, K.O.; Corkhill, C.L.; Hyatt, N.C. A multimodal X-ray spectroscopy investigation of uranium speciation in ThTi2O6 compounds with the brannerite structure. Sci. Rep. 2023, 13, 12776. [Google Scholar] [CrossRef] [PubMed]
- Shi, H.; Zhang, P.; Li, S.-S.; Wang, B.; Sun, B. First-principles study of UC2 and U2C3. J. Nucl. Mater. 2010, 396, 218. [Google Scholar] [CrossRef]
- Wong, J.; Lytle, F.W.; Messmer, R.P.; Maylotte, D.H. K-edge absorption spectra of selected vanadium compounds. Phys. Rev. B 1984, 30, 5596. [Google Scholar] [CrossRef]
- George, G.N.; Gorbaty, M.L. Sulfur K-edge X-ray absorption spectroscopy of petroleum asphaltenes and model compounds. J. Am. Chem. Soc. 1989, 111, 3182–3186. [Google Scholar] [CrossRef]
- Tromp, M.; Moulin, J.; Reid, G.; Evans, J. Cr K-Edge XANES Spectroscopy: Ligand and Oxidation State Dependence—What is Oxidation State? AIP Conf. Proc. 2007, 882, 699–701. [Google Scholar] [CrossRef]
- Kosog, B.; La Pierre, H.S.; Denecke, M.A.; Heinemann, F.W.; Meyer, K. Oxidation State Delineation via U LIII-Edge XANES in a Series of Isostructural Uranium Coordination Complexes. Inorg. Chem. 2012, 51, 7940–7944. [Google Scholar] [CrossRef]
- Qi, B.; Perez, I.; Ansari, P.H.; Lu, F.; Croft, M. L2 and L3 measurements of transition-metal 5d orbital occupancy, spin-orbit effects, and chemical bonding. Phys. Rev. B 1987, 36, 2972. [Google Scholar] [CrossRef]
- Bès, R.; Rivenet, M.; Solari, P.-L.; Kvashnina, K.O.; Scheinost, A.C.; Martin, P.M. Use of HERFD–XANES at the U L3- and M4-Edges To Determine the Uranium Valence State on [Ni(H2O)4]3[U(OH,H2O)(UO2)8O12(OH)3]. Inorg. Chem. 2016, 55, 4260–4270. [Google Scholar] [CrossRef]
- Pöttgen, R.; Gulden, T.; Simon, A. Miniaturisierte Lichtbogenapparatur für den Laborbedarf. GIT Labor-Fachzeitschrift 1999, 43, 133–136. [Google Scholar]
- WinXPow, version 3.03; Stoe & Cie GmbH: Darmstadt, Germany, 2010.
- Dippel, A.-C.; Liermann, H.-P.; Delitz, J.T.; Walter, P.; Schulte-Schrepping, H.; Seeck, O.; Franz, H. Beamline P02.1 at PETRA III for high-resolution and high-energy powder diffraction. J. Synchrotron Radiat. 2015, 22, 675–687. [Google Scholar] [CrossRef] [PubMed]
- Prescher, C.; Prakapenka, V.B. DIOPTAS: A program for reduction of two-dimensional X-ray diffraction data and data exploration. High Pressure Res. 2015, 35, 223–230. [Google Scholar] [CrossRef]
- Hunter, J.D. Matplotlib: A 2D Graphics Environment. Comput. Sci. Eng. 2007, 9, 90–95. [Google Scholar] [CrossRef]
- Van Rossum, G.; Drake, F.L. Python 3 Reference Manual; CreateSpace: Scotts Valley, CA, USA, 2009. [Google Scholar]
- Krywka, C.; Sternemann, C.; Paulus, M.; Javid, N.; Winter, R.; Al-Sawalmih, A.; Yi, S.; Raabe, D.; Tolan, M. The small-angle and wide-angle X-ray scattering set-up at beamline BL9 of DELTA. J. Synchrotron Radiat. 2007, 14, 244–251. [Google Scholar] [CrossRef] [PubMed]
- Coelho, A.A.; Evans, J.; Evans, I.; Kern, A.; Parsons, S. The TOPAS symbolic computation system. Powder Diffr. 2011, 26, S22–S25. [Google Scholar] [CrossRef]
- Stephens, P.W. Phenomenological model of anisotropic peak broadening in powder diffraction. J. Appl. Crystallogr. 1999, 32, 281–289. [Google Scholar] [CrossRef]
- Frahm, R.; Wagner, R.; Herdt, A.; Lützenkirchen-Hecht, D. XAS at the materials science X-ray beamline BL8 at the DELTA storage ring. J. Phys. Conf. Ser. 2009, 190, 012040. [Google Scholar] [CrossRef]
- Lützenkirchen-Hecht, D.; Wagner, R.; Szillat, S.; Hüsecken, A.K.; Istomin, K.; Pietsch, U.; Frahm, R. The multi-purpose hard X-ray beamline BL10 at the DELTA storage ring. J. Synchrotron Radiat. 2014, 21, 819–826. [Google Scholar] [CrossRef] [PubMed]
- Ravel, B.; Newville, M. ATHENA, ARTEMIS, HEPHAESTUS: Data analysis for X-ray absorption spectroscopy using IFEFFIT. J. Synchrotron Radiat. 2005, 12, 537–541. [Google Scholar] [CrossRef]
- Harris, C.R.; Millman, K.J.; van der Walt, S.J.; Gommers, R.; Virtanen, P.; Cournapeau, D.; Wieser, E.; Taylor, J.; Berg, S.; Smith, N.J.; et al. Array programming with NumPy. Nature 2020, 585, 357–362. [Google Scholar] [CrossRef] [PubMed]
- Virtanen, P.; Gommers, R.; Oliphant, T.E.; Haberland, M.; Reddy, T.; Cournapeau, D.; Burovski, E.; Peterson, P.; Weckesser, W.; Bright, J.; et al. SciPy 1.0: Fundamental algorithms for scientific computing in Python. Nat. Methods 2020, 17, 261–272. [Google Scholar] [CrossRef] [PubMed]
- Guda, A.A.; Guda, S.A.; Martini, A.; Kravtsova, A.N.; Algasov, A.; Bugaev, A.; Kubrin, S.P.; Guda, L.V.; Šot, P.; van Bokhoven, J.A.; et al. Understanding X-ray absorption spectra by means of descriptors and machine learning algorithms. npj Comput. Mater. 2021, 7, 203. [Google Scholar] [CrossRef]
Figure 1.
Tetragonal CaC2 type structure (I4/mmm, Z = 2); dark gray spheres: C, yellow spheres: Ca.

Figure 2.
Unit cell volumes V of the solid solutions LnxU 1−x C2 with Ln = Tb, Dy, Ho, Tm, and Lu in dependence of the composition x. The straight lines are guides for the eye and do not represent Vegard’s law. The standard deviations obtained from Le Bail fits are smaller than the symbols of the plot.

Figure 3.
Typical XANES spectrum at the U-LIII edge with the observables E0, EWL, and AWL and the different functions used to fit the spectra in this work. Blue crosses represent the measured data points.
Figure 3.
Typical XANES spectrum at the U-LIII edge with the observables E0, EWL, and AWL and the different functions used to fit the spectra in this work. Blue crosses represent the measured data points.

Figure 4.
(a) E0 = f(xnom) and (b) AWL = f(xnom) (E0: absorption edge, AWL: area of the white line) in the solid solutions LnxU1−xC2 with Tb, Dy, Ho, Tm, and Lu (left: measurements at the Ln-LIII edges; right: measurements at the U-LIII edge). Unfilled symbols indicate measurements on Lu4C7, as we were unable to synthesize pristine LuC2. Shaded areas indicate a confidence interval of 68%; the straight line is the result of a linear regression fit. Largely deviating data points for Tb0.1U0.9C2 and Ho0.1U0.9C2 were not included in these fits.

Figure 5.
Le Bail refinement of the synchrotron powder diffraction pattern of Dy0.9U0.1C2 (beamline P02.1, DESY, Hamburg/Germany; λ = 0.20735 Å; 295(2) K; glass capillary: ∅ = 0.3 mm). Experimental data points (black crosses), calculated profile (red solid line), background (gray solid line), and difference curve (blue curve below) are shown. Vertical blue bars mark the positions of Bragg reflections of Dy0.9U0.1C2.


Table 1.
Summary of the results on solid solutions LnxU1-xC2 reported in the literature and in this work correlated with the ratio r(Ln3+)/r(U4+) [16] of the constituting metal cations.
Table 1.
Summary of the results on solid solutions LnxU1-xC2 reported in the literature and in this work correlated with the ratio r(Ln3+)/r(U4+) [16] of the constituting metal cations.
| La | Ce | Gd | Tb | Dy | Ho | Tm | Lu | |
|---|---|---|---|---|---|---|---|---|
| r(Ln3+)/pm | 103.2 | 101 | 93.8 | 92.3 | 91.2 | 90.1 | 88 | 86.1 |
| r(Ln3+)/r(U4+) | 1.16 | 1.13 | 1.05 | 1.04 | 1.02 | 1.01 | 0.99 | 0.97 |
| solid solution | discont. | discont. | Vegard | Vegard | Vegard | Vegard | Vegard | Vegard |
| boiling point Ln/°C | 3464 | 3443 | 3273 | 3230 | 2567 | 2720 | 1950 | 3330 |
| reference | [22,23] | [22,23] | [21] | this work | this work | this work | this work | this work |
Table 2.
Summary of the slopes of the linear regression lines shown in Figure 4.
Table 2.
Summary of the slopes of the linear regression lines shown in Figure 4.
| Ln | Slope of E0 = f(xnom)/eV·x−1 | Slope of AWL = f(xnom)/a.u.·x−1 | ||
|---|---|---|---|---|
| Ln-LIII Edge | U-LIII Edge | Ln-LIII Edge | U-LIII Edge | |
| Tb | −2.6(6) | 2.2(7) | −11(2) | 2.38(7) |
| Dy | −2.5(9) | 2.9(24) | −5(5) | 3(2) |
| Ho | −2.4(11) | 1.2(4) | −12(29) | 2.2(11) |
| Tm | −3.2(6) | 2.3(5) | −6(3) | 1.6(5) |
| Lu | −3.7(6) | 1.8(7) | −6.5(11) | 2.2(6) |
Disclaimer/Publisher’s Note: The statements, opinions and data contained in all publications are solely those of the individual author(s) and contributor(s) and not of MDPI and/or the editor(s). MDPI and/or the editor(s) disclaim responsibility for any injury to people or property resulting from any ideas, methods, instructions or products referred to in the content. |
© 2023 by the authors. Licensee MDPI, Basel, Switzerland. This article is an open access article distributed under the terms and conditions of the Creative Commons Attribution (CC BY) license (https://creativecommons.org/licenses/by/4.0/).
Share and Cite
MDPI and ACS Style
Tobeck, C.; Wende, H.; Ruschewitz, U. Solid Solutions LnxU1−xC2 with Ln = Tb, Dy, Ho, Tm, and Lu Showing Ideal Vegard Behavior. Inorganics 2023, 11, 457. https://0-doi-org.brum.beds.ac.uk/10.3390/inorganics11120457
AMA Style
Tobeck C, Wende H, Ruschewitz U. Solid Solutions LnxU1−xC2 with Ln = Tb, Dy, Ho, Tm, and Lu Showing Ideal Vegard Behavior. Inorganics. 2023; 11(12):457. https://0-doi-org.brum.beds.ac.uk/10.3390/inorganics11120457
Chicago/Turabian StyleTobeck, Christian, Heiko Wende, and Uwe Ruschewitz. 2023. "Solid Solutions LnxU1−xC2 with Ln = Tb, Dy, Ho, Tm, and Lu Showing Ideal Vegard Behavior" Inorganics 11, no. 12: 457. https://0-doi-org.brum.beds.ac.uk/10.3390/inorganics11120457
Note that from the first issue of 2016, this journal uses article numbers instead of page numbers. See further details here.