Article

Non-Covalent Interactions of the Lewis Acids Cu–X, Ag–X, and Au–X (X = F and Cl) with Nine Simple Lewis Bases B: A Systematic Investigation of Coinage–Metal Bonds by Ab Initio Calculations

1
Instituto de Química Médica (IQM-CSIC), Juan de la Cierva, 3, E-28006 Madrid, Spain
2
Chemistry, School of Natural and Environmental Sciences, Newcastle University, Bedson Building, Newcastle-upon-Tyne NE1 7RU, UK
3
School of Chemistry, University of Bristol, Cantock’s Close, Bristol BS8 1TS, UK
*
Authors to whom correspondence should be addressed.
Submission received: 7 January 2021 / Revised: 22 January 2021 / Accepted: 26 January 2021 / Published: 1 February 2021

Abstract

:
The equilibrium geometry and two measures (the equilibrium dissociation energy in the complete basis set limit, De(CBS) and the intermolecular stretching force constant kσ) of the strength of the non-covalent interaction of each of six Lewis acids M–X (M = Cu, Ag, Au) with each of nine simple Lewis bases B (B = N2, CO, HCCH, CH2CH2, H2S, PH3, HCN, H2O, and NH3) have been calculated at the CCSD(T)/aug-cc-pVTZ level of theory in a systematic investigation of the coinage–metal bond. Unlike the corresponding series of hydrogen-bonded B⋯HX and halogen-bonded B⋯XY complexes (and other series involving non-covalent interactions), De is not directly proportional to kσ. Nevertheless, as for the other series, it has been possible to express De in terms of the equation De = cNB.EMX, where NB and EMX are the nucleophilicities of the Lewis bases B and the electrophilicities of the Lewis acids M–X, respectively. The order of the EMX is determined to be EAuF > EAuCl > ECuF > ECuCl > EAgF EAgCl. A reduced electrophilicity defined as (EMXmax) is introduced, where σmax is the maximum positive value of the molecular electrostatic surface potential on the 0.001 e/bohr3 iso-surface. This quantity is, in good approximation, independent of whether F or Cl is attached to M.

1. Introduction

Isolated complexes of the general type B⋯M–X, where B is a simple Lewis base, M is a coinage–metal atom (Cu, Ag, or Au), and X is a halogen atom, have been investigated extensively in the gas phase via rotational spectroscopy [1,2,3,4,5,6,7,8,9,10,11,12,13,14,15]. Properties, such as geometry, intermolecular stretching force constant kσ, and the change in ionicity of M–X on complexation have thereby been determined. A perspective on such investigations is set out in reference [16]. In view of the closed-shell nature of the molecules M–X, their interaction with Lewis bases in the B⋯M–X complexes can be classified as of the non-covalent type and, following recent practice in the naming and definition of halogen and chalcogen bonds [17,18], can be called coinage–metal or Group 11 bonds [16,19]. This method of naming non-covalent interactions focusses on the group in the periodic table containing the element whose atom provides the electrophilic centre that interacts with the most nucleophilic region (non-bonding or π-bonding electron pairs) carried by B.
Complexes of the type B⋯M–X (M = Cu, Ag, and Au) are likely to have a large electrostatic contribution to the strength of the intermolecular binding, given that the coinage metal halides MX considered here have large electric dipole moments (5.77 D for CuF [20]) and large fractional ionic characters (0.71 can be calculated from the 35Cl nuclear quadrupole coupling constant of CuCl [21]). Thus, it is of interest to compare properties of the B⋯M–X with those of their hydrogen-bonded analogues B⋯H–X to examine the extent to which the greater polar character of M–X than that of the H–X affects those of the former group.
In earlier reports, it was shown [22,23] by means of ab initio calculations of the properties of a large number of simple hydrogen-bonded complexes B⋯H–X and halogen-bond complexes B⋯X–Y (X and Y are halogen atoms) that there is a direct proportionality between two measures of the intermolecular binding strength, namely, the equilibrium dissociation energy De (the energy required for the infinite separation process B⋯H–X = B + HX) and the intermolecular stretching force constant kσ (the restoring force per unit infinitesimal extension of the weak bond). This conclusion has implications for the form of the potential energy as a function of the intermolecular distance. It was also found that De (and therefore kσ) can be written in terms of a nucleophilicity NB assigned to the Lewis base B and an electrophilicity EA of the Lewis acid A according to the simple expression De = NBEA. We have recently published reports of a similar type for tetrel (or Group 14) bonds, pnictogen (or Group 15) bonds, chalcogen (or Group 16) bonds [24], Be, Mg (or Group 2) bonds [25], and Li and Na (or Group 1) bonds [26], all of which are of the non-covalent type.
In this article, we report an ab initio investigation of the properties of the 54 coinage–metal complexes B⋯Cu–F, B⋯Cu–Cl, B⋯Ag–F, B⋯Ag–Cl, B⋯Au–F, and B⋯Au–Cl, where B is one of the nine simple Lewis base B = N2, CO, HCCH, CH2CH2, H2S, PH3, HCN, H2O, and NH3. We seek thereby the answers to several questions:
  • How do the distances r(Z⋯M), where Z is the acceptor atom of B, and the force constants kσ compare with those determined spectroscopically?
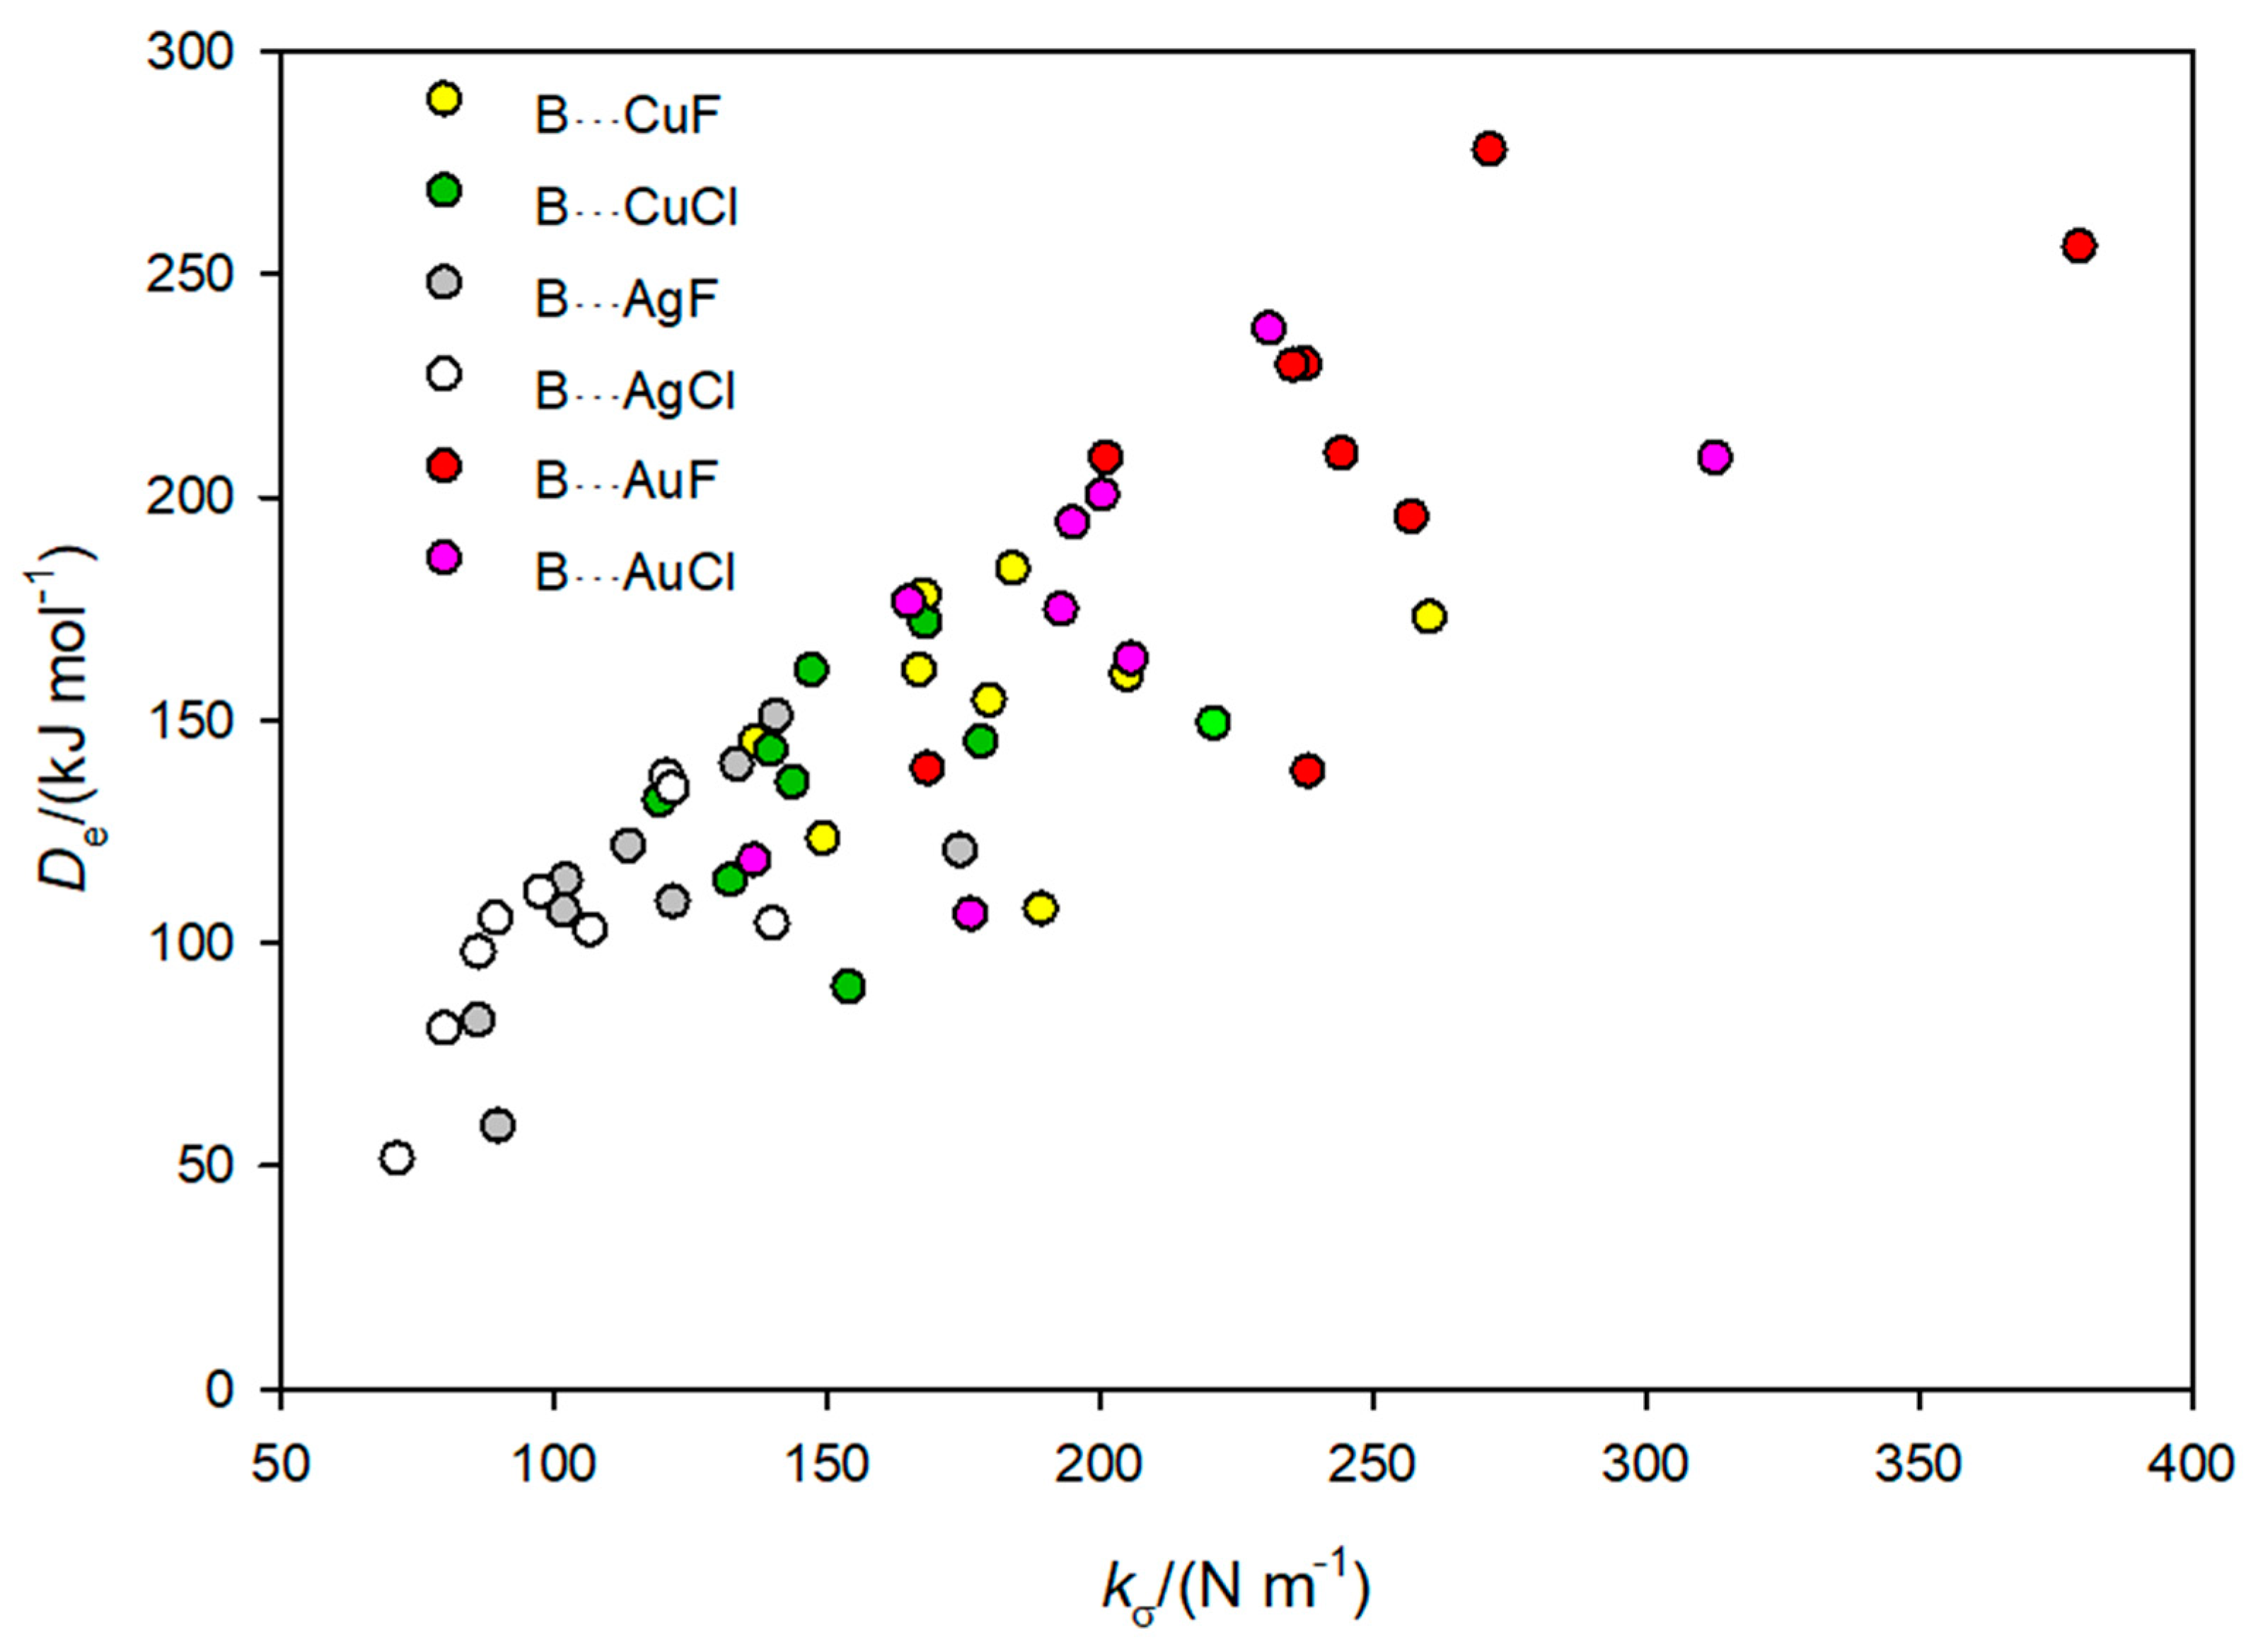
  • Is De directly proportional to kσ?
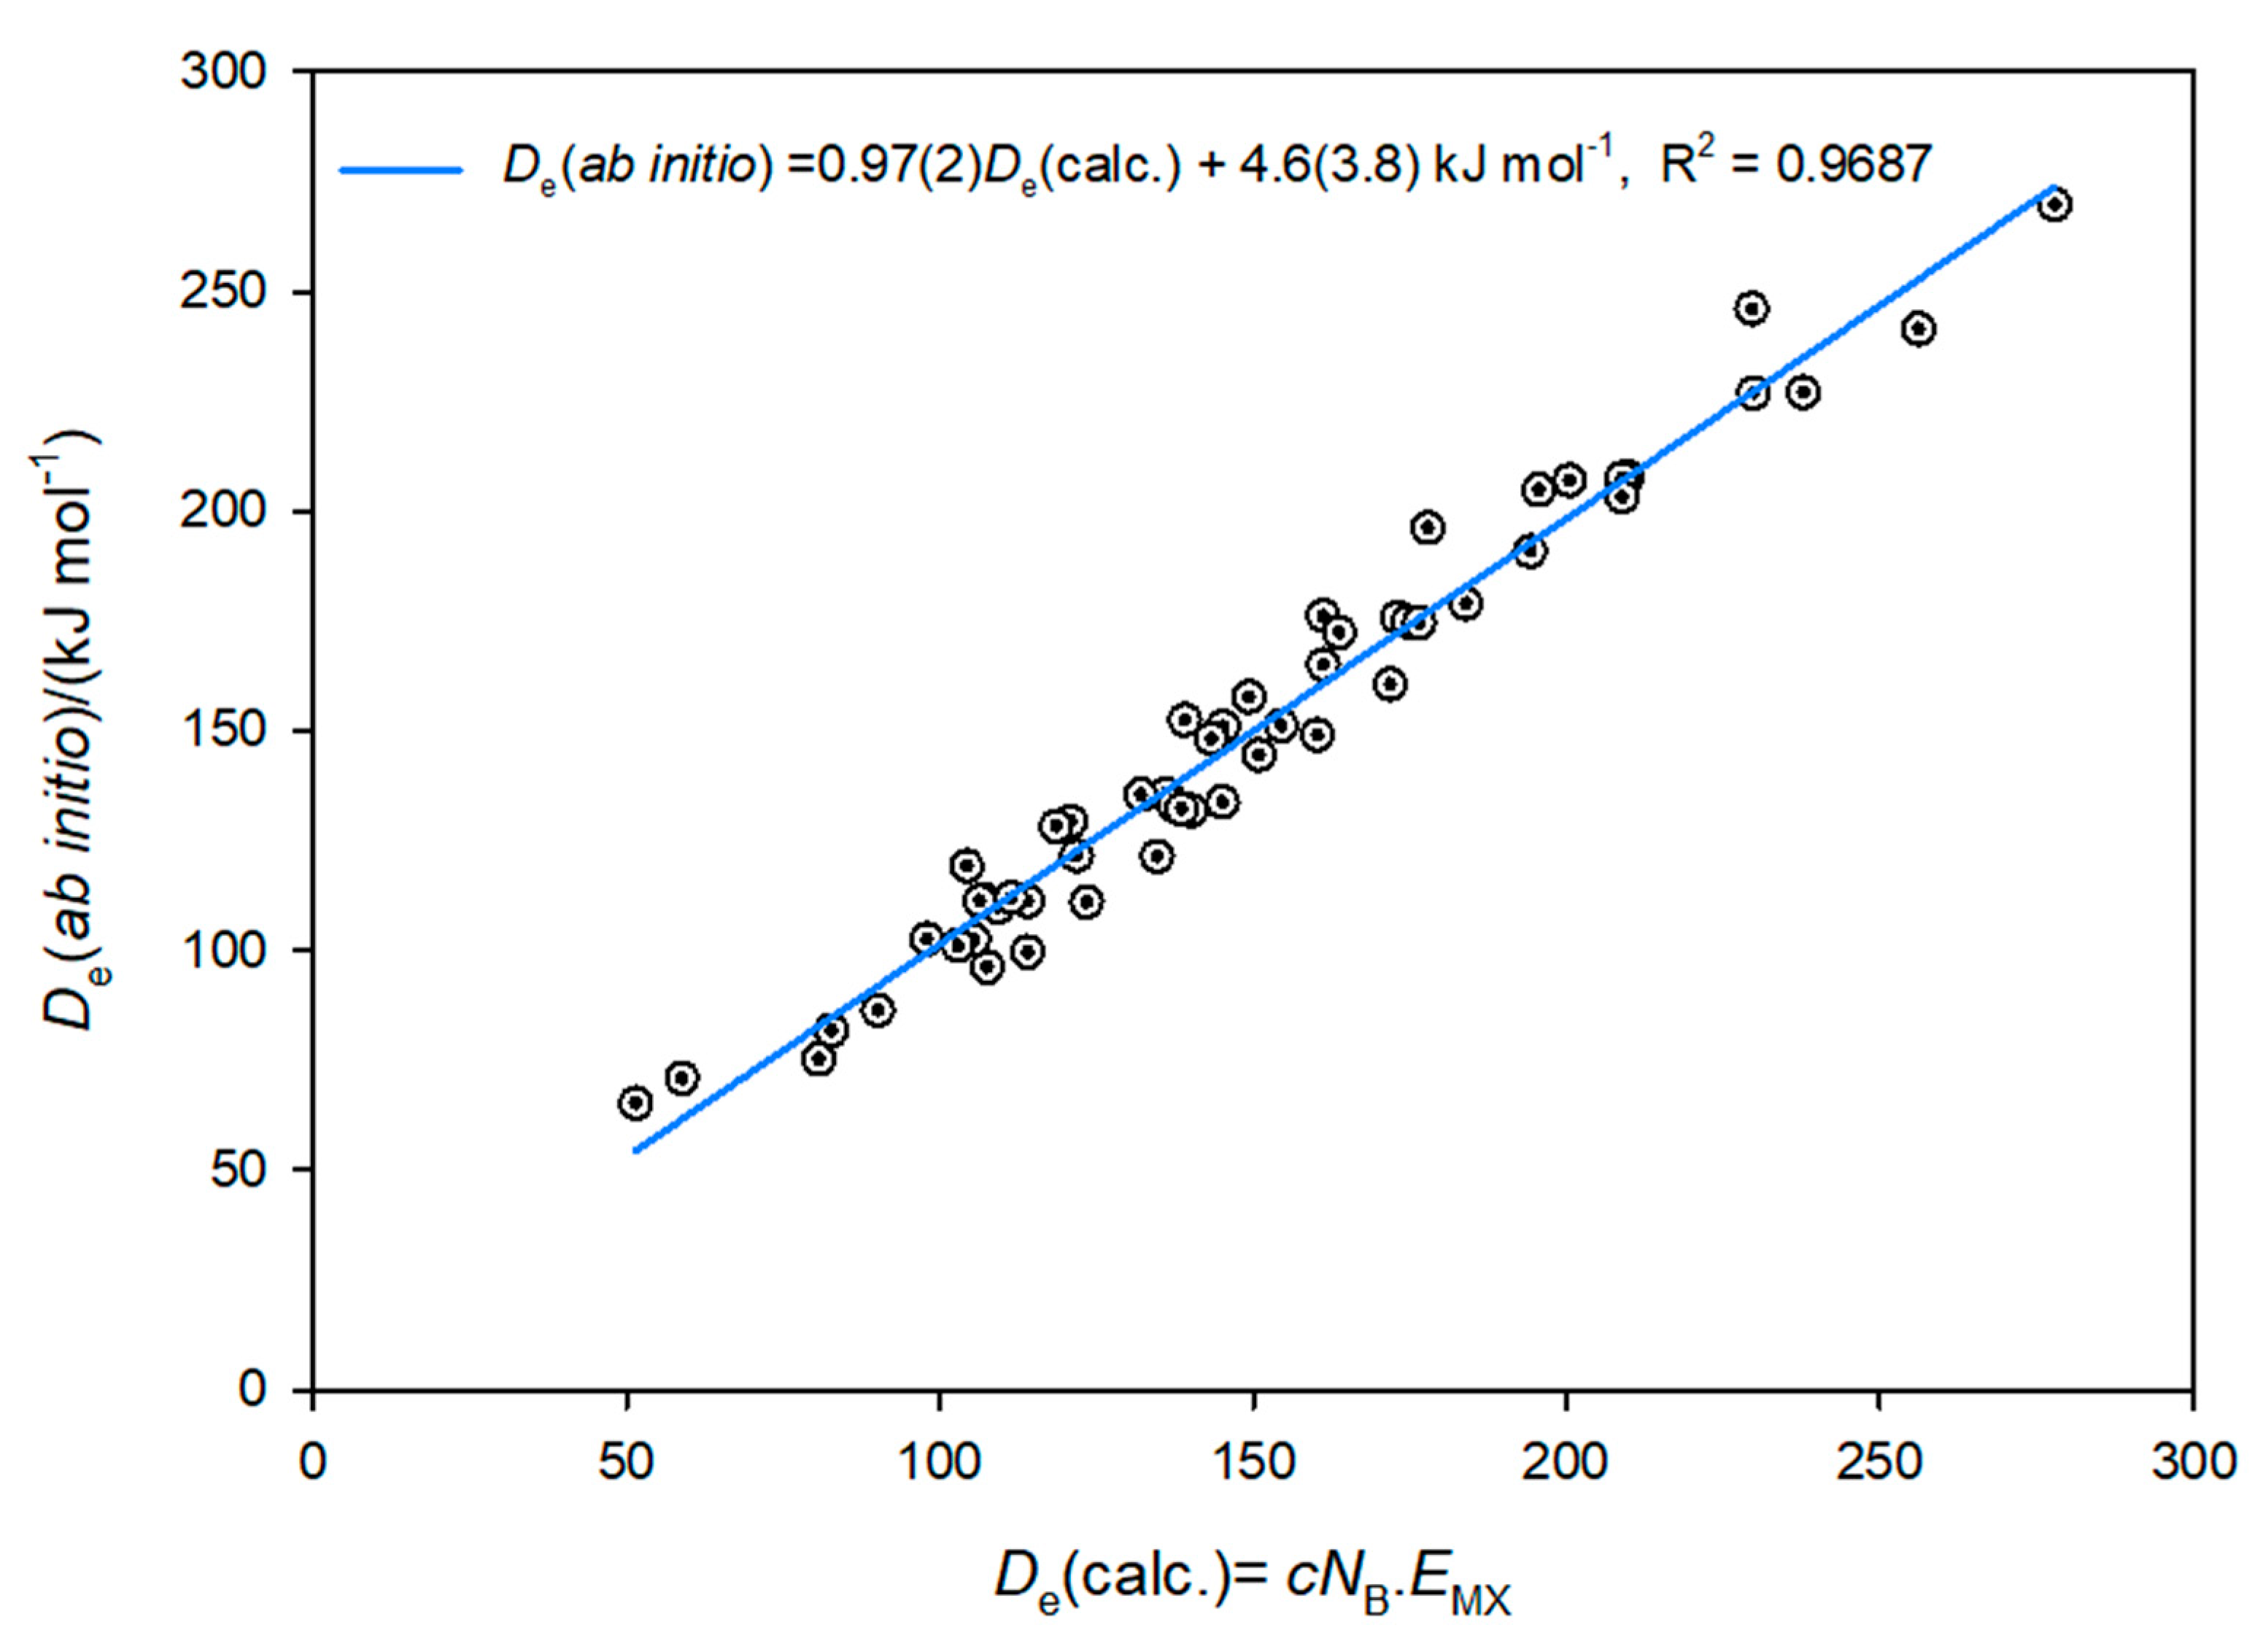
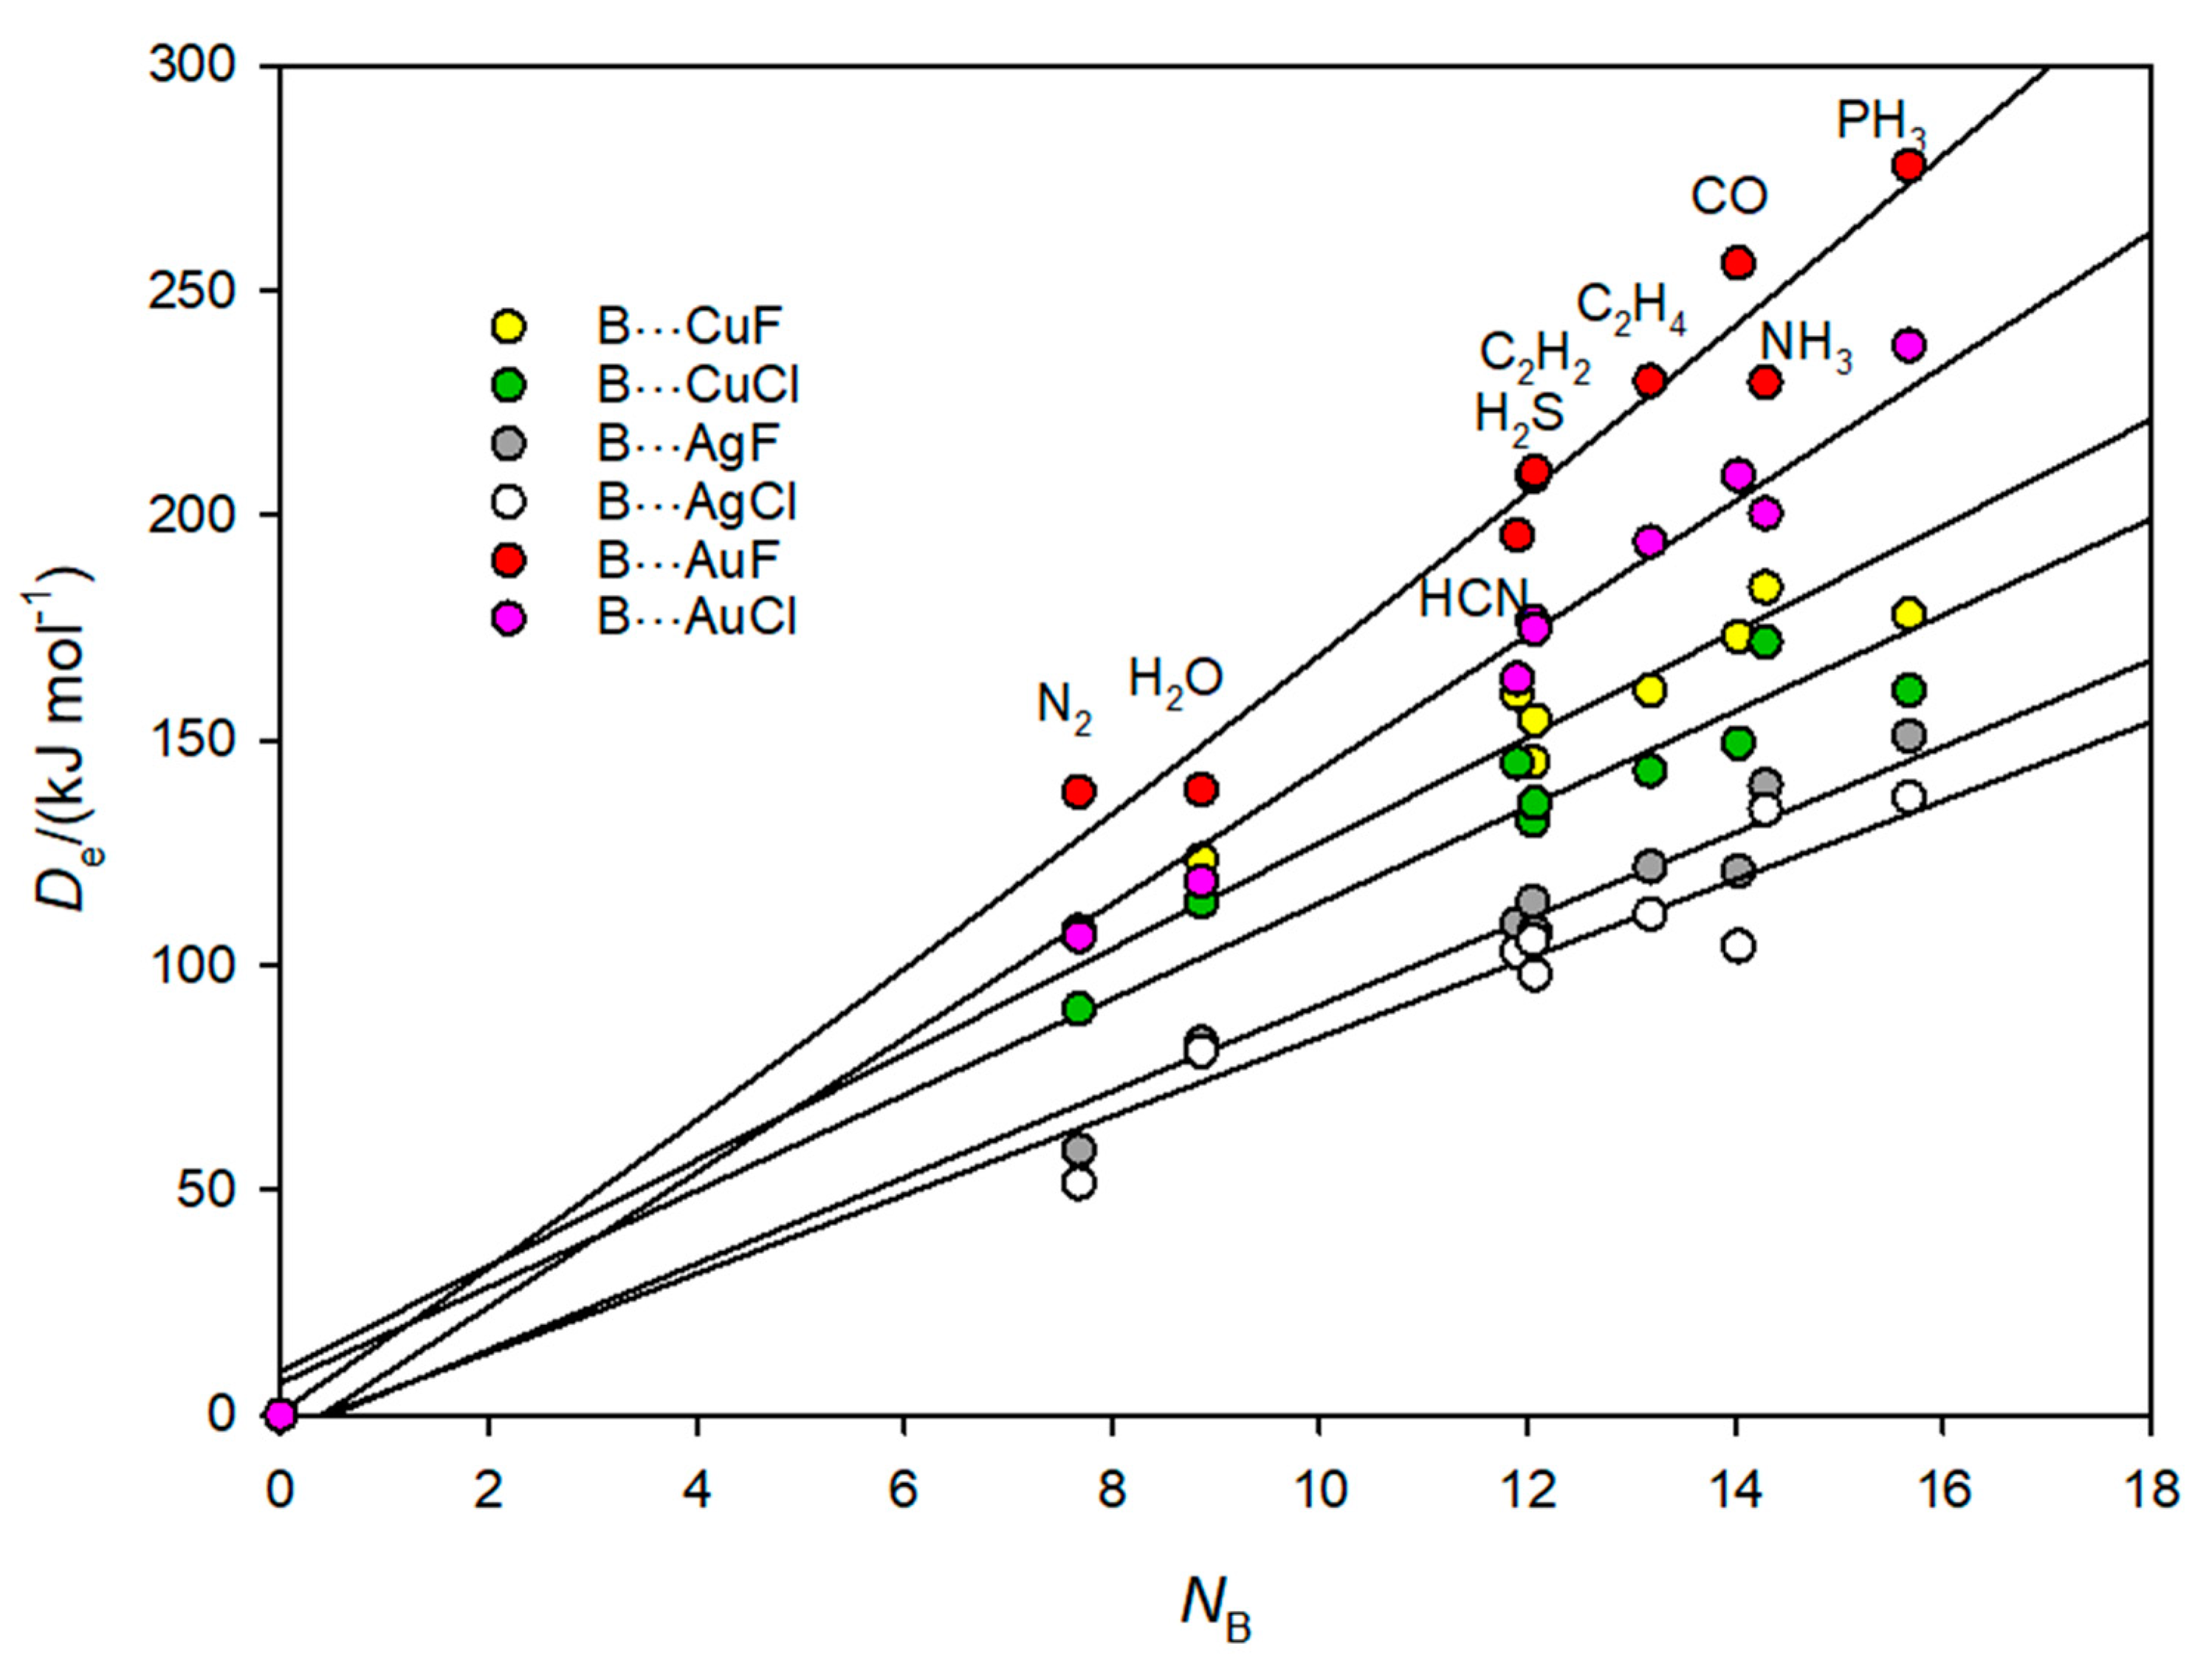
  • Can De be simply expressed as a product of a nucleophilicity NB assigned to B and an electrophilicity EMX assigned to M–X, and if so, do the NB agree with those determined earlier for the analogous hydrogen-bonded, halogen-bonded, and other non-covalently bound complexes?
  • In view of the enhanced ionic character of a given M–X compared with that of the corresponding H–X, as alluded to earlier, are there any differences attributable to it?
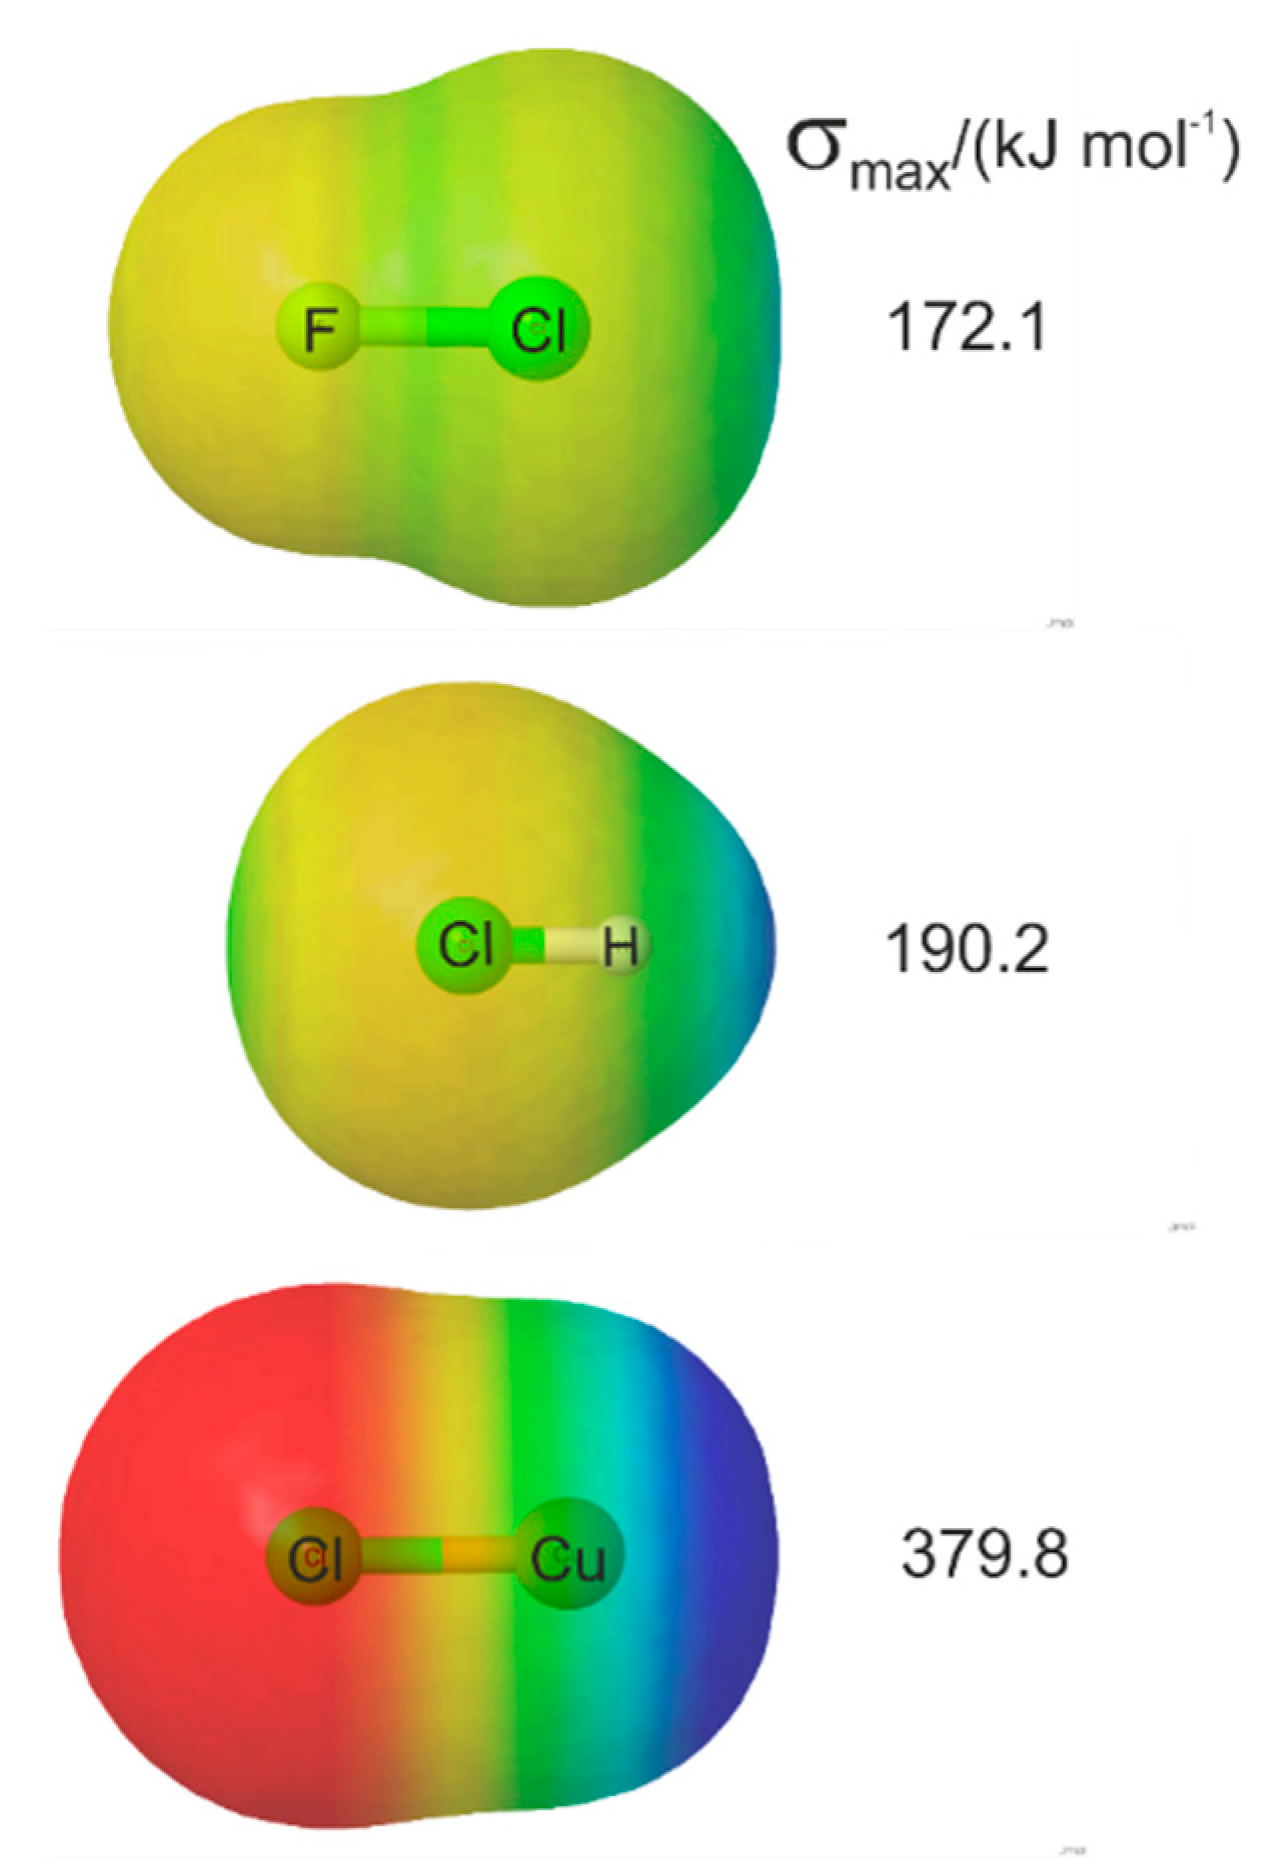
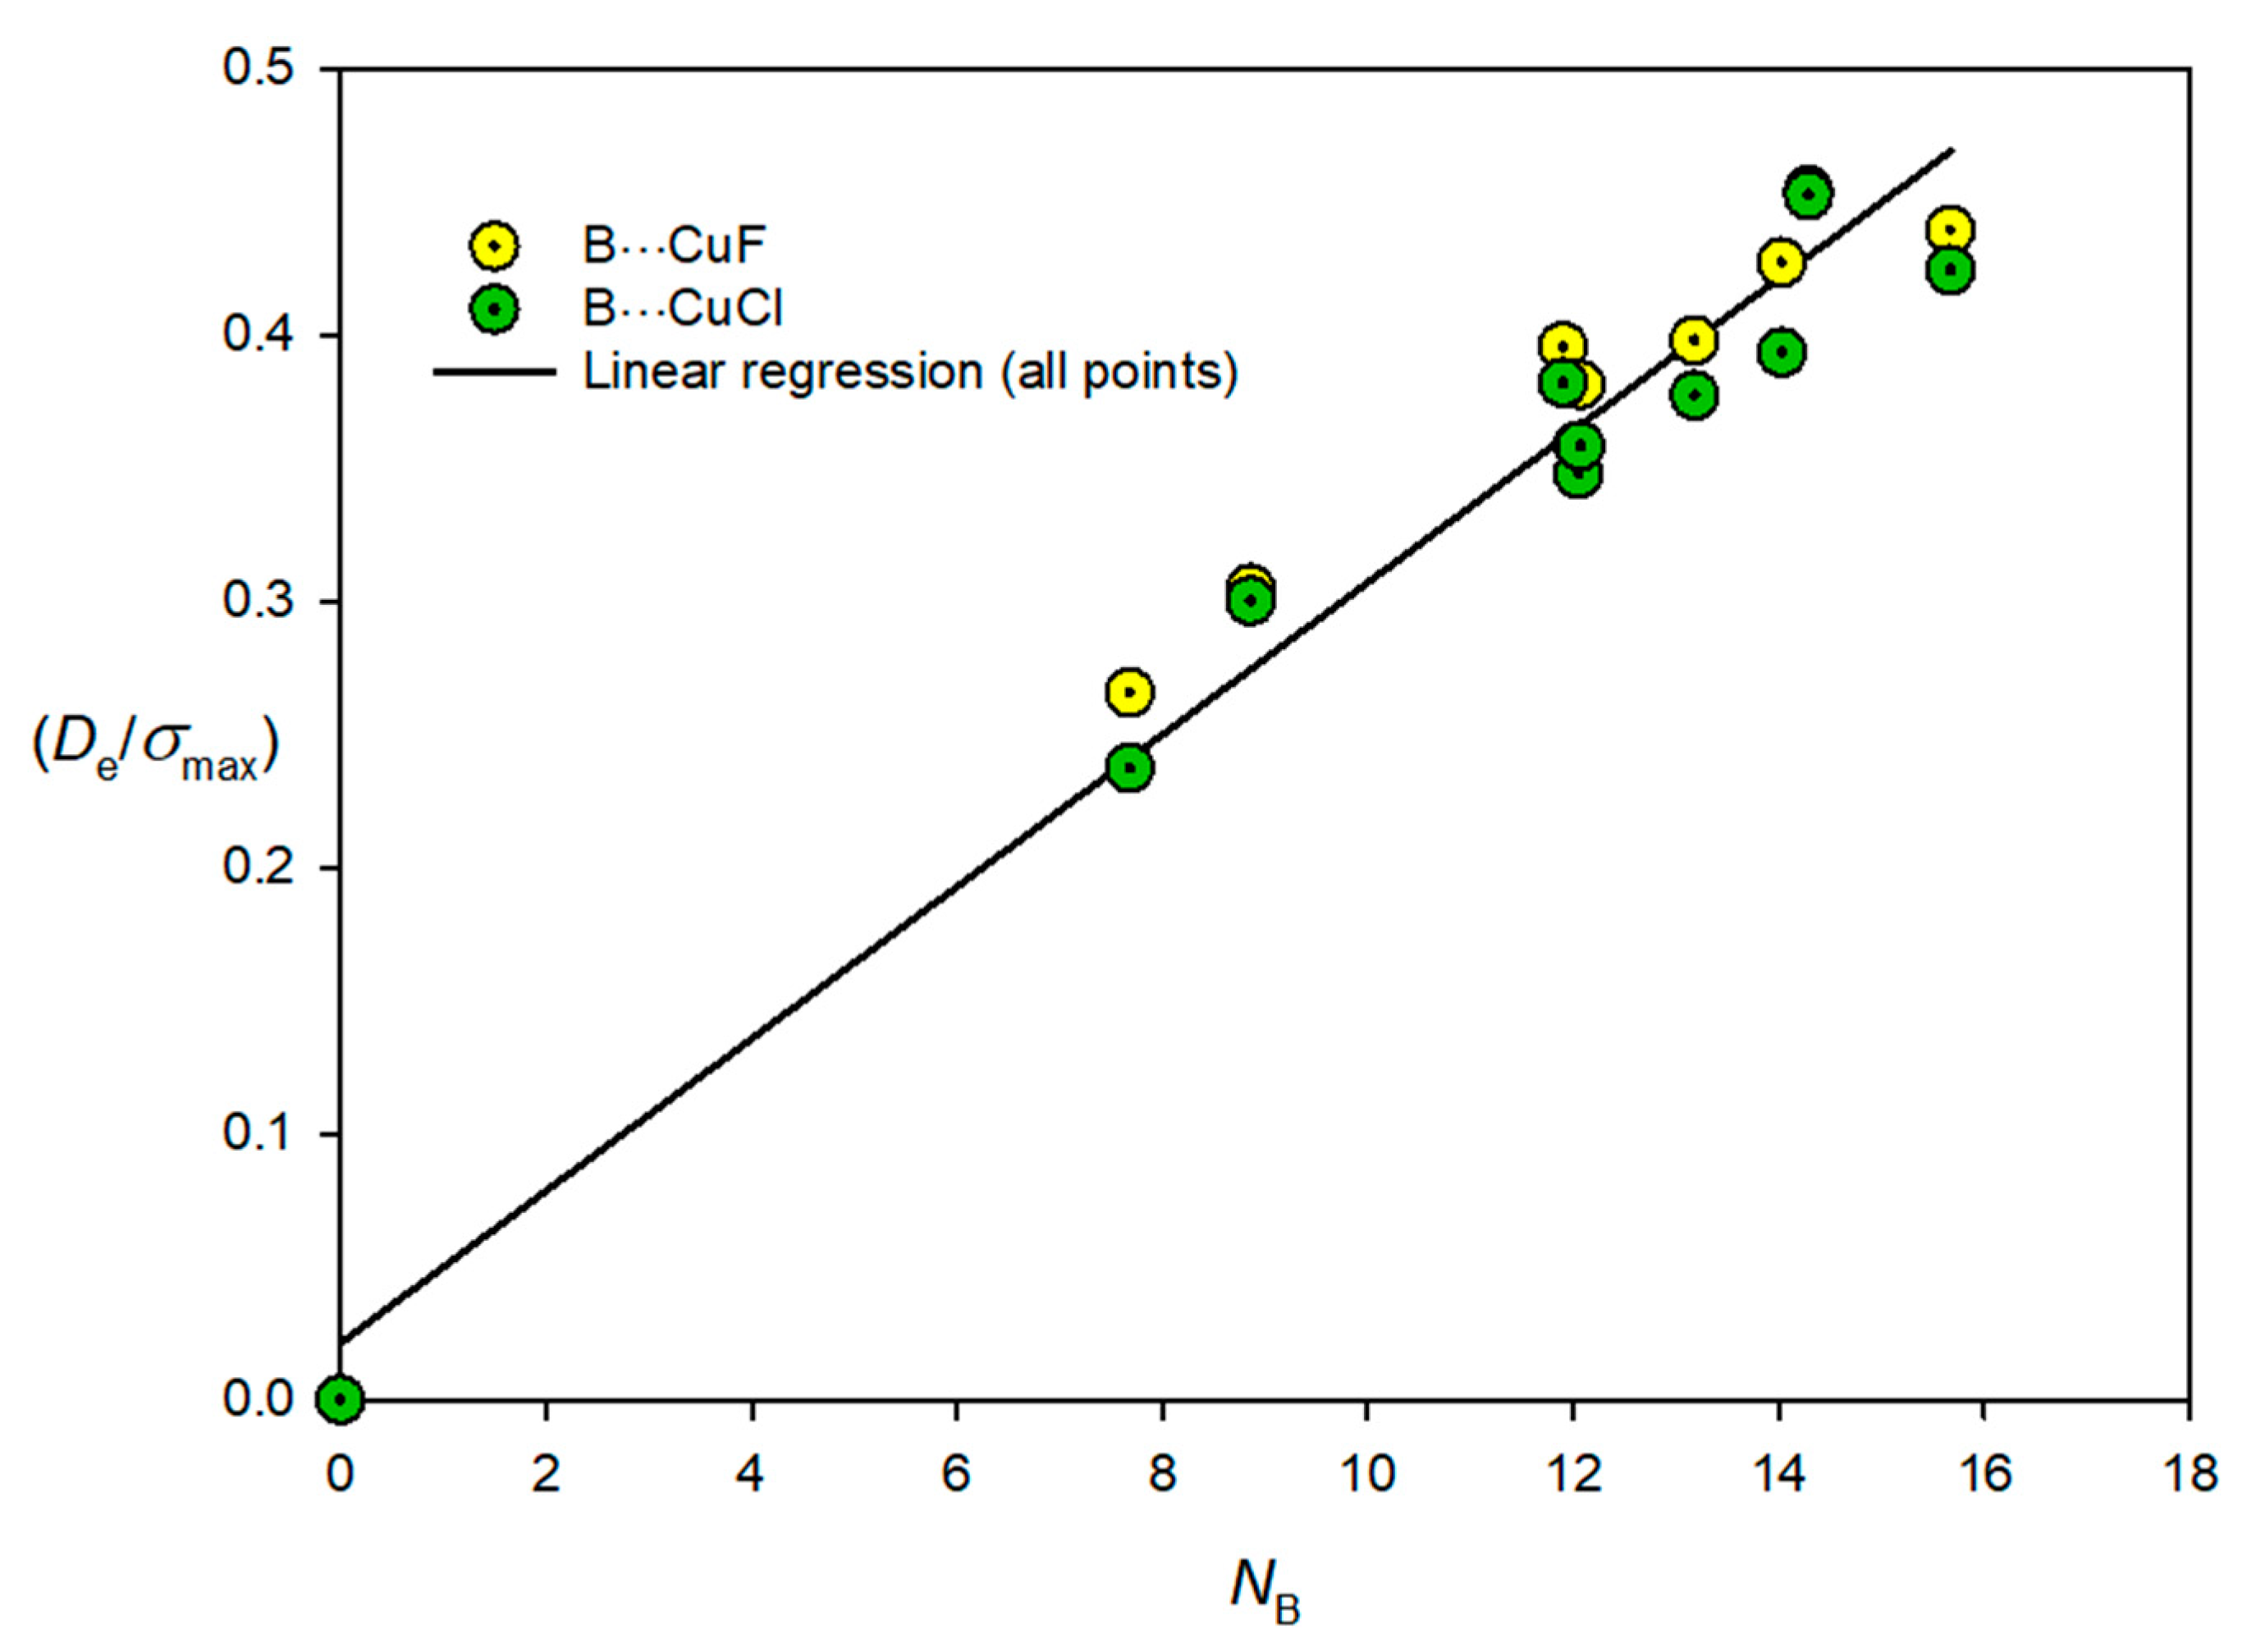
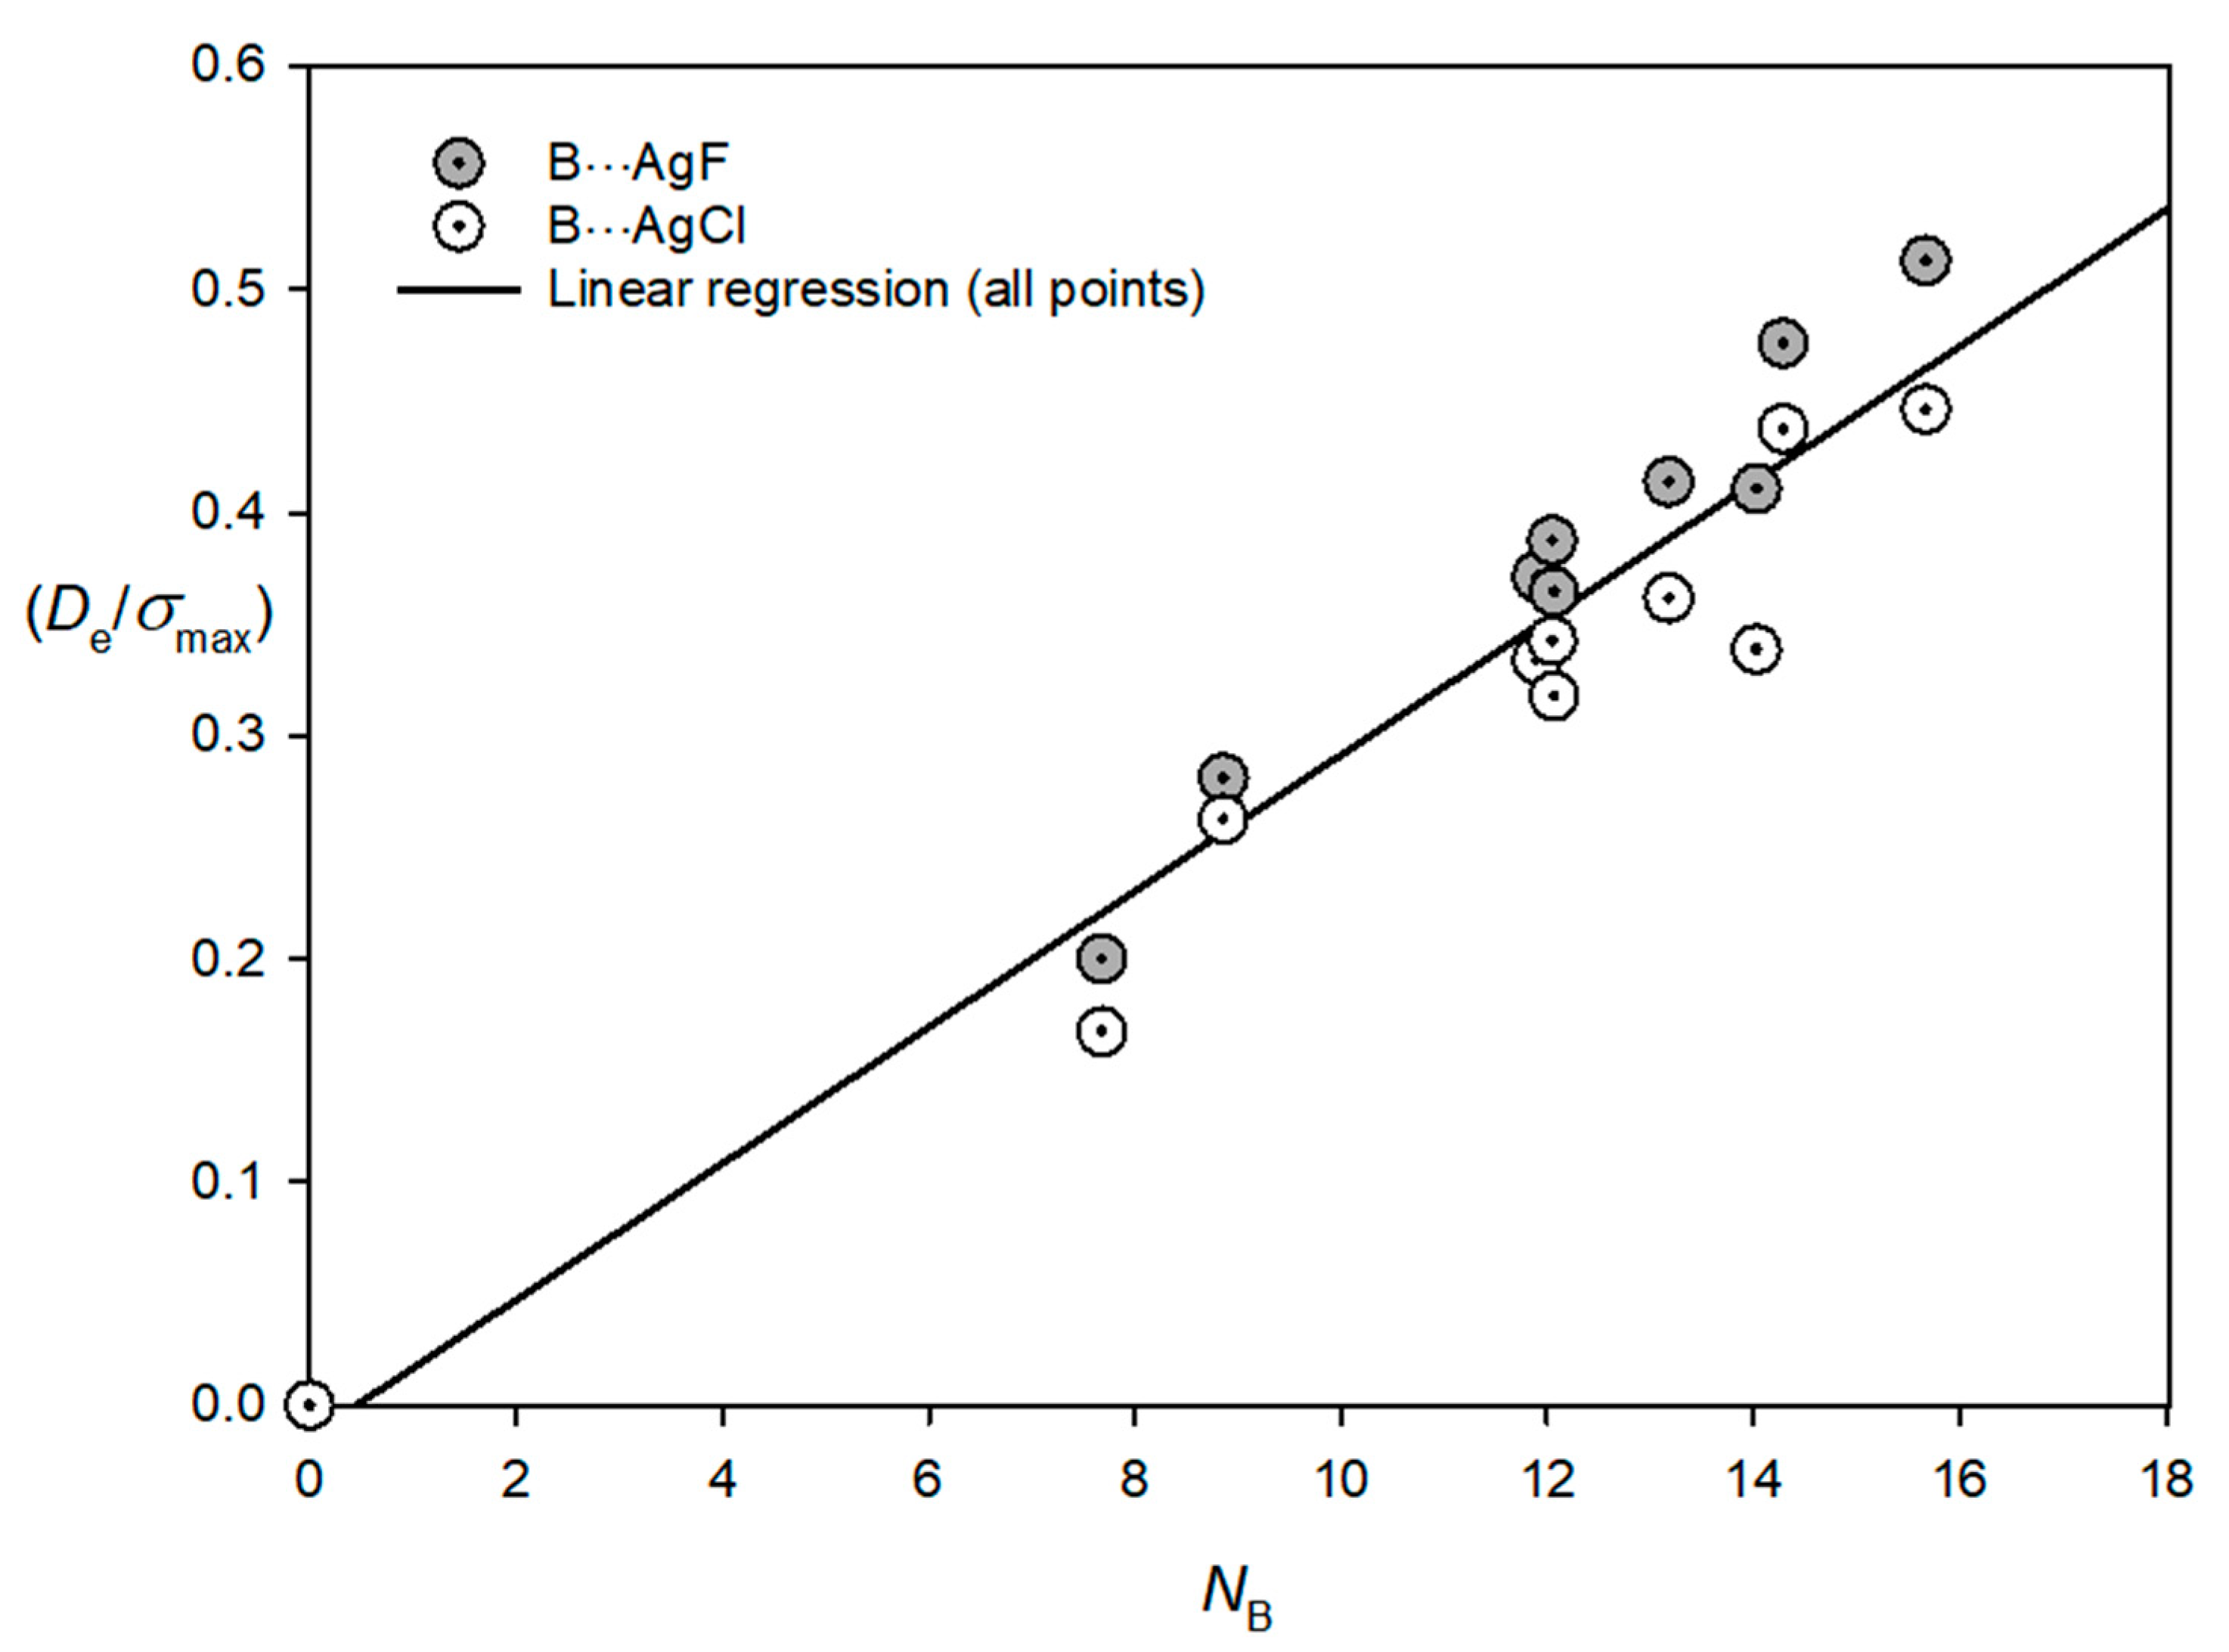
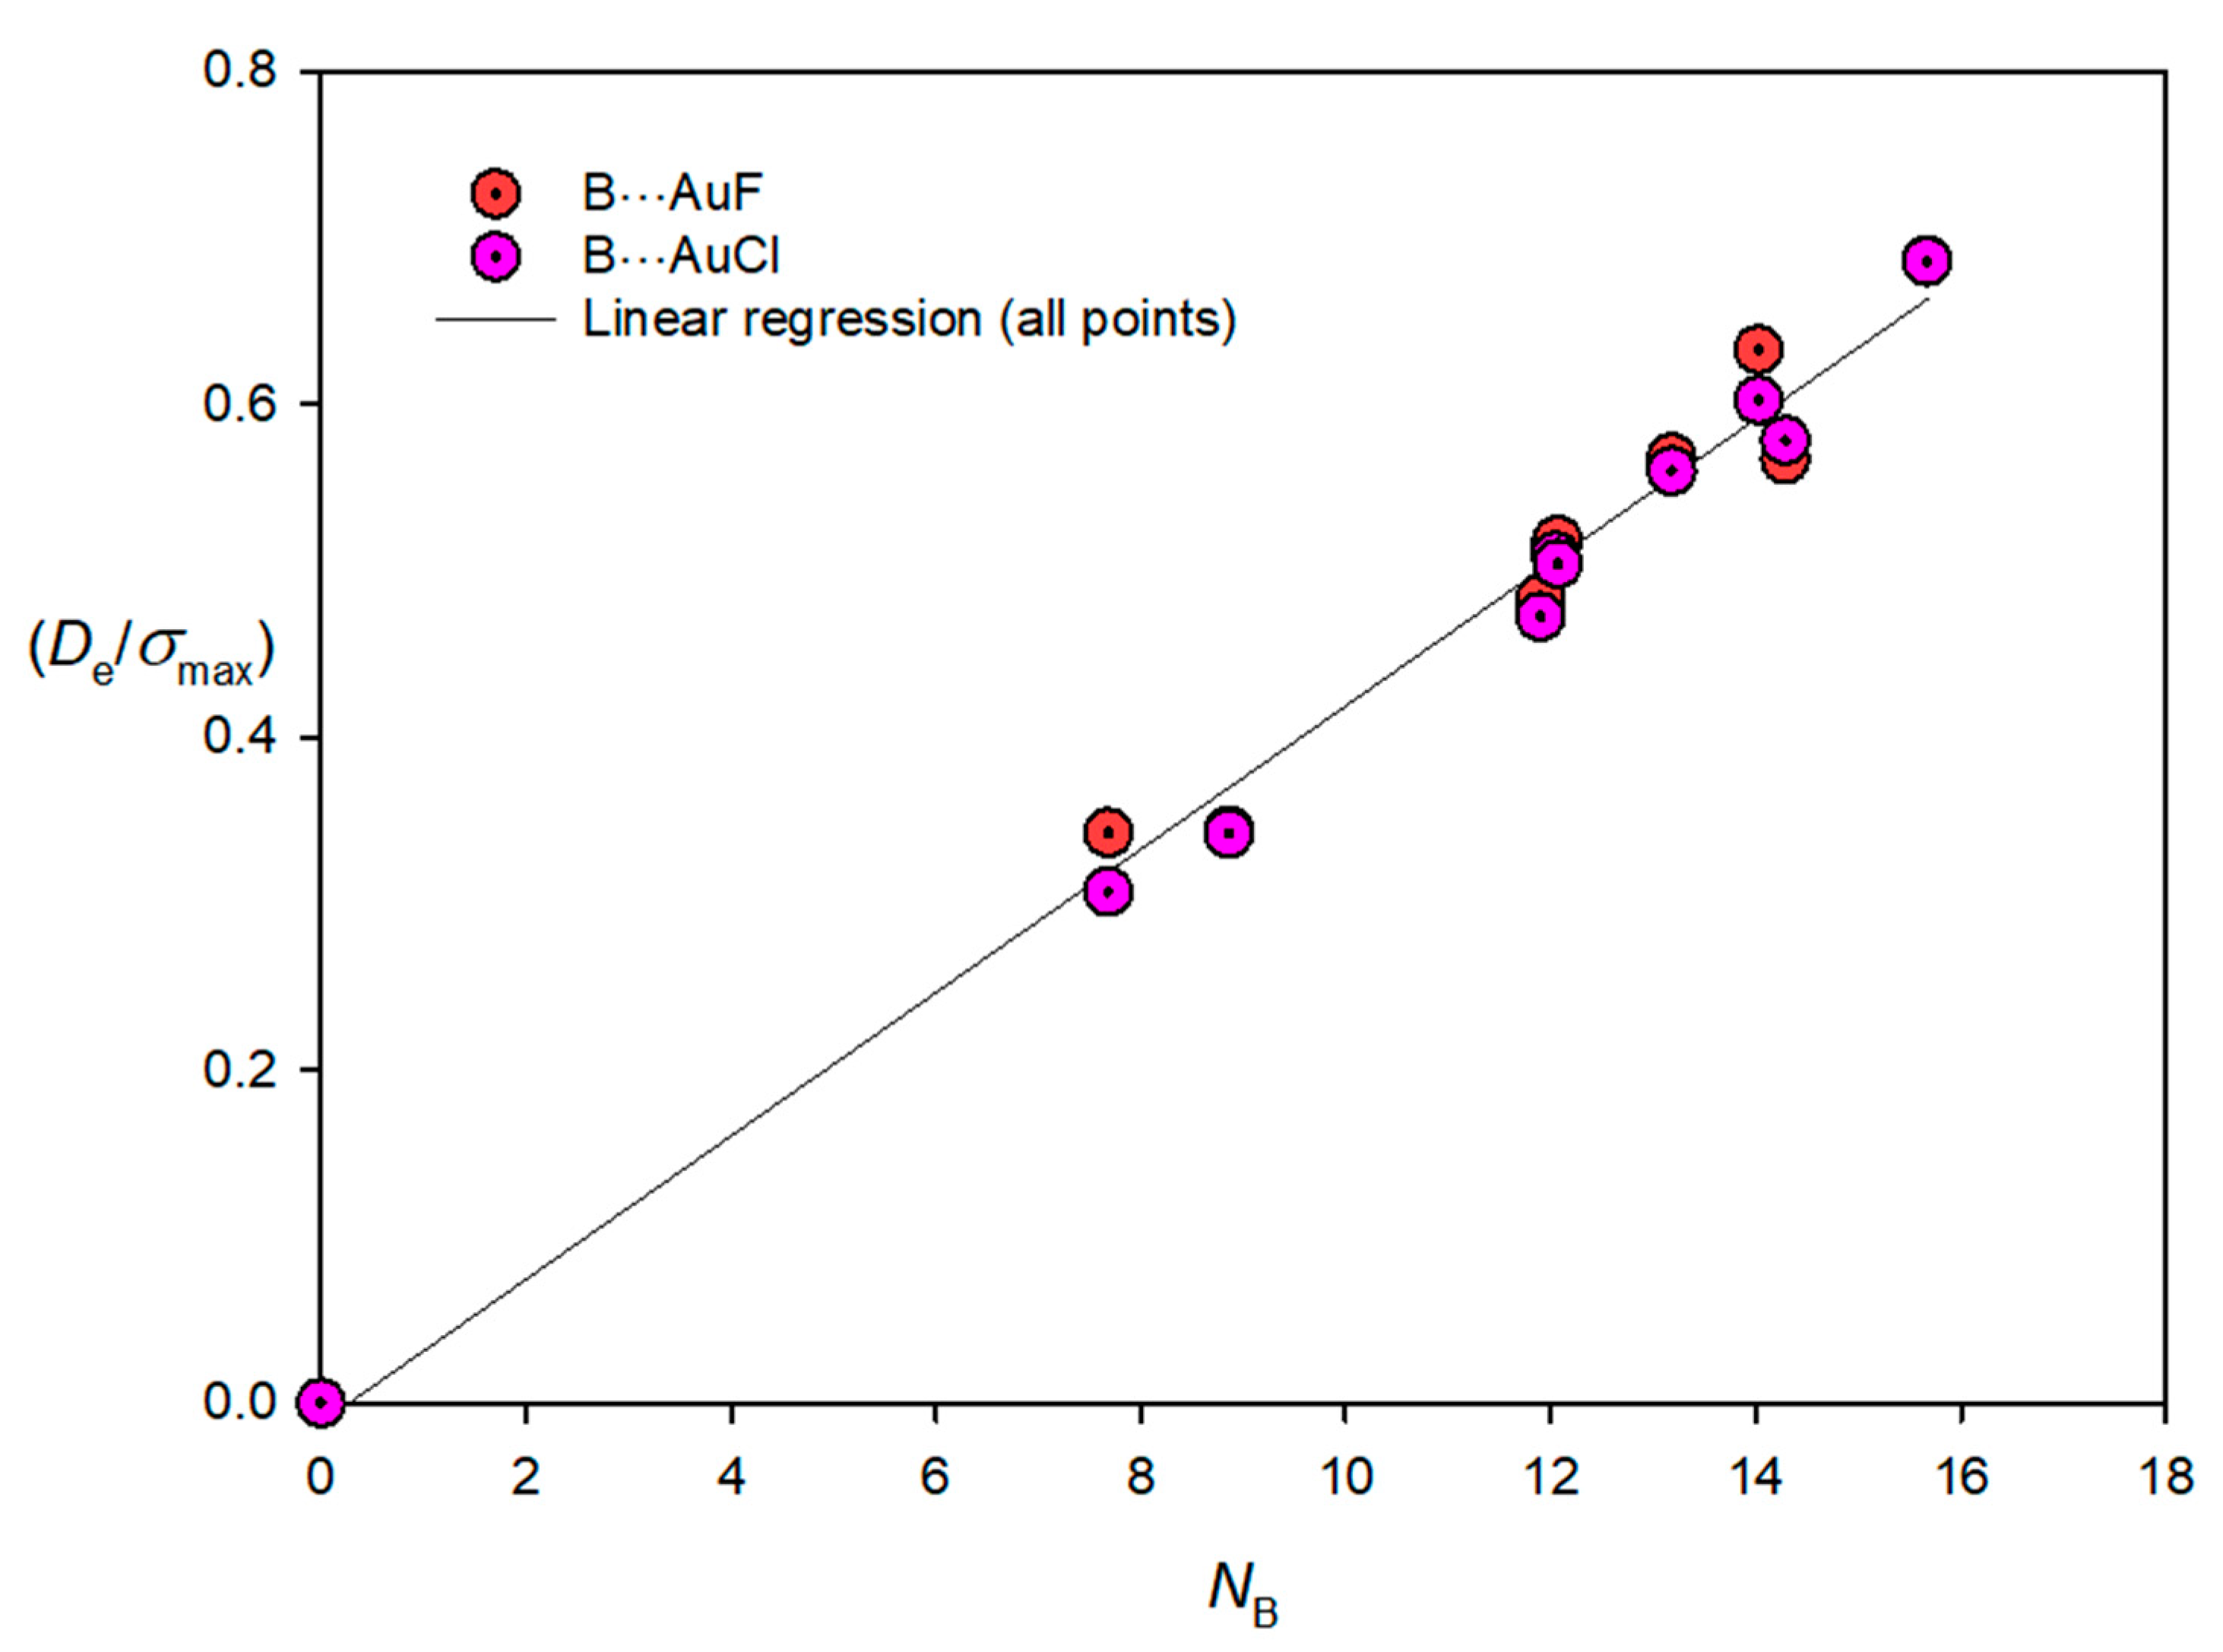
  • In addition, we shall consider the effects of normalising the De values with respect to the maximum positive values of the molecular electrostatic surface potentials (MESP) of the M–X molecules. Does this indicate whether the electrophilicity per unit positive potential along the molecular axis near to the atom M changes from F to Cl?

2. Computational Methods

The equilibrium geometries, dissociation energies De, and intermolecular force constants kσ were obtained at the CCSD(T) computational level [27] for each of the 54 complexes B⋯AgX, B⋯CuX, and B⋯AuX (X = F and Cl) investigated. The geometry of the monomers and complexes were optimised by employing the aug-cc-pVTZ basis set [28] for all atoms except for Ag and Au, for which the aug-cc-pVTZ-PP [29] version was used, at the CCSD(T) computational level. The optimised geometries are gathered in Table S1 of the Supplementary Materials. More accurate values of De were sought by extrapolation to the complete basis set energy [CCSD(T)/CBS]. This was achieved via the CCSD(T)/aug-cc-pVTZ//CCSD(T)/aug-cc-pVDZ and CCSD(T)/aug-cc-pVQZ//CCSD(T)/aug-cc-pVTZ energies [30,31] for all complexes and monomers, thereby allowing De values to be determined as the difference of the CCSD(T)/CBS energies of the complex and the two monomers. All these ab initio calculations were performed with the MOLPRO-2012 program [32]. Table 1 displays the values of De so calculated for all 54 complexes considered here. Molecular electrostatic surface potentials (MESP) of the various M–X monomers were calculated at the 0.001 e/bohr3 electron density iso-surface using the MP2/aug-cc-pVTZ level of theory by means of the GAUSSIAN16 program [33] and represented with the Jmol program [34].
To evaluate the other measure of binding strength used here, namely, the intermolecular stretching quadratic force constants kσ, the following procedure was employed. For each complex, geometry optimisations were conducted at the same computational level but with the intermolecular distance r fixed. This was repeated at 0.025 Å intervals over the range of ±0.1 Å about the equilibrium length re to yield the variation of the energy E(rre) as a function of the displacement of (rre) from equilibrium. These points were then fitted with a third-order polynomial in (rre), from which the value of kσ, that is, the second derivative of E(rre) with respect to (rre) evaluated at re, was obtained (Table S2). The results for each of the 54 complexes B⋯M–X investigated are shown in Table 2.

3. Results

3.1. Comparison of Calculated and Experimental Properties of B⋯M–X

Table 1 and Table 2 show immediately that the complexes B⋯M–X are much more strongly bound than either their hydrogen-bonded B⋯HCl or halogen-bonded B⋯ClF analogues, which typically have De ~ 10–50 kJ mol−1 and kσ ~ 10–30 N m−1. No experimental values of De are available for comparison with the calculated quantities in Table 1.
In principle, kσ (an alternative measure of the strength of the intermolecular bond) for a complex of the B⋯M–X type can be obtained experimentally from its known centrifugal distortion constant DJ or ΔJ (depending on the molecular symmetry) by using the model developed by Millen [35]. Although centrifugal distortion constants are available from the rotational spectra of some of the B⋯M–X listed in Table 2, the application of this model leads to results that are far too low compared with those in Table 2. This is because the model was developed explicitly for hydrogen-bonded complexes and assumes unperturbed monomer geometries and rigid components. While these assumptions are very good approximations for most B⋯HF complexes, for example, they do not apply here because the intermolecular bond is no longer weak. In particular, the intermolecular stretching mode and the M–X stretching mode (which are of the same symmetry) are not very different in wavenumber. A two force-constant model involving these two modes has been developed to deal with such eventualities [36], but its full use requires a knowledge of the M–X stretching force constant kMX. Although reasonably assumed values of kMX yield kσ that are (1) much larger than those given by the Millen single force constant model and are (2) similar in magnitude to those in Table 2 [15], even a relatively small range in kMX implies sufficiently large errors in kσ to make this approach unappealing.
A comparison of intermolecular distances r(Z⋯M), where Z is the atom of B directly involved in the coinage–metal bond, with those available from their rotational spectra is valid, however. The experimental values of the (Z⋯M) distance so far available are given in Table 3 together with their ab initio counterparts. There are several varieties of the distance r(Z⋯M) that can be determined from the rotational spectrum of a polyatomic molecule such as B⋯M–X. These are the r0 distance (usually obtained by fitting ground-state rotational constants of a sufficient number of isotopologues), the rs distance (available from the principal-axis coordinates of atoms Z and M determined by isotopic substitution at each [37]), and from the rm-geometry defined by Watson et al. [38]. The rm geometry requires the fitting of ground-state rotational constants of a large number of isotopically substituted species but has been shown to lie close to the re geometry. The r0 quantity differs most from the equilibrium value because the effect of zero-point motion on the rotational constants is not taken into account. In general, r0 > rs > re for diatomic molecules and this order should pertain for polyatomic molecules. The footnotes to Table 3 indicate to which of these classes a given experimental entry belongs. We note from Table 3 that experimental values of r(Z⋯M) are, in general, in good agreement with those that were obtained ab initio, given that the latter are all equilibrium quantities.
The electric dipole moments μ of the 54 B⋯M–X and their component molecules were calculated at the MP2/aug-cc-pVTZ level and are available in Table S3 of the Supplementary Materials. Some of the moments are large. For example, the value for HCN⋯AgF is 10.59 Debye, corresponding to an enhancement Δμ of 0.7 Debye relative to the sum of the monomer values for this linear molecule. For the complexes involving non-polar bases (such as N2, C2H2, etc.) there is no significant enhancement but instead, μ is smaller than the vector sum of the component values. There is no evidence of a significant correlation of Δμ values with either De or kσ.

3.2. Is There a Linear Relationship between De and kσ for the B⋯M–X Complexes?

It was shown elsewhere that, to a good approximation, the two measures of binding strength De and kσ were directly proportional to each other for a large number of hydrogen-bonded complexes B⋯HX (X = F, Cl, Br and I) [22,23] and halogen-bonded complexes B⋯XY and for tetrel-, pnictogen-, and chalcogen-bonded complexes [24], for alkaline-earth non-covalent interactions [25], and even for complexes containing alkali–metal bonds [26]. The last-named group involved Li and Na bonds made by lithium and sodium halides to a set of simple Lewis bases similar to that employed here. Given that the isolated diatomic molecules LiCl and NaCl, for example, have ≥95% ion-pair character in the gas phase [39], compared with ~70% for the coinage–metal (monovalent) halides (see reference [7], for example]), it seemed likely at the outset that the B⋯M–X (M = Cu, Ag, Au; X = F, Cl) complexes would behave similarly to all other non-covalent interactions in respect of the relationship between De and kσ. Figure 1, in which De is plotted against kσ for all B⋯M–X, shows that this is not so and, moreover, reveals no obvious correlation between the two measures of binding strength. Does this mean that it is not possible to express De as the product of the nucleophilicity of B and the electrophilicity of M for the B⋯M–X, as was found for the other non-covalent interactions mentioned earlier?

3.3. Electrophilicities of M–X and Nucleophilicities of B

Dissociation energies De calculated at the CCSD(T)/CBS level of theory are available here for the 54 complexes of the type B⋯M–X that can be obtained by a combination of the nine Lewis bases (B = N2, OC, C2H2, C2H4, PH3, H2S, HCN, H2O, and NH3) and the six Lewis acids CuF, CuCl, AgF, AgCl, AuF, and AuCl. As shown elsewhere for hydrogen-bonded, halogen-bonded [22,23] and other complexes [24,25,26] involving a single, non-covalent bond, De can be expressed as the product of a nucleophilicity NB assigned to the Lewis base B and an electrophilicity EA assigned to the Lewis acid A, according to Equation (1)
D e   =   c × N B × E A ,
where c is a constant defined conveniently as 1.0 kJ mol−1 when De is expressed in kJ mol−1 so that both NB and EA are dimensionless. To test whether Equation (1) holds for the coinage–metal complexes B⋯M–X the procedure is as follows:
Equilibrium dissociation energies De of all 54 complexes were fitted simultaneously (by the least-squares method) to the nucleophilicities NB of the nine Lewis bases and the electrophilicities EA of the six Lewis acids by means of Equation (2)
D e = ( i = 1 9 x i × N B i ) × ( j = 1 6 x j × E A j )
The xi and xj have the values 1.0 if the corresponding Lewis base or Lewis acid, respectively, are present in the complex and 0.0 otherwise. The NB and EA values so obtained are given in Table 4, while the observed and calculated De and the residuals of the fit are included as Table S4 of the Supplementary Materials. The NB and EA are well determined, as revealed by Figure 2, in which De re-calculated from the NB and EA values of Table 4 by means of Equation (2) are plotted against those from Table 1. The linear regression has the associated value R2 = 0.9687.
Another way to judge the quality of the fit to Equation (1) is to plot the ab initio value of De of each complex B⋯M–X against NB of the corresponding Lewis acid B. This graph is shown in Figure 3. A linear regression fit was made for each series, and for each, the origin was included as a point because, presumably, when the nucleophilicity of the Lewis base is zero, the dissociation energy of the complex will also be zero. Figure 3 indicates that there is a reasonable fit to a straight line through the origin for each series, in which B varies but M–X is fixed, according to Equation (1), and the gradient of each straight line in Figure 4 corresponds to the electrophilicity of the Lewis acid M–X involved. Clearly, Figure 3 reinforces the conclusion from Table 3, which is the order of the electrophilicities is EAuF > EAuCl > ECuF > ECuCl > EAgF EAgCl. These results are in agreement with previous reports showing similar trends in the interaction strength with coinage metals Au > Cu > Ag [19,40,41,42].
Figure 3 also indicates that direct proportionality of De and kσ is not a necessary condition for the existence of nucleophilicities and electrophilicities related by Equation (1), given the extensive scatter seen in Figure 1. Another matter worthy of note about the NB values determined here (see Table 4) is that they are different, both in magnitude and numerical order, from the set obtained by fitting (using the same method) the ab initio generated De values of a large number of hydrogen-bonded complexes and halogen-bonded complexes [23]. In particular, we note that NH2O is very low, adjacent to that of N2, while CO and PH3 have the highest NB values when interacting with coinage–metal halides. For hydrogen-bonded B⋯HX and halogen-bonded B⋯XY complexes (X,Y are halogen atoms) [23], NH2O is near the top end of the scale while NCO is the second smallest. For the B⋯LiX and B⋯NaX series [26], the order of the NB values is as for the hydrogen- and halogen-bonded analogues but the magnitudes are significantly different. These observations probably indicate that the nature of the interaction and the relative contributions of electrostatics, polarisation, and exchange repulsion affect the numerical nucleophilicity (and electrophilicity) that is generated by this particular approach.

3.4. Molecular Electrostatic Surface Potentials and Reduced Electrophilicities of M–X Lewis Acids

It is of interest to examine whether the electrophilicity of the M–X molecule can be generalised for different atoms X. One way this might be done is via the molecular electrostatic surface potential (MESP). Conventionally, this is chosen as the potential energy of a unit charge at the iso-surface for which the electron density is 0.001 e/bohr3 and this can be calculated by using the GAUSSIAN16 program. Figure 4 compares the MESPs for ClF, HCl, and CuCl, as calculated at the 0.001 e/bohr3 iso-surface at the MP2/aug-cc-pVTZ level of theory. The maximum positive potential σmax (values indicated in Figure 4) occurs on the extension of the internuclear axis near the Cl, H, or Cu atoms of the diatomic molecules. σmax represents the most electrophilic site of the Lewis acid on the iso-surface and is the region involved in a chlorine bond, a hydrogen bond, or a coinage–metal bond, respectively. Figure 4 illustrates graphically why, for a given Lewis base B, the non-covalent bond strength increases greatly along the series.
One approach to a reduced electrophilicity of M–X is to divide the value of De by the maximum positive MESP (σmax) to give Demax, that is the dissociation energy per unit maximum positive surface potential energy, a dimensionless quantity. Equation (1) then becomes (Demax) = (EMXmax)NB, where (EMXmax) is the electrophilicity of M–X per unit maximum positive MESP and might serve as a reduced electrophilicity. The necessary values of σmax for the diatomic molecules Cu–X, Ag–X, and Au–X (X = F and Cl) are in Table 5.
Plots of (Demax) versus NB should be straight lines of the same quality as those in Figure 4, with a gradient (EMXmax), and are shown in Figure 5, Figure 6 and Figure 7 for the Cu–X, Ag–X, and Au–X (X = F and Cl) pairs, respectively. We note that in each of these figures, to a reasonable level of approximation, the points for each M–F and M–Cl pair lie close to a straight line. This observation implies that (EMXmax) is the same for both M–F and M–Cl for a given M, thereby fulfilling the role of a reduced electrophilicity. Accordingly, all points were fitted by a single linear regression in each case. The values of the gradients are 2.76(15) × 10−2, 3.12(22) × 10−2, and 4.36(14) × 10−2, respectively, and correspond to reduced electrophilicities of the Cu–X, Ag–X, and Au–X (X = F and Cl) pairs, respectively. The first two are the same within their standard errors, while the third is significantly larger. Thus, the order of the reduced electrophilicities is Cu–X ≈ Ag–X < Au–X.

4. Conclusions

Several properties of each of the 54 coinage-metal complexes B⋯Cu–F, B⋯Cu–Cl, B⋯Ag–F, B⋯Ag–Cl, B⋯Au–F, and B⋯Au–Cl, formed by the six Lewis acids Cu–X, Ag–X, Au–X (X = F or Cl) with the nine simple Lewis bases B = N2, CO, HCCH, CH2CH2, H2S, PH3, H2O, HCN, and NH3 have been calculated ab initio. The properties include the equilibrium geometry, the electric dipole moment, and two measures (the equilibrium dissociation energy De(CBS) and the intermolecular stretching force constant kσ) of the strength of the non-covalent interaction of M–X with the Lewis base B.
It has been shown that, unlike the corresponding series of hydrogen-bonded complexes B⋯HX and halogen-bonded complexes B⋯XY, De is not directly proportional to kσ and that there is no obvious correlation between the two quantities for the B⋯M–X. Nevertheless, similar to the other two series of non-covalent interactions, it is possible to represent the De values by the simple equation De = c NB EMX, where c is a constant (chosen as 1.00 kJ mol−1 for convenience) and NB and EMX are nucleophilicities and electrophilicities assigned to the Lewis base B and the Lewis acid M–X, respectively. The magnitudes of NB for the set of Lewis bases, and indeed their numerical order, differ from those obtained for the hydrogen-bonded and halogen-bonded series by a similar approach. This difference of behaviour is presumably related to the fact that the non-covalent interaction is very much stronger in the coinage–metal bond series B⋯M–X than in the other two series (as indicated by both the De and kσ values). Moreover, the electrostatic component of the interaction in the B⋯M–X is likely to be stronger, as indicated by the large calculated electric dipole moments, especially for B = HCN, H2O, and NH3 when complexed with Ag–X and Au–X. These have significant electric dipole moment enhancements accompanying their formation. The order of the electrophilicities determined is EAuF > EAuCl > ECuF > ECuCl > EAgF EAgCl.
The molecular electrostatic surface potentials of the M–X calculated at the 0.001 e/bohr3 iso-surface have their maximum positive values σmax on the molecular axis near to the atom M, which is, therefore, the region of maximum electrophilicity. The order of the σmax values is similar to that of the EMX, except for the position of AuCl, which seems anomalous. A reduced or normalised electrophilicity (EMXmax) was tested by separate plots of (Demax) against NB for each of the three series B⋯Cu–X, B⋯Ag–X, and B⋯Au–X, (X = F and Cl) (see Figure 5, Figure 6 and Figure 7). In each graph, the points can be fitted by a single non-linear regression of good R2 value, with the gradient corresponding to the reduced electrophilicity (EMXmax). The fact that, to a reasonable approximation, the points for each B⋯M–F and B⋯M–Cl pair lie on the same straight line suggests that the reduced electrophilicity is an intrinsic property of the atom M and independent of whether X = F or Cl. The order of the reduced electrophilicities is (ECuXmax) ≈ (EAgXmax) < (EAuXmax).

Supplementary Materials

The following are available online at https://0-www-mdpi-com.brum.beds.ac.uk/2304-6740/9/2/13/s1, Table S1: Optimised geometry (Å) and electronic energy (Hartree) at CCSD(T)/aug-cc-pVTZ/aug-cc-pVTZ-PP computational level, Table S2: Intermolecular stretching quadratic force constants kσ calculations, Table S3: Dipole moment (debye) computed at MP2/aug-cc-pVTZ/aug-cc-pVTZ-PP computational level, Table S4: De [CCSD(T)] and fitted using Equation (2) (kJ mol−1). The residuals (kJ mol−1) of the fitting are also included.

Author Contributions

The conceptualization of the project, the calculations, the writing of the manuscript, the drawing of figures, checking of proofs, etc. were shared between I.A., N.R.W. and A.C.L. All authors have read and agreed to the published version of the manuscript.

Funding

Spanish MICINN, grant number CTQ2018-094644-B-C22 and Comunidad de Madrid, grant number P2018/EMT-4329 AIRTEC-CM.

Institutional Review Board Statement

Not applicable.

Informed Consent Statement

Not applicable.

Data Availability Statement

The data presented in this study are available in the article and supplementary material.

Acknowledgments

A.C.L. thanks the University of Bristol for the award of a University Senior Research Fellowship. IA is grateful for the financial support of Spanish MICINN, grant number CTQ2018-094644-B-C22 and Comunidad de Madrid, grant number P2018/EMT-4329 AIRTEC-CM.

Conflicts of Interest

There are no conflicts of interest.

References

  1. Evans, C.J.; Reynard, L.M.; Gerry, M.C.L. Pure Rotational Spectra, Structures, and Hyperfine Constants of OC-AuX (X = F, Cl, Br). Inorg. Chem. 2001, 40, 6123–6131. [Google Scholar] [CrossRef] [PubMed]
  2. Walker, N.R.; Gerry, M.C.L. Microwave Spectra, Geometries, and Hyperfine Constants of OCCuX (X = F, Cl, Br). Inorg. Chem. 2001, 40, 6158–6166. [Google Scholar] [CrossRef] [PubMed]
  3. Walker, N.R.; Gerry, M.C.L. Microwave Spectra, Geometries, and Hyperfine Constants of OCAgX (X = F, Cl, Br). Inorg. Chem. 2002, 41, 1236–1244. [Google Scholar] [CrossRef] [PubMed]
  4. Francis, S.G.; Matthews, S.L.; Poleshchuk, O.K.; Walker, N.R.; Legon, A.C. N2–Cu–F: A complex of dinitrogen and cuprous fluoride characterised by rotational spectroscopy. Angew. Chem. Int. Ed. 2006, 45, 6341–6343. [Google Scholar] [CrossRef]
  5. Harris, S.J.; Legon, A.C.; Walker, N.R.; Wheatley, D.E. Experimental detection and properties of H2O⋯Ag—Cl and H2S⋯Ag—Cl by rotational spectroscopy. Angew. Chem. Int. Ed. 2010, 49, 181–183. [Google Scholar] [CrossRef]
  6. Mikhailov, V.A.; Tew, D.P.; Walker, N.R.; Legon, A.C. H3N⋯AgCl: Synthesis in a supersonic jet and characterisation by rotational spectroscopy. Chem. Phys. Lett. 2010, 499, 16–20. [Google Scholar] [CrossRef]
  7. Mikhailov, V.A.; Roberts, F.J.; Stephens, S.L.; Harris, S.J.; Tew, D.P.; Harvey, J.N.; Walker, N.R.; Legon, A.C. Monohydrates of cuprous chloride and argentous chloride: H2O⋯CuCl and H2O⋯AgCl characterised by rotational spectroscopy and ab initio calculations. J. Chem. Phys. 2011, 134, 134305. [Google Scholar] [CrossRef]
  8. Stephens, S.L.; Tew, D.P.; Walker, N.R.; Legon, A.C. Monohydrate of argentous fluoride: H2O⋯AgF characterised by rotational spectroscopy and ab initio calculations. J. Mol. Spectrosc. 2011, 267, 163–168. [Google Scholar] [CrossRef]
  9. Walker, N.R.; Tew, D.P.; Harris, S.J.; Wheatley, D.E.; Legon, A.C. Characterisation of H2S⋯CuCl and H2S⋯AgCl isolated in the gas phase: A rigidly pyramidal geometry at sulphur revealed by rotational spectroscopy and ab initio calculations. J. Chem. Phys. 2011, 134, 014307. [Google Scholar] [CrossRef]
  10. Stephens, S.L.; Tew, D.P.; Mikhailov, V.A.; Walker, N.R.; Legon, A.C. A prototype transition metal-olefin complex C2H4⋯AgCl synthesised by laser ablation and characterised by rotational spectroscopy and ab initio methods. J. Chem. Phys. 2011, 135, 024315. [Google Scholar] [CrossRef]
  11. Stephens, S.L.; Mizukami, W.; Tew, D.P.; Walker, N.R.; Legon, A.C. Distortion of ethyne on formation of a π complex with silver chloride: C2H2⋯Ag−Cl characterised by rotational spectroscopy and ab initio calculations. J. Chem. Phys. 2012, 137, 174302. [Google Scholar] [CrossRef] [PubMed]
  12. Stephens, S.L.; Bittner, D.M.; Mikhailov, V.A.; Mizukami, W.; Tew, D.P.; Walker, N.R.; Legon, A.C. Changes in the geometries of C2H2 and C2H4 on coordination to CuCl revealed by broadband rotational spectroscopy and ab-initio calculations. Inorg. Chem. 2014, 53, 10722–10730. [Google Scholar] [CrossRef] [PubMed]
  13. Bittner, D.M.; Zaleski, D.P.; Stephens, S.L.; Tew, D.P.; Walker, N.R.; Legon, A.C. A monomeric complex of ammonia and cuprous chloride: H3N⋯CuCl isolated and characterised by rotational spectroscopy and ab initio calculations. J. Chem. Phys. 2015, 142, 144302. [Google Scholar] [CrossRef] [PubMed]
  14. Zaleski, D.P.; Stephens, S.L.; Tew, D.P.; Bittner, D.M.; Walker, N.R.; Legon, A.C. Distortion of ethyne when complexed with a cuprous and argentous halide: The rotational spectrum of C2H2⋯CuF. Phys. Chem. Chem. Phys. 2015, 17, 19230–19237. [Google Scholar] [CrossRef] [Green Version]
  15. Bittner, D.M.; Stephens, S.L.; Zaleski, D.P.; Tew, D.P.; Walker, N.R.; Legon, A.C. Gas Phase Complexes of H3N⋯CuF and H3N⋯CuI Studied by Rotational Spectroscopy and Ab Initio Calculations: The Effect of X (X = F, Cl, Br, I) in OC⋯CuX and H3N⋯CuX. Phys. Chem. Chem. Phys. 2016, 18, 13638–13645. [Google Scholar] [CrossRef] [Green Version]
  16. Legon, A.C.; Walker, N.R. What’s in a name? ‘Coinage-metal’ non-covalent bonds and their definition. Phys. Chem. Chem. Phys. 2018, 20, 19332–19338. [Google Scholar] [CrossRef] [Green Version]
  17. Desiraju, G.R.; Ho, P.S.; Kloo, L.; Legon, A.C.; Marquardt, R.; Metrangolo, P.; Politzer, P.A.; Resnati, G.; Rissanen, K. Definition of the halogen bond (IUPAC Recommendations 2013). Pure Appl. Chem. 2013, 85, 1711–1713. [Google Scholar] [CrossRef]
  18. Aakeroy, C.B.; Bryce, D.L.; Desiraju, G.R.; Frontera, A.; Legon, A.C.; Nicotra, F.; Rissanen, K.; Scheiner, S.; Terraneo, G.; Metrangolo, P.; et al. Definition of the chalcogen bond (IUPAC Recommendations 2019). Pure Appl. Chem. 2019, 91, 1889–1892. [Google Scholar] [CrossRef]
  19. Zierkiewicz, W.; Michalczyk, M.; Scheiner, S. Regium bonds between Mn clusters (M = Cu, Ag, Au and n = 2–6) and nucleophiles NH3 and HCN. Phys. Chem. Chem. Phys. 2018, 20, 22498–22509. [Google Scholar] [CrossRef] [Green Version]
  20. Hoeft, J.; Lovas, F.J.; Tiemann, E.; Törring, T. Dipole moments of CuCl or AgCl. Z. Naturforsch. A 1970, 25, 35–39. [Google Scholar] [CrossRef] [Green Version]
  21. Hensel, K.D.; Styger, C.; Jager, W.; Merer, A.J.; Gerry, M.C.L. Microwave spectra of metal chlorides produced using laser ablation. J. Chem. Phys. 1993, 99, 3321–3328. [Google Scholar] [CrossRef]
  22. Legon, A.C. A reduced radial potential energy function for the halogen bond and the hydrogen bond in complexes B⋯XY and B⋯HX, where X and Y are halogen atoms. Phys. Chem. Chem. Phys. 2014, 16, 12415–12421. [Google Scholar] [CrossRef] [PubMed] [Green Version]
  23. Alkorta, I.; Legon, A.C. Strengths of non-covalent interactions in hydrogen-bonded complexes B⋯HX and halogen-bonded complexes B⋯XY (X, Y = F, Cl): An ab initio investigation. New J. Chem. 2018, 42, 10548–10554. [Google Scholar] [CrossRef]
  24. Alkorta, I.; Legon, A.C. Nucleophilicities of Lewis bases B and electrophilicities of Lewis acids as determined from the dissociation energies of complexes B⋯A involving hydrogen bonds, tetrel bonds, pnictogen bonds, chalcogen bonds and halogen bonds. Molecules 2017, 22, 1786. [Google Scholar] [CrossRef] [Green Version]
  25. Alkorta, I.; Legon, A.C. Non-covalent interactions involving alkaline-earth atoms and Lewis bases B: An ab initio investigation of beryllium and magnesium bonds, B⋯MR2 (M = Be or Mg, and R = H, F or CH3). Inorganics 2019, 7, 35. [Google Scholar] [CrossRef] [Green Version]
  26. Alkorta, I.; Hill, J.G.; Legon, A.C. An ab initio investigation of alkali–metal noncovalent bonds B⋯LiR and B⋯NaR (R = F, H or CH3) formed with simple Lewis bases B: The relative inductive effects of F, H and CH3. Phys. Chem. Chem. Phys. 2020, 22, 16421–16430. [Google Scholar] [CrossRef]
  27. Purvis, G.D., III; Bartlett, R.J. A full coupled-cluster singles and doubles model—The inclusion of disconnected triples. J. Chem. Phys. 1982, 76, 1910–1918. [Google Scholar] [CrossRef]
  28. Woon, D.E.; Dunning, T.H. Gaussian basis sets for use in correlated molecular calculations. V. Core-valence basis sets for boron through neon. J. Chem. Phys. 1995, 103, 4572–4585. [Google Scholar] [CrossRef] [Green Version]
  29. Peterson, A.K.; Puzzarini, C. Systematically convergent basis sets for transition metals. II. Pseudopotential-based correlation consistent basis sets for the group 11 (Cu, Ag, Au) and 12 (Zn, Cd, Hg) elements. Theor. Chem. Acc. 2005, 114, 283–296. [Google Scholar] [CrossRef]
  30. Feller, D. The use of systematic sequences of wave functions for estimating the complete basis set, full configuration interaction limit in water. J. Chem. Phys. 1993, 98, 7059–7071. [Google Scholar] [CrossRef]
  31. Halkier, A.; Helgaker, T.; Jorgensen, P.; Klopper, W.; Olsen, J. Basis-set convergence of the energy in molecular Hartree–Fock calculations. Chem. Phys. Lett. 1999, 302, 437–446. [Google Scholar] [CrossRef]
  32. Werner, H.-J.; Knowles, P.J.; Knizia, G.; Manby, F.R.; Schütz, M.; Celani, P.; Korona, T.; Lindh, R.; Mitrushenkov, A.; Rauhut, G.; et al. MOLPRO, Version 2012.1, A Package of Ab Initio Programs. 2012. Available online: http://www.molpro.net (accessed on 5 January 2021).
  33. Frisch, M.J.; Trucks, G.W.; Schlegel, H.B.; Scuseria, G.E.; Robb, M.A.; Cheeseman, J.R.; Scalmani, G.; Barone, V.; Petersson, G.A.; Nakatsuji, H.; et al. Gaussian 16; Revision, A.03; Gaussian, Inc.: Wallingford, CT, USA, 2016. [Google Scholar]
  34. Jmol: An Open-Source Java Viewer for Chemical Structures in 3D. Available online: http://www.jmol.org/ (accessed on 1 January 2021).
  35. Millen, D.J. Determination of stretching force constants of weakly bound dimers from centrifugal distortion constants. Can. J. Chem. 1985, 63, 1477–1479. [Google Scholar] [CrossRef]
  36. Bittner, D.M.; Walker, N.R.; Legon, A.C. A two force-constant model for complexes B⋯M−X (B is a Lewis base and MX is any diatomic molecule): Intermolecular stretching force constants from centrifugal distortion constants DJ or ΔJ. J. Chem. Phys. 2016, 144, 074308. [Google Scholar] [CrossRef] [PubMed] [Green Version]
  37. Costain, C.C. Determination of Molecular Structures from Ground State Rotational Constants. J. Chem. Phys. 1958, 29, 864–874. [Google Scholar] [CrossRef]
  38. Watson, J.K.G.; Roytburg, A.; Ulrich, W. Least-Squares Mass-Dependence Molecular Structures. J. Mol. Spectrosc. 1999, 196, 102–119. [Google Scholar] [CrossRef] [Green Version]
  39. Townes, C.H.; Schawlow, A.L. Microwave Spectroscopy; McGraw-Hill Book Company Inc.: New York, NY, USA, 1955; Chapter 9. [Google Scholar]
  40. Sánchez-Sanz, G.; Trujillo, C.; Alkorta, I.; Elguero, J. Understanding Regium Bonds and their Competition with Hydrogen Bonds in Au2:HX Complexes. ChemPhysChem 2019, 20, 1572–1580. [Google Scholar] [CrossRef]
  41. Zheng, B.; Liu, Y.; Wang, Z.; Zhou, F.; Liu, Y.; Ding, X.; Lu, T. Regium bonds formed by MX (M = Cu, Ag, Au; X = F, Cl, Br) with phosphine-oxide/phosphinous acid: Comparisons between oxygen-shared and phosphine-shared complexes. Mol. Phys. 2019, 117, 2443–2455. [Google Scholar] [CrossRef]
  42. Sánchez-Sanz, G.; Trujillo, C.; Alkorta, I.; Elguero, J. Rivalry between Regium and Hydrogen Bonds Established within Diatomic Coinage Molecules and Lewis Acids/Bases. ChemPhysChem 2020, 21, 2557–2563. [Google Scholar] [CrossRef]
Figure 1. De versus kσ for B⋯CuX, B⋯AgX, and B⋯AuX, where X = F and Cl. This diagram shows that there is no significant correlation between these two properties.
Inorganics 09 00013 g001
Figure 2. De as calculated ab initio versus the values calculated from the nucleophilicity NB and electrophilicities EMX by Equation (2), De = cNB·EMX.
Inorganics 09 00013 g002
Figure 3. De plotted against NB for each series B⋯CuF, B⋯CuCl, B⋯AgF, B⋯AgCl, B⋯AuF, and B⋯AuCl, where B = N2, CO, C2H2, C2H4, PH3, H2S, HCN, H2O, and NH3. Each straight line is a linear regression fit to the set of points for the associated B⋯M–X.
Inorganics 09 00013 g003
Figure 4. MESPs drawn at the 0.001 e/bohr3 iso-surfaces of (a) ClF, (b) HCl, and (CuCl), calculated at the MP2/aug-cc-pVTZ level of theory. Dark blue represents the most positive potential, and this clearly increases dramatically from ClF to HCl to CuCl. The numerical values of the maximum positive electrostatic potentials at the iso-surface, along the molecular axis, are shown.
Inorganics 09 00013 g004
Figure 5. Normalised De values (Demax) plotted against the nucleophilicities of the Lewis bases B for 18 complexes B⋯CuX (X = F and Cl). The straight line is the linear regression fit to all 18 points and has the equation (Demax) = [2.086(13) × 102]NB + 0.021(15), with R2 = 0.9661. Some points are obscured by overlap.
Inorganics 09 00013 g005
Figure 6. Normalised De values (Demax) plotted against the nucleophilicities of the Lewis bases B for 18 complexes B⋯AgX (X = F and Cl). The straight line is the linear regression fit to all 18 points and has the equation (Demax) = [3.05(17) × 10−2]NB − 0.014(21), with R2 = 0.9441.
Inorganics 09 00013 g006
Figure 7. Normalised De values (Demax) plotted against the nucleophilicities of the Lewis bases B for 18 complexes B⋯AuX (X =F and Cl). The straight line is the linear regression fit to all 18 points and has the equation (Demax) = [4.31(11) × 102]NB − 0.011(13), with R2 = 0.9876. Several of the AuF and AuCl points are obscured by overlap.
Inorganics 09 00013 g007
Table 1. Equilibrium dissociation energies D e CBS /(kJ mol−1) calculated at the CCSD(T)/CBS level (see text) for 54 complexes B⋯M–X.
Lewis Base BLewis Acid, M–X
Cu–FCu–ClAg–FAg–ClAu–FAu–Cl
N2107.690.258.951.5138.6106.4
CO173.1149.4120.8104.3256.2208.9
C2H2154.5136.1107.397.9209.8174.8
CH2CH2161.2143.3121.8111.4229.9194.2
PH3177.9161.2151.0137.4277.9237.8
H2S145.2132.1114.0105.5208.8176.5
HCN160.3145.1109.3102.9195.6163.8
H2O123.4114.082.780.8139.1118.6
NH3184.0171.9140.1134.7229.6200.5
Table 2. Intermolecular stretching quadratic force constants kσ/(N m−1) of complexes B⋯M–X calculated at the CCSD(T)/aug-cc-pVZ/aug-cc-pVTZ-PP level of theory (see text for the method).
Lewis Base BLewis Acid, M–X
Cu–FCu–ClAg–FAg–ClAu–FAu–Cl
N2189.1154.089.771.3238.1176.3
CO260.3220.8174.4140.0379.3312.6
C2H2179.7143.7101.886.2244.2192.8
CH2CH2166.9139.7113.797.6237.5195.0
PH3167.8147.1140.6120.7271.4231.0
H2S137.0119.4102.189.4201.0165.0
HCN204.9178.2121.8106.7257.0205.6
H2O149.3132.386.180.0168.4136.6
NH3184.0168.0133.5121.7235.3200.4
Table 3. Comparison of calculated and observed intermolecular distances r(Z⋯M)/Å in complexes B⋯M–X, where Z is the acceptor atom/centre in the Lewis base B.
Lewis Base BB⋯Cu–FB⋯Cu–ClB⋯Ag–FB⋯Ag–ClB⋯Au–FB⋯Au–Cl
Calc.Exp.Calc.Exp.Calc.Exp.Calc.Exp.Calc.Exp.Calc.Exp.
N21.8151.790(2) a1.854-2.086-2.144-1.934-1.991-
CO1.7851.76385(4) b1.8171.79447(1) b1.9701.96486(1) c2.0192.01281(9) c1.8591.847 d1.8971.88593(6) d
C2H21.8741.8474(7) e1.9151.887(2) f2.139-2.1922.1795(4) g2.002-2.043-
CH2CH21.895-1.9341.908(12) g2.126-2.1722.1697(4) h2.004-2.045-
PH32.134-2.168-2.287-2.331-2.188-2.224-
H2S2.154-2.1902.1531(3) i2.355-2.4002.3838(1) i2.239-2.285-
HCN1.819-1.851-2.061-2.101-1.940 1.987
H2O1.918-1.9431.925(5) j2.1832.168(11)2.2102.204(7) j2.085-2.132-
NH31.9111.8928(6) k1.9341.9182(13) l2.123-2.1542.1545(8) m2.039-2.077-
a Reference [4], r0 b Reference [2], rm c Reference [3], rm d Reference [1], r0(F) rs (Cl) e Reference [14], r0 f Reference [12], rs g Reference [11], rm h Reference [10], rs i Reference [9], r0 j Reference [8], rs k Reference [15], r0 l Reference [13], r0 m Reference [6], rs.
Table 4. Values of (a) the nucleophilicity NB of the Lewis bases and (b) the electrophilicities EMX of the Lewis acids M–X determined by fitting 54 De values to Equation (2).
Lewis Base B NBLewis Acid M–XEMX
N27.68Cu–F12.52
CO14.03Cu–Cl11.24
C2H212.07Ag–F9.22
CH2CH213.18Ag–Cl8.49
PH315.67Au–F17.21
H2S12.05Au–Cl14.48
HCN11.90
H2O8.86
NH314.29
Table 5. The maximum positive molecular electrostatic surface potentials (σmax) for the diatomic molecules M–X (M = Cu, Ag, Au; X = F, Cl) at the 0.001 e/bohr3 iso-surface. These were calculated at the MP2/aug-cc-pVTZ level of theory and occur on the molecular axis near to the metal atom M.
Moleculeσmax/(kJ mol−1)
Cu–F405.1
Cu–Cl379.8
Ag–F294.5
Ag–Cl308.0
Au–F404.8
Au–Cl346.7
Publisher’s Note: MDPI stays neutral with regard to jurisdictional claims in published maps and institutional affiliations.

