
Gender Differences in Collaboration Patterns in Computer Science


Department of Computer Science, Reed College, 3203 Woodstock Blvd, Portland, OR 97202, USA
*
Author to whom correspondence should be addressed.
Publications 2022, 10(1), 10; https://0-doi-org.brum.beds.ac.uk/10.3390/publications10010010
Submission received: 12 December 2021
/
Revised: 17 February 2022
/
Accepted: 21 February 2022
/
Published: 24 February 2022
Abstract
:The research discipline of computer science (CS) has a well-publicized gender disparity. Multiple studies estimate the ratio of women among publishing researchers to be around 15–30%. Many explanatory factors have been studied in association with this gender gap, including differences in collaboration patterns. Here, we extend this body of knowledge by looking at differences in collaboration patterns specific to various fields and subfields of CS. We curated a dataset of nearly 20,000 unique authors of some 7000 top conference papers from a single year. We manually assigned a field and subfield to each conference and a gender to most researchers. We then measured the gender gap in each subfield as well as five other collaboration metrics, which we compared to the gender gap. Our main findings are that the gender gap varies greatly by field, ranging from 6% female authors in theoretical CS to 42% in CS education; subfields with a higher gender gap also tend to exhibit lower female productivity, larger coauthor groups, and higher gender homophily. Although women published fewer single-author papers, we did not find an association between single-author papers and the ratio of female researchers in a subfield.
1. Introduction
The gender gap in science, technology, engineering, and mathematics (STEM), and in particular in computer science (CS), is a well-known and well-studied problem. It carries significant societal effects, such as inequality in economic opportunities for women and an undersupply of researchers and engineers in the rapidly growing discipline [1,2,3,4]. The gender gap among researchers is particularly noteworthy: the people who participate in research, publish about it, and have their research acknowledged for its value are predominantly men [5]. Numerous studies estimate that only about 15–30% of the CS research community are women [6,7,8,9,10]. Although some recent indications show these numbers could be growing, they remain low, and the rate of growth remains slow [11].
The gender gap, defined simply as the difference in participation between men and women, is nevertheless a complex, multifaceted societal phenomenon [12]. Numerous approaches to understand and perhaps increase the representation of women have focused on aspects such as resource availability, gender stereotypes, child care, structural barriers, gender differences, discrimination, and other factors. This article focuses on one of these factors: the collaboration patterns of paper coauthors across genders and CS fields.
Scientific collaborations are the backbone of a successful career in science [13]. For example, researchers with more collaborators have been found to publish more articles, publish in higher impact journals, and accrue citations more quickly [14]. Consequently, many studies have investigated whether women and men collaborate at different rates across disciplines, and have often found significant differences [15,16,17,18].
In CS, and in particular in its more experimental fields such as computer systems, graphics, and artificial intelligence, collaboration is crucial because the large-scale implementation efforts involved often require teams of researchers with various experience levels. In this article, we focus on gender differences in collaboration patterns across the fields and subfields of CS, both experimental and theoretical.
Our study design is descriptive and observational in nature. We did not start out with any preset hypotheses to validate. Instead, our goal was to collect and analyze up-to-date, accurate, and extensive data on CS authorship and collaboration patterns across genders. These data and this analysis provide baseline statistics for comparison across different time points and scientific disciplines. However, it also provides immediate answers and comparisons to existing work, thereby offering new insights into the current state of collaboration differences across genders and CS fields. Specifically, in this article we address the following research questions:
- RQ1: What are the ratios of women and men among CS conference authors?
- RQ2: Do women publish less than men?
- RQ3: Are productivity differences affected by collaboration size?
- RQ4: Do women collaborate with fewer people than men?
- RQ5: Do women publish fewer single-author papers?
- RQ6: Are team sizes (coauthor groups) larger in more experimental subfields?
- RQ7: Do authors exhibit gender homophily in their choice of coauthors?
To bring these questions into historical context, we next briefly survey some of the previous work in the area.
1.1. Related Work
There exists rich literature on the gender gap in the sciences in general, and in computer science research in particular. For a recent review of these works, refer to Avolio et al.’s review from 2020 [12]. Instead, we limit our focus to the relevant literature on collaboration patterns and differences.
For example, a recent study of differences in collaboration patterns across disciplines found that female scientists have a lower probability of repeating previous coauthors than males. It also found that female faculty have significantly fewer distinct coauthors over their careers than males, but that this difference can be fully accounted for by females’ lower publication rate and shorter career lengths [19].
This productivity gap, which we observed in our dataset as well, has been thoroughly explored in several other studies [17,20,21,22,23]. In the social sciences, one study has found that women generally publish fewer papers than men and that two thirds of the single-author papers were written by men [24]. In mathematics, women also publish less than men, especially early in their careers, and leave academia at a higher rate than men [25]. Women are also underrepresented in the three top-ranked journals and publish fewer single-author papers. In terms of the mean number of coauthors, women’s statistics are similar to men’s. That being said, there is even a gap in recognition, as women are also less likely to receive tenure the more that they coauthor [26].
CS researchers in particular tend to collaborate more than researchers in other fields, regardless of gender, and there are no gender-specific differences in how collaborative behavior impacts scientific success [27]. This study also found that gender homophily in CS has been increasing over the past few years.
On a related note, another study of collaboration patterns across the sciences found that CS papers average 2.84 coauthors, and electrical engineering papers average 3.04 [28], which is somewhat lower than what we have found in this study. It also found that generally, in engineering, female–female collaborations accounted for only 7% of all total pairs. In CS, the percentage was even lower (5%). Since 1990, there have been even more same-gender (gender homophily) coauthorships than expected [11]. However, this property can vary across CS fields, necessitating more nuanced analysis. For example, in the field of data visualization, women collaborated with substantially more women than men [29].
Corroborating this result for biotech patent networks, women have been found to be more likely to collaborate with women, and benefit from it, but both genders mostly collaborate with men [13]. There are also fewer women “stars“, which we also found to hold specifically for the subfield of high-performance computing [30].
A surprising result came from a survey of 1714 scientists in 2011, finding that when accounting for various confounding factors, women actually have more collaborators than men [31]. The paper also reported that regression models that take into account different collaboration strategies are better at predicting a researcher’s number of collaborators.
Some studies analyzed the researcher gender gap by aggregating the coauthors of each paper into one “gender”. One study analyzed different aggregations based on the proportion of female authors, gender of most senior authors, and single-author papers [32]. Looking at author position for aggregation, another study found that there are fewer women in first and last author positions in science overall, as well as in single-author papers [33]. Other ways to aggregate genders include counting all papers that have at least one female author, and those where at least half the authors are female. In this study, we do not aggregate papers by gender, except for the trivial cases when they have a single author.
Research in computer science, and in particular in its more applied and experimental fields, can sometimes require expensive resources. Several studies have found that the gender gap in research tends to be higher in disciplines with expensive barriers to entry [22,34,35,36], which appears to agree with our findings for CS fields. A related question to that of research expense is that of travel expense, since we are focusing on conference publications, which require additional funds and could interfere with family life for people in care roles. Both factors may lead us to speculate that women would be more likely to publish in conferences in their home countries, but that is not what we found in our dataset [37]. In the same study, we also attempted to look at conference attendance and gender, for which we found almost no literature or published data. However, for one large conference that has been publishing attendance demographics since 2016, SC, we found that women’s attendance rates remained near constant around 13–14%, suggesting little variation in time.
1.2. Organization
The rest of this paper is organized as follows. In the next section (Section 2), we describe in detail our data collection methodology, including the manual assignment of genders to authors to avoid the well-known issues of name-based gender inference. In the results section (Section 3), we enumerate our findings, organized by research question, and then summarize an answer to each of the questions. The discussion (Section 4) that follows then elaborates on these answers in an attempt to synthesize insights. Finally, we conclude in Section 5 and suggest directions for future research.
2. Materials and Methods
To answer our research questions, we needed to collect expansive data on CS publications and their authors. Such data collection involves many choices, such as which publications to collect and how to assign gender to authors. The following list enumerates our main data decisions. Each choice necessarily involves trade-offs, and we attempt to justify our choices by explaining which aspects we prioritized.
Conference data instead of journal data. In CS, original scientific results are typically first published in peer-reviewed conferences [38,39], and then possibly in archival journals, sometimes years later [40]. To increase the coverage and relevance of our dataset, we only looked at conference publications. The complete list of selected conferences can be found in Table 1.
Choice of conferences. Our dataset evolved from our previous study of conferences related to one major field, computer systems [41]. The conferences we selected include some of the most prestigious systems conferences (based on indirect measurements such as Google Scholar’s metrics), as well as several smaller or less-competitive conferences for contrast. For this specific study, we decided to expand the analysis to include some of the most influential conferences in most subfields of CS, based on the same measures, for a total of 6949 papers across CS. Obviously, not all subfields have equal numbers of participants or conferences, and we had no set quota for either to be included in our dataset. Instead, we tried to ensure that each subfield is represented by at least a few hundred authors for statistical power.
Limit data to a single year. Many fields and researchers shift characteristics over time, complicating collaboration analyses. To control for these effects, all of the conferences in our dataset are from a single year, 2017.
Focus on manual gender assignment. Most studies of author gender at scale use automated approaches to assign gender to authors, typically inferred from given names [21,42]. These statistical approaches can be reasonably accurate for names of Western origin, and especially for male names [6,43,44], but can fall short when inferring from Indian and East Asian names. We opted instead to rely primarily on a manual approach that can overcome the limitations of name-based inference. Using web lookup, we assigned the gender of 14,001 of the unique researchers for whom we could identify an unambiguous web page with a recognizable gendered pronoun, or absent that, a photo. (For example, many Linkedin profiles may lack a photo, but include a gendered pronoun in the recommendations section.) For 8939 others, we used genderize.io’s automated gender designations if it was at least 90% confident about them [44]. The remaining 576 persons were assigned “NA” instead of a gender and were excluded from most analyses. This method provided more gender data and higher accuracy than automated approaches based on forename and country, especially for women [11,22,42,43,45]. Consequently, we have very few NA genders relative to comparable studies. We believe that high coverage is critical when analyzing coauthorship networks, because omitting a large number of connected sub-networks (such as people from Asia) may distort our results.
Assignment of field and subfield. We could find no standard definition and delineation of fields and subfields of CS, so we had to come up with our own, which was necessarily subjective (Table 2). Moreover, conferences do not always fall neatly into a single subfield, and some papers may stray from the primary focus of the conference. We note, however, that in most of our analyses, papers in subfields assigned to the same field often exhibited similar characteristics to each other and were distinct from other subfields. This affinity provides some evidence that these assignments are not entirely arbitrary. That said, other researchers may choose different assignments of papers or conferences to subfields and fields. Since our dataset and code are both open and available, we encourage such reevaluations of the data.
2.1. Limitations
The decisions listed above also represent some compromises that limit the generalization or applicability of our analysis. One such limitation is that the data reflects a snapshot in time to avoid the complexities of gender differences in retention rates. However, this choice precludes analyses of changes and trends in collaboration patterns over time.
Another limitation is our choice of which conferences to include out of the hundreds or thousands of annual CS conferences. Moreover, CS is a diverse discipline with significant multidisciplinary collaborations, and in some fields and subfields, journals are preferred to conferences. Consequently, our choice of conferences may not be not representative of all of CS or even a proportional representation of subfields with CS. That said, the relative metrics we measured comparing different subfields are nevertheless meaningful, but metrics over the entire dataset should be taken with a grain of salt. We believe that the large number of authors we included in our analysis provides some statistical robustness and therefore does not significantly deviate from a representative sample of the field of CS as a whole.
For this study, the most critical piece of information on these researchers is their perceived gender. Gender is a complex, multifaceted identity, but most bibliometric studies still rely on binary genders—either collected by the journal, or inferred from the first name—because that is the only designator available to them [6,7,8,9,10,11,46]. In the absence of self-identified gender information for our authors, we also necessarily compromised on using binary gender designations. We therefore use the gender terms “women“ and “men“ interchangeably with the sex terms “female“ and “male“. The conferences in our dataset did not collect or share specific gender information, so we had to collect this information from other public sources.
This labor-intensive approach does introduce the prospect of human bias and error. For example, a gender assigned by an outdated biography paragraph with pronouns may no longer agree with the self-identification of the researcher. To verify the validity of our approach, we compared our manually assigned genders to self-assigned binary genders in a separate survey we conducted among 918 of the authors [41]. We found no disagreements for these authors, which suggests that the likelihood of disagreements among the remaining authors is low. However, the main limitation that arises from this manual process of data collection and gender assignment, is that it does not scale well to a larger number of conferences or years.
Finally, the nature of the current analysis is more descriptive than prescriptive. Rather than presenting preconceived hypotheses and testing them with the data, we ask and answer open-ended research questions that fit in the scope of this paper. The answers to these questions will surely instigate further hypotheses and questions requiring deeper analysis, such as social network analysis, which is also important to understanding many collaboration patterns [13]. The open dataset we provide with this article should enable any interested researcher to perform such analyses.
2.2. Statistics
For statistical testing, group means were compared pairwise using Welch’s two-sample t-test and group medians using the Wilcoxon signed-rank test; differences between distributions of two categorical variables were tested with the test; correlations between two numerical variables were evaluated with Pearson’s product-moment correlation coefficient. All statistical tests are reported with their p-values.
3. Results
For each research question, we start with descriptive statistics across the entire sample population, and then break the statistics down by field and subfield.
3.1. RQ1: What Are the Ratios of Women and Men among CS Conference Authors?
Before we can look at collaboration patterns, we need to establish a baseline for authorship numbers across genders. For example, the question of how many women or men an author collaborates with makes little sense without the context of how many women and men are available to collaborate with overall. Consequently, the first question we ask is what is the female author ratio (FAR) in our dataset.
Summarizing across all 27,743 authors (with repeats for multiple papers) and omitting the 645 repeated authorships for which we could establish no gender, we find a total of 3833 women, which represents an overall FAR of 14.1% across authors. This result is on the low end of previously reported statistics in the range of 15–30% [6,7,8,9,10]. It is quite possible that our results are on the low end because our choice of conferences, with its emphasis on computer systems, overrepresents fields with lower representation of women. Keep in mind, however, the differences between previous studies and the current one, both in data and in methodology. Our data includes only conferences and only from one year and is by no means exhaustive or necessarily representative of the entire discipline. On the other hand, the smaller sample size allowed us to apply a primarily manual approach to gender assignment, which provides higher accuracy and coverage of researchers. In contrast, most comparable studies use a gender inference approach based on given names, which can fail for names with unclear or no gender association at all, as are many east Asian names, and tend to misidentify women in particular [6,43,44].
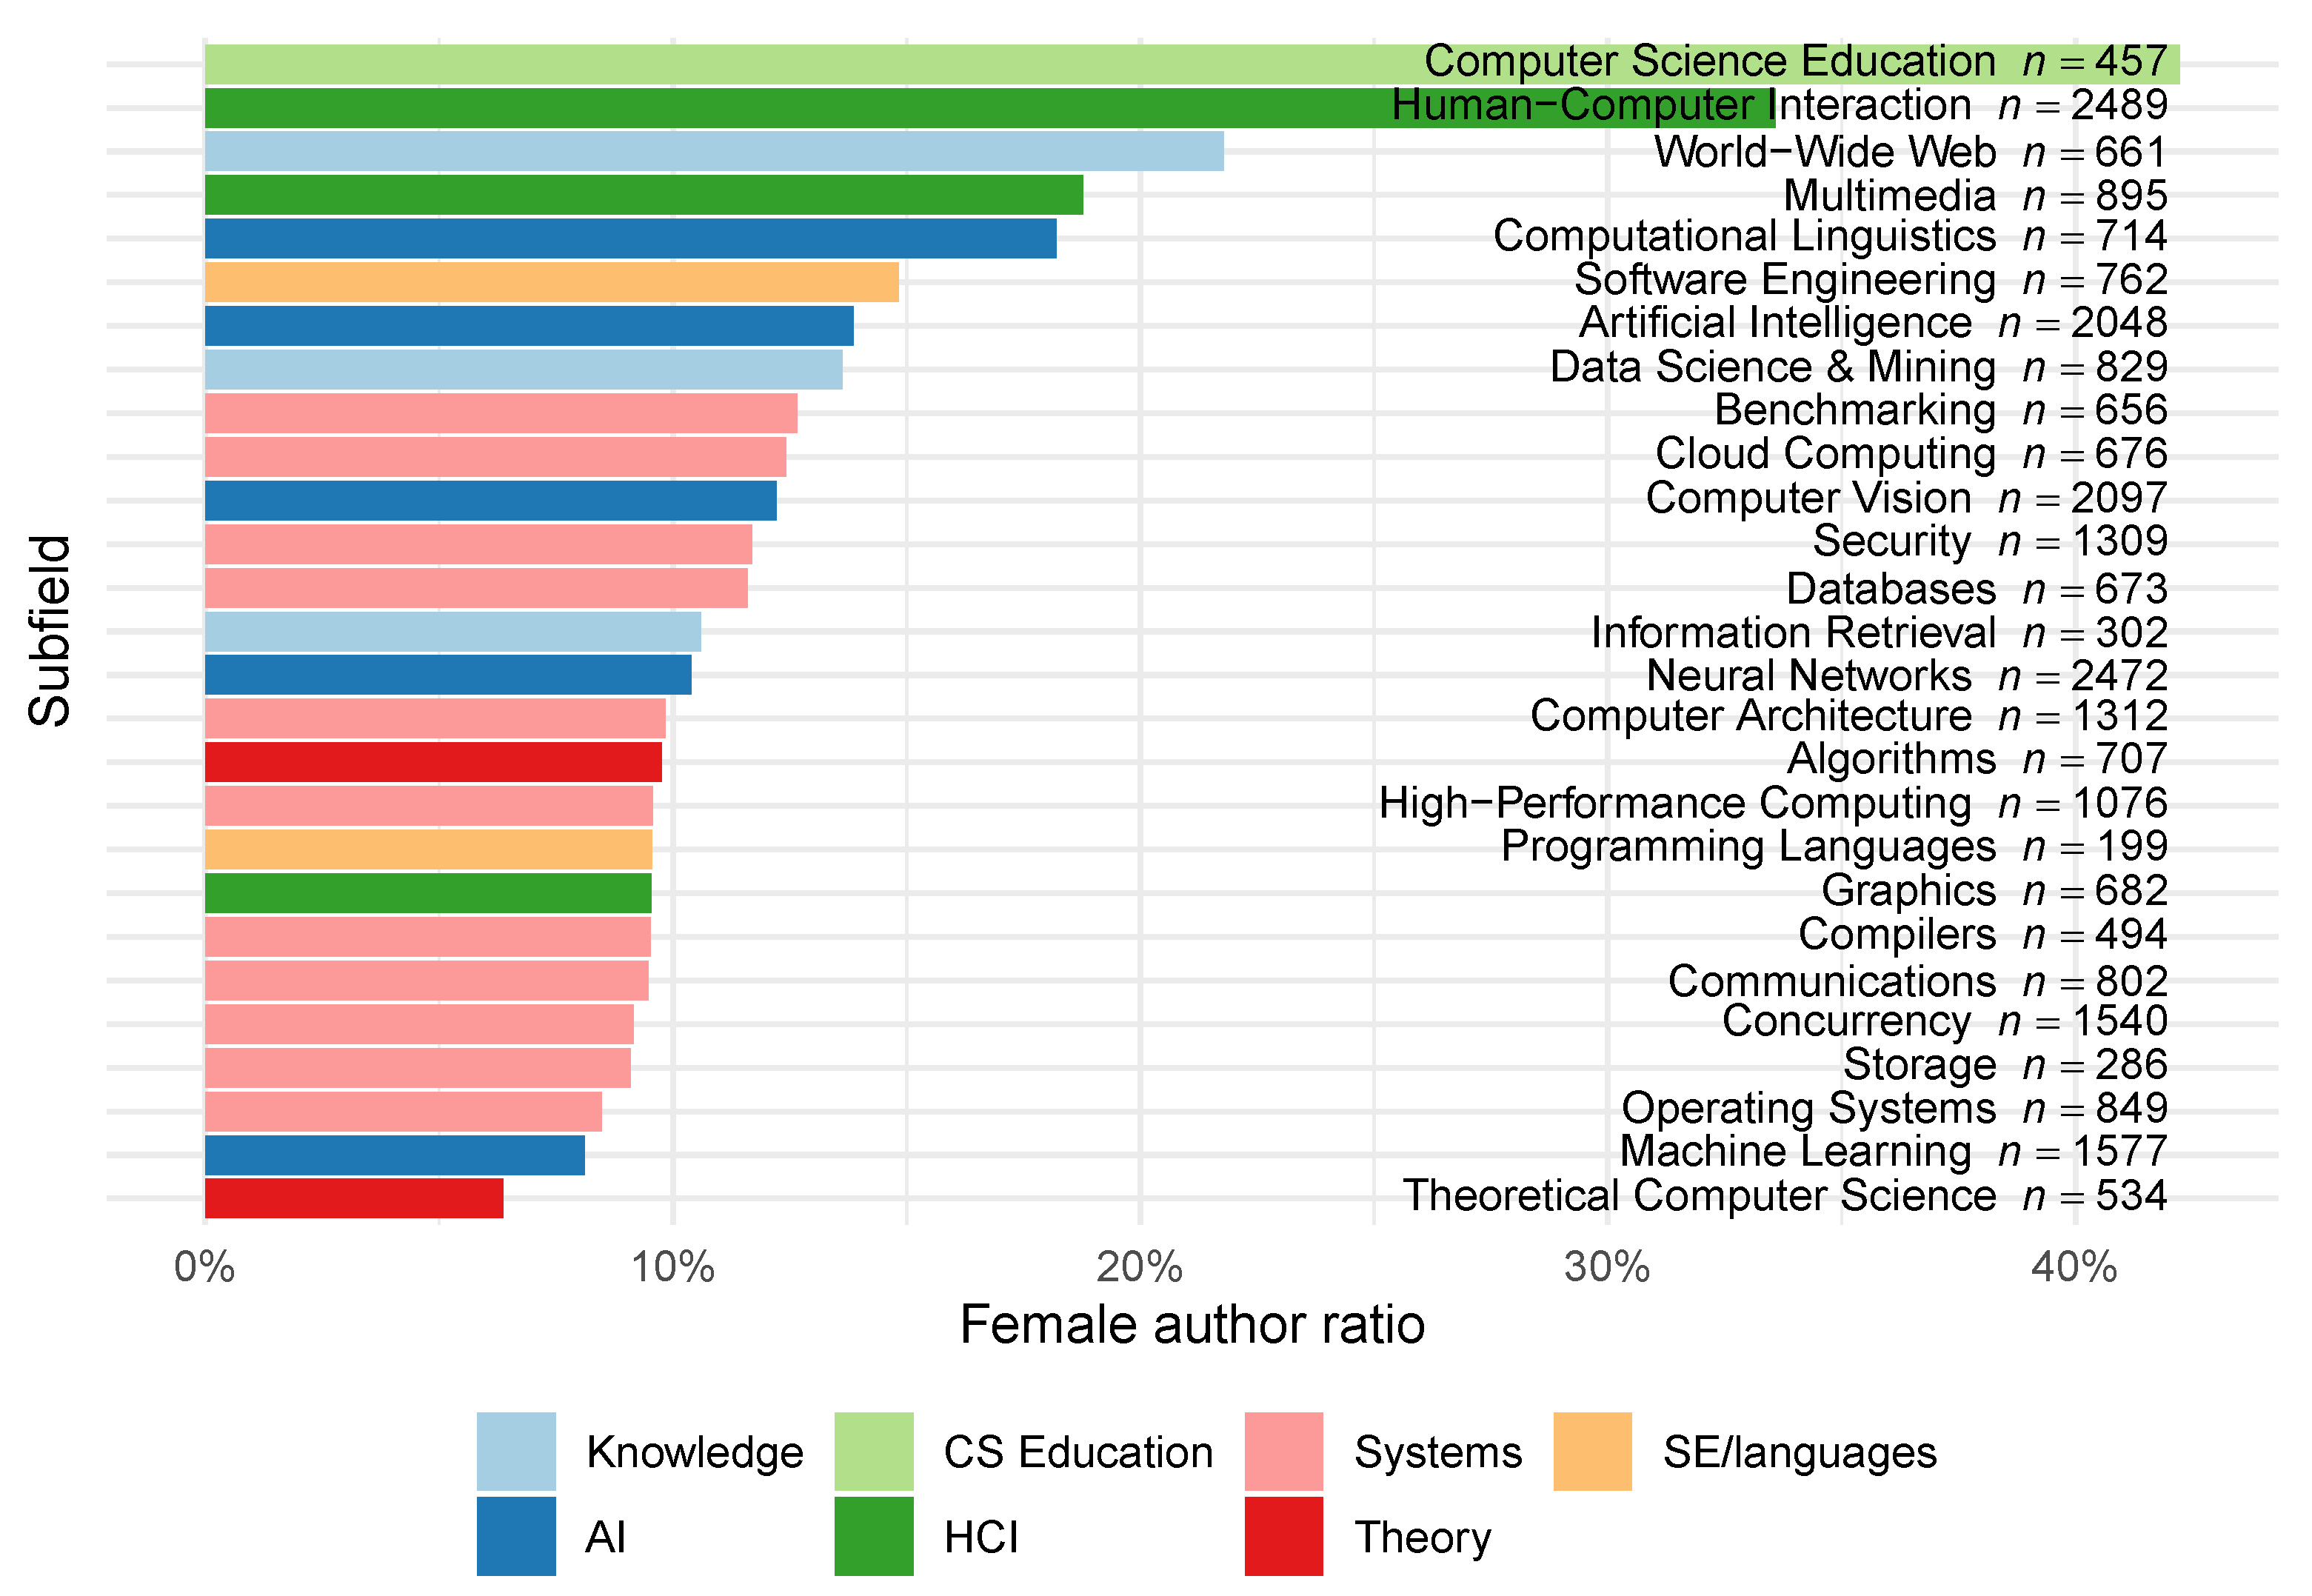
Breaking down FAR values for each field and subfield (Figure 1), we find large differences across CS. The highest FAR was exhibited in CS education conferences (42.2%) and the lowest in theoretical CS (6.4%). Most conferences in the field of computer systems hovered around 10% FAR, while the average across the entire field of AI was a little bit larger at (11.8%).
3.2. RQ2: Do Women Publish Less Than Men?
Many papers across disciplines discuss the existence and potential reasons for a productivity gap, that is, the observation that men generally publish more scholarly articles than women. Here, we continue our exploration of the data by looking at the productivity rates across genders and subfields of CS.
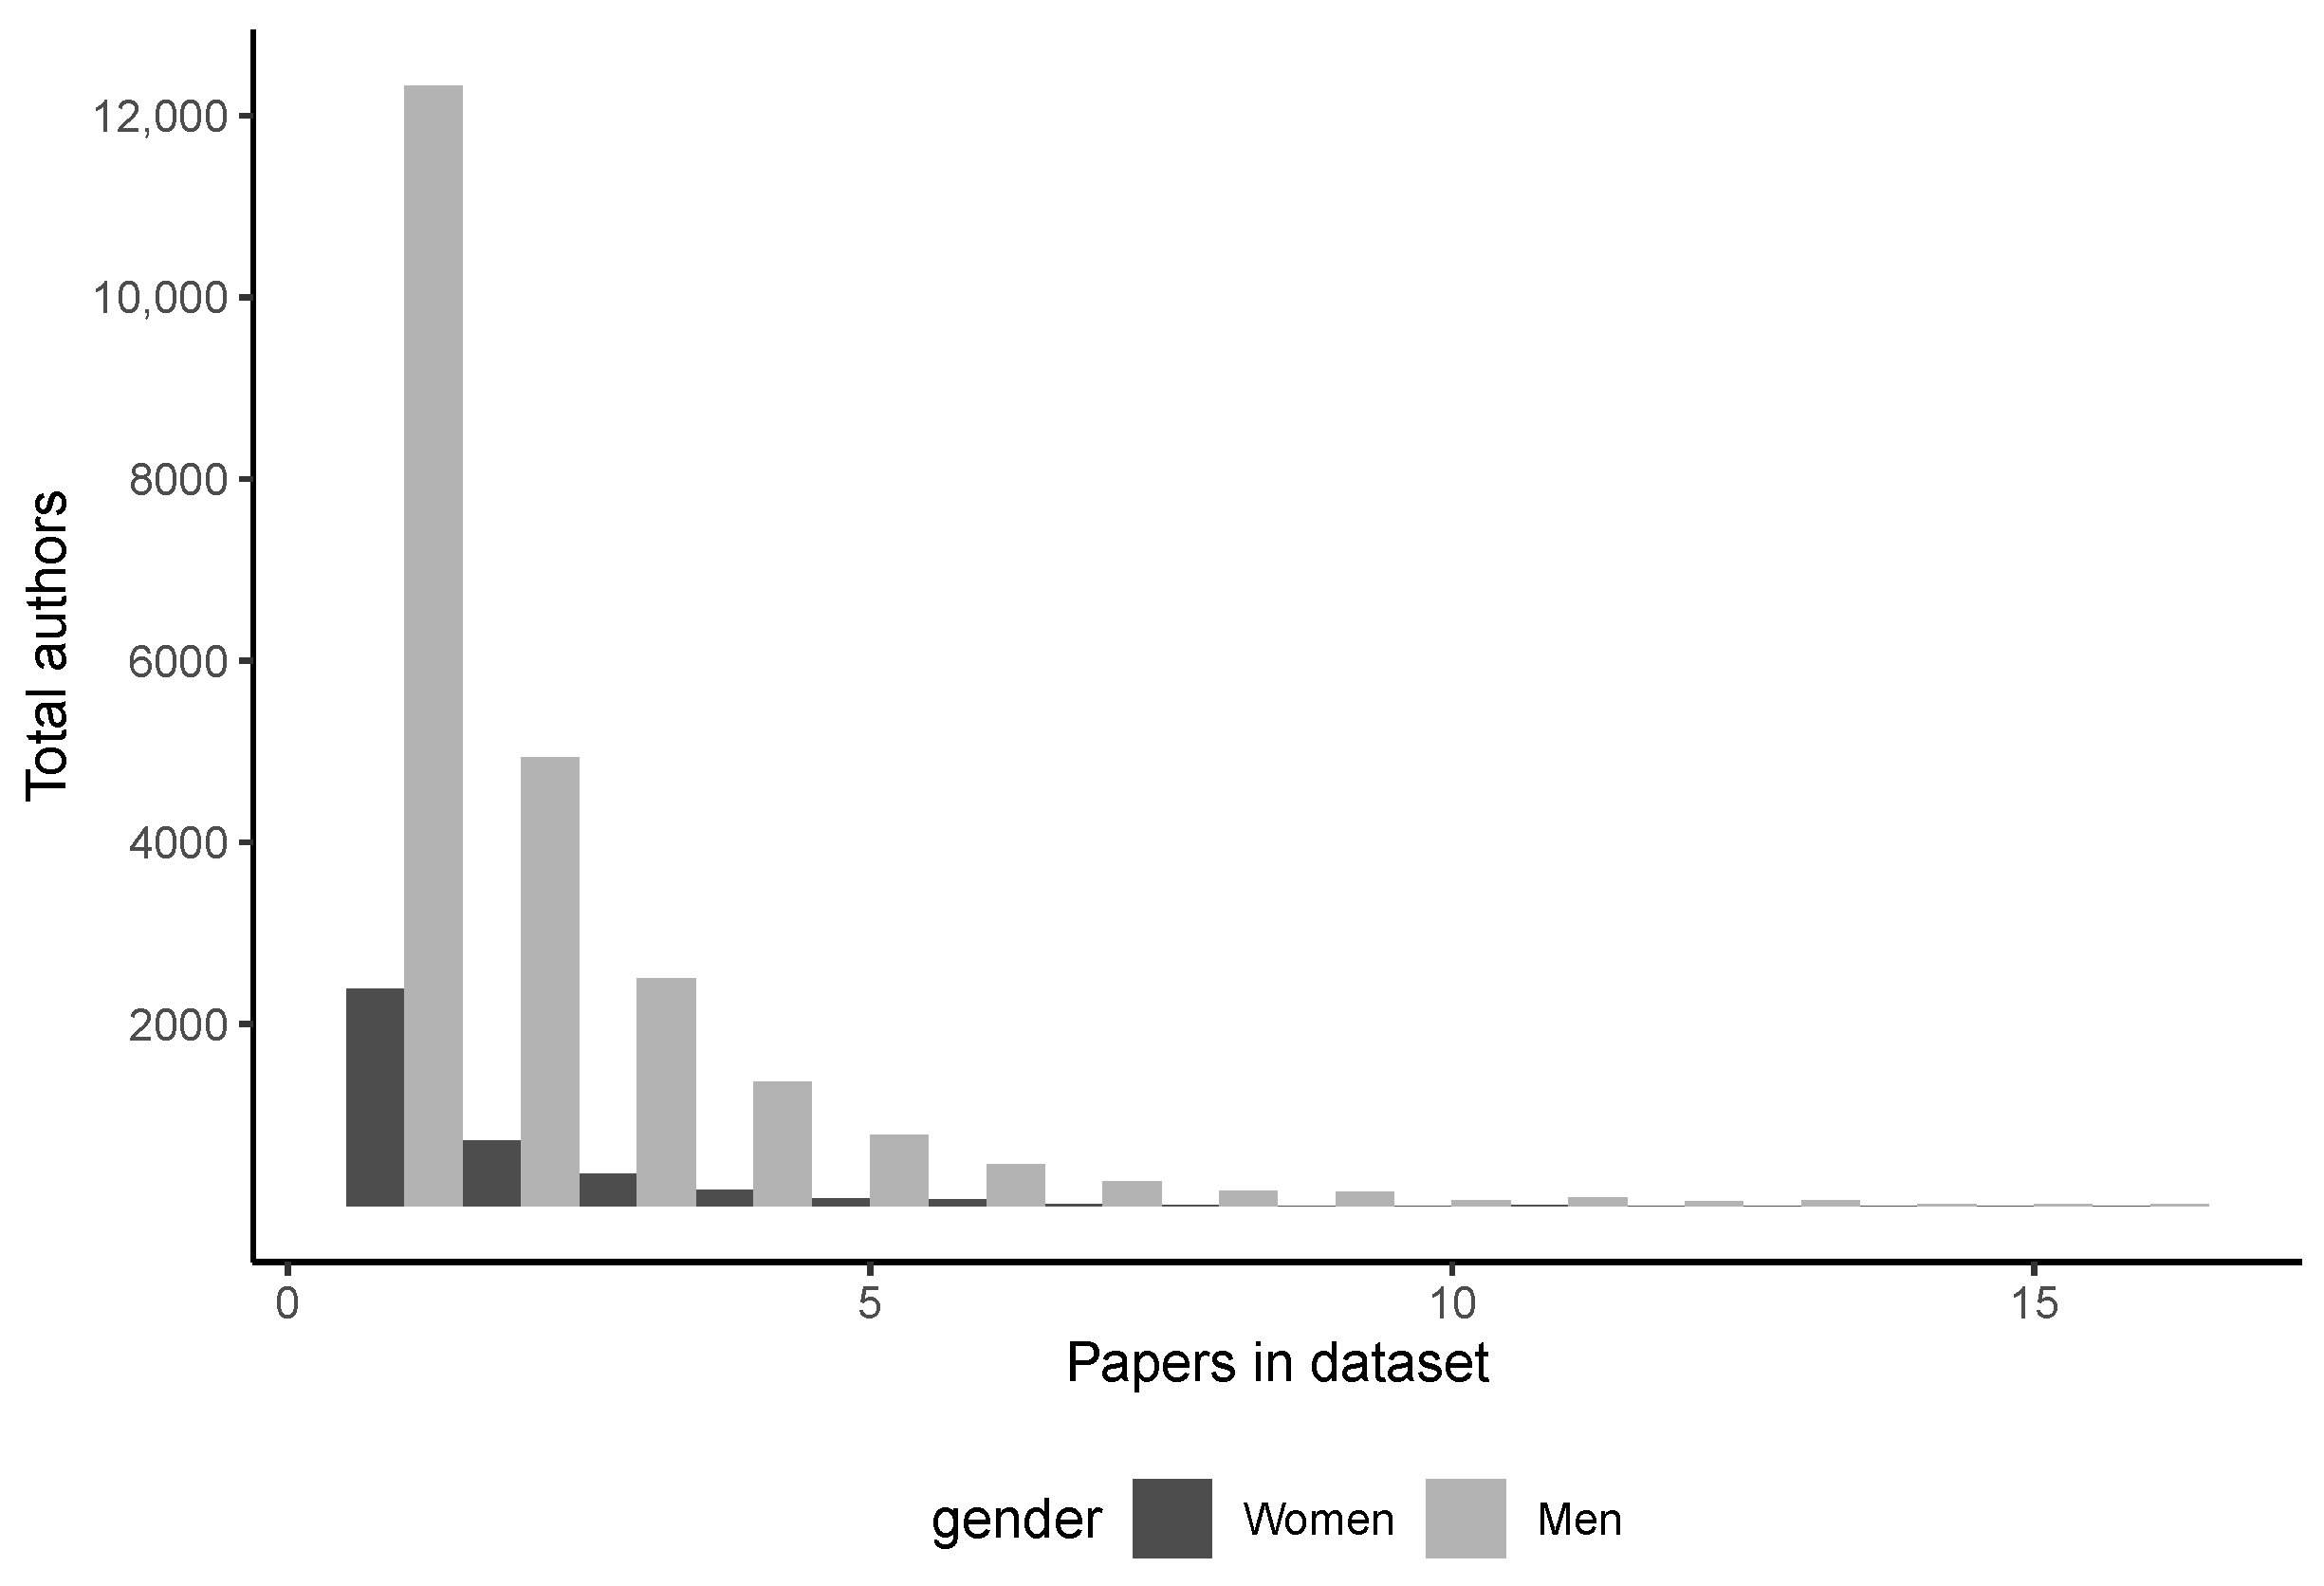
Figure 2 shows the overall distributions of paper productivity in CS across genders. Aside from the now-obvious observation that men far outnumber women authors, we can also observe a longer tail for the men’s distribution overall. The interpretation is that the most prolific authors are especially skewed male. On the opposite tail, we find that 62.4% of female authors published only one paper in our dataset, compared to 53% of men.
Overall, men average 2.15 papers per author, compared to women’s 1.77 (, ). Looking at medians—to attempt to attenuate the large effect of the long tail on means—does not help much. Both medians are naturally 1 but a Wilcoxon signed-rank test still shows a significant difference (, ).
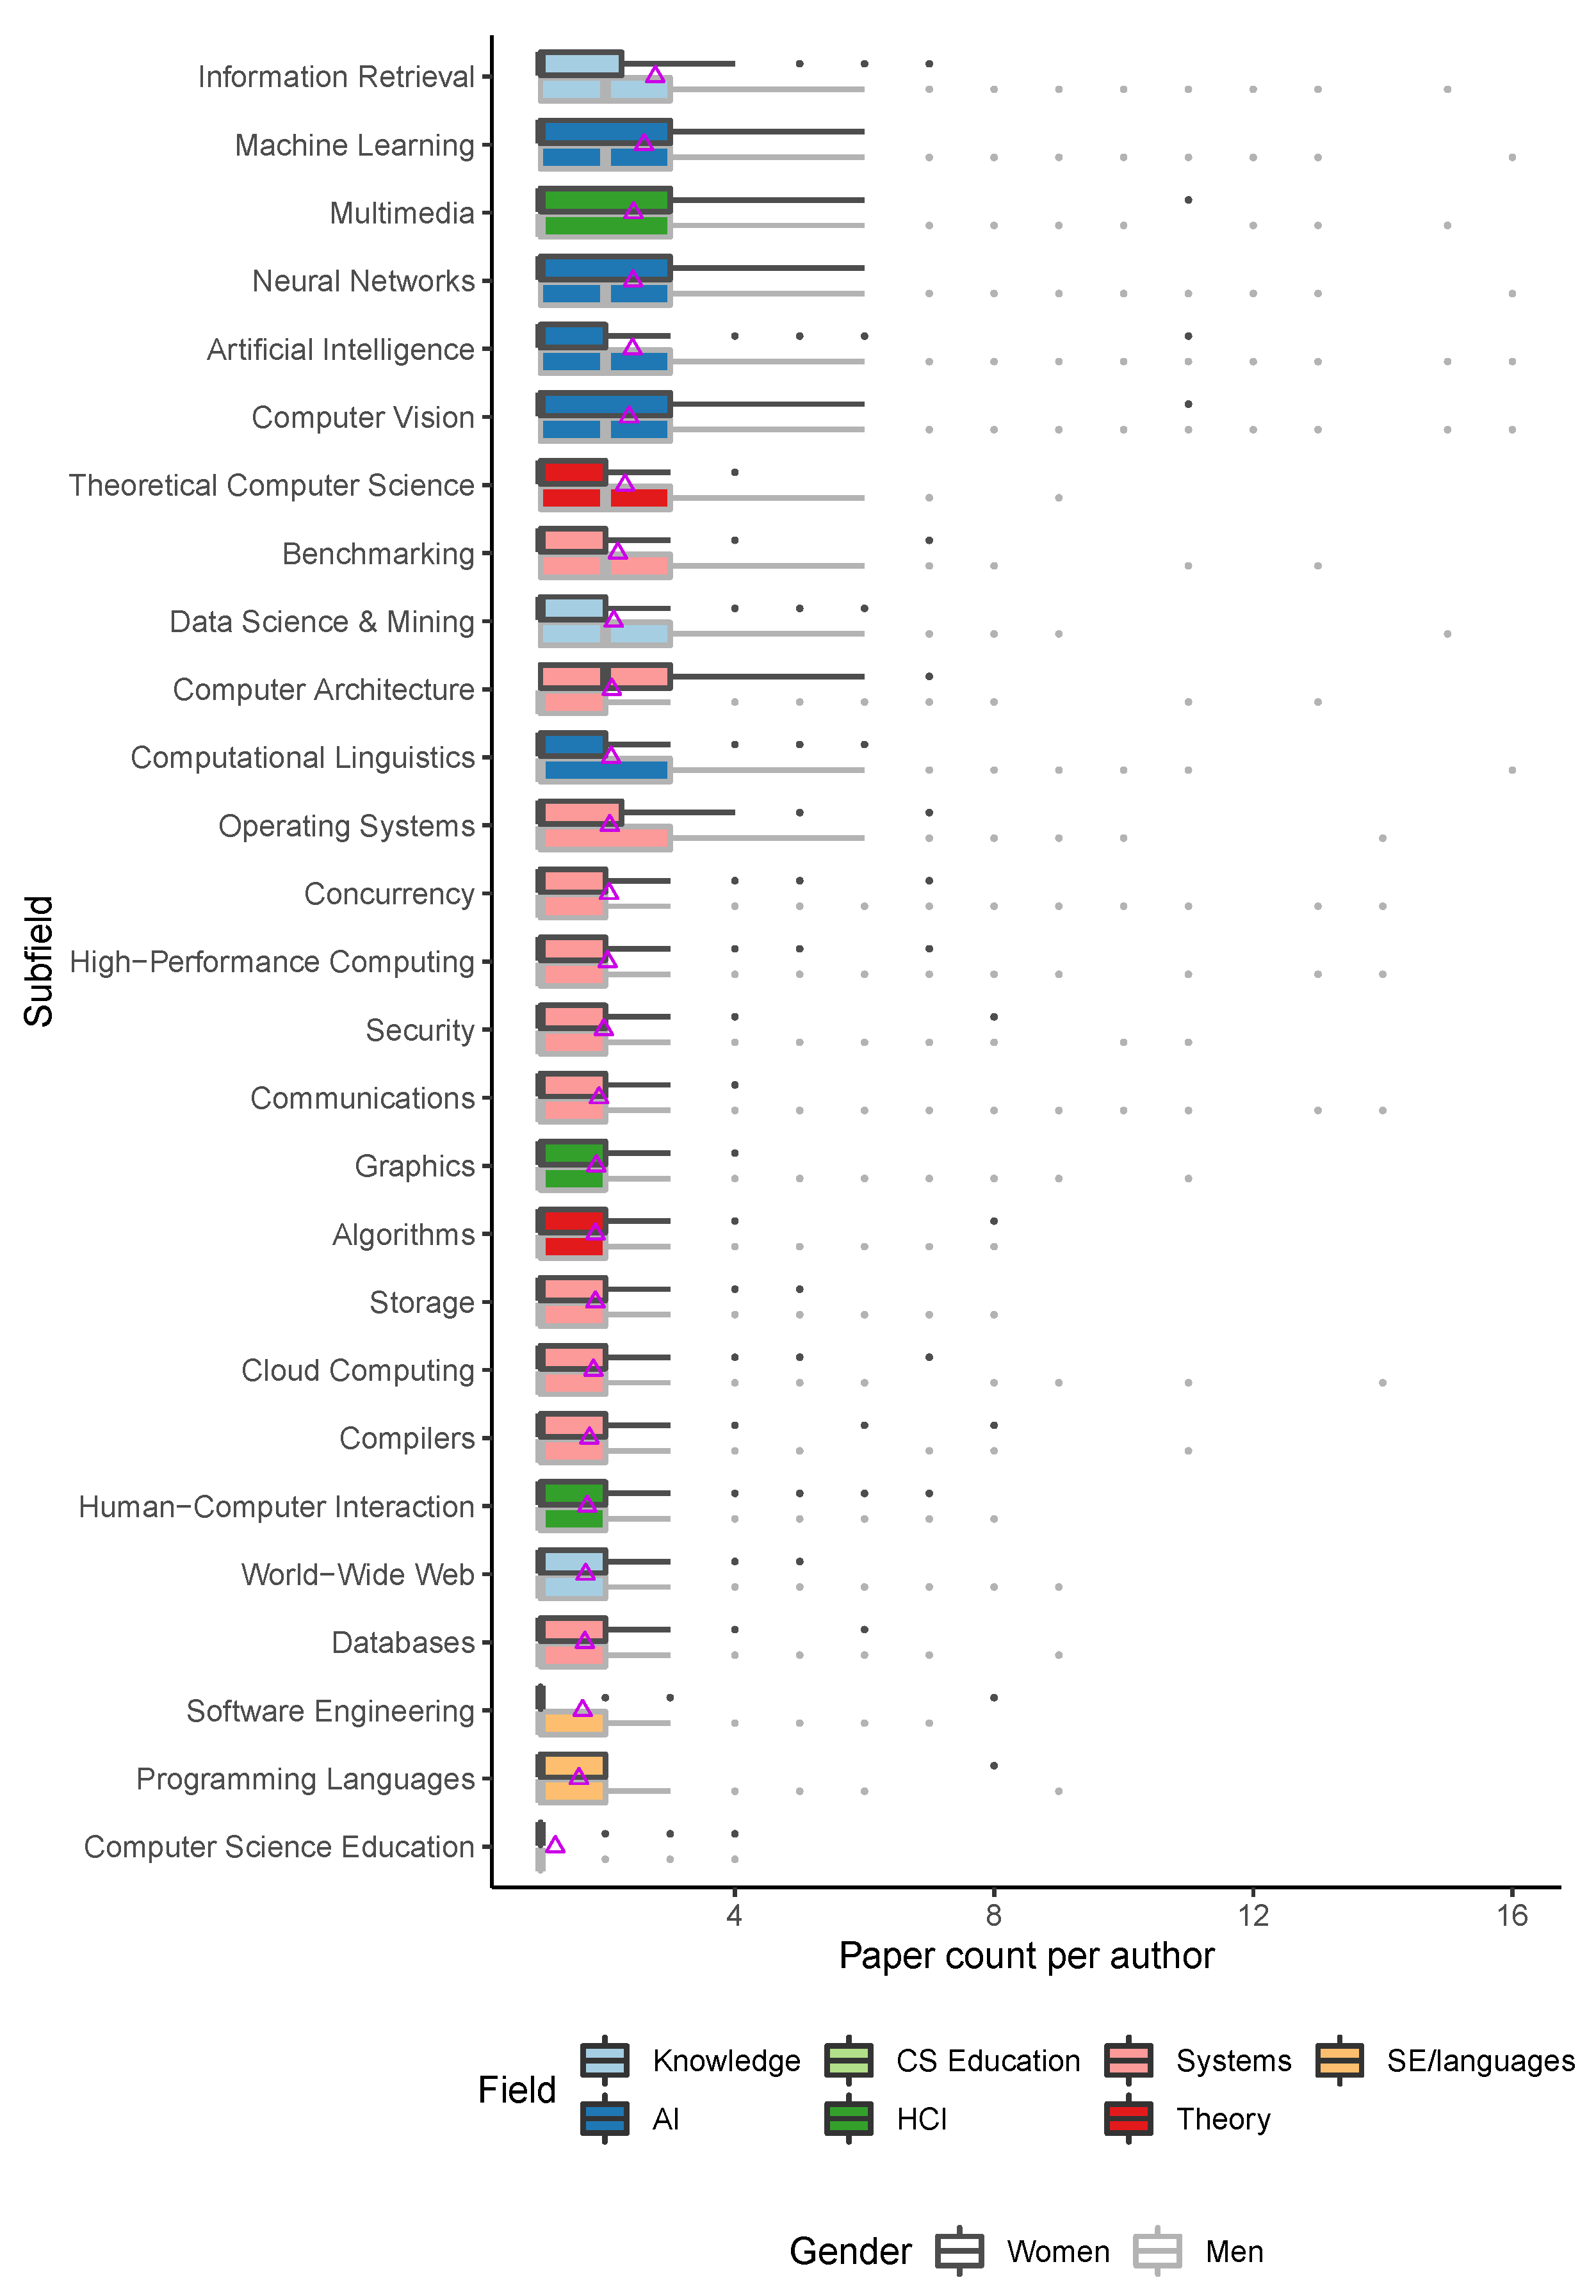
Figure 3 shows the breakdown of productivity distribution by gender, field, and subfield. The field of AI and its subfields show the highest average productivity (and highest outliers, for men), while software engineering, programming languages, and CS education exhibit the lowest average papers per author. In terms of gender, the largest differences in productivity exhibit in the subfield of theoretical CS (difference in means = 0.8; , ), followed by machine learning ( = 0.62; , ), benchmarking ( = 0.59; , ), HPC ( = 0.53; , ), AI ( = 0.48; , ), and security ( = 0.42; , ). A few subfields show a small productivity advantage for women, such as programming languages ( = −0.04; , ), but none are statistically significant.
3.3. RQ3: Are Productivity Differences Affected by Collaboration Size?
Comparing raw productivity across subfields in this way can be misleading, because the typical collaboration size is also related to productivity, but varies by subfield. For example, if in some subfield the typical number of authors per papers is larger than another field, we might also expect that each author’s name would show up in more papers under otherwise equal assumptions. We therefore also look at the “fractional count“ of publications instead, dividing each authorship event by the number of authors on the paper [14].
Overall, men average a total of 0.54 fractional papers per author, compared to women’s 0.44, which is statistically significant (, ).
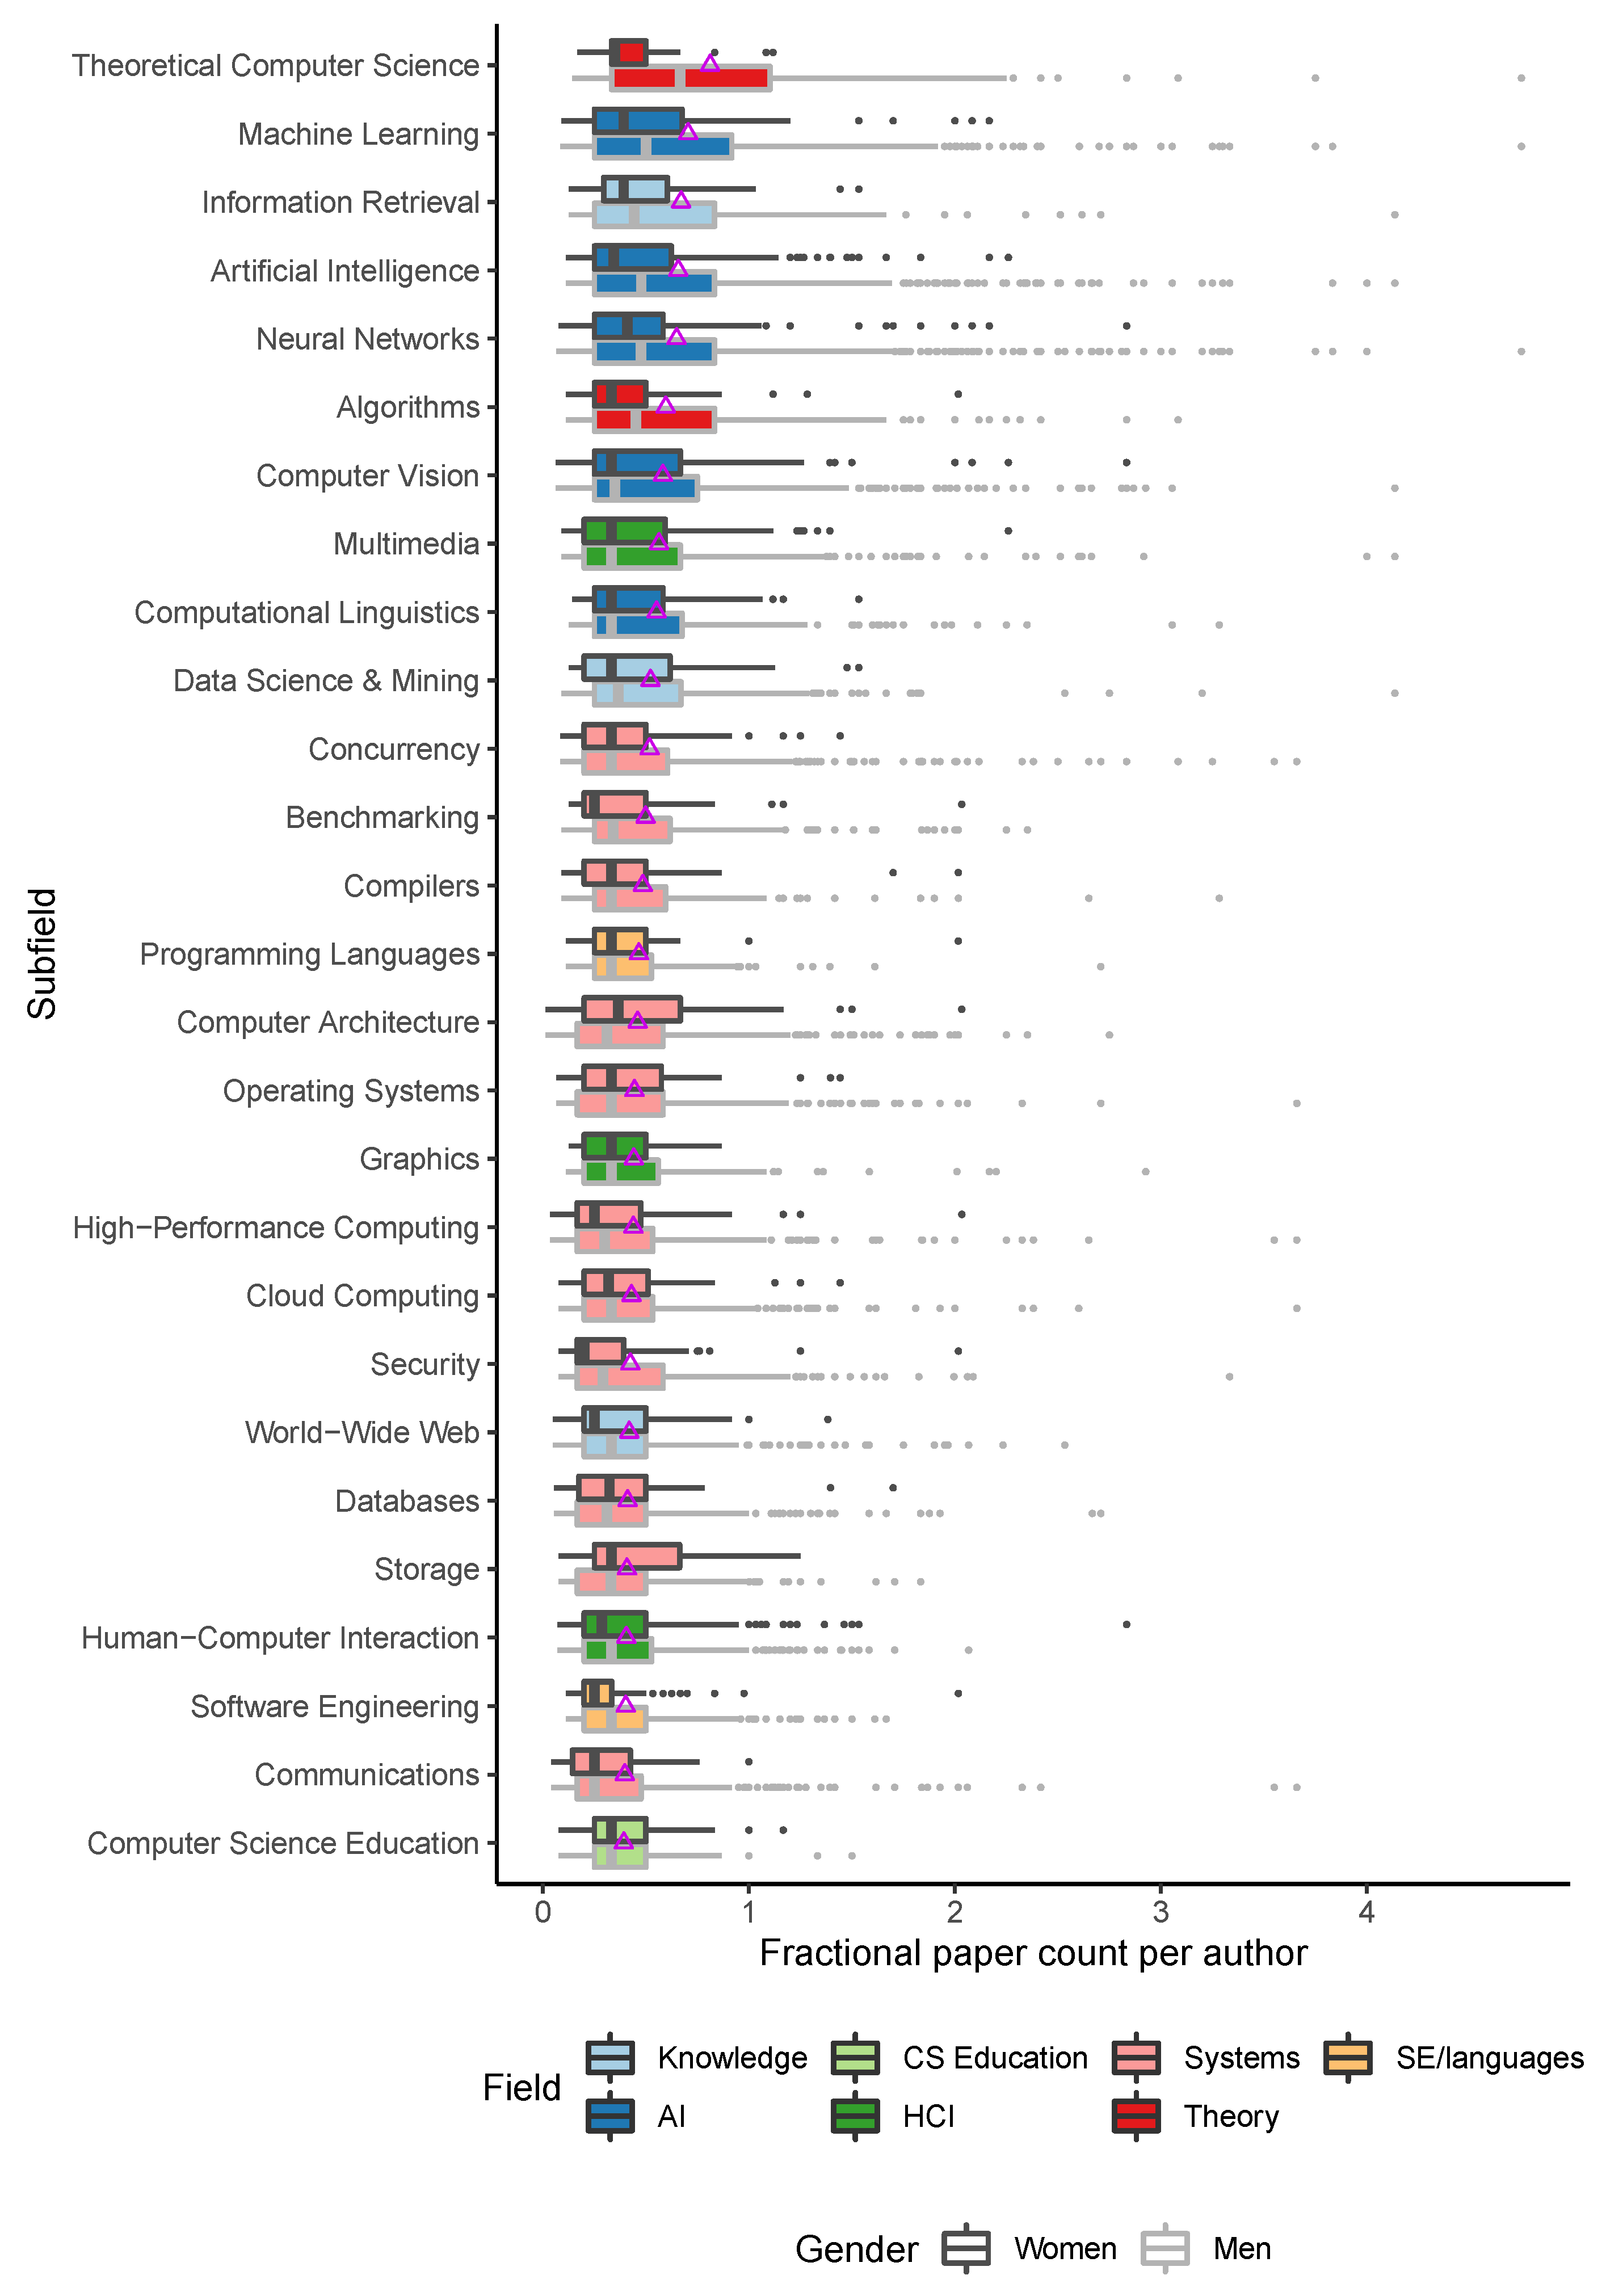
This normalized productivity metric exhibits on the one hand smaller differences across fields, but on the other, larger differences across genders (Figure 4). The medians for men’s fractional productivity appear noticeably higher in most subfields, and men exhibit much larger and more numerous outliers on the prolific tail of the spectrum. However, fractional productivity does not appear to affect the relative rankings of subfields very much. Of the fields that are more affected by this metric, the most notable perhaps is theoretical CS, which now exhibits the highest mean fractional productivity.
The modified productivity metric also segues into the next three research questions that examine in depth the differences in collaboration sizes in CS.
3.4. RQ4: Do Women Collaborate with Fewer People Than Men?
This question could be addressed by two distinct measures: the mean number of coauthors per paper and the size of the total coauthor network for each author.
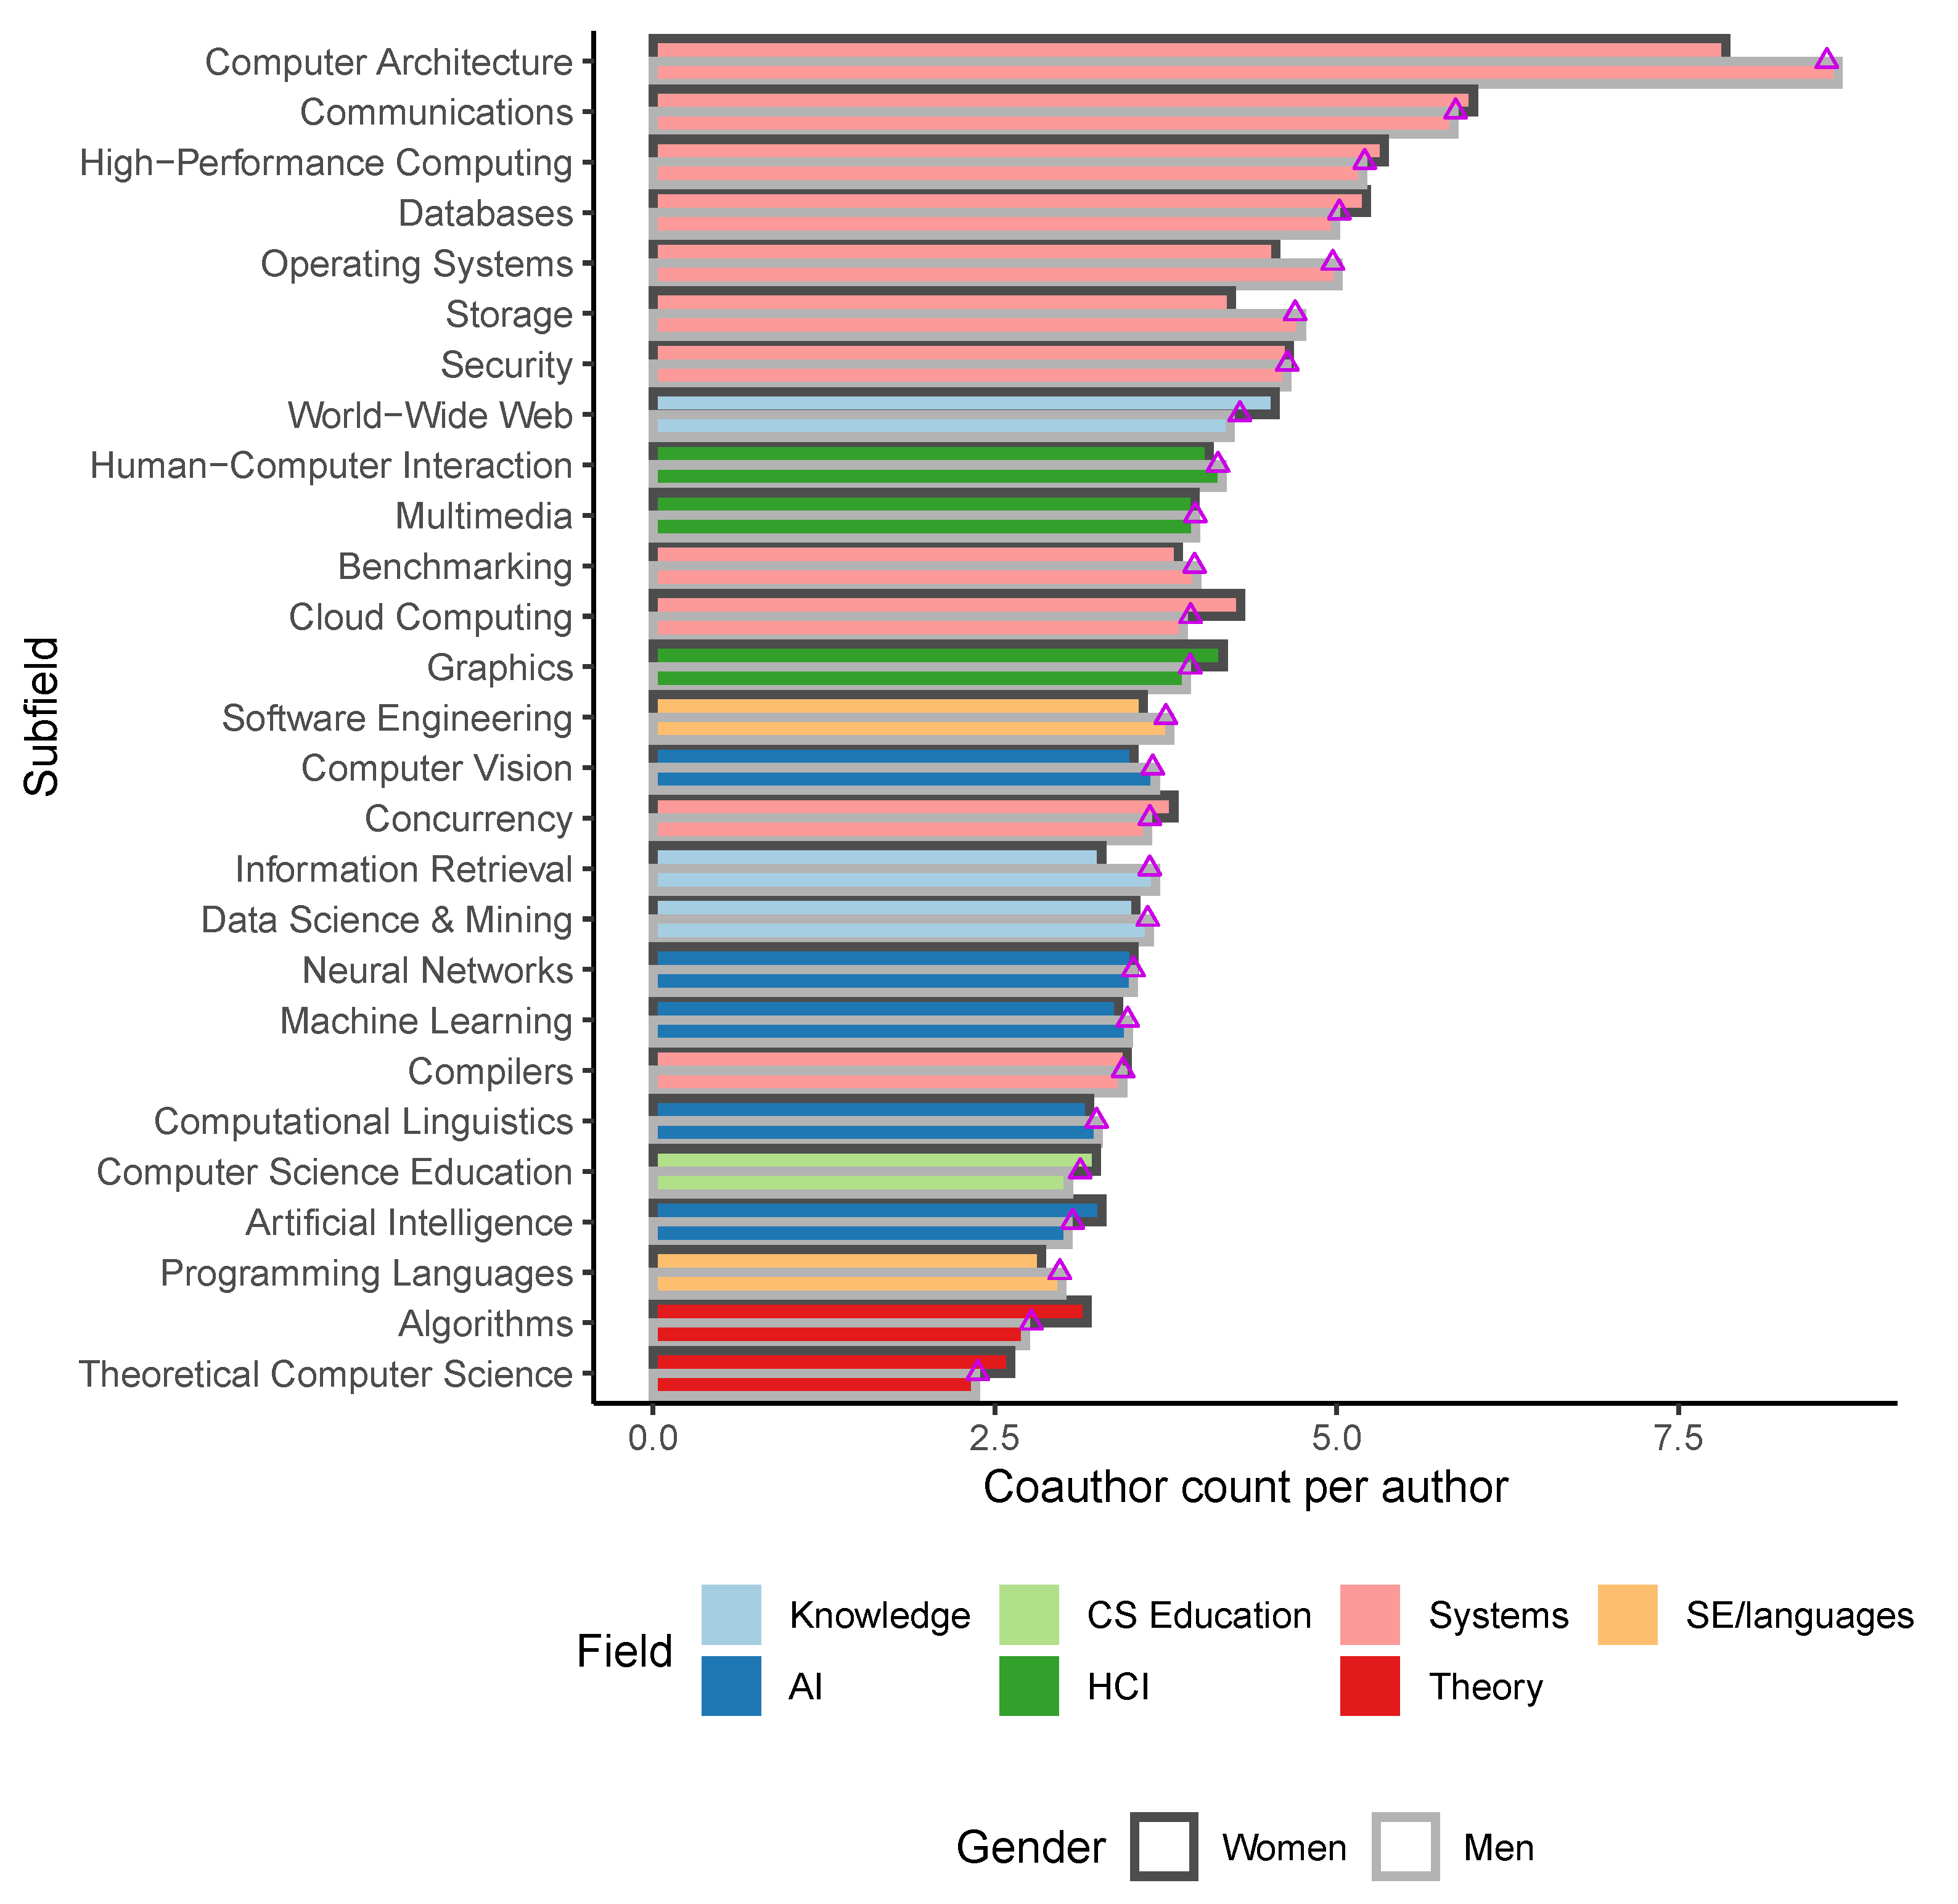
Women in our dataset average 4.03 coauthors per paper, while men average 4.11 (, ). This metric appears to show no significant differences in the aggregate. Breaking it down by field (Figure 5) shows that the gender differences still remain minimal throughout almost all of CS. The largest differences appear in the subfields of computer architecture (, ) and operating systems (, ). In general, the field of computer systems stands out with an average gender gap of 0.09 fewer coauthors for women than for men (, ).
The second measure is how many distinct authors each person collaborates with across all of their papers—in other words, the size of the network of all collaborators of a person. This time, the difference is more pronounced, with women averaging 4.99 total cohort size, while men average 5.49 (, ). Unfortunately, this metric cannot be neatly broken down by fields, because coauthor networks often include authors that span more than one field.
Overall, men exhibit slightly higher collaboration metrics than women (more coauthors per paper and more coauthors overall), but not dramatically so.
3.5. RQ5: Do Women Publish Fewer Single-Author Papers?
Next, we turn our attention to single-author papers (Table 3). In our dataset, there is a total of 232 such papers, of which 18 were written by a woman, 209 by a man, and the rest unknown. The ratio of women among single authors with known gender is 7.9%, which is significantly lower than that of the overall 14.1% FAR (, ).
Another way to look at the same data is from the perspective of papers instead of authors. As the data in Table 3 shows, in most CS subfields fewer than 5% of papers were written by a single author, adding up to only 232 papers. (Contrast this, for example, with astronomy, physics, and biology, where the rates of single-author papers average over 10% [47]).
Breaking down the data by gender offers little information because the numbers of single-author papers per subfield are too small for statistical significance. In fact, the numbers of single-author papers are so low, as is the number of women authors overall, that their intersection is actually empty for most subfields. That said, women published relatively fewer single-author papers than men (by percentage) in all but three of the subfields: WWW, data science, and storage. In all three, the numbers are simply too small to draw any conclusive inferences.
It is also worth noting that in much of the systems field the percentage of single-author papers is extremely low. This observation may be another indication that the systems field in particular depends on larger collaboration teams for published research. We suspect that the field’s emphasis on complex implementations and experimental platforms requires larger teams to pull off, which we address in the next research question.
3.6. RQ6: Are Team Sizes Larger in More Experimental Subfields?
The data we collected on coauthorship size and single-authorship shows that authorship norms vary significantly by field, if not by gender. The largest coauthorship groups appear in computer systems papers, averaging 6.09 coauthors per paper, followed by HCI (5.06), knowledge systems (4.89), software engineering and programming languages (4.65), AI (4.42), CS education (4.12), and finally theory (3.59).
These data do appear to confirm the hypothesis that experimental fields generally require larger teams to design, engineer, implement, and measure research results. For example, research in computer architecture, the most collaborative of our subfields, often requires large investments in effort (and often, in capital as well). This characterization extends to most computer systems subfields that occupy the top spots in terms of collaboration sizes. It appears indeed that the larger effort and resource requirement is associated with larger collaborations, as expressed in mean number of coauthors.
On the opposite end, research in computer theory requires virtually no equipment and is often carried out by individuals, as we have previously observed. The characteristics of theory research are naturally very similar to those of mathematicians as a whole, so it is perhaps not surprising that the mean number of coauthors we found for theory is nearly identical to the one found for mathematics [25].
3.7. RQ7: Do Authors Exhibit Gender Homphily?
For our last research question, we follow the approach of Wang et al. to estimate whether authors collaborate with coauthors of the same gender at rates higher than expected [11]. For this computation, we look at every pairing of coauthors as one coauthoring event (omitting single-author papers), and ask whether same-gender pairings occur at a higher frequency than we would observe from a random pairing. A random pairing is expected to follow the same overall statistics for gender distribution, i.e., the expected probability of any (co)author to be a woman should be the same as the overall FAR.
As Wang’s study has also found, our data suggest that for CS, authors—especially women—are actually more likely to collaborate with coauthors of the same gender. Overall, the probability of a woman’s coauthor to be a woman in our dataset is 21.2%, nearly ten percentage points above the overall FAR. For men, the probability to collaborate with a woman is 12.3%, slightly below the overall FAR.
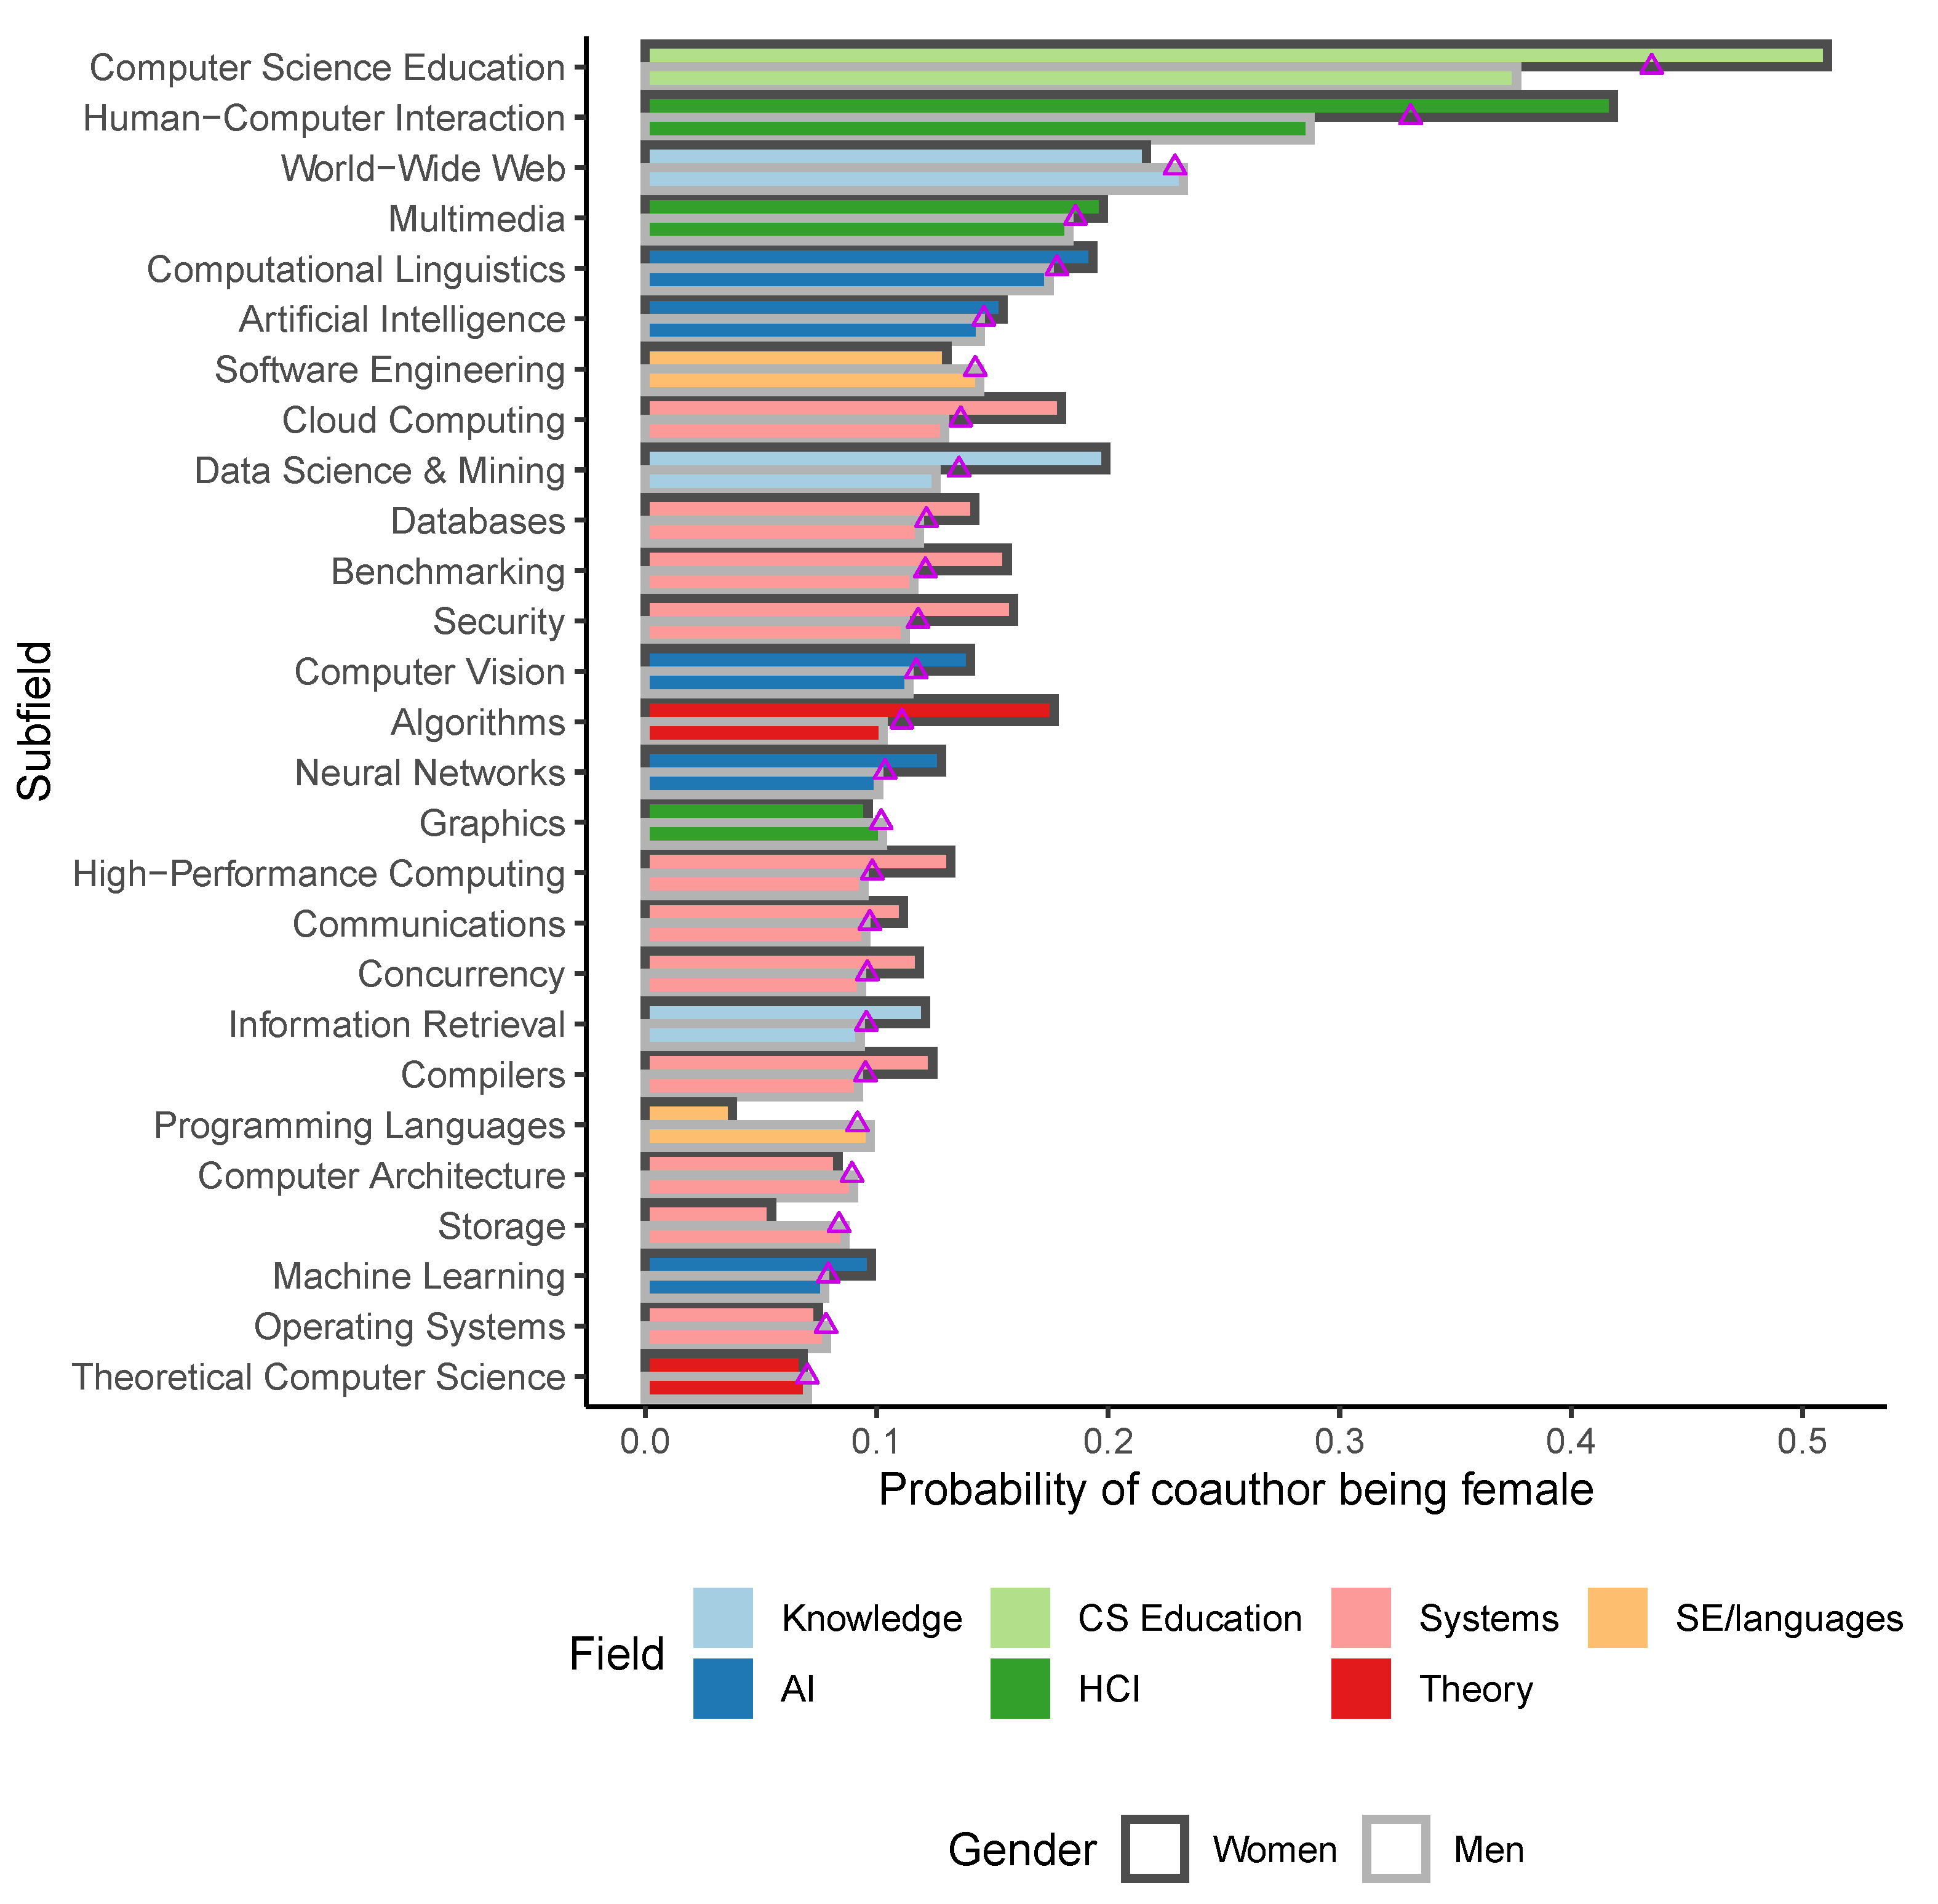
We can also break down these probabilities by subfield (Figure 6). As a generalization, most subfields exhibit gender homophily, especially in the two subfields with the highest FAR (CS education and HCI). A few subfields exhibit gender heterophily, but typically very little. A curious exception is the subfield of programming languages, where women only have a probability of 3.8% to collaborate with a woman, less than half the overall FAR for the field. Together with the subfield of software engineering, this field appears to show consistent heterophily among its female authors.
All other fields show fairly consistent gender homophily to varying degrees. For example, in the large field of computer systems, women have a probability of 12.3% to collaborate with a woman, above the FAR. In all cases, the more pronounced deviations from the expected probability are for women, suggesting that perhaps collaborating with same-gender authors is more important to women. Note, however, that since most authors are men and therefore overall FAR is mostly determined by men, we would expect men’s deviations from FAR to be smaller than women’s.
4. Discussion
In this section, we dive deeper into the data by exploring the relationships between the different measurements and metrics across subfields, summarized in Table 4. Our goal is to see whether the variations in any of the separate metrics we collected can help explain higher—or lower—values of FAR in the field, possibly providing hints to causal relationships.
The first relationship we investigate is between productivity and FAR. In other words, can the higher observed productivity of men explain why we observe so many more male authors than female authors?
The answer appears to be “mostly not.“ Obviously, the observation that men publish more than women implies that we would find more names of men on papers than we would of women, leading to lower FAR. When aggregating the data on a subfield basis we do indeed find a moderate negative correlation between a subfield’s FAR and the mean productivity of its practitioners (, ). This correlation weakens when using fractional paper counts, (, ), since the slightly larger team sizes for men attenuate their productivity advantage. Some subfields show no apparent relationship between FAR and productivity, like storage and machine learning, which have very similar FARs but very dissimilar productivity gaps. Other subfields exhibit a stronger opposite relationship, like HCI and compilers, with similar productivity metrics but very dissimilar FARs.
Overall, the relatively modest advantage in productivity for men (21.81% more papers per author) does not translate directly to the nearly 9:1 ratio of male-to-female authorship. In fact, if we ignore repeated publications altogether and look simply at the ratio of unique women among all unique authors, we still observe a ratio of 15.3% women overall. While this ratio represents a slight improvement of one percentage point over the non-unique FAR, it is still far from parity, suggesting that higher productivity alone cannot fully explain the gender gap.
We can extend this analysis of correlation with FAR to three other research questions we asked: collaboration size, single-author counts, and gender homophily.
A hypothetical relationship between FAR and the typical collaboration size in a subfield can also be easily refuted with counterexamples. Consider the subfields of algorithms and architecture. Although their FAR values are nearly identical, they are on extreme ends of the average team sizes. The overall correlation between the two metrics is indeed negative, but too close to zero for significance. (, ).
From the related perspective of single-author papers, a similar hypothesis would be that subfields with more single-author papers would have lower FAR because single-author papers have an even lower FAR than the overall sample population. However, the small number of single-author papers and their minuscule weight in computing FAR present a statistical obstacle to testing this hypothesis. As a matter of fact, our data shows a positive but nonsignificant correlation between the two (, ), so we must reject this hypothesis as well.
Our last metric for comparison is gender homophily. The method we previously used to measure homophily, deviation from the expectation (FAR), produces two measures per field, one for men and one for women. We focus on the latter because the deviation from FAR for men is nearly negligible, owing to the high ratio of men in the data. We therefore look at “women’s homophily”, defined as the ratio between a subfield’s probability for a woman to coauthor with a woman and its FAR. This variable too appears uncorrelated with FAR (, ). This finding is explained by the already low statistical probability of a woman (or anyone) to collaborate with a woman.
This high skew towards men also means we cannot use standardized metrics for homophily such as Krackhardt’s Index [48], defined simply as (where represents all the same-gender pairings in our dataset and all other pairings). In our data, this metric is strongly correlated with a subfield’s FAR (, ), to the point of adding no valuable information. This finding also makes sense: if there are very few women in a field, most coauthor pairings will be internal male–male, all other things being equal. The upshot here is that homophily measures appear to be much more the result of a skewed FAR than its cause. In other words, gender homophily appears to have little role in explaining variations in FAR, at least when it deviates significantly from 50% as it does in our dataset.
In summary, none of the collaboration metrics we collected in the various research questions can produce a satisfactory explanation for FAR in a given subfield. For productivity (RQ2, RQ3), the correlation we found can only explain a small fraction of the large gender gap. For team sizes (RQ4, RQ5, RQ6) we found no correlation with FAR. For gender homophily (RQ7), the strong correlation suggests, if anything, an opposite-direction causal relationship, i.e., low FAR causing high homophily, and not the other way around.
Despite these negative results, we can still draw some interesting general observations on specific CS fields. One such example is theoretical computer science, which shows extreme values in many of the metrics we collected. Not only does it exhibit the lowest FAR, but also the lowest average team size, the highest single-author ratio, and the highest fractional productivity. In these metrics it matches the observations of Mihaljevic for mathematicians, which is not surprising, given the thematic similarity of the two fields [25]. Theoretical CS is an extreme point by almost all metrics and resembles closely what has been found for mathematics. It is a broad and foundational subfield of CS but also exhibits different characteristics from the rest of CS in some of its aspects, including the collaboration aspects discussed in this paper.
Another example is the field of systems, which also generally exhibits very low FAR. Systems is a large and influential field, with many industrial and technological applications [41]. It is therefore particularly of interest to try to explain and reduce the gender gap, as this could have far-reaching societal impact [2]. As discussed in RQ6, one possible explanation for the magnitude of the gender gap is the high cost in participation in experimental fields such as systems, which has been associated with higher gender disparity [34]. It is also possible that the combination of larger team sizes, fewer single-author papers, and stronger gender homophily makes systems a particularly unwelcoming field because of self-reinforcing network effects [49]. Teams are large but mostly male, which discourages women seeking female collaborators from participating, which in turn could drive more women away from the field, further exacerbating the challenge of finding female collaborators for the next woman to join the field.
It has also been suggested that women are more likely to work in human-centered fields [50,51,52]. We can certainly observe corroboration of this hypothesis in our data, with CS education and HCI as the two fields with the highest FAR, followed by WWW and multimedia, which also put the human in the center of the research. Our FAR figure for CS education is in fact remarkably similar to the one found by West et al. for the field of education as a whole [33].
5. Conclusions and Future Work
Computer science is a collaborative discipline. Many papers exhibit larger team sizes than is typical in most other scientific disciplines, and very few papers are written by single authors. Understanding collaboration patterns in CS authorship is therefore imperative to understanding related bibliometric and societal phenomena, such as the gender gap in CS. However, research in CS is also highly heterogeneous across fields and subfields. Although a number of papers have studied collaboration patterns in CS and the sciences, and even more have studied the gender gap, this study may be the first to examine the two at a finer resolution of CS subfields, and with highly accurate gender data.
Because subfields vary so much by their representation of female researchers—varying from 6% to 42%—we can examine how these variations relate to different collaboration metrics, especially in the extremes. Our findings do confirm that some collaboration patterns appear indeed to be associated with the gender gap in each subfield. Fields that exhibit lower FAR than average also tend to exhibit larger team sizes, smaller cohort sizes for women, higher gender homophily, and higher author productivity. Additionally, although we found a significant productivity gap across genders, as has been measured in many other fields, it is too small to explain most of the overall gender gap across fields.
All of these associations have exceptions, and perhaps the most notable is the subfield of theoretical CS, which stands alone in the extreme of most metrics, perhaps because of the foundational, mathematical nature of theoretical CS, in contrast to many applied subfields of CS. On the opposite end, CS subfields that have increased focus on people rather than computers, such as CS education and HCI, show better overall representation of women and less extreme gaps across most metrics. On the other hand, many of the subfields of computer systems, which focuses on building, measuring, and improving the concrete implementation of computers and their tools, show larger gender gaps across most metrics.
This last field of computer systems is of particular interest to us and the focus of our future work, because of its large size, its impact on technology and the economy, and its very low representation of women, at about 10%. We will therefore turn our attention next not just to statistical association with low FAR, but to causal association. We plan to collect and analyze additional data to try to address the question: why is the representation of women in computer systems lower than in most other CS fields? We have already presented a few hypotheses for this question in this article: the low representation could be partially explained by the higher cost of research in the field and the network effects that perpetuate the lack of female peers and mentors. These hypotheses require additional data before we can accept or reject them.
This dataset currently exposes facts and factors from a single year, 2017. It could also be instructive to follow up on this study with data collected from later years to observe any trends and changes in collaboration patterns and representation of women. Additional future work can leverage the dataset we collected to dive deeper into the analysis of collaboration patterns, using tools such as social network analysis, degree centrality, citation networks, and information diffusion.
Author Contributions
J.Y. collected most of the gender data, performed experiments and analyses, and edited the paper; E.F. conceived and designed the experiments, performed experiments and analysis, and wrote the paper. All authors have read and agreed to the published version of the manuscript.
Funding
Funding for this work was generously provided by the Reed College Social Justice Research and Education Fund.
Institutional Review Board Statement
This study was exempted from the informed consent requirement under Exempt Category 4: the use of secondary data by Reed College’s Institutional Review Board (No. 2021-S26).
Informed Consent Statement
The data collected for this study was sourced from public-use datasets such as conference and academic web pages. The informed consent requirement was waived for this secondary analysis.
Data Availability Statement
All of the code and data for this article are publicly available at https://github.com/eitanf/sysconf (accessed on 15 February 2022) [53].
Acknowledgments
We gratefully acknowledge the assistance of Alexis Richter, Josh Reiss, and Rhody Kaner in collecting some of the gender data for this study. Some of these students have been supported by grants from the Reed Social Justice Research and Education Fund.
Conflicts of Interest
The authors declare no conflict of interest.
Abbreviations
The following abbreviations are used in this manuscript:
| AI | Artificial Intelligence |
| CL | Computational Linguistics |
| CS | Computer Science |
| DS | Data Science |
| FAR | Female Author Ratio |
| HCI | Human–Computer Interface |
| HPC | High-Performance Computing |
| IR | Information Retrieval |
| OS | Operating Systems |
| SE | Software Engineering |
| STEM | Science, Technology, Engineering, and Mathematics |
| WWW | World-Wide Web |
References
- Falkner, K.; Szabo, C.; Michell, D.; Szorenyi, A.; Thyer, S. Gender gap in academia: Perceptions of female computer science academics. In Proceedings of the 2015 ACM Conference on Innovation and Technology in Computer Science Education, New York, NY, USA, 3–5 July 2015; pp. 111–116. [Google Scholar]
- Nielsen, M.W.; Alegria, S.; Börjeson, L.; Etzkowitz, H.; Falk-Krzesinski, H.J.; Joshi, A.; Leahey, E.; Smith-Doerr, L.; Woolley, A.W.; Schiebinger, L. Opinion: Gender diversity leads to better science. Proc. Natl. Acad. Sci. USA 2017, 114, 1740–1742. [Google Scholar] [CrossRef] [Green Version]
- Mattis, M.C. Upstream and downstream in the engineering pipeline: What’s blocking US women from pursuing engineering careers. In Women and Minorities in Science, Technology, Engineering and Mathematics: Upping the Numbers; Burke, R.J., Mattis, M.C., Eds.; Edward Elgar Publishing: Cheltenham, UK, 2007; pp. 334–362. [Google Scholar] [CrossRef]
- Vitores, A.; Gil-Juárez, A. The trouble with ‘women in computing’: A critical examination of the deployment of research on the gender gap in computer science. J. Gend. Stud. 2016, 25, 666–680. [Google Scholar] [CrossRef]
- Charman-Anderson, S.; Kane, L.; Meadows, A. Championing the success of women in science, technology, engineering, maths, and medicine: A collection of thought pieces from members of the academic community. VOCED Digit. Sci. 2017, 10. [Google Scholar] [CrossRef]
- Cohoon, J.M.; Nigai, S.; Kaye, J. Gender and Computing Conference Papers. Commun. ACM 2011, 54, 72–80. [Google Scholar] [CrossRef]
- Holman, L.; Stuart-Fox, D.; Hauser, C.E. The gender gap in science: How long until women are equally represented? PLoS Biol. 2018, 16, e2004956. [Google Scholar] [CrossRef] [Green Version]
- National Science Board (US). The State of US; Science and Engineering: Alexandria, VA, USA, 2020. [Google Scholar]
- Way, S.F.; Larremore, D.B.; Clauset, A. Gender, productivity, and prestige in computer science faculty hiring networks. In Proceedings of the 25th International Conference on World Wide Web, Montreal, QC, Canada, 11–15 April 2016; pp. 1169–1179. [Google Scholar] [CrossRef] [Green Version]
- Zweben, S.; Bizot, B. 2017 CRA Taulbee Survey. Comput. Res. News 2018, 30. [Google Scholar]
- Wang, L.L.; Stanovsky, G.; Weihs, L.; Etzioni, O. Gender Trends in Computer Science Authorship. Commun. ACM 2021, 64, 78–84. [Google Scholar] [CrossRef]
- Avolio, B.; Chavez, J.; Vilchez-Roman, C. Factors that contribute to the underrepresentation of women in science careers worldwide: A literature review. Soc. Psychol. Educ. 2020, 23, 773–794. [Google Scholar] [CrossRef]
- Whittington, K.B. A tie is a tie? Gender and network positioning in life science inventor collaboration. Res. Policy 2018, 47, 511–526. [Google Scholar] [CrossRef]
- Lee, S.; Bozeman, B. The impact of research collaboration on scientific productivity. Soc. Stud. Sci. 2005, 35, 673–702. [Google Scholar] [CrossRef]
- Bozeman, B.; Corley, E. Scientists’ collaboration strategies: Implications for scientific and technical human capital. Res. Policy 2004, 33, 599–616. [Google Scholar] [CrossRef]
- Hunter, L.; Leahey, E. Collaborative research in sociology: Trends and contributing factors. Am. Sociol. 2008, 39, 290–306. [Google Scholar] [CrossRef]
- Kyvik, S.; Teigen, M. Child care, research collaboration, and gender differences in scientific productivity. Sci. Technol. Hum. Values 1996, 21, 54–71. [Google Scholar] [CrossRef]
- Scott, J. Disadvantage of women by the ordinary processes of science: The case of informal collaboration. Despite Odds Essays Can. Women Sci. 1990, 57, 316–328. [Google Scholar] [CrossRef]
- Zeng, X.H.T.; Duch, J.; Sales-Pardo, M.; Moreira, J.A.; Radicchi, F.; Ribeiro, H.V.; Woodruff, T.K.; Nunes Amaral, L.A. Differences in collaboration patterns across discipline, career stage, and gender. PLoS Biol. 2016, 14, e1002573. [Google Scholar] [CrossRef] [Green Version]
- Abramo, G.; D’Angelo, C.; Caprasecca, A. Gender differences in research productivity: A bibliometric analysis of the Italian academic system. Scientometrics 2009, 79, 517–539. [Google Scholar] [CrossRef] [Green Version]
- Huang, J.; Gates, A.J.; Sinatra, R.; Barabasi, A.L. Historical comparison of gender inequality in scientific careers across countries and disciplines. Proc. Natl. Acad. Sci. USA 2020, 117, 4609–4616. [Google Scholar] [CrossRef] [Green Version]
- Larivière, V.; Ni, C.; Gingras, Y.; Cronin, B.; Sugimoto, C.R. Bibliometrics: Global gender disparities in science. Nat. News 2013, 504, 211. [Google Scholar] [CrossRef]
- Symonds, M.R.; Gemmell, N.J.; Braisher, T.L.; Gorringe, K.L.; Elgar, M.A. Gender differences in publication output: Towards an unbiased metric of research performance. PLoS ONE 2006, 1, e127. [Google Scholar] [CrossRef] [Green Version]
- Schucan Bird, K. Do women publish fewer journal articles than men? Sex differences in publication productivity in the social sciences. Br. J. Sociol. Educ. 2011, 32, 921–937. [Google Scholar] [CrossRef]
- Mihaljevic-Brandt, H.; Santamaria, L.; Tullney, M. The effect of gender in the publication patterns in mathematics. PLoS ONE 2016, 11, e0165367. [Google Scholar] [CrossRef] [Green Version]
- Sarsons, H. Recognition for group work: Gender differences in academia. Am. Econ. Rev. 2017, 107, 141–145. [Google Scholar] [CrossRef]
- Jadidi, M.; Karimi, F.; Lietz, H.; Wagner, C. Gender disparities in science? Dropout, productivity, collaborations and success of male and female computer scientists. Adv. Complex Syst. 2018, 21, 1750011. [Google Scholar] [CrossRef]
- Ghiasi, G.; Larivière, V.; Sugimoto, C.R. On the compliance of women engineers with a gendered scientific system. PLoS ONE 2015, 10, e0145931. [Google Scholar] [CrossRef] [PubMed]
- Tovanich, N.; Dragicevic, P.; Isenberg, P. Gender in 30 Years of IEEE Visualization. IEEE Trans. Vis. Comput. Graph. 2021, 28, 497–507. [Google Scholar] [CrossRef] [PubMed]
- Frachtenberg, E.; Kaner, R. Representation of women in HPC conferences. In Proceedings of the International Conference for High Performance Computing, Networking, Storage, and Analysis (SC’21), St. Louis, MI, USA, 14–19 November 2021. [Google Scholar] [CrossRef]
- Bozeman, B.; Gaughan, M. How do men and women differ in research collaborations? An analysis of the collaborative motives and strategies of academic researchers. Res. Policy 2011, 40, 1393–1402. [Google Scholar] [CrossRef]
- Hengel, E. Publishing while Female. Are women held to higher standards? Evidence from peer review. Camb. Work. Pap. Econ. 2017. [Google Scholar] [CrossRef]
- West, J.D.; Jacquet, J.; King, M.M.; Correll, S.J.; Bergstrom, C.T. The role of gender in scholarly authorship. PloS ONE 2013, 8, e66212. [Google Scholar] [CrossRef] [Green Version]
- Duch, J.; Zeng, X.H.T.; Sales-Pardo, M.; Radicchi, F.; Otis, S.; Woodruff, T.K.; Nunes Amaral, L.A. The possible role of resource requirements and academic career-choice risk on gender differences in publication rate and impact. PLoS ONE 2012, 7, e51332. [Google Scholar] [CrossRef] [Green Version]
- Falk-Krzesinski, H.J.; Herbert, R.; Huggett, S.; Tobin, S. Gender in the Global Research Landscape; Elsevier: Amsterdam, The Netherlands, 2017. [Google Scholar]
- Head, M.G.; Fitchett, J.R.; Cooke, M.K.; Wurie, F.B.; Atun, R. Differences in research funding for women scientists: A systematic comparison of UK investments in global infectious disease research during 1997–2010. BMJ Open 2013, 3, e003362. [Google Scholar] [CrossRef] [Green Version]
- Frachtenberg, E.; Kaner, R.D. Underrepresentation of women in computer systems research. arXiv 2022, arXiv:2201.01757. [Google Scholar]
- Patterson, D.A.; Snyder, L.; Ullman, J. Evaluating Computer Scientists and Engineers For Promotion and Tenure. Comput. Res. News 1999. [Google Scholar]
- Patterson, D.A. The health of research conferences and the dearth of big idea papers. Commun. ACM 2004, 47, 23–24. [Google Scholar] [CrossRef]
- Vrettas, G.; Sanderson, M. Conferences versus journals in computer science. J. Assoc. Inf. Sci. Technol. 2015, 66, 2674–2684. [Google Scholar] [CrossRef]
- Frachtenberg, E.; Koster, N. A Survey of Accepted Authors in Computer Systems Conferences. PeerJ Comput. Sci. 2020, 6, e299. [Google Scholar] [CrossRef]
- Karimi, F.; Wagner, C.; Lemmerich, F.; Jadidi, M.; Strohmaier, M. Inferring gender from names on the web: A comparative evaluation of gender detection methods. In Proceedings of the 25th International Conference Companion on World Wide Web, Montreal, QC, Canada, 11–15 April 2016; International World Wide Web Conferences Steering Committee: Geneva, Switzerland, 11–15 April 2016; pp. 53–54. [Google Scholar] [CrossRef] [Green Version]
- Mattauch, S.; Lohmann, K.; Hannig, F.; Lohmann, D.; Teich, J. A Bibliometric Approach for Detecting the Gender Gap in Computer Science. Commun. ACM 2020, 63, 74–80. [Google Scholar] [CrossRef]
- Santamaria, L.; Mihaljevic, H. Comparison and benchmark of name-to-gender inference services. PeerJ Comput. Sci. 2018, 4, e156. [Google Scholar] [CrossRef] [Green Version]
- Squazzoni, F.; Bravo, G.; Dondio, P.; Farjam, M.; Marusic, A.; Mehmani, B.; Willis, M.; Birukou, A.; Grimaldo, F. No evidence of any systematic bias against manuscripts by women in the peer review process of 145 scholarly journals. SocarXiv. 2020. Available online: https://osf.io/preprints/socarxiv/gh4rv/ (accessed on 26 October 2021). [CrossRef] [Green Version]
- Bhagat, V. Data and Techniques Used for Analysis of Women Authorship in STEMM: A Review. Fem. Res. 2018, 2, 77–86. [Google Scholar] [CrossRef]
- Abt, H.A. The future of single-authored papers. Scientometrics 2007, 73, 353–358. [Google Scholar] [CrossRef]
- Krackhardt, D.; Stern, R.N. Informal networks and organizational crises: An experimental simulation. Soc. Psychol. Q. 1988, 51, 123–140. [Google Scholar] [CrossRef]
- Araújo, T.; Fontainha, E. The specific shapes of gender imbalance in scientific authorships: A network approach. J. Inf. 2017, 11, 88–102. [Google Scholar] [CrossRef] [Green Version]
- Diekman, A.B.; Steinberg, M. Navigating social roles in pursuit of important goals: A communal goal congruity account of STEM pursuits. Soc. Personal. Psychol. Compass 2013, 7, 487–501. [Google Scholar] [CrossRef]
- Fisher, A.; Margolis, J. Unlocking the Clubhouse: The Carnegie Mellon Experience. SIGCSE Bull. 2002, 34, 79–83. [Google Scholar] [CrossRef]
- Sax, L.J.; Newhouse, K.N.S. Disciplinary Field Specificity and Variation in the STEM Gender Gap. New Dir. Institutional Res. 2018, 179, 45–71. [Google Scholar] [CrossRef]
- Frachtenberg, E. Systems Conferences Analysis Dataset. 2021. Available online: https://zenodo.org/record/5590575#.Yhb6-pYRWUk (accessed on 15 February 2022).
Figure 1.
Female author ratio by subfield.

Figure 2.
Distribution of number of distinct papers per author.

Figure 3.
Distribution of number of distinct papers per author by gender, field, and subfield. Each boxplot shows the interquartile range (25–75th percentiles) in the filled box area, with veritcal notches denoting medians. The horizontal lines to the right represent the 75–95th percentile range. Dots further to the right denote outlier points above the 95th percentile. The top boxplot for each subfield shows the distribution for women, followed by the distribution for men. Triangles represent median values for both genders, which is used for sorting order.

Figure 4.
Distribution of fractional paper counts per author by gender, field, and subfield. Each boxplot shows the interquartile range (25–75th percentiles) in the filled box area, eith vertical notches denoting medians. The horizontal lines represent the 5–25th percentile range on the left and the 75–95th percentile range to the right. Dots further to the right denote outlier points above the 95th percentile. The top boxplot for each subfield shows the distribution for women, followed by the distribution for women. Triangles represent median values for both genders, which is used for sorting order.

Figure 5.
Mean number of coauthors per person by gender and subfield. Triangles denote overall mean for subfield (for both genders), which is used for sorting order.
Figure 5.
Mean number of coauthors per person by gender and subfield. Triangles denote overall mean for subfield (for both genders), which is used for sorting order.

Figure 6.
Probability of an author to coauthor with a woman (triangles denote overall probability for subfield, which is similar to FAR but excludes single authors). Women (top bars) show gender homophily when their probability to coauthor with a woman is higher than the overall probability, and men exhibit homophily when their probability is lower than the overall’s.


Table 1.
All conferences, ordered by subfield and acceptance rate.
| Conference | Subfield | Papers | Authors | Acceptance |
|---|---|---|---|---|
| TACAS | Algorithms | 52 | 189 | 0.31 |
| SODA | Algorithms | 181 | 442 | 0.34 |
| AAAI | Artificial Intelligence | 599 | 1760 | 0.23 |
| ACL | Computational Linguistics | 195 | 610 | 0.26 |
| SIGCSE | Computer Science Education | 87 | 259 | 0.23 |
| ITICSE | Computer Science Education | 64 | 186 | 0.27 |
| CVPR | Computer Vision | 532 | 1702 | 0.2 |
| ICDM | Data Science and Mining | 72 | 269 | 0.09 |
| KDD | Data Science and Mining | 64 | 237 | 0.09 |
| WSDM | Data Science and Mining | 80 | 285 | 0.16 |
| SIGGRAPH | Graphics | 166 | 560 | 0.38 |
| CHI | Human–Computer Interaction | 599 | 2020 | 0.25 |
| ICML | Machine Learning | 434 | 1314 | 0.26 |
| MM | Multimedia | 225 | 821 | 0.33 |
| NIPS | Neural Networks | 679 | 2038 | 0.21 |
| POPL | Programming Languages | 64 | 190 | 0.23 |
| ICSE | Software Engineering | 96 | 360 | 0.23 |
| FSE | Software Engineering | 94 | 354 | 0.32 |
| STOC | Theoretical Computer Science | 103 | 263 | 0.24 |
| FOCS | Theoretical Computer Science | 90 | 219 | 0.28 |
| WWW | World-Wide Web | 170 | 614 | 0.18 |
| ISCA | Architecture | 54 | 295 | 0.17 |
| ASPLOS | Architecture | 56 | 247 | 0.18 |
| MICRO | Architecture | 61 | 306 | 0.19 |
| HPCA | Architecture | 50 | 215 | 0.22 |
| PACT | Architecture | 25 | 89 | 0.23 |
| SIGMETRICS | Benchmarking | 27 | 101 | 0.13 |
| IMC | Benchmarking | 28 | 124 | 0.16 |
| MASCOTS | Benchmarking | 20 | 75 | 0.24 |
| ISPASS | Benchmarking | 24 | 98 | 0.3 |
| ICPE | Benchmarking | 29 | 102 | 0.35 |
| IISWC | Benchmarking | 31 | 121 | 0.37 |
| CCGrid | Cloud Computing | 72 | 296 | 0.25 |
| CLOUD | Cloud Computing | 29 | 110 | 0.26 |
| HotCloud | Cloud Computing | 19 | 64 | 0.33 |
| SOCC | Cloud Computing | 45 | 195 | Unknown |
| PLDI | Compilers | 47 | 173 | 0.15 |
| OOPSLA | Compilers | 66 | 232 | 0.3 |
| SLE | Compilers | 24 | 68 | 0.42 |
| PPoPP | Concurrency | 29 | 122 | 0.22 |
| EuroSys | Concurrency | 41 | 169 | 0.22 |
| HiPC | Concurrency | 41 | 168 | 0.22 |
| IPDPS | Concurrency | 116 | 447 | 0.23 |
| SPAA | Concurrency | 31 | 84 | 0.24 |
| PODC | Concurrency | 38 | 101 | 0.25 |
| EuroPar | Concurrency | 50 | 179 | 0.28 |
| ICPP | Concurrency | 60 | 234 | 0.29 |
| SIGMOD | Databases | 96 | 335 | 0.2 |
| PODS | Databases | 29 | 91 | 0.29 |
| CIDR | Databases | 32 | 213 | 0.41 |
| IGSC | Energy | 23 | 83 | Unknown |
| HCW | Heterogeneous Computing | 7 | 27 | 0.47 |
| HPDC | High-Performance Computing | 19 | 76 | 0.19 |
| SC | High-Performance Computing | 61 | 325 | 0.19 |
| Cluster | High-Performance Computing | 65 | 273 | 0.3 |
| ISC | High-Performance Computing | 22 | 99 | 0.33 |
| HPCC | High-Performance Computing | 77 | 287 | 0.44 |
| SIGIR | Information Retrieval | 78 | 264 | 0.22 |
| SIGCOMM | Network | 36 | 216 | 0.14 |
| NSDI | Network | 42 | 203 | 0.16 |
| MobiCom | Network | 35 | 164 | 0.19 |
| CoNEXT | Network | 32 | 145 | 0.19 |
| HotI | Network | 13 | 44 | 0.33 |
| SOSP | Operating Systems | 39 | 217 | 0.17 |
| ICAC | Operating Systems | 14 | 46 | 0.19 |
| ATC | Operating Systems | 60 | 279 | 0.22 |
| Middleware | Operating Systems | 20 | 91 | 0.26 |
| HotOS | Operating Systems | 29 | 112 | 0.31 |
| SP | Security | 60 | 287 | 0.14 |
| NDSS | Security | 68 | 327 | 0.16 |
| CCS | Security | 151 | 589 | 0.18 |
| FAST | Storage | 27 | 119 | 0.23 |
| SYSTOR | Storage | 16 | 64 | 0.34 |
| HotStorage | Storage | 21 | 94 | 0.36 |
| VEE | Virtualization | 18 | 85 | 0.42 |
Table 2.
All CS subfields analyzed, arranged by fields.
| Subfield | Field |
|---|---|
| Artificial Intelligence | Artificial Intelligence (AI) |
| Computational Linguistics | Artificial Intelligence (AI) |
| Computer Vision | Artificial Intelligence (AI) |
| Machine Learning | Artificial Intelligence (AI) |
| Neural Networks | Artificial Intelligence (AI) |
| Graphics | Human–Computer Interaction (HCI) |
| Human–Computer Interaction | Human–Computer Interaction (HCI) |
| Multimedia | Human–Computer Interaction (HCI) |
| Programming Languages | Software Engineering and Programming Languages |
| Software Engineering | Software Engineering and Programming Languages |
| Data Science and Mining | Knowledge |
| Information Retrieval | Knowledge |
| World-Wide Web | Knowledge |
| Computer Science Education | CS Education |
| Computer Architecture | Systems |
| Communications | Systems |
| Operating Systems | Systems |
| Benchmarking | Systems |
| Cloud Computing | Systems |
| Compilers | Systems |
| Concurrency | Systems |
| Databases | Systems |
| High-Performance Computing | Systems |
| Security | Systems |
| Storage | Systems |
| Algorithms | Theory |
| Theoretical Computer Science | Theory |
Table 3.
Number of papers by subfield and gender, sorted by the overall percentage of single-author papers.
Table 3.
Number of papers by subfield and gender, sorted by the overall percentage of single-author papers.
| Subfield | Number of Papers | Percent Single | All Single Author | Women | Men | Unknown |
|---|---|---|---|---|---|---|
| Computer Science Education | 151 | 12.58% | 19 | 3 | 14 | 2 |
| Theoretical Computer Science | 193 | 12.44% | 24 | 0 | 24 | 0 |
| Programming Languages | 64 | 9.38% | 6 | 0 | 6 | 0 |
| Algorithms | 233 | 9.01% | 21 | 0 | 20 | 1 |
| World-Wide Web | 170 | 8.82% | 15 | 4 | 10 | 1 |
| Artificial Intelligence | 599 | 4.34% | 26 | 1 | 24 | 1 |
| Multimedia | 225 | 4% | 9 | 2 | 7 | 0 |
| Machine Learning | 434 | 3.92% | 17 | 1 | 16 | 0 |
| Compilers | 137 | 3.65% | 5 | 0 | 5 | 0 |
| Concurrency | 406 | 3.45% | 14 | 1 | 13 | 0 |
| Neural Networks | 679 | 3.24% | 22 | 0 | 22 | 0 |
| Benchmarking | 159 | 3.14% | 5 | 0 | 5 | 0 |
| Graphics | 166 | 2.41% | 4 | 0 | 4 | 0 |
| Data Science and Mining | 216 | 2.31% | 5 | 1 | 4 | 0 |
| Operating Systems | 180 | 2.22% | 4 | 0 | 4 | 0 |
| Human–Computer Interaction | 599 | 2.17% | 13 | 4 | 9 | 0 |
| Communications | 158 | 1.9% | 3 | 0 | 3 | 0 |
| High-Performance Computing | 244 | 1.64% | 4 | 0 | 4 | 0 |
| Storage | 64 | 1.56% | 1 | 1 | 0 | 0 |
| Computer Architecture | 276 | 1.45% | 4 | 0 | 4 | 0 |
| Information Retrieval | 78 | 1.28% | 1 | 0 | 1 | 0 |
| Computational Linguistics | 195 | 1.03% | 2 | 0 | 2 | 0 |
| Computer Vision | 532 | 0.75% | 4 | 0 | 4 | 0 |
| Security | 279 | 0.72% | 2 | 0 | 2 | 0 |
| Databases | 157 | 0.64% | 1 | 0 | 1 | 0 |
| Software Engineering | 190 | 0.53% | 1 | 0 | 1 | 0 |
| Cloud Computing | 165 | 0% | 0 | 0 | 0 | 0 |
| Total | 6949 | 3.34% | 232 | 18 | 209 | 5 |
Table 4.
Comparison of subfields by different gender metrics, ordered by FAR. Metrics include mean productivity (papers per author), fractional paper total, mean total coauthors (with repeats), ratio of papers written by a single author, and the ratio between a woman’s probability to coauthor with a woman and FAR.
| Subfield | FAR | Mean Productivity | Fractional Productivity | Mean Coauthors | Single-Author Ratio | Women’s Homophily |
|---|---|---|---|---|---|---|
| CS Education | 0.422 | 1.228 | 0.393 | 3.125 | 0.114 | 0.511 |
| HCI | 0.336 | 1.721 | 0.405 | 4.131 | 0.022 | 0.418 |
| World-Wide Web | 0.218 | 1.696 | 0.419 | 4.292 | 0.083 | 0.217 |
| Multimedia | 0.188 | 2.436 | 0.563 | 3.966 | 0.040 | 0.198 |
| CL | 0.182 | 2.090 | 0.552 | 3.244 | 0.010 | 0.194 |
| SE | 0.148 | 1.650 | 0.402 | 3.751 | 0.005 | 0.130 |
| AI | 0.139 | 2.420 | 0.657 | 3.068 | 0.042 | 0.155 |
| DS and Mining | 0.136 | 2.130 | 0.523 | 3.618 | 0.023 | 0.199 |
| Benchmarking | 0.127 | 2.194 | 0.498 | 3.960 | 0.031 | 0.156 |
| Cloud Computing | 0.124 | 1.817 | 0.430 | 3.932 | 0.000 | 0.180 |
| Computer Vision | 0.122 | 2.366 | 0.582 | 3.654 | 0.008 | 0.141 |
| Security | 0.117 | 1.976 | 0.424 | 4.639 | 0.007 | 0.159 |
| Databases | 0.116 | 1.684 | 0.411 | 5.019 | 0.006 | 0.143 |
| IR | 0.106 | 2.772 | 0.671 | 3.632 | 0.013 | 0.121 |
| Neural Networks | 0.104 | 2.428 | 0.649 | 3.513 | 0.032 | 0.128 |
| Architecture | 0.098 | 2.101 | 0.459 | 8.585 | 0.014 | 0.083 |
| Algorithms | 0.098 | 1.847 | 0.596 | 2.767 | 0.086 | 0.177 |
| HPC | 0.096 | 2.033 | 0.439 | 5.204 | 0.017 | 0.132 |
| Communications | 0.095 | 1.901 | 0.398 | 5.870 | 0.019 | 0.112 |
| Compilers | 0.095 | 1.755 | 0.485 | 3.437 | 0.036 | 0.124 |
| Graphics | 0.095 | 1.861 | 0.441 | 3.928 | 0.024 | 0.096 |
| PL | 0.095 | 1.593 | 0.466 | 2.975 | 0.094 | 0.038 |
| Concurrency | 0.092 | 2.058 | 0.518 | 3.634 | 0.034 | 0.119 |
| Storage | 0.091 | 1.846 | 0.408 | 4.696 | 0.016 | 0.055 |
| OS | 0.085 | 2.068 | 0.444 | 4.972 | 0.022 | 0.075 |
| Machine Learning | 0.081 | 2.599 | 0.705 | 3.471 | 0.039 | 0.098 |
| Theoretical CS | 0.064 | 2.303 | 0.812 | 2.375 | 0.124 | 0.068 |
| Overall mean | 0.141 | 2.078 | 0.519 | 5.109 | 0.036 | 0.156 |
| FAR correlation | 1.000 | −0.463 | −0.336 | −0.139 | 0.263 | 0.956 |
Publisher’s Note: MDPI stays neutral with regard to jurisdictional claims in published maps and institutional affiliations. |
© 2022 by the authors. Licensee MDPI, Basel, Switzerland. This article is an open access article distributed under the terms and conditions of the Creative Commons Attribution (CC BY) license (https://creativecommons.org/licenses/by/4.0/).
Share and Cite
MDPI and ACS Style
Yamamoto, J.; Frachtenberg, E. Gender Differences in Collaboration Patterns in Computer Science. Publications 2022, 10, 10. https://0-doi-org.brum.beds.ac.uk/10.3390/publications10010010
AMA Style
Yamamoto J, Frachtenberg E. Gender Differences in Collaboration Patterns in Computer Science. Publications. 2022; 10(1):10. https://0-doi-org.brum.beds.ac.uk/10.3390/publications10010010
Chicago/Turabian StyleYamamoto, Josh, and Eitan Frachtenberg. 2022. "Gender Differences in Collaboration Patterns in Computer Science" Publications 10, no. 1: 10. https://0-doi-org.brum.beds.ac.uk/10.3390/publications10010010
Note that from the first issue of 2016, this journal uses article numbers instead of page numbers. See further details here.