Article

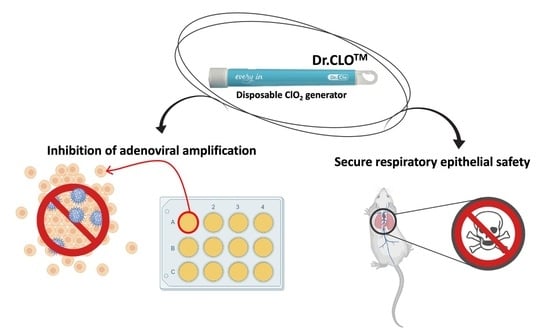
Respiratory Safety Evaluation in Mice and Inhibition of Adenoviral Amplification in Human Bronchial Endothelial Cells Using a Novel Type of Chlorine Dioxide Gas Reactor

1
Department of Biomedical Laboratory Science, College of Medical Sciences, Soonchunhyang University, Asan 31538, Korea
2
Department of Medical Science, Graduate School, Soonchunhyang University, Asan 31538, Korea
3
Department of Integrated Biomedical Science, Soonchunhyang Institute of Medi-bio Science (SIMS), Soonchunhyang University, Cheonan 31151, Korea
4
NON Inc., Geumsan 32713, Korea
*
Author to whom correspondence should be addressed.
Submission received: 1 November 2021 / Revised: 5 January 2022 / Accepted: 8 January 2022 / Published: 13 January 2022
(This article belongs to the Special Issue Advanced Studies on Toxic Chemicals: Properties and Characteristics)

Abstract

:
Since the onset of the COVID-19 pandemic, there has been a growing demand for effective and safe disinfectants. A novel use of chlorine dioxide (ClO2) gas, which can satisfy such demand, has been reported. However, its efficacy and safety remain unclear. For the safe use of this gas, the stable release of specific concentrations is a must. A new type of ClO2 generator called Dr.CLOTM has recently been introduced. This study aimed to investigate: (1) the effects of Dr.CLOTM on inhibiting adenoviral amplification on human bronchial epithelial (HBE) cells; and (2) the acute inhalation safety of using Dr.CLOTM in animal models. After infecting HBE cells with a recombinant adenovirus, the inhibitory power of Dr.CLOTM on the virus was expressed as IFU/mL in comparison with the control group. The safety of ClO2 gas was indirectly predicted using mice by measuring single-dose inhalation toxicity in specially designed chambers. Dr.CLOTM was found to evaporate in a very constant concentration range at 0–0.011 ppm/m3 for 42 days. In addition, 36–100% of adenoviral amplification was suppressed by Dr.CLOTM, depending on the conditions. The LC50 of ClO2 gas to mice was approximately 68 ppm for males and 141 ppm for females. Histopathological evaluation showed that the lungs of female mice were more resistant to the toxicity from higher ClO2 gas concentrations than those of male mice. Taken together, these results indicate that Dr.CLOTM can be used to provide a safe indoor environment due to its technology that maintains the stable concentration and release of ClO2 gas, which could suppress viral amplification and may prevent viral infections.

Graphical Abstract

1. Introduction

Recently, people have become very interested in environmental quarantine owing to the global pandemic of COVID-19. Moreover, many types of disinfectant have been introduced, including antibacterial and antiviral agents, due to an increase in time spent indoors [1,2,3,4]. Because most disinfectants come into direct contact with objects used daily, the complete removal of the disinfection agent is sometimes not achieved [5,6]. As a solution to these shortcomings, chlorine dioxide (ClO2) gas is a type of disinfectant that has recently attracted attention [7,8,9,10].
ClO2 gas is already known for its excellent effects on deodorization [11], sterilization, or inhibition of viral amplification [8,12,13,14]. It is safe and has eco-friendly properties, such as easy decomposition by light and cost-effectiveness. It can be used on most surfaces and a range of objects [14]. Therefore, ClO2 gas has been widely used for the disinfection of various medical apparatus. It can suppress the growth of various microorganisms in the surrounding environment without being applied directly to the object’s surface [8,13,15]. Thus, gas-type ClO2 can be used as an ideal disinfectant that can be applied in daily life at low concentrations. However, practically, its use has been limited due to technical difficulties in maintaining a constant concentration of ClO2 gas for evaporation [14]. In addition, there is a risk that the outflow of a high concentration of ClO2 gas may significantly irritate the human mucous membranes, particularly the respiratory alveolar epithelium [8,9]. Therefore, if a low concentration of ClO2 gas is maintained within a stable range for daily life, ClO2 gas can be used as an effective and safe quarantine material type from airborne microbes present in the surrounding environment [16,17,18,19]. Dr.CLOTM (a stick type of NON, Inc.) is a product that can generate very low concentrations of ClO2 gas in an easy manner. It is sold in Korea and in over 35 countries, including the United States, Japan, and recently in China. Unlike other products, Dr.CLOTM produces a constant concentration of ClO2 gas. It is supplied in a helpful form for individuals to use.
The use of ClO2 gas is still controversial in terms of safety [8,9,20,21,22]. Safety issues are constantly being raised, but many recent reports have stated that the effective use of ClO2 gas is beneficial in quarantine living environments and medical fields [7,10,12,16,18,23,24,25]. Most studies pointing out the dangers of ClO2 gas also warn of the risks of unintentional workplace accidents and unspecified hyperreactivity [20,21,22]. However, the use of ClO2 gas has already been tried in various fields, and a variety of methods for using ClO2 gas within the safe range can be tested at a time when continuous quarantine for a large proportion of indoor area is emphasized, for example in a pandemic situation such as COVID19.
Recently, many researchers have actively reported studies related to the safety and benefits of ClO2 gas using laboratory animals worldwide [1,7,8,9,15,16,18,21,23,24,25,26,27,28]. However, few studies have been conducted in Korea, because devices that can perform inhalation toxicity are currently not readily available [29,30]. Therefore, in this study, the histopathological evaluation (as a single-dose inhalation toxicity study) of the range of ClO2 gas concentrations produced by the ClO2 gas generator (Dr.CLOTM), which has been released to the market for multi-purpose use, was performed. Furthermore, a study was conducted on the histopathological changes in the respiratory system, particularly the lungs, at the various ClO2 concentrations created by Dr.CLOTM of experimental animals (male and female ICR mice), following the direction of the Korean Ministry of Food and Drug Safety (MFDS) [31]. In addition, it was verified whether an anti-adenoviral effect occurred in human bronchial epithelial cells (HBE) from very low ClO2 gas concentrations.

2. Materials and Methods

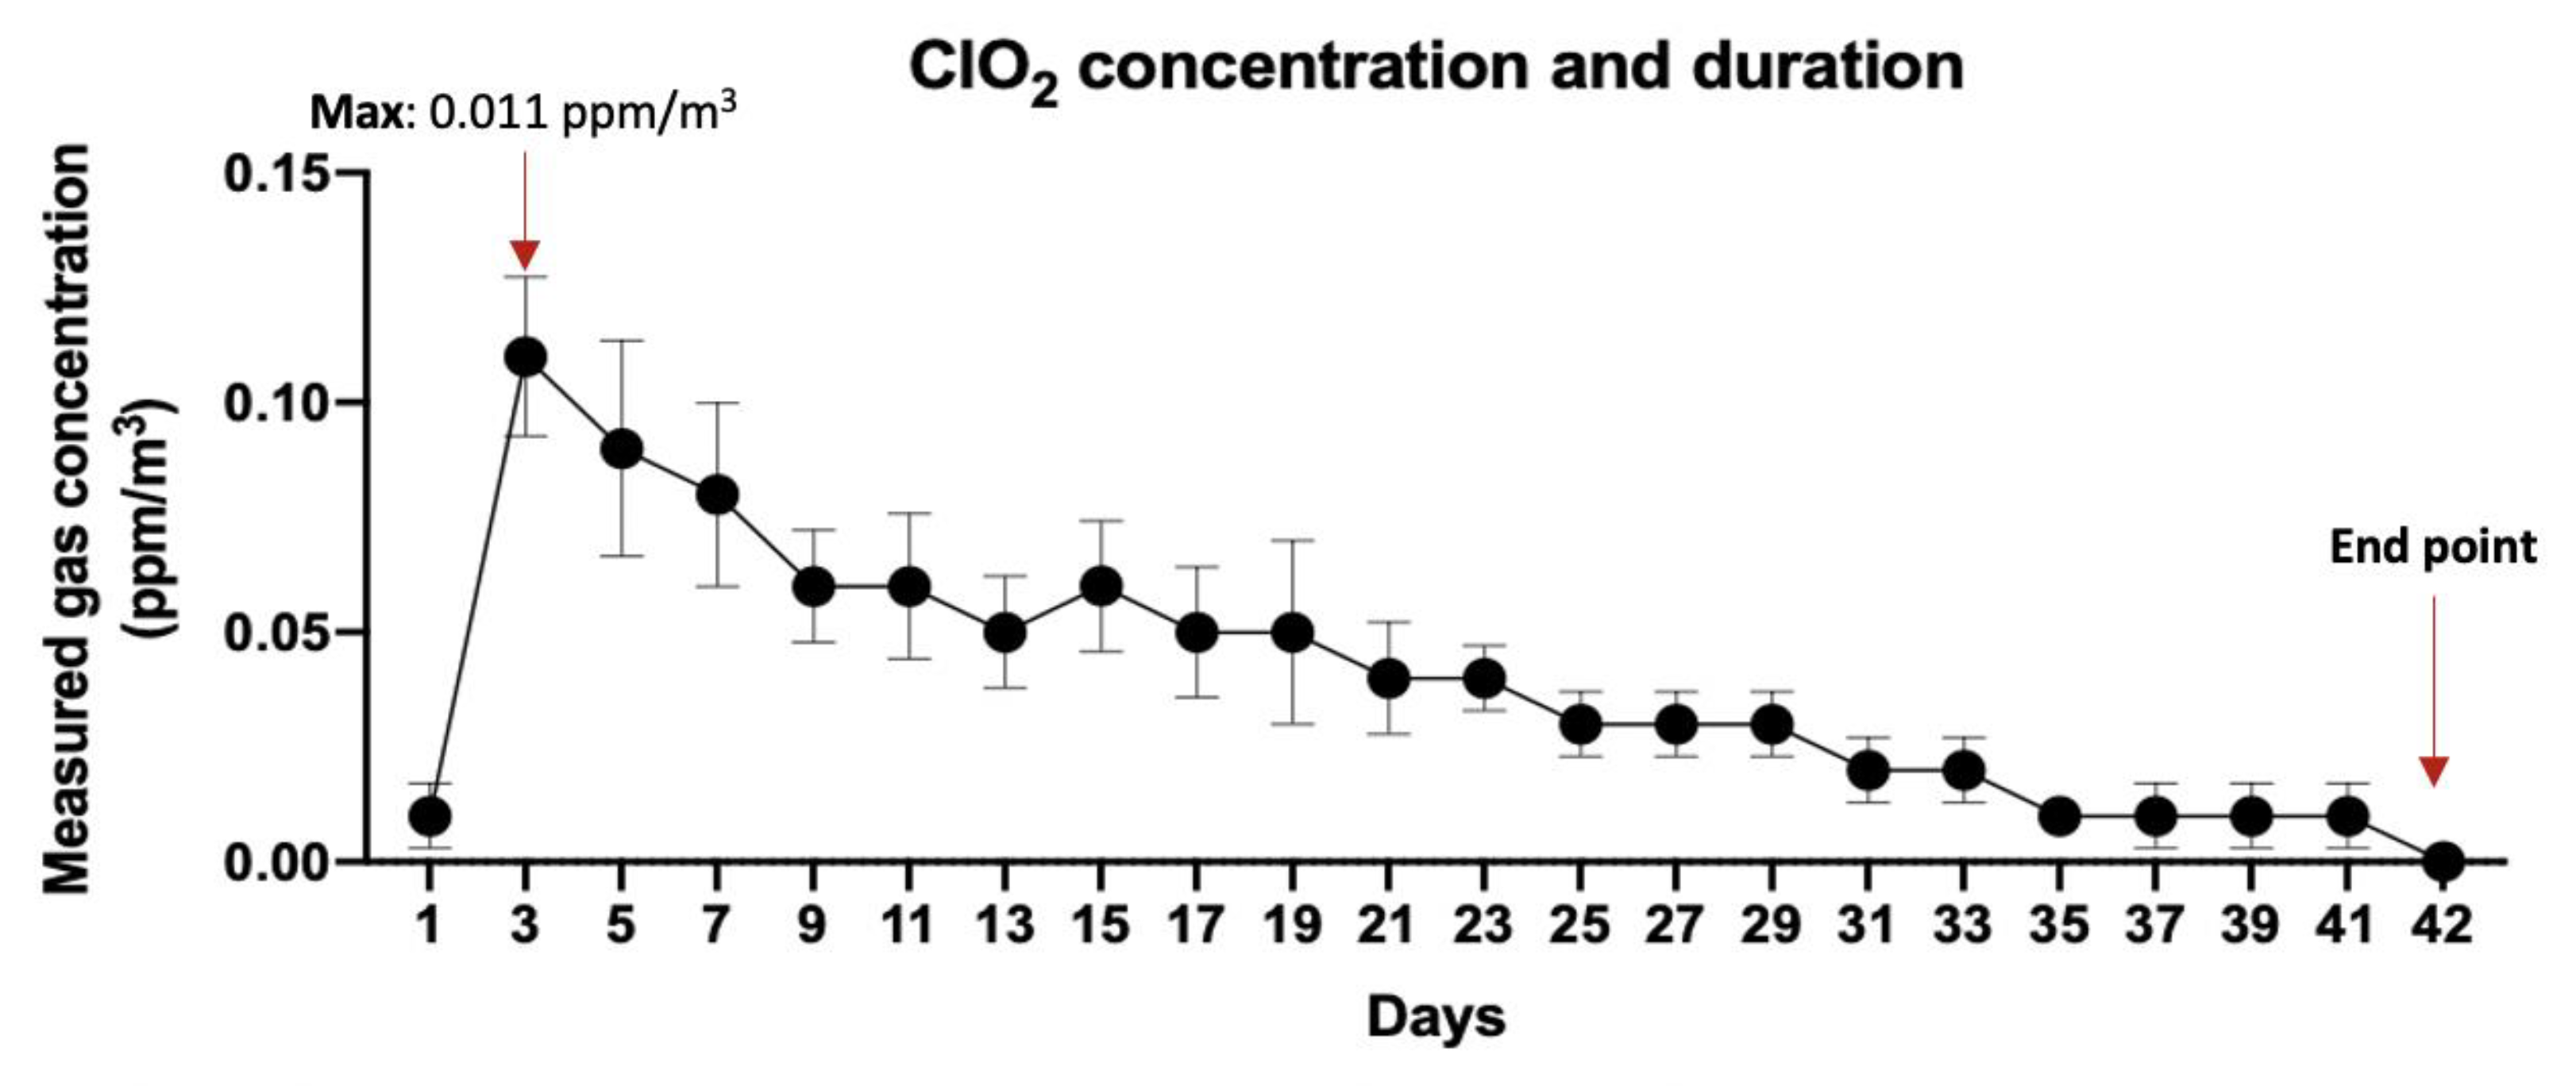
2.1. Concentration and Duration of Chlorine Dioxide (ClO2) Gas Generation by Dr.CLOTM

Dr.CLOTM was placed on the top of a sealed chamber (1 m × 1 m × 1 m; 1m3). A ClO2 gas measuring machine (PortaSens III D16 portable gas detector, Analytical Technology, Inc., Collegeville, PA, USA) was placed at the bottom of the chamber. The activated product was then measured at the same time every day for an hour at 28 °C for 42 days. Before the experiment, the chamber was ventilated. All measurement environments were maintained in the same way. The average value of the concentration measured five times was calculated. To provide a brief explanation of how Dr.CLOTM maintains a low chlorine dioxide gas concentration over a long time, Dr.CLOTM has a solid substance part with a glass ampoule part inside. Liquid substances are stored in the glass ampoules. Bending the Dr.CLOTM as needed breaks the glass ampoule inside; the liquid substance meets the solid substance, causing a chemical reaction to occur, but this chemical reaction is carried out in very small amounts.

2.2. Measurement of Dissolved Cl Ions in Culture Medium

The following method was used to measure chloride ion concentration when ClO2 gas was dissolved in the cell culture medium for 24 h. A chloride assay kit (ab83372; Abcam Cambridge, UK) was utilized for measuring chloride ion concentration after 24 h from an activated Dr.CLOTM. In brief, one million cells were rapidly homogenized with 100 μL lysis buffer (pH 6.5–8.0). After centrifuging at 13,000 rpm for 10 min to remove insoluble materials, the supernatant was diluted with assay buffer. Samples (10~50 μL) were taken, and the well volume was adjusted to 50 μL with distilled water. Afterward, 150 μL of chloride reagent of was added to each well containing chloride standard or test samples. After incubation at room temperature for 15 min, optical density (OD) at 620 nm was measured using a microplate reader (Thermo Scientific Multiskan GO, Vantaa, Finland).

2.3. Adenoviral Infectivity Titer

2.3.1. Cell Culture

Human Beas-2B bronchial epithelial cells (CRL-9609TM, ATCC, Manassas, VA, USA) were cultured in DMEM (Invitrogen, Life Technologies, Grand Island, NY, USA) supplemented with 10% (v/v) heat-inactivated FBS, 100 units/mL penicillin, and 100 mg/mL streptomycin.

2.3.2. Viral Forming Units (Titer)

For rapid measurement of the infected viral forming units in adenoviral-infected human bronchiolar epithelial cells, a QuickTiterTM Adenovirus Titer Immunoassay kit (VPK-109) from Cell Biolabs, Inc. (San Diego, CA, USA) was used. Instead of using HEK-293 cell line provided by default in this kit, we used the human bronchial epithelial (HBE) cell mentioned earlier to determine the effect of ClO2 gas on the respiratory epithelium. In brief, immediately before recombinant adenoviral (Ad-β gal) infection, a 10-fold serial dilution of viral sample from 10−3 to 10−7 was performed. HBE cells were harvested and resuspended for viral infection in culture medium at 5 × 10⁵ cells/mL. After dispensing 1 mL of the cell-resuspended culture medium in a 12-well plate and incubating at 37 °C with 5% CO2 for an hour, ten-fold diluted viral samples were prepared in culture medium. Then, 100 μL of the diluted viral sample was dropwise added to each well of a 12-well assay plate. Infected cells were incubated at 37 °C with 5% CO2 for two days. At this time, Dr.CLOTM, after being fully activated for 48 h, was placed into the incubator containing test groups. Two days later, culture medium was were slowly removed from wells. Infected HBE cells were fixed by gently adding 0.5 mL cold methanol down the side of each well of the 12-well assay plate and then incubating the plate at −20 °C for 20 min. Afterward, immunostaining was performed using 1× anti-hexon primary antibody solution, 1× HRP-conjugated secondary antibody, and 1× DAB solution. Viral titers (infectious units/mL) were calculated as the average number of positive cells per well using the following equation:
Viral   titer   ( ifu / mL ) = Average   positive   cells   ( per   field ) × ( Dilution   factor ) ( 0.1   mL )  

2.3.3. Inhibition of Functional Titer Virus Infectivity by ELISA

A QuickTiterTM Adenovirus titer ELISA Kit (VPK-110; San Diego, CA, USA) and an antibody against adenovirus hexon proteins were used to quantitate infected cells to measure the reduction in recombinant adenoviral infection in the HBE cell line by Dr.CLOTM. This assay was performed according to the manufacturer’s instructions. In brief, immediately before recombinant adenoviral (Ad-β gal) infection, a 2-fold serial dilution of Ad-β gal positive control was prepared in culture medium. Firstly, the viral stock was diluted at 1:2000, and eight sterile tubes were labeled as #1 to #8. Then, 500 μL of the 1:2000 diluted Ad-β gal viral sample was added to tube #1 and mixed well. Subsequently, 500 μL of diluent from tube #1 was transferred to the next tube. These steps were repeated for each tube, through to tube #7. Tube #8 was used as a blank. For accurate assessment of adenoviral titer, one of these dilutions for an unknown viral sample was to be within the range of the Ad-β gal standard curve (4.0 × 10³ IFU/mL to 2.5 × 10⁵ IFU/mL). For adenoviral infection, HBE cells were harvested and resuspended in culture medium at 5 × 10⁵ cells/mL, with 100 µL seeded into each well of a 96-well plate and incubated at 37 °C, 5% CO2 for an hour. Serial dilutions of the Ad-β gal positive control and viral samples in culture medium were prepared. A diluted viral sample (50 μL) was then dropwise added to each well of a 96-well assay plate. Infected cells were incubated at 37 °C with 5% CO2 for two days. At this time, a Dr.CLOTM, after being fully activated for 48 h, was placed into the incubator containing test groups. Two days later, culture medium was slowly removed from wells. Infected HBE cells were then fixed by gently adding 100 μL of cold methanol down from the wall of each well of the 96-well assay plate and incubating the plate at −20 °C for 20 min. Afterward, immunoassay was performed using 1× anti-hexon primary antibody solution and 1× HRP-conjugated secondary antibody. The reaction was developed with TMB substrate solution for 5 to 10 min. Finally, the reaction was stopped by adding 100 μL Stop solution to each well. The optical density of each well was then measured at 450 nm on a 96-well plate reader. The viral titer was calculated based on the standard curve from Ad-β positive control titrations.

2.4. Animal Preparation

Seventy 8-week-old ICR(CD1) male and female mice, respectively, were used in this study (140 animals in total). ICR mice are common experimental animals since they have no particular disease, pathogen, or genetic defects. They have been widely used in inhalation toxicity studies [32,33,34,35]. These animals were purchased from Oriental Bio (Seong-nam, Korea) and used for single whole-body ClO2 exposures in this study. Mice were housed at room temperature (22 ± 3 °C) and 30~70% humidity under a 12 h light:dark cycle from 07:00 to 19:00. Both males and females were divided into six groups based on the ClO2 gas concentration range and a ClO2 gas-untreated group. Ten animals were allocated to each group. These animals were given free access to a normal chow diet (2018S; Teklad diet, Envigo, Indianapolis, IN, USA) and water unless indicated otherwise for experiments. The Soonchunhyang University Institutional Animal Care and Use Committee (IACUC) approved all experiments and procedures (Approval number: SCH20_0033).

2.5. Study Designs for Single ClO2 Gas Whole-Body Exposure in Chambers

In general, a specially designed chamber device is required to achieve direct exposure of an animal’s respiratory system to the gas. For this study, the chamber was custom-made with the following functional design by Jeongdo Bio & Plant Inc. (Seoul, Korea). The ventilated animal chamber system was composed of six chambers (245 × 395 × 250 mm each) for ClO2 gas inhalation. The specifics of each chamber were as follows:
  • Material: acryl;
  • Floor: SUS304 stainless steel;
  • Air in & out ventilation count: 12 times/h.
Since a single Dr.CLOTM generates a very low concentration of ClO2 in the chamber, it was necessary to activate several Dr.CLOTM sticks to create a detectable ClO2 concentration by the detector. Multiple sticks of Dr.CLOTM were activated to generate ClO2 gas. The gas concentration was measured at regular time intervals (every 30 min) using a ClO2 detector (Porta Sens Gas Leak Detector (Model C16; Analytical Technology, Inc., Collegeville, PA, USA).
After waiting until a specific concentration was reached and stable (48 h), many Dr.CLOTM devices were located in the chamber. Gas concentration maintenance of the chambers’ ventilation was then performed. Optimization of maintaining a particular concentration of chlorine dioxide gas for the number of Dr.CLOTM was conducted.

2.5.1. Maintaining ClO2 Gas Environment during the Study

Dr.CLOTM, which was activated 48 h before the experiment, was placed in every chamber for each concentration to maintain the corresponding concentration. The maximum number of ventilations in the chamber was 12 times/h. Once every 30 min, a ClO2 detector (Porta Sens Gas Leak Detector Model C16; Analytical Technology, Inc., Collegeville, PA, USA) was used to check whether the concentration was maintained for each chamber. The concentration was kept constant for 6 h. Since ClO2 gas is easily decomposed by light and air is introduced and exhausted into the chamber, ClO2 gas may not be constantly maintained at the specified concentration. Thus, pre-activated Dr.CLOTM sticks were to be added or removed if necessary to maintain the concentration of ClO2 gas within a predetermined range (Table 1). After inhaling gas for 6 h in specially designed chambers, animals were observed for 14 days for changes in behavior and survival, according to the guidelines of the “Single dose inhalation toxicity test” provided by the Ministry of Korean Food and Drug Safety (MFDS) (Appendix 10) [31].

2.5.2. Groups for Single ClO2 Gas Exposure in Chambers

Since no animal deaths occurred at low concentrations of ClO2 gas, the concentration range should be set somewhat higher to obtain LC50 of ClO2 gas. In other words, this study is a single-dose inhalation toxicity study and should be the basis for subsequently chronic repeated inhalation toxicity study. Therefore, a concentration gradient that can obtain not only LC50 but also LC10 must be established. Animals were less likely to die at moderate concentrations of chlorine dioxide, so an extremely high concentration of chlorine dioxide had to be set, as shown in this study. Before carrying out this study, data on animals’ reactions to chlorine dioxide gas were collected through preliminary research. The concentration range was determined considering the scope of our chlorine dioxide gas meter. Therefore, as shown in Table 1 below, male and female mice were allocated to six concentration groups (ten animals in each group), respectively. Several Dr.CLOTM sticks (portable ClO2 gas generators) were placed in each chamber.

2.6. Histopathologic Evaluation and Scoring of Lung Alveolar Epithelium

Immediately after organ removal from mice, lung tissue samples were fixed in 10% neutral-buffered formalin, dehydrated in graded concentrations of ethyl alcohol, cleared in xylene, and embedded in paraffin. Embedded tissues were sectioned to 4 μm in thickness. Obtained sections were stained hematoxylin and eosin and Masson’s trichrome. Slides were examined with an automated Olympus (BX53) system to capture ultra-high-resolution images. DP80 with Olympus stream (Olympus, Waltham, MA, USA) images were captured. All histopathological changes in each lung tissue were evaluated, including intra-alveolar hemorrhage, alveolar cell edema, alveolar wall disruption, alveolar congestion with protein-rich fluid, and leukocyte infiltration. They were scored on a scale from 0 to 3 (Table 2) [36,37,38]. The average of these scores was used for comparison.

2.7. Statistics

All data are presented as mean ± SD or SEM. All statistical tests were analyzed using a Mann–Whitney U test (non-parametric) performed using a statistical software package (GraphPad Prism version 9.0, GraphPad Software Inc. (San Diego, CA, USA)) for comparison of multiple groups. p values less than 0.05 were considered statistically significant.

3. Results

3.1. ClO2 Gas Concentrations and Duration by Dr.CLOTM

The change in the concentration of ClO2 gas maintained in the unit space (m3) when one Dr.CLOTM is activated is shown. It was observed that chlorine dioxide gas was maintained at an almost constant concentration for 42 days, between 0 to 0.011 ppm. After activation of Dr.CLOTM, it was confirmed that a relatively low concentration of chlorine dioxide gas was continuously and constantly maintained (Figure 1). There was no temporary increase in the concentration of chlorine dioxide gas.
The maximum concentration exerted by Dr.CLOTM was recorded as 0.011 ppm/m3, and the concentration gradually decreased with time. The presence of ClO2 is confirmed on the 41st day, but almost all values converged to 0 on the 42nd day, indicating loss of activity.

3.2. Dissolved Chloride Concentration in Culture Medium

When one Dr.CLOTM standard stick (a portable ClO2 gas generator) was incubated for 24 h in an incubator with a volume of 0.15 m3 with a plate in which cells and medium were seeded, the concentration of chlorine after the gas injected by Dr.CLOTM was dissolved in the culture medium was measured. Dissolved chlorine concentrations in the medium were calculated using the kit. Results were: (1) non-treated group, 133.3 ± 74.05 nmol/mL, and (2) Dr.CLOTM treated group, 4186.0 ± 513.3 nmol/mL (Figure 2A).

3.3. Calculation of Adenoviral Infection Titer (Infectious Unitw/mL) in Human Respiratory Epithelial Cells

This result is calculated based on the quantitation of naphthol-positive cells and virus-infected cells determined by immunocytochemistry (Figure 2B).
By varying the virus inoculation random titer (1× & 2×), it was possible to calculate the number of inoculated virus particles, indicating the change in IFU according to the virus inoculation amount: (1) 1× adenoviral inoculation, (8.7 ± 0.25) × 106 IFU/mL; (2) 2× adenoviral inoculation, (15.7 ± 0.53) × 106 IFU/mL (Figure 2C).
After inoculating adenovirus into human respiratory epithelial cells in a 12-well plate (triplicate) at different inoculation doses (1× & 2×), it was then determined how much virus infection was suppressed by treatment with Dr.CLOTM for 24 h. The results are as follows: (1) suppressed infectivity in an infectious environment after 1× viral infection, (4.6 ± 0.21) × 106 IFU/mL; (2) suppressed infectivity in an infectious environment of 2× viral infection, (8.1 ± 0.33) × 106 IFU/mL (Figure 2C). Viral amplification in wells treated with Dr.CLOTM for 24 h was inhibited by 52.9% for the 1× adenovirus inoculation group, and 51.6% for the 2× adenovirus inoculation group, compared to the non-treated group (Figure 2C).

3.4. Inhibition of Adenoviral Infection (ELISA Method)

When three random different virus concentrations were inoculated and Dr.CLOTM treatment was used for 24 h, the decrease in virus amplification was measured by ELISA. A standard curve was obtained according to virus concentration and the amount of virus reduction by Dr.CLOTM was measured. As the results, 36% reduction for the first random inoculum [(95.8 ± 6.70) × 103 IFU/mL ⇨ (70.9 ± 1.20) × 103 IFU/mL], 47.1% reduction for the second random inoculum [(32.0 ± 1.73) × 103 IFU/mL ⇨ (17.0 ± 1.20) × 103 IFU/mL], and 100% reduction for the third random inoculum [(4.3 ± 0.55) × 103 IFU/mL ⇨ (0.0 ± 0.00) × 103 IFU/mL] were obtained (Figure 2D). The above results confirmed that the infectivity of adenovirus was significantly reduced by ClO2 gas generated by Dr.CLOTM into the cell culture medium.

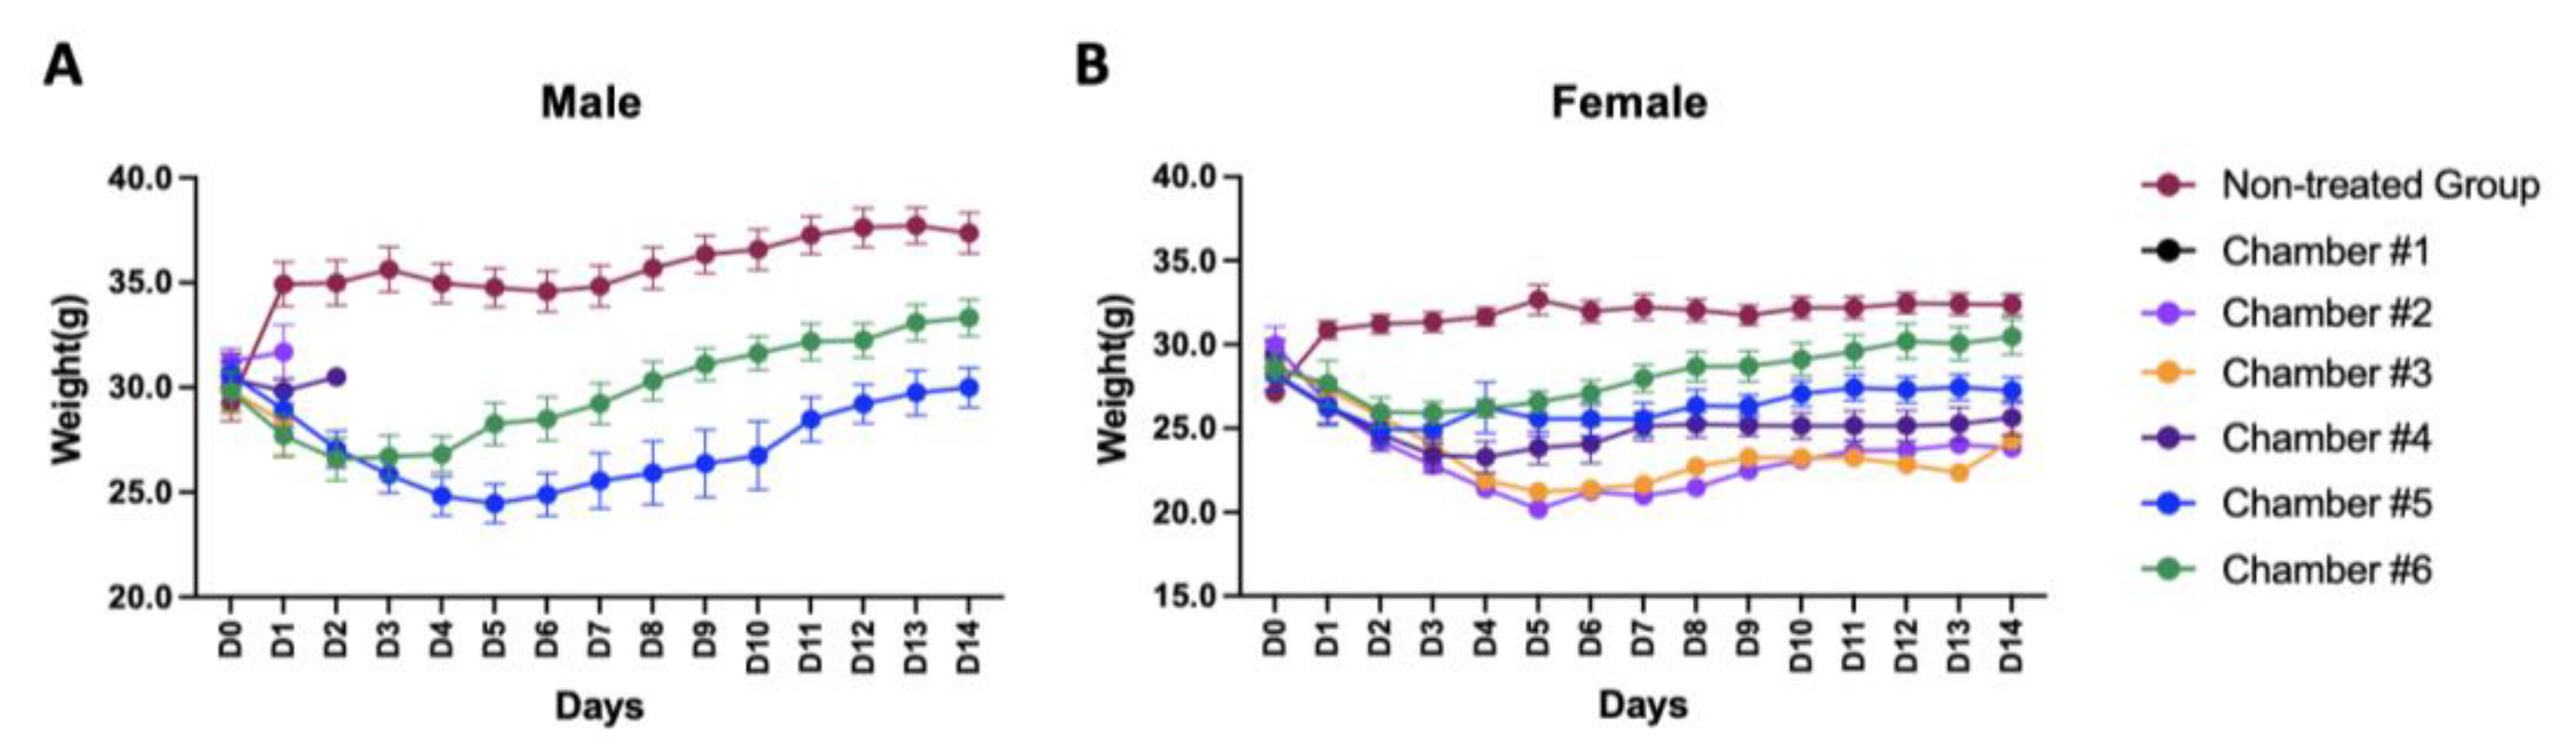
3.5. Animal Body Weight Changes

Seven concentration groups, including an untreated group, were used for exposure for 6 h, and the body weight changes were then observed for 14 days. We set very high gas concentrations that could not be reached in real life to obtain the LC50 for respiratory toxicity by Dr.CLOTM. The changes in the body weight of male and female animals were observed; the results are shown in Figure 3. Extreme body weight changes were detected at specific concentrations during the 14-day observation period. As shown in the graph, a significant decrease in body weight was initially observed at all gas concentrations. However, a tendency for the recovery of body weight was found six days after exposure in the surviving animals in most groups (Figure 3).

3.6. Animal Death after High Concentrations of Single ClO2 Gas Inhalation to Determine LC50

After inhaling gas for 6 h in specially designed chambers, the animals were observed for changes in behavior and survival for 14 days, according to the guidelines of the “Single dose inhalation toxicity study (Appendix 10)” in Standard for Toxicity Study of Pharmaceuticals provided by the MFDS [31]. Since there was a significant difference in survival rates of males and females over 14 days according to the results (Table 3), there was a difference in LC50 value for chlorine dioxide gas between males and females. The LC50 was approximately 68 ppm for males and 141 ppm for females. The LC10 was approximately 24 ppm for males and 30 ppm for females. Since the concentration of gas could not be specified, the LC50 was calculated using the median value of the concentration of each group.

3.7. Histopathological Findings

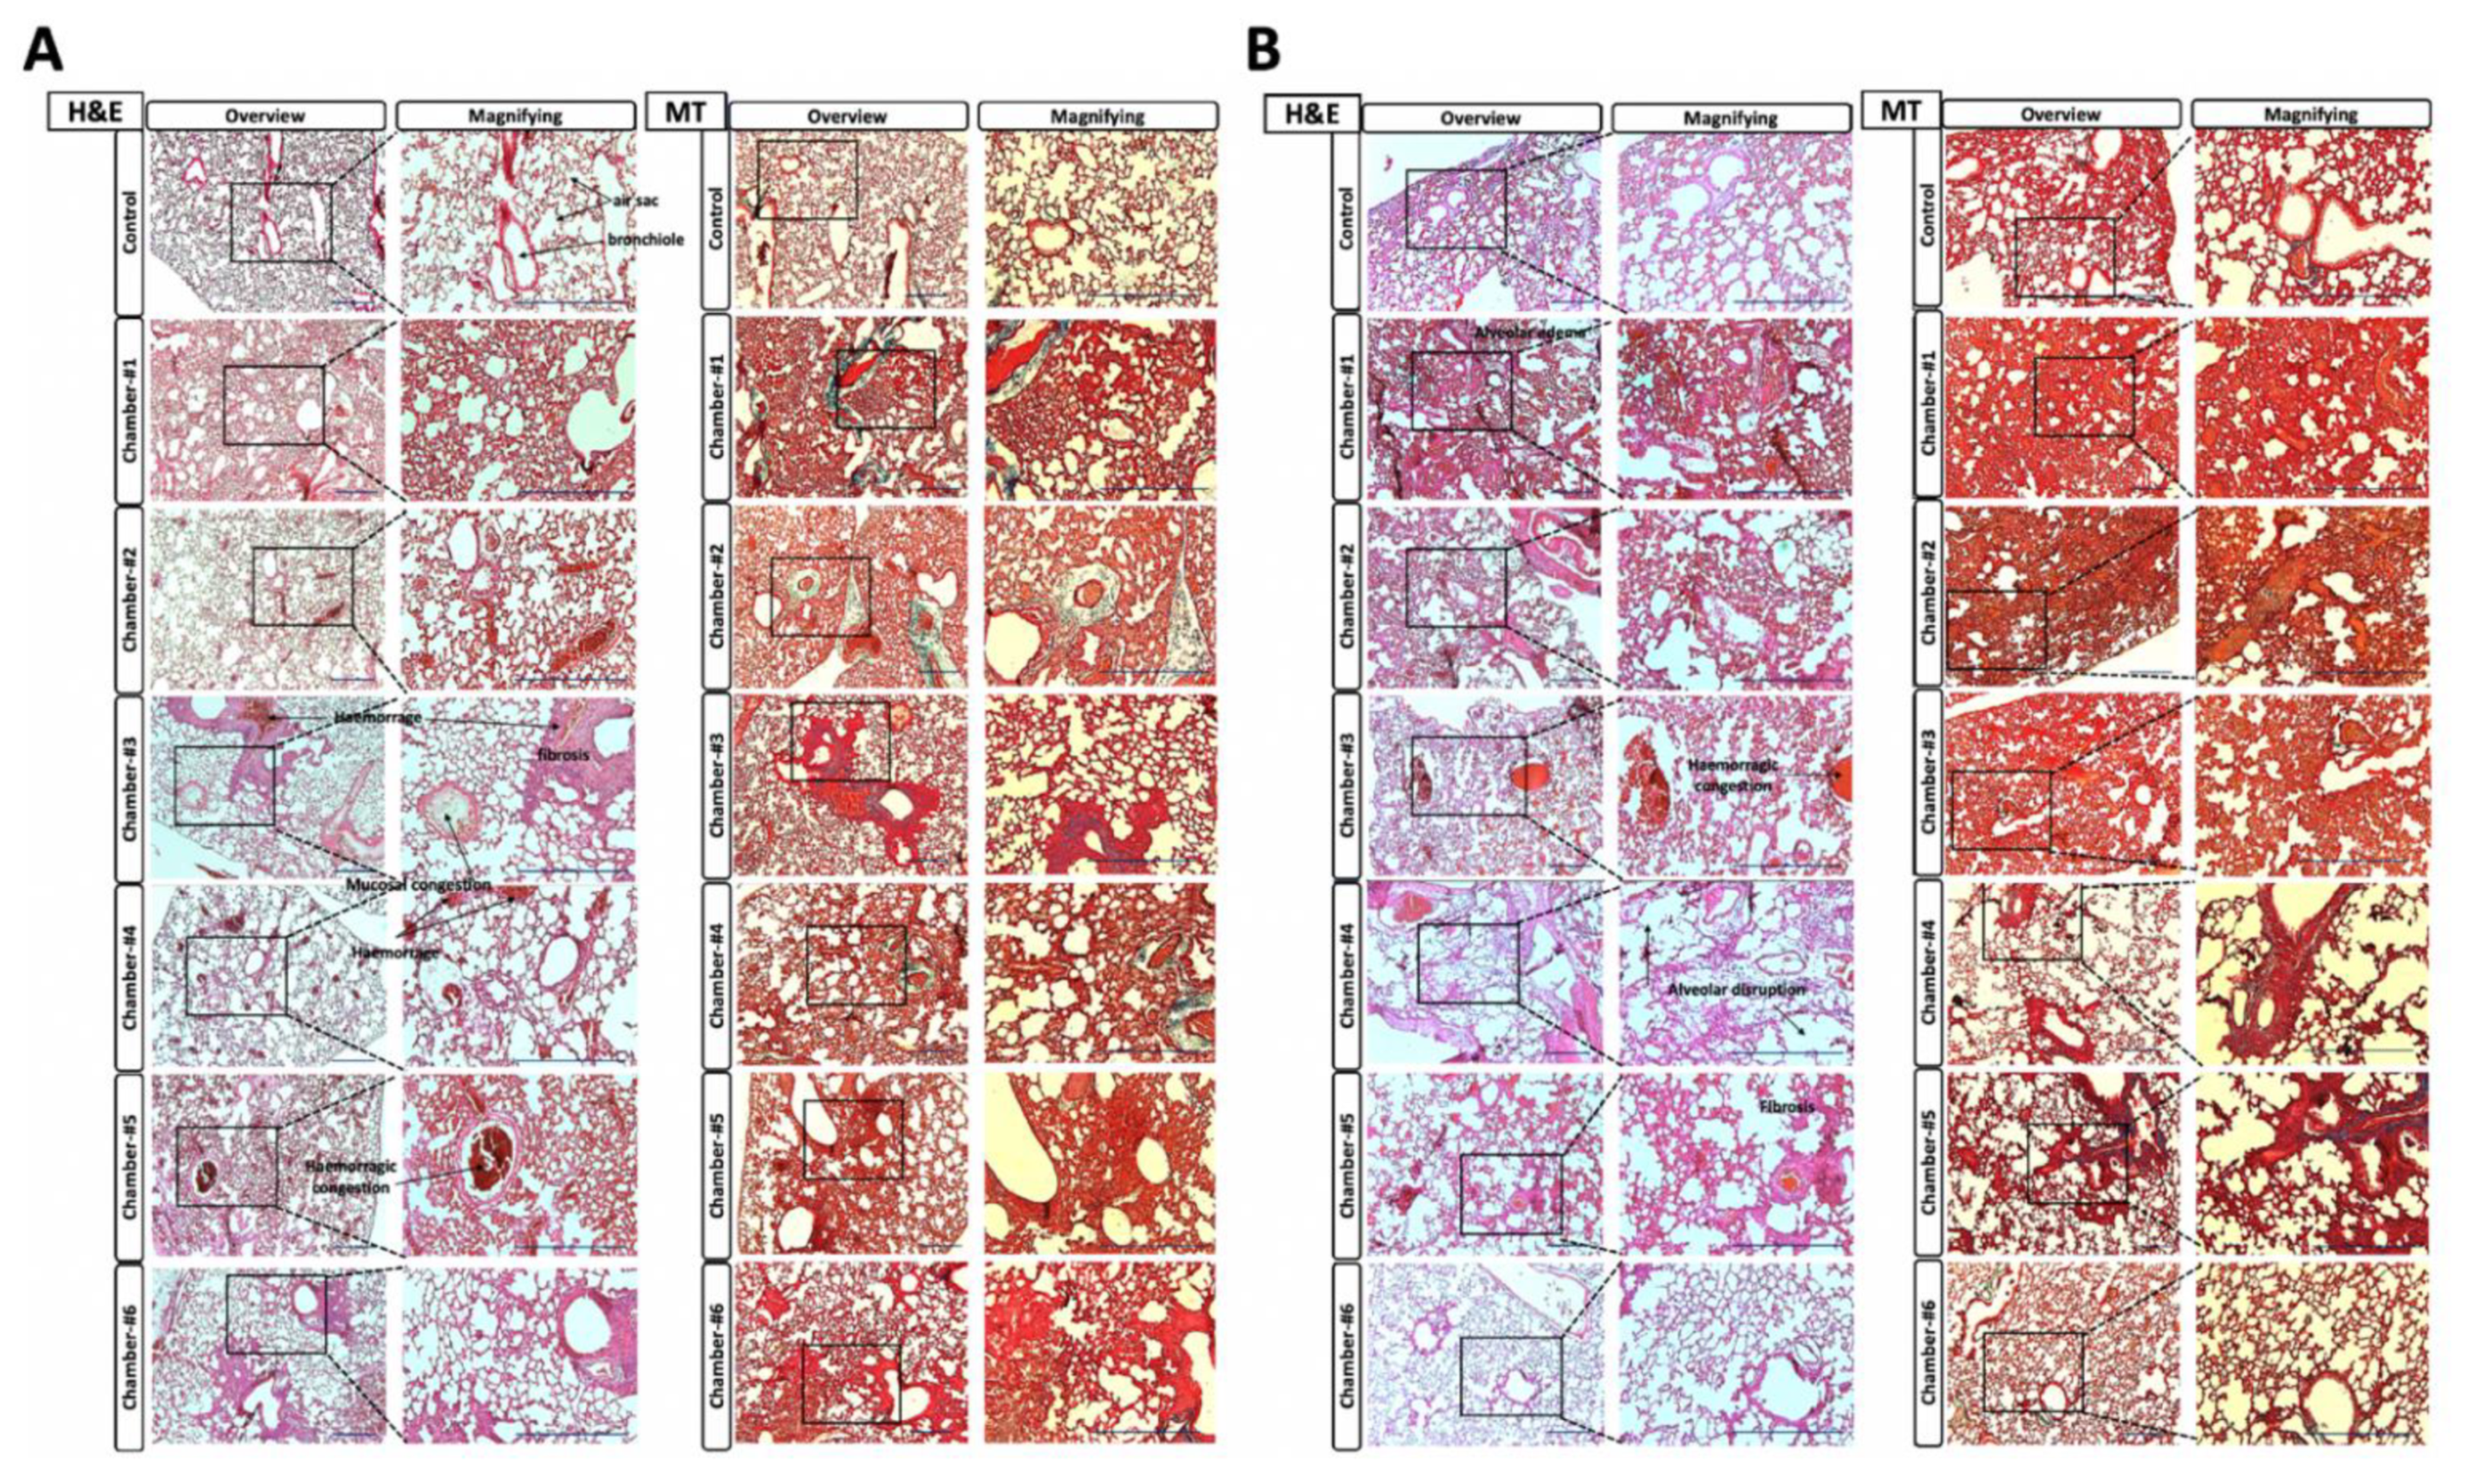
3.7.1. H&E Staining and Masson’s Trichrome Staining

Histopathological evaluation of the lung lobes of surviving animals after exposure to high concentrations of chlorine dioxide was performed (Figure 4). Through hematoxylin and eosin (H&E) and Masson’s trichrome (MT) staining, histopathological changes were observed in animals recovering in 14 days. Concentration-dependent changes were observed. In addition to an increase in connective tissues around the alveoli, thickening of the alveolar wall, inflammatory cells in the alveoli, congestion, bleeding of alveoli and blood vessels by fibrin or fibrin networks, and the abnormal disruption of the alveolar wall were recognized. In both males and females, relatively large morphological abnormalities were not observed in the group treated with the gas in the range of 20–50 ppm. However, the alveolar walls of animals exposed to ClO2 gas concentrations at 100–150 ppm were significantly thickened. This indicated that ClO2 gas at high concentrations could affect CO2–O2 gas exchange in the alveoli.

3.7.2. Histopathological Examination Scoring for Lung

Based on the scoring results from histological evaluation of extremely high concentrations of ClO2 gas exposure, neither males nor females differed significantly from the control group at a Dr.CLOTM concentration of 20–50 ppm. In the case of females, even at 50–100 ppm higher than males, there was no significant difference (Table 4 and Table 5).

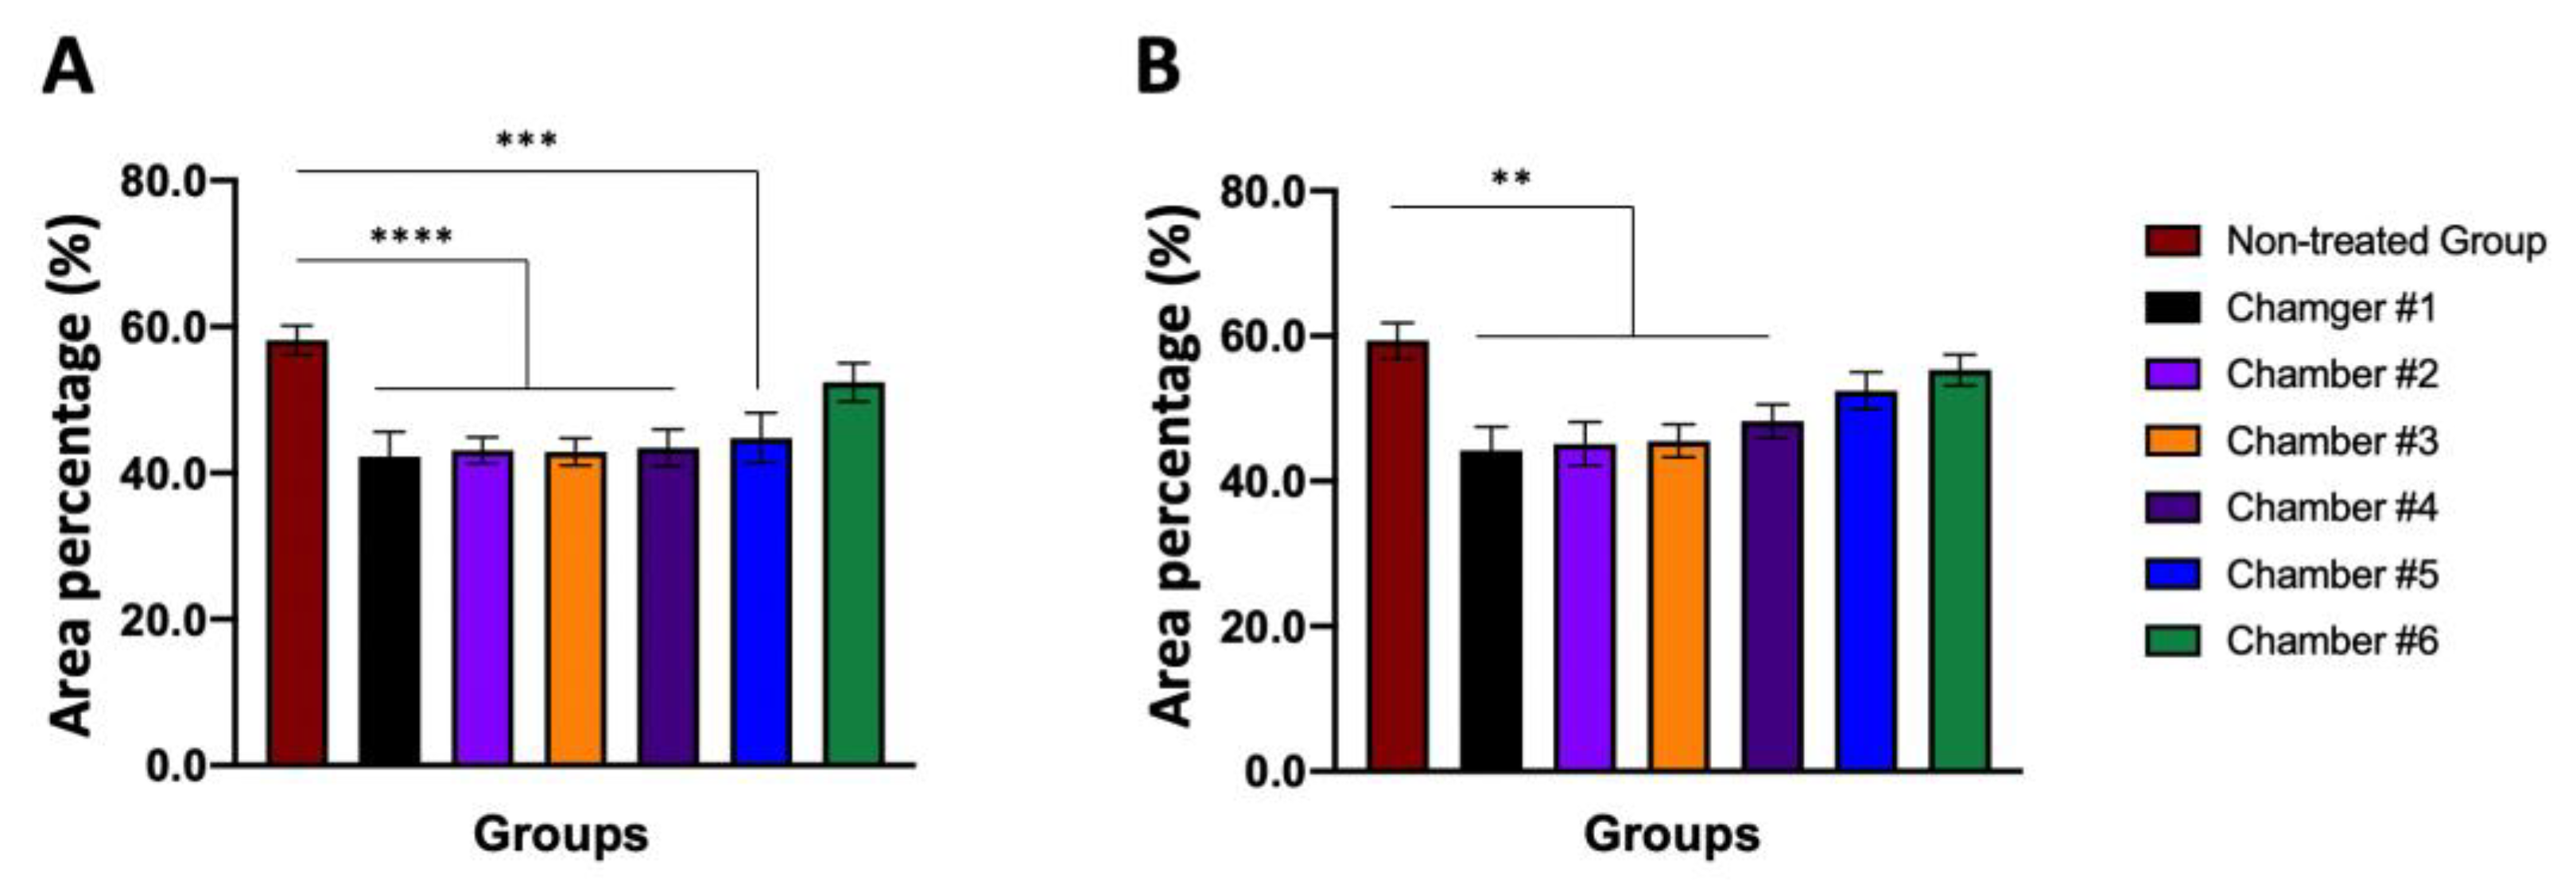
3.7.3. Area Comparison of the Alveolar Air Sac

Stimulation with chlorine dioxide gas caused congestion, bleeding, edema, and blockage of the alveolar cavity by secretions, which could significantly reduce the area occupied by the alveolar cavity compared to normal animals (Table 6). On the other hand, the percentage (%) occupied by the alveolar cavity in the observation screen is shown as a graph (Figure 5).

4. Discussion

In recent years, threatening viruses such as SARS-CoV, MERS-CoV, and SARS-CoV-2 (COVID-19) have become a global concern; further, we are entering an era where we do not know what types of epidemic will arise in the future [23,39]. In addition, reports of mass infections and zoonoses caused by various microorganisms that have become indigenous and a public health problem in each region are increasing [40,41]. To secure safety from these threatening microorganisms, we think that having a safe and convenient disinfection form for indoor environments and personal hygiene is a critical strategy. Furthermore, it is expected that the demand for effective disinfectants after the COVID-19 pandemic era will increase. For this reason, we believe that it is necessary to pay attention to the utilization and scalability of ClO2 gas among various disinfectants. ClO2 gas does not generate cancer-causing trihalomethanes [42,43]; the disinfecting effect of ClO2 is less affected by pH than chlorine, it has a less irritating odor, and has excellent concentration stability during storage [43]. Nevertheless, consumers are reluctant to use ClO2 gas due to the dangers of high concentrations of ClO2 gas [5,9]. However, if there was technology that could can efficiently control the concentration of this gas, it could be used for various purposes, such as grain storage [44,45], food storage through inhibition of microbial growth [46,47,48,49], disinfection of large buildings [50,51,52], and veterinary [53,54] or medical [8] use. As such, there is already widespread use of ClO2, but there are still concerns that it may be dangerous for infants [34,55], the elderly [34], and people with sensitive respiratory systems [34]. According to some studies, exposure to 50 ppm ClO2 gas for a short period is very dangerous and exposure at 2000 ppm can lead to death [20,21,56]. Pulmonary and hemodynamic changes were observed when an inhalation test of 110–140 ppm ClO2 gas for 6 h was performed in pigs [21]. By substituting the concentration corresponding to this result into our data, it corresponds to chamber #4 (Table 1). Since 10 to 19 ((4.13~7.85) × 105/m3) Dr.CLOTM sticks are required, it is usually not necessary to activate such a large amount of Dr.CLOTM in a living space where ventilation is completely blocked. In the study of Akamatsu, when 0.1 ppm ClO2 gas was inhaled by rats for 24 h/day and seven days/week for six months, non-toxic results were obtained [16]. This is different from our study design because rats repeatedly inhaled ClO2 over a long time. However, it is a result that suggests the possibility that ClO2 gas can be non-toxic, even if it is inhaled for a long time at a sufficiently low concentration. However, since this result is an animal test result, it cannot be directly translated to humans. However, it can be expected that the concentration is sufficiently low at 0.1 ppm or below because there are many cases where even people do not recognize the smell, according to EPA reports [34,57,58]. In our experimental results, it is considered that the morphological characteristics of the mice lung tissues did not show any significant change compared to that of the control group within the concentration range of 20–50 ppm, so it is considered that the mice showed considerable resistance to exposure within a short period of time. The reaction principle of Dr.CLOTM was briefly explained in Methods. It is specifically designed to generate ClO2 gas continuously for a long period of time in a certain concentration range (Figure 1) after consideration of safety and economy. It is very small and light, so it can be used in various indoor spaces. Since gas generation was maintained for about 42 days at a concentration of 0.011 ppm/m3 or higher than 0 ppm, it corresponds to a very much lower concentration than the dangerous concentrations reported in several previous studies [9,21,34,55,56,57]. Clearly, the results of this study are from animals, so direct application to humans may be complex. Furthermore, it is still necessary to obtain additional results through chronic repeated inhalation toxicity studies. Therefore, it would be a mistake to directly substitute these results into people with reference only to the results in this section.
According to several reports, ClO2 gas can kill viruses [7,9,17,18,23,43,59]. ClO2 has explicitly been known to exert its antiviral effects on viral nucleic acids, viral proteins [23,60] and oxidizing the amino acids tryptophan and tyrosine [17,23]. In particular, according to a recent study by Ogata and Miura (2020), ClO2 may inhibit the binding of the recombinant spike protein of SARS-CoV-2 to its receptor molecule, angiotensin-converting enzyme 2 (ACE-2) [59]. Hatanaka et al. (2021) concluded that ClO2 had a potent antiviral effect, even in the presence of organic matter [23]. However, unfortunately, due to the limited facilities that directly deal with coronavirus, adenovirus was used in this study instead. Since it is not easy to measure the effect of ClO2 gas by direct virus contact, the amount of reduced amplification of the infected virus in HBE cells was measured (Figure 2). The present study measured the inhibition of recombinant adenoviral amplification inoculated into HBE cells using the ICC and ELISA method. This is different from the typical method that measures the inhibition of virus proliferation by directly exposing cells to ClO2. The results Section 3.2 detected chloride in the non-treated group that was not treated with ClO2 gas. Since the chloride present in the medium is derived from chlorine dioxide, the absorbed chloride from the Dr.CLOTM can be measured by subtracting the dissolved chloride present in the medium. For this reason, the experimental design was structured in this current study.
Therefore, the antiviral effect of chlorine dioxide gas seems to be exerted by attacking the common structures, regardless of the DNA or RNA of viruses. For this reason, ClO2 is expected to be effective against most viruses, and it is considered that the effect of ClO2 against the adenovirus used in this study was excellent. In particular, ClO2 gas is several times more potent than sodium hypochlorite, and it is known that it will exert its effect in various environments. EPA-certified product ingredients against coronavirus in the U.S. mostly function by artificial direct contact with the virus [10]. Since gas-type sterilizers have an easy and convenient sterilization effect, even in hard-to-reach areas, chlorine dioxide gas-type disinfectants are expected to receive more attention in the future. The critical core advantage of Dr.CLOTM is that it can release ClO2 gas at a constant level in a safe concentration for evaporation (Figure 1). The results of this study indicate that it can work effectively to disinfect the surrounding environment without affecting human tissues. The maximum concentration from one Dr.CLOTM stick was 0.011 ppm/m3. The concentration that could be irritating to humans was reported to be much higher than this [20,21,35,57,58,59], so in general, 1~3 Dr.CLOTM sticks in an indoor space (more than 1 m3) where people live would not be expected to cause problems in a healthy person.
Since it is difficult to evaluate the toxicity of ClO2 gas in humans directly, the toxicity of chlorine dioxide gas was measured indirectly in the lungs using experimental animals. According to Young’s review, as a safe disinfectant, ClO2 has an inhibitory effect on bacteria, viruses, and fungi. It has been recognized as an effective substance with very little toxicity [12]. In our study, a single-dose inhalation toxicity test was conducted according to the guidelines of the ‘Single dose inhalation toxicity study (Appendix 10)’ in the ‘Standard for Toxicity Study of Pharmaceuticals’ provided by the MFDS [31] by applying a high ClO2 gas concentration to mice that could not be realistically reached in daily life. Of course, it was impossible to fix a specific concentration due to the material characteristics of chlorine dioxide gas itself. However, to obtain an approximate LC50 (approximately 68 ppm for males and approximately 141 ppm for females) by exposure to chlorine dioxide gas, inhalation toxicity evaluation had to be conducted using such high concentrations of ClO2 gas environment in the present study. Although several studies on chlorine dioxide have been conducted and the safety evaluations of various conditions have been conducted [12,61,62]; in most studies, like our results, significant changes in survival rate (Figure 3 and Table 3) and histopathology (Figure 4 and Figure 5, Table 4, Table 5 and Table 6) were found at notably high ClO2 concentrations. A remarkable observation in our study was a gender-related response to chlorine dioxide gas (Figure 3, Figure 4 and Figure 5). According to our results, females had higher resistance to ClO2 gas than males. From a histopathological perspective, males were more sensitive to ClO2 gas concentration than females (Figure 3, Figure 4 and Figure 5). Various index scores related to lung function and the ratio of the area occupied by the alveolar cavity per unit area confirmed that the animal’s respiratory function performance was typical, even under conditions of a relatively high ClO2 concentration. However, the normal range for females was higher than that in males (Figure 3, Figure 4 and Figure 5, and Table 3, Table 4 and Table 5). Therefore, it is thought that the effect of ClO2 gas generated by one Dr.CLOTM stick on living organisms is insignificant.
The most challenging part of the experiment was the variation in the ClO2 gas concentration. Since ClO2 is decomposed by itself due to various causes, it is necessary to maintain the same indoor environment (illuminance, experimenter movement, etc.) as well as the ventilation water in the chamber.
One drawback of our animal experiments is that larger animals were not chosen. According to the ‘OECD Guidelines for the Testing of Chemicals’, healthy young adult rats are the preferred animal model [63]. If rats could be used in the inhalation toxicity test, relatively more meaningful results could have been obtained than when mice were used. However, it was challenging to perform in our experimental environment when using rats because more chambers required several powerful ventilating devices. Moreover, the MFDS guidelines specify that mouse selection is possible [31].
Although it was not possible to include all the information on ClO2 gas here, it was found that there is a reasonable possibility that it can be used safely in daily life and quarantine areas with the proper practical control. The use of ClO2 gas could be beneficial to combat the current COVID-19 pandemic situation and the usefulness of the newly designed Dr.CLOTM could be further studied for safety and economy. Based on the results of this study, the improved control of ClO2 gas by Dr.CLOTM should be confirmed through additional chronic repeated inhalation toxicity tests.

5. Conclusions

This study confirmed that the use of ClO2 gas adjusted by Dr.CLOTM effectively inhibited adenovirus amplification in HBE cells and resulted in some histopathological changes in the respiratory system of ICR mice at a slightly higher concentration of 20–50 ppm. However, when looking at the functional aspects of the lungs, they were not considered to be significantly different from usual. As for the survival rate, this was found to be higher in females than males, indicating gender differences. Through the results of this study, we will study effective ClO2 gas use by screening the risk factors that ClO2 may have through dose setting and blood analysis of ClO2 gas. The use of Dr.CLOTM can be an effective way to perform indoor quarantine for various infectious germs safely that are currently prevalent. As a result, the authors are confident that this study can provide helpful results related to the choice of disinfectants used to combat COVID-19 pandemic.

Author Contributions

Conceptualization, S.-S.Y. and J.-S.M.; Methodology, J.-E.S. and S.-Y.Y.; Validation, N.B. and M.-W.P.; Formal analysis, H.-S.Y.; Investigation, H.-S.Y. and S.-M.Y.; Resources, S.-S.Y.; Data curation, K.-M.K.; Writing—original draft preparation, H.-S.Y.; Writing—review and editing, S.-S.Y.; Supervision, S.-S.Y.; Project administration, S.-S.Y.; Funding acquisition, S.-S.Y. All authors have read and agreed to the published version of the manuscript.

Funding

This research was supported by NON, Inc.’s research fund (20200845) and Soonchunhyang University Research Fund.

Institutional Review Board Statement

The Soonchunhyang University Institutional Animal Care and Use Committee (IACUC) approved all experiments and procedures of this study (Approval number: SCH20_0033).

Informed Consent Statement

Not applicable.

Acknowledgments

The graphical abstract was created using BIO render’s drawing app.

Conflicts of Interest

The authors declare no conflict of interest.

References

  1. Biswal, M.; Kanaujia, R.; Angrup, A.; Ray, P.; Singh, S.M. Disinfection tunnels: Potentially counterproductive in the context of a prolonged pandemic of COVID-19. Public Health 2020, 183, 48. [Google Scholar] [CrossRef] [PubMed]
  2. Chang, A.; Schnall, A.H.; Law, R.; Bronstein, A.C.; Marraffa, J.M.; Spiller, H.A.; Hays, H.L.; Funk, A.R.; Mercurio-Zappala, M.; Calello, D.P. Cleaning and disinfectant chemical exposures and temporal associations with COVID-19—National poison data system, United States, 1 January 2020–31 March 2020. Morb. Mortal. Wkly. Rep. 2020, 69, 496. [Google Scholar] [CrossRef] [Green Version]
  3. Grignani, E.; Mansi, A.; Cabella, R.; Castellano, P.; Tirabasso, A.; Sisto, R.; Spagnoli, M.; Fabrizi, G.; Frigerio, F.; Tranfo, G. Safe and effective use of ozone as air and surface disinfectant in the conjuncture of COVID-19. Gases 2021, 1, 19–32. [Google Scholar] [CrossRef]
  4. Guridi, A.; Sevillano, E.; De La Fuente, I.; Mateo, E.; Eraso, E.; Quindós, G. Disinfectant activity of a portable ultraviolet C equipment. Int. J. Environ. Res. Public Health 2019, 16, 4747. [Google Scholar] [CrossRef] [Green Version]
  5. Rutala, W.A.; Weber, D.J. Guideline for Disinfection and Sterilization in Healthcare Facilities. 2008. Available online: www.cdc.gov/infectioncontrol/guidelines/disinfection/ (accessed on 31 October 2021).
  6. Rutala, W.A.; Weber, D.J. Sterilization, high-level disinfection, and environmental cleaning. Infect. Dis. Clin. 2011, 25, 45–76. [Google Scholar] [CrossRef] [PubMed]
  7. Chen, T.-L.; Chen, Y.-H.; Zhao, Y.-L.; Chiang, P.-C. Application of Gaseous ClO2 on Disinfection and Air Pollution Control: A Mini Review. Aerosol Air Qual. Res. 2020, 20, 2289–2298. [Google Scholar] [CrossRef]
  8. Kály-Kullai, K.; Wittmann, M.; Noszticzius, Z.; Rosivall, L. Can chlorine dioxide prevent the spreading of coronavirus or other viral infections? Medical hypotheses. Physiol. Int. 2020, 107, 1–11. [Google Scholar] [CrossRef] [PubMed] [Green Version]
  9. Liester, M.B. The chlorine dioxide controversy: A deadly poison or a cure for COVID-19? Int. J. Med. Med. Sci. 2021, 13, 13–21. [Google Scholar]
  10. Rai, N.K.; Ashok, A.; Akondi, B.R. Consequences of chemical impact of disinfectants: Safe preventive measures against COVID-19. Crit. Rev. Toxicol. 2020, 50, 513–520. [Google Scholar] [CrossRef]
  11. Al-Sa’ady, A.T.; Nahar, H.S.; Saffah, F.F. Antibacterial activities of chlorine gas and chlorine dioxide gas against some pathogenic bacteria. EurAsian Journal of Biosciences 2020, 14, 3875–3882. [Google Scholar]
  12. Young, R.O. Chlorine dioxide (ClO2) as a non-toxic antimicrobial agent for virus, bacteria and yeast (Candida albicans). Int. J. Vaccines Vaccin. 2016, 2, 00052. [Google Scholar] [CrossRef] [Green Version]
  13. Girouard Jr, D.J.; Czarneski, M.A. Room, suite scale, class III biological safety cabinet, and sensitive equipment decontamination and validation using gaseous chlorine dioxide. Appl. Biosaf. 2016, 21, 34–44. [Google Scholar] [CrossRef]
  14. Wood, J.P.; Ryan, S.P.; Snyder, E.G.; Serre, S.D.; Touati, A.; Clayton, M.J. Adsorption of chlorine dioxide gas on activated carbons. J. Air Waste Manag. Assoc. 2010, 60, 898–906. [Google Scholar] [CrossRef] [PubMed] [Green Version]
  15. Haas, C.N. Decontamination using chlorine dioxide. In Hearings on the Decontamination of Anthrax and other Biological Agents; Committee on Science, United States House of Representatives: Washington, DC, USA, 2001; pp. 2001–2002. [Google Scholar]
  16. Akamatsu, A.; Lee, C.; Morino, H.; Miura, T.; Ogata, N.; Shibata, T. Six-month low level chlorine dioxide gas inhalation toxicity study with two-week recovery period in rats. J. Occup. Med. Toxicol. 2012, 7, 2. [Google Scholar] [CrossRef] [PubMed] [Green Version]
  17. Ogata, N.; Shibata, T. Protective effect of low-concentration chlorine dioxide gas against influenza A virus infection. J. Gen. Virol. 2008, 89 Pt 1, 60–67. [Google Scholar] [CrossRef] [PubMed]
  18. Ogata, N.; Sakasegawa, M.; Miura, T.; Shibata, T.; Takigawa, Y.; Taura, K.; Taguchi, K.; Matsubara, K.; Nakahara, K.; Kato, D. Inactivation of airborne bacteria and viruses using extremely low concentrations of chlorine dioxide gas. Pharmacology 2016, 97, 301–306. [Google Scholar] [CrossRef] [PubMed]
  19. Mimura, S.; Fujioka, T.; Mitsumaru, A. Preventive effect against influenza-like illness by low-concentration chlorine dioxide gas. Jpn. J. Environ. Infect. 2010, 25, 277–280. [Google Scholar] [CrossRef]
  20. Das, R.; Blanc, P.D. Chlorine gas exposure and the lung: A review. Toxicol. Ind. Health 1993, 9, 439–455. [Google Scholar] [CrossRef]
  21. Gunnarsson, M.; Walther, S.M.; Seidal, T.; Bloom, G.D.; Lennquist, S. Exposure to chlorine gas: Effects on pulmonary function and morphology in anaesthetised and mechanically ventilated pigs. J. Appl. Toxicol. 1998, 18, 249–255. [Google Scholar] [CrossRef]
  22. D’Alessandro, A.; Kuschner, W.; Wong, H.; Boushey, H.A.; Blanc, P.D. Exaggerated responses to chlorine inhalation among persons with nonspecific airway hyperreactivity. Chest 1996, 109, 331–337. [Google Scholar] [CrossRef]
  23. Hatanaka, N.; Xu, B.; Yasugi, M.; Morino, H.; Tagishi, H.; Miura, T.; Shibata, T.; Yamasaki, S. Chlorine dioxide is a more potent antiviral agent against SARS-CoV-2 than sodium hypochlorite. J. Hosp. Infect. 2021, 118, 20–26. [Google Scholar] [CrossRef]
  24. Burela, A.; Hernández-Vásquez, A.; Comandé, D.; Peralta, V.; Fiestas, F. Chlorine dioxide and chlorine derivatives for the prevention or treatment of COVID-19: A systematic review. Rev. Peru. Med. Exp. Salud Publica 2021, 37, 605–610. [Google Scholar] [CrossRef]
  25. White, C.W.; Martin, J.G. Chlorine gas inhalation: Human clinical evidence of toxicity and experience in animal models. Proc. Am. Thorac. Soc. 2010, 7, 257–263. [Google Scholar] [CrossRef] [Green Version]
  26. Li, D.; Sangion, A.; Li, L. Evaluating consumer exposure to disinfecting chemicals against coronavirus disease 2019 (COVID-19) and associated health risks. Environ. Int. 2020, 145, 106108. [Google Scholar] [CrossRef]
  27. Lei, M.; Zhang, L.; Lei, J.; Zong, L.; Li, J.; Wu, Z.; Wang, Z. Overview of emerging contaminants and associated human health effects. Biomed. Res. Int. 2015, 2015, 404796. [Google Scholar] [CrossRef] [PubMed] [Green Version]
  28. Ogata, N.; Koizumi, T.; Ozawa, F. Ten-week Whole-body Inhalation Toxicity Study of Chlorine Dioxide Gas in Rats. J. Drug Metab. Toxicol. 2013, 4, 143. [Google Scholar] [CrossRef] [Green Version]
  29. Kim, J.-H.; Kim, T.; Yoon, H.; Jo, A.; Lee, D.; Kim, P.; Seo, J. Health risk assessment of dermal and inhalation exposure to deodorants in Korea. Sci. Total Environ. 2018, 625, 1369–1379. [Google Scholar] [CrossRef]
  30. Han, D.-H.; Chung, S.-T.; Kim, J.-i.; Cho, Y.-S.; Lee, C.-S. A Study on Selecting Personal Protective Equipment for Listed Hazardous Chemicals (2): Analysis Using an Exposure Risk Matrix. J. Environ. Health Sci. 2016, 42, 430–437. [Google Scholar] [CrossRef] [Green Version]
  31. Ministry of Food and Drug Safety, Korea (Ed.) Standard for Toxicity Study of Pharmaceuticals. In MFDS Notification No. 2015, 82th ed.; National Institute of Food and Drug Safety Evaluation: Cheongju, Korea, 2015; p. 50. [Google Scholar]
  32. Nakashima, H.; Omae, K.; Takebayashi, T.; Ishizuka, C.; Sakurai, H.; Yamazaki, K.; Nakaza, M.; Shibata, T.; Kudo, M.; Koshi, S. Acute and subacute inhalation toxicity of dichlorosilane in male ICR mice. Arch. Toxicol. 1996, 70, 218–223. [Google Scholar] [CrossRef]
  33. Uemura, T.; Omae, K.; Nakashima, H.; Sakurai, H.; Yamazaki, K.; Shibata, T.; Mori, K.; Kudo, M.; Kanoh, H.; Tati, M. Acute and subacute inhalation toxicity of diborane in male ICR mice. Arch. Toxicol. 1995, 69, 397–404. [Google Scholar] [CrossRef] [PubMed]
  34. National Research Council; Committee on Acute Exposure Guideline Levels. Acute Exposure Guideline Levels for Selected Airborne Chemicals: Volume 9; National Academies Press: Washington, DC, USA, 2009.
  35. National Research Council. Acute Exposure Guideline Levels for Selected Airborne Chemicals: Volume 3; National Academies Press: Washington, DC, USA, 2003.
  36. Calikoglu, M.; Tamer, L.; Sucu, N.; Coskun, B.; Ercan, B.; Gul, A.; Calikoglu, I.; Kanik, A. The effects of caffeic acid phenethyl ester on tissue damage in lung after hindlimb ischemia-reperfusion. Pharmacol. Res. 2003, 48, 397–403. [Google Scholar] [CrossRef]
  37. Turut, H.; Ciralik, H.; Kilinc, M.; Ozbag, D.; Imrek, S.S. Effects of early administration of dexamethasone, N-acetylcysteine and aprotinin on inflammatory and oxidant-antioxidant status after lung contusion in rats. Injury 2009, 40, 521–527. [Google Scholar] [CrossRef] [PubMed]
  38. Basaran, U.N.; Ayvaz, S.; Aksu, B.; Karaca, T.; Cemek, M.; Karaboga, I.; Inan, M.; Aksu, F.; Pul, M. Desferrioxamine reduces oxidative stress in the lung contusion. Sci. World J. 2013, 2013, 376959. [Google Scholar] [CrossRef] [PubMed] [Green Version]
  39. Garcia-Perez, B.E.; Gonzalez-Rojas, J.A.; Salazar, M.I.; Torres-Torres, C.; Castrejon-Jimenez, N.S. Taming the Autophagy as a Strategy for Treating COVID-19. Cells 2020, 9, 2679. [Google Scholar] [CrossRef]
  40. Rahman, M.; Sobur, M.; Islam, M.; Ievy, S.; Hossain, M.; El Zowalaty, M.E.; Rahman, A.; Ashour, H.M. Zoonotic diseases: Etiology, impact, and control. Microorganisms 2020, 8, 1405. [Google Scholar] [CrossRef] [PubMed]
  41. Fonkwo, P.N. Pricing infectious disease: The economic and health implications of infectious diseases. EMBO Rep. 2008, 9, S13–S17. [Google Scholar] [CrossRef] [Green Version]
  42. Gates, D.J. The Chlorine Dioxide Handbook; American Water Works Association: Denver, CO, USA, 1998. [Google Scholar]
  43. Sanekata, T.; Fukuda, T.; Miura, T.; Morino, H.; Lee, C.; Maeda, K.; Araki, K.; Otake, T.; Kawahata, T.; Shibata, T. Evaluation of the antiviral activity of chlorine dioxide and sodium hypochlorite against feline calicivirus, human influenza virus, measles virus, canine distemper virus, human herpesvirus, human adenovirus, canine adenovirus and canine parvovirus. Biocontrol Sci. 2010, 15, 45–49. [Google Scholar] [CrossRef] [Green Version]
  44. Cheng, Z.; Li, X.; Hu, J.; Fan, X.; Hu, X.; Wu, G.; Xing, Y. Effect of Gaseous Chlorine Dioxide Treatment on the Quality Characteristics of Buckwheat-Based Composite Flour and Storage Stability of Fresh Noodles. Processes 2021, 9, 1522. [Google Scholar] [CrossRef]
  45. Jeon, Y.-A.; Lee, S.; Lee, Y.; Lee, H.-S.; Sung, J.; Kim, Y.-G. Disinfection of Fusarium-infected rice seeds by gaseous chlorine dioxide. Seed Sci. Technol. 2014, 42, 322–331. [Google Scholar] [CrossRef]
  46. Trinetta, V.; Vaidya, N.; Linton, R.; Morgan, M. Evaluation of chlorine dioxide gas residues on selected food produce. J. Food Sci. 2011, 76, T11–T15. [Google Scholar] [CrossRef]
  47. Yuk, H.G.; Bartz, J.A.; Schneider, K.R. The effectiveness of sanitizer treatments in inactivation of Salmonella spp. from bell pepper, cucumber, and strawberry. J. Food Sci. 2006, 71, M95–M99. [Google Scholar] [CrossRef]
  48. Kim, H.J.; Shin, J.; Kim, J.-e.; Yang, J.-y. Effect of Gaseous Chlorine Dioxide on Sterilization in Industrial Food-holding Cabinets. J. Food Hyg. Saf. 2019, 34, 170–177. [Google Scholar] [CrossRef]
  49. Guo, T.; Qiao, S.; Ren, T.; Tian, L.; Tian, J.; Wei, H.; Li, D.; Liu, Y.; Chen, C. Development of a chlorine dioxide air sterilizer and observation on its bactericidal efficacy. Chin. J. Disinfect. 2010, 5, 542–543. [Google Scholar]
  50. Hsu, C.-S.; Lu, M.-C.; Huang, D.-J. Disinfection of indoor air microorganisms in stack room of university library using gaseous chlorine dioxide. Environ. Monit. Assess. 2015, 187, 17. [Google Scholar] [CrossRef]
  51. Hsu, C.S.; Lu, M.C.; Huang, D.J. Effect of gaseous chlorine dioxide on student cafeteria bioaerosols. CLEAN–Soil Air Water 2014, 42, 12–19. [Google Scholar] [CrossRef]
  52. Burton, N.C.; Adhikari, A.; Iossifova, Y.; Grinshpun, S.A.; Reponen, T. Effect of gaseous chlorine dioxide on indoor microbial contaminants. J. Air Waste Manag. Assoc. 2008, 58, 647–656. [Google Scholar] [CrossRef] [PubMed]
  53. Luftman, H.S.; Regits, M.A.; Lorcheim, P.; Czarneski, M.A.; Boyle, T.; Aceto, H.; Dallap, B.; Munro, D.; Faylor, K. Chlorine dioxide gas decontamination of large animal hospital intensive and neonatal care units. Appl. Biosaf. 2006, 11, 144–154. [Google Scholar] [CrossRef]
  54. Lorcheim, P. Chlorine Dioxide Gas Decontamination of a 65,000 Cubic Foot Surgical Barrier Facility. ALN Magazine (4 December 2013). Available online: http://www.alnmag.com/articles/2013/12/chlorine-dioxide-gas-decontamination-65000-cubic-foot-surgical-barrier-facility (accessed on 6 January 2014).
  55. Taylor, J.; Wohlers, D.; Amata, R. Toxicological Profile for Chlorine Dioxide and Chlorite; U.S. Environmental protection Agency: Washington, DC, USA, 2004.
  56. Fernandez, C.; Inclan, I. Chlorine and inorganic compounds. In Encyclopedia of Occupational Health and Safety, 3rd ed.; Parmeggiani, L., Ed.; International Labour Office: Geneva, Swizerland, 1983; pp. 454–457. [Google Scholar]
  57. Amoore, J.E.; Hautala, E. Odor as an ald to chemical safety: Odor thresholds compared with threshold limit values and volatilities for 214 industrial chemicals in air and water dilution. J. Appl. Toxicol. 1983, 3, 272–290. [Google Scholar] [CrossRef] [PubMed]
  58. Vincent, G.; MacMahon, J.; Synan, J.F. The use of chlorine dioxide in water treatment. Am. J. Public Health Nations Health 1946, 36, 1035–1037. [Google Scholar] [CrossRef] [Green Version]
  59. Ogata, N.; Miura, T. Inhibition of the binding of spike protein of SARS-CoV-2 coronavirus to human angiotensin-converting enzyme 2 by chlorine dioxide. Ann. Pharmacol. Pharm. 2020, 5, 1195. [Google Scholar]
  60. Li, J.W.; Xin, Z.T.; Wang, X.W.; Zheng, J.L.; Chao, F.H. Mechanisms of inactivation of hepatitis A virus by chlorine. Appl. Environ. Microbiol. 2002, 68, 4951–4955. [Google Scholar] [CrossRef] [Green Version]
  61. Kauffman, G.B. McGraw-Hill Encyclopedia of Science & Technology: An international reference work in 20 volumes including an index. McGraw-Hill, New York, NY, 2002. Figures, tables, 90 color plates. xiii+ 15,320 pp, hardcover, 22.4 × 28.3 cm. $2,495.00. ISBN 0-07-913665-6. Chem. Educ. 2002, 7, 243–245. [Google Scholar]
  62. Abdel-Rahman, M.; Couri, D.; Bull, R. Kinetics of Cl02 and effects of Cl02, Cl02-, and Cl03-in drinking water on blood glutathione and hemolysis in rat and chicken. J. Environ. Pathol. Toxicol. 1979, 3, 431–449. [Google Scholar] [PubMed]
  63. Zart, A.; Arts, J.H.; ten Berge, W.F.; Appelman, L.M. Alternative acute inhalation toxicity testing by determination of the concentration-time-mortality relationship: Experimental comparison with standard LC50 testing. Regul. Toxicol. Pharmacol. 1992, 15, 278–290. [Google Scholar] [CrossRef]
Figure 1. Safe duration and concentration of ClO2 gas controlled by Dr.CLOTM. After activation of Dr.CLOTM, the maximum concentration of ClO2 gas was 0.011 ppm/m3. It was confirmed that the concentration was stably maintained between 0.000 and 0.011 ppm/m3 for 42 days after Dr.CLOTM activation. Error bars represent mean ± SD.
Toxics 10 00038 g001
Figure 2. Quantitative and qualitative inhibitory effect of treatment by Dr.CLOTM on adenoviral amplification. (A) The dissolved chlorine concentration in cell culture medium after activation of Dr.CLOTM for 24 h. (B) When human bronchial epithelial (HBE) cells were inoculated with multiple adenovirus doses (1× & 2×) using the immunocytochemistry (ICC) method, infected positive cells showed purple reactions. Infected cells are marked with red dotted circles. (C) Results of positive cells not treated with Dr.CLOTM and the number of positive cells inhibited when treated with Dr.CLOTM. Dr.CLOTM showed inhibitory effects on both 1× and 2× viral infections. (D) Adenoviral titers (IFUs/mL) inoculated randomly at three different concentrations were significantly reduced by Dr.CLOTM. The black square box represents the enlarged cell shape. The error bars indicate mean ± SEM; *, p < 0.05; **, p < 0.005; ***, p < 0.0005; ****, p < 0.0001.
Toxics 10 00038 g002
Figure 3. Body weight changes during the experiment. (A) For male animals, high concentrations of ClO2 gas (Chamber #1–Chamber #4) resulted in high mortality. However, mice in Chamber #5 and Chamber #6 recovered their body weight gradually from D4–5. (B) For female animals, all animals in Chamber #1 died after exposure to a concentration of 240 ppm or more. However, animals corresponding to the remaining concentrations were resistant to ClO2 gas and survived compared to males. Error bars represent mean ± SEM.
Toxics 10 00038 g003
Figure 4. Lung tissue hematoxylin & eosin (H&E) and Masson’s trichrome (MT) staining results for each group. (A) Male histopathological staining images according to ClO2 gas concentration. From Chamber #1 to Chamber #5, edema in alveolar cells increased fibrosis of interstitial tissue. Mucosal cohesion and thromboembolic infraction of the alveolar lumen are recognized. (B) Histopathological staining images of female mice by ClO2 gas concentrations. From Chamber #1 to Chamber #5, edema in alveolar cells increased fibrosis of interstitial tissue. Findings of mucosal congestions and thromboembolic infarction in the alveolar lumen are similar to those in males. However, compared to males, alveolar lumen accounted for a higher proportion. Distraction of the alveolar wall was recognized. Black square boxes are enlarged parts of lesions. Control: non-treated group; Chamber #1: 240 ppm < group; Chamber #2: 200~240 ppm group; Chamber #3: 150~200 ppm group; Chamber #4: 100~150 ppm group; Chamber #5: 50~100 ppm group; Chamber #6: 20~50 ppm group. H&E = hematoxylin and eosin; MT = Masson’s trichrome. Scale bar = 100 μm.
Toxics 10 00038 g004
Figure 5. Graph showing the space of the alveolar sac lumen within the lung lobe. The area ratio of the space where gas exchange can occur per unit area is shown. (A) When comparing results in males, each concentration in Chamber #1–Chamber #5 shows a significant difference for ClO2 gas compared to the non-treated group. (B) When comparing results in females, each concentration in Chamber #1–Chamber #4 resulted in a significant difference for ClO2 gas compared to the non-treated group. **, p < 0.005; ***, p < 0.0005; ****, p < 0.0001. Error bars represent mean ± SEM.
Toxics 10 00038 g005
Table 1. Group composition by ClO2 gas concentration, real-time concentration of ClO2 gas, number of applied Dr.CLOTM sticks, and conversion value of ClO2 gas concentration per cubic meter.
Group (M & F)Real-Time ClO2 Concentration (ppm)Dr.CLOTM Stick NumbersConversion of Stick Number/m3
Controlnot treated00
Chamber #1 (n = 10)240<35~37≒ (1.45~1.53) × 106
Chamber #2 (n = 10)200~24021~36≒ (8.68~14.88) × 105
Chamber #3 (n = 10)150~20018~20≒ (7.44~8.27) × 105
Chamber #4 (n = 10)100~15010~19≒ (4.13~7.85) × 105
Chamber #5 (n = 10)50~1005~11≒ (2.07~4.55) × 105
Chamber #6 (n = 10)20~502~6≒ (8.27~24.80) × 104
Table 2. Histopathological examination (xcoring).
Histopathological Examination of Lung
Alveolar cell edema/Intra-alveolar infiltration/Congestion/
Hemorrhage/Alveolar wall disruption
Scale from 0 to 3
0 = absence of pathology (<5% maximum pathology)
1 = mild (<10%)
2 = moderate (15–20%)
3 = severe (20–25%)
Leukocyte infiltrationSeverity of inflammation resulting from contusions
0 = no extravascular leukocytes
1 = <10 leukocytes
2 = 10~45 leukocytes
3 = 45< leukocytes
Table 3. Number of dead animals following high concentrations of single ClO2 gas inhalation.
MD1D2D3D4D5D6D7D8D9D10D11D12D13D14Total
NT000000000000000
*C-#110000000000000010
C-#26400000000000010
C-#38200000000000010
C-#43610000000000010
C-#5130000000000004
C-#6200000000000002
F
NT000000000000000
C-#110000000000000010
C-#2360000000000009
C-#3330000000000009
C-#4011000000000002
C-#5110000000000002
C-#6000000000000000
*C-#: Chamber number according to the distribution of ClO2 concentration by Dr.CLOTM; M = Male mice; F = Female mice; NT = Non-treated group.
Table 4. Statistics of various indices based on histopathological evaluation of the lungs from male mice.
MAlveolar
Edema
Intra-Alveolar InfiltrationCongestionAlveolar
Hemorrhage
DisruptionTotal Mean
Score
Leukocyte
Infiltration
NT0.30 ± 0.1530.00 ± 0.0000.00 ± 0.0000.00 ± 0.0000.00 ± 0.0000.06 ± 0.0600.60 ± 0.306
C-#11.44 ± 0.242 b,i1.89 ± 0.200 a,e2.00 ± 0.289 a,i1.67 ± 0.333 a,i1.11 ± 0.200 a1.62 ± 0.160 a2.44 ± 0.242 a,d
C-#21.30 ± 0.213 b1.20 ± 0.133 a1.90 ± 0.233 a,g1.70 ± 0.260 a,e0.80 ± 0.249a1.38 ± 0.193 c1.90 ± 0.277 a,e
C-#31.17 ± 0.307 b1.33 ± 0.333 a1.00 ± 0.447 a,d1.17 ± 0.477 a,d1.50 ± 0.563 b1.23 ± 0.085 c1.50 ± 0.342 a
C-#41.00 ± 0.149 b1.40 ± 0.163 a1.20 ± 0.249 a,h1.80 ± 0.291 b1.50 ± 0.269 b1.38 ± 0.136 c1.70 ± 0.213 b
C-#51.90 ± 0.314 c2.10 ± 0.233 a1.70 ± 0.423 a2.30 ± 0.335 a2.10 ± 0.348 a2.02 ± 0.102 c2.40 ± 0.163 a
C-#60.50 ± 0.189 a1.38 ± 0.183 a0.63 ± 0.263 c0.63 ± 0.263 a1.38 ± 0.324 a0.90 ± 0.196 c1.50 ± 0.189 b
a, p < 0.0005; b, p < 0.005; c, p < 0.05 vs. NT. d, p < 0.005; e, p < 0.01 vs. cage 5. g, p < 0.005; h, p < 0.01 and i, p < 0.05 vs. cage 6. C-#: Chamber number according to the distribution of ClO2 concentration by Dr.CLOTM; M = Male mice; NT = Non-treated group.
Table 5. Statistics of various indices based on histopathological evaluation of the lungs from female mice.
FAlveolar
Edema
Intra-Alveolar InfiltrationCongestionAlveolar
Hemorrhage
DisruptionTotal Mean
Score
Leukocyte
Infiltration
NT0.20 ± 0.1330.00 ± 0.0000.10 ± 0.1000.00 ± 0.0000.00 ± 0.0000.06 ± 0.0400.20 ± 0.133
C-#11.90 ± 0.314 b,f,h2.00 ± 0.258 b,f2.00 ± 0.258 a,h2.10 ± 0.233 a,f,h1.90 ± 0.233 a1.98 ± 0.037 c2.30 ± 0.153 a,d
C-#21.56 ± 0.338 b1.56 ± 0.176 b2.22 ± 0.278 a,g2.67 ± 0.167 a,d,g1.33 ± 0.289 a1.88 ± 0.252 c2.33 ± 0.167 a,e
C-#31.20 ± 0.200 b1.40 ± 0.221 c1.90 ± 0.379 c2.40 ± 0.306 a,e,g1.30 ± 0.396 a1.64 ± 0.225 c2.00 ± 0.298 a
C-#41.60 ± 0.245 b1.80 ± 0.200 a1.40 ± 0.600 a1.80 ± 0.583 b2.00 ± 0.632 a1.72 ± 0.102 c1.80 ± 0.200 b
C-#50.89 ± 0.261 c1.00 ± 0.167 b0.33 ± 0.236 b1.33 ± 0.236 a2.00 ± 0.333 a1.10 ± 0.277 c1.44 ± 0.176 a
C-#60.80 ± 0.2491.30 ± 0.260 c0.30 ± 0.213 c1.30 ± 0.153 a2.00 ± 0.258 a1.14 ± 0.284 c1.60 ± 0.340 b
a, p < 0.0005; b, p < 0.005; c, p < 0.05 vs. NT. d, p < 0.005; e, p < 0.01; f, p < 0.05 vs. cage 5. g, p < 0.005; h, p < 0.05 vs. cage 6. C-#: Chamber number according to the distribution of ClO2 concentration by Dr.CLOTM; F = Female mice; NT = non-treated group.
Table 6. Area percentage (%) of space occupied by the lumen of the alveolar sac per unit area.
Group (M)Area Percentage (%)Group (F)Area Percentage (%)
Non-treated58.17 ± 2.003Non-treated59.35 ± 2.451
Chamber #142.22 ± 3.411 aChamber #144.24 ± 3.241 b
Chamber #243.11 ± 1.791 aChamber #245.14 ± 2.984 b
Chamber #342.90 ± 1.835 aChamber #345.55 ± 2.225 b
Chamber #443.44 ± 2.495 aChamber #448.25 ± 2.332 b
Chamber #544.78 ± 3.427 cChamber #552.44 ± 2.551
Chamber #652.40 ± 2.604Chamber #655.32 ± 2.110
a, p < 0.0001; b, p < 0.0005; c, p < 0.005 vs. non-treated group.
Publisher’s Note: MDPI stays neutral with regard to jurisdictional claims in published maps and institutional affiliations.

