
Current and Future Methodology for Quantitation and Site-Specific Mapping the Location of DNA Adducts


1
Department Environmental and Occupational Health, Fay W. Boozman College of Public Health, University of Arkansas for Medical Sciences, Little Rock, AR 72205, USA
2
The Winthrop P. Rockefeller Cancer Institute, University of Arkansas for Medical Sciences, Little Rock, AR 72205, USA
3
Department Biomedical Informatics, College of Medicine, University of Arkansas for Medical Sciences, Little Rock, AR 72205, USA
*
Author to whom correspondence should be addressed.
Toxics 2022, 10(2), 45; https://0-doi-org.brum.beds.ac.uk/10.3390/toxics10020045
Submission received: 13 December 2021
/
Revised: 12 January 2022
/
Accepted: 15 January 2022
/
Published: 19 January 2022
(This article belongs to the Special Issue DNA Adducts for Characterization of Exposure)
Abstract
:Formation of DNA adducts is a key event for a genotoxic mode of action, and their presence is often used as a surrogate for mutation and increased cancer risk. Interest in DNA adducts are twofold: first, to demonstrate exposure, and second, to link DNA adduct location to subsequent mutations or altered gene regulation. Methods have been established to quantitate DNA adducts with high chemical specificity and to visualize the location of DNA adducts, and elegant bio-analytical methods have been devised utilizing enzymes, various chemistries, and molecular biology methods. Traditionally, these highly specific methods cannot be combined, and the results are incomparable. Initially developed for single-molecule DNA sequencing, nanopore-type technologies are expected to enable simultaneous quantitation and location of DNA adducts across the genome. Herein, we briefly summarize the current methodologies for state-of-the-art quantitation of DNA adduct levels and mapping of DNA adducts and describe novel single-molecule DNA sequencing technologies to achieve both measures. Emerging technologies are expected to soon provide a comprehensive picture of the exposome and identify gene regions susceptible to DNA adduct formation.
1. Introduction
Although DNA is a very stable molecule for storing biological information, it is under relentless attack by reactive compounds of endogenous and exogenous origin that covalently bind to DNA, forming so called DNA adducts [1]. Since identification of the first DNA adduct by Reiner and Zamenhof in 1957 [2], several thousand studies on DNA adducts have been reported and were reviewed from different perspectives [3,4,5,6,7,8,9,10]. The ability of a compound to form DNA adducts, directly or after metabolic activation, is considered a critical event in chemical carcinogenesis [11] and a key event for the genotoxic mode of action of toxicants [12,13]. The binding to DNA has been widely used as biomarker of exposure in molecular epidemiology studies to link exposure to adverse health outcomes [14,15,16]. Formation and stability of specific promutagenic DNA adducts has been established in vitro, in cell cultures, animal experiments, and molecular epidemiology studies [5,6,17]. Recent advances in technology, especially in mass spectrometry, allows for ‘omics’ type monitoring of DNA adducts, DNA adductomics, and is expected to provide unprecedented insight into the total exposome [18,19,20,21].
This communication summarizes the current methodologies for quantitation of DNA adduct levels and mapping the location of DNA adducts along the genome and highlights novel single-molecule analysis expected to be capable of achieving both measures.
2. Methodology
Historically, studies on DNA adducts have mirrored advances in analytical and bioanalytical chemistry technologies, starting with paper chromatography, enzyme-linked immunosorbent assay [22,23] and 32P-Post-labeling [24] and followed by liquid [25] and gas chromatography separations with various detection systems, including UV, fluorescence, and electrochemical detectors [26,27].
2.1. Mass Spectrometry-Based DNA Adduct Quantitation
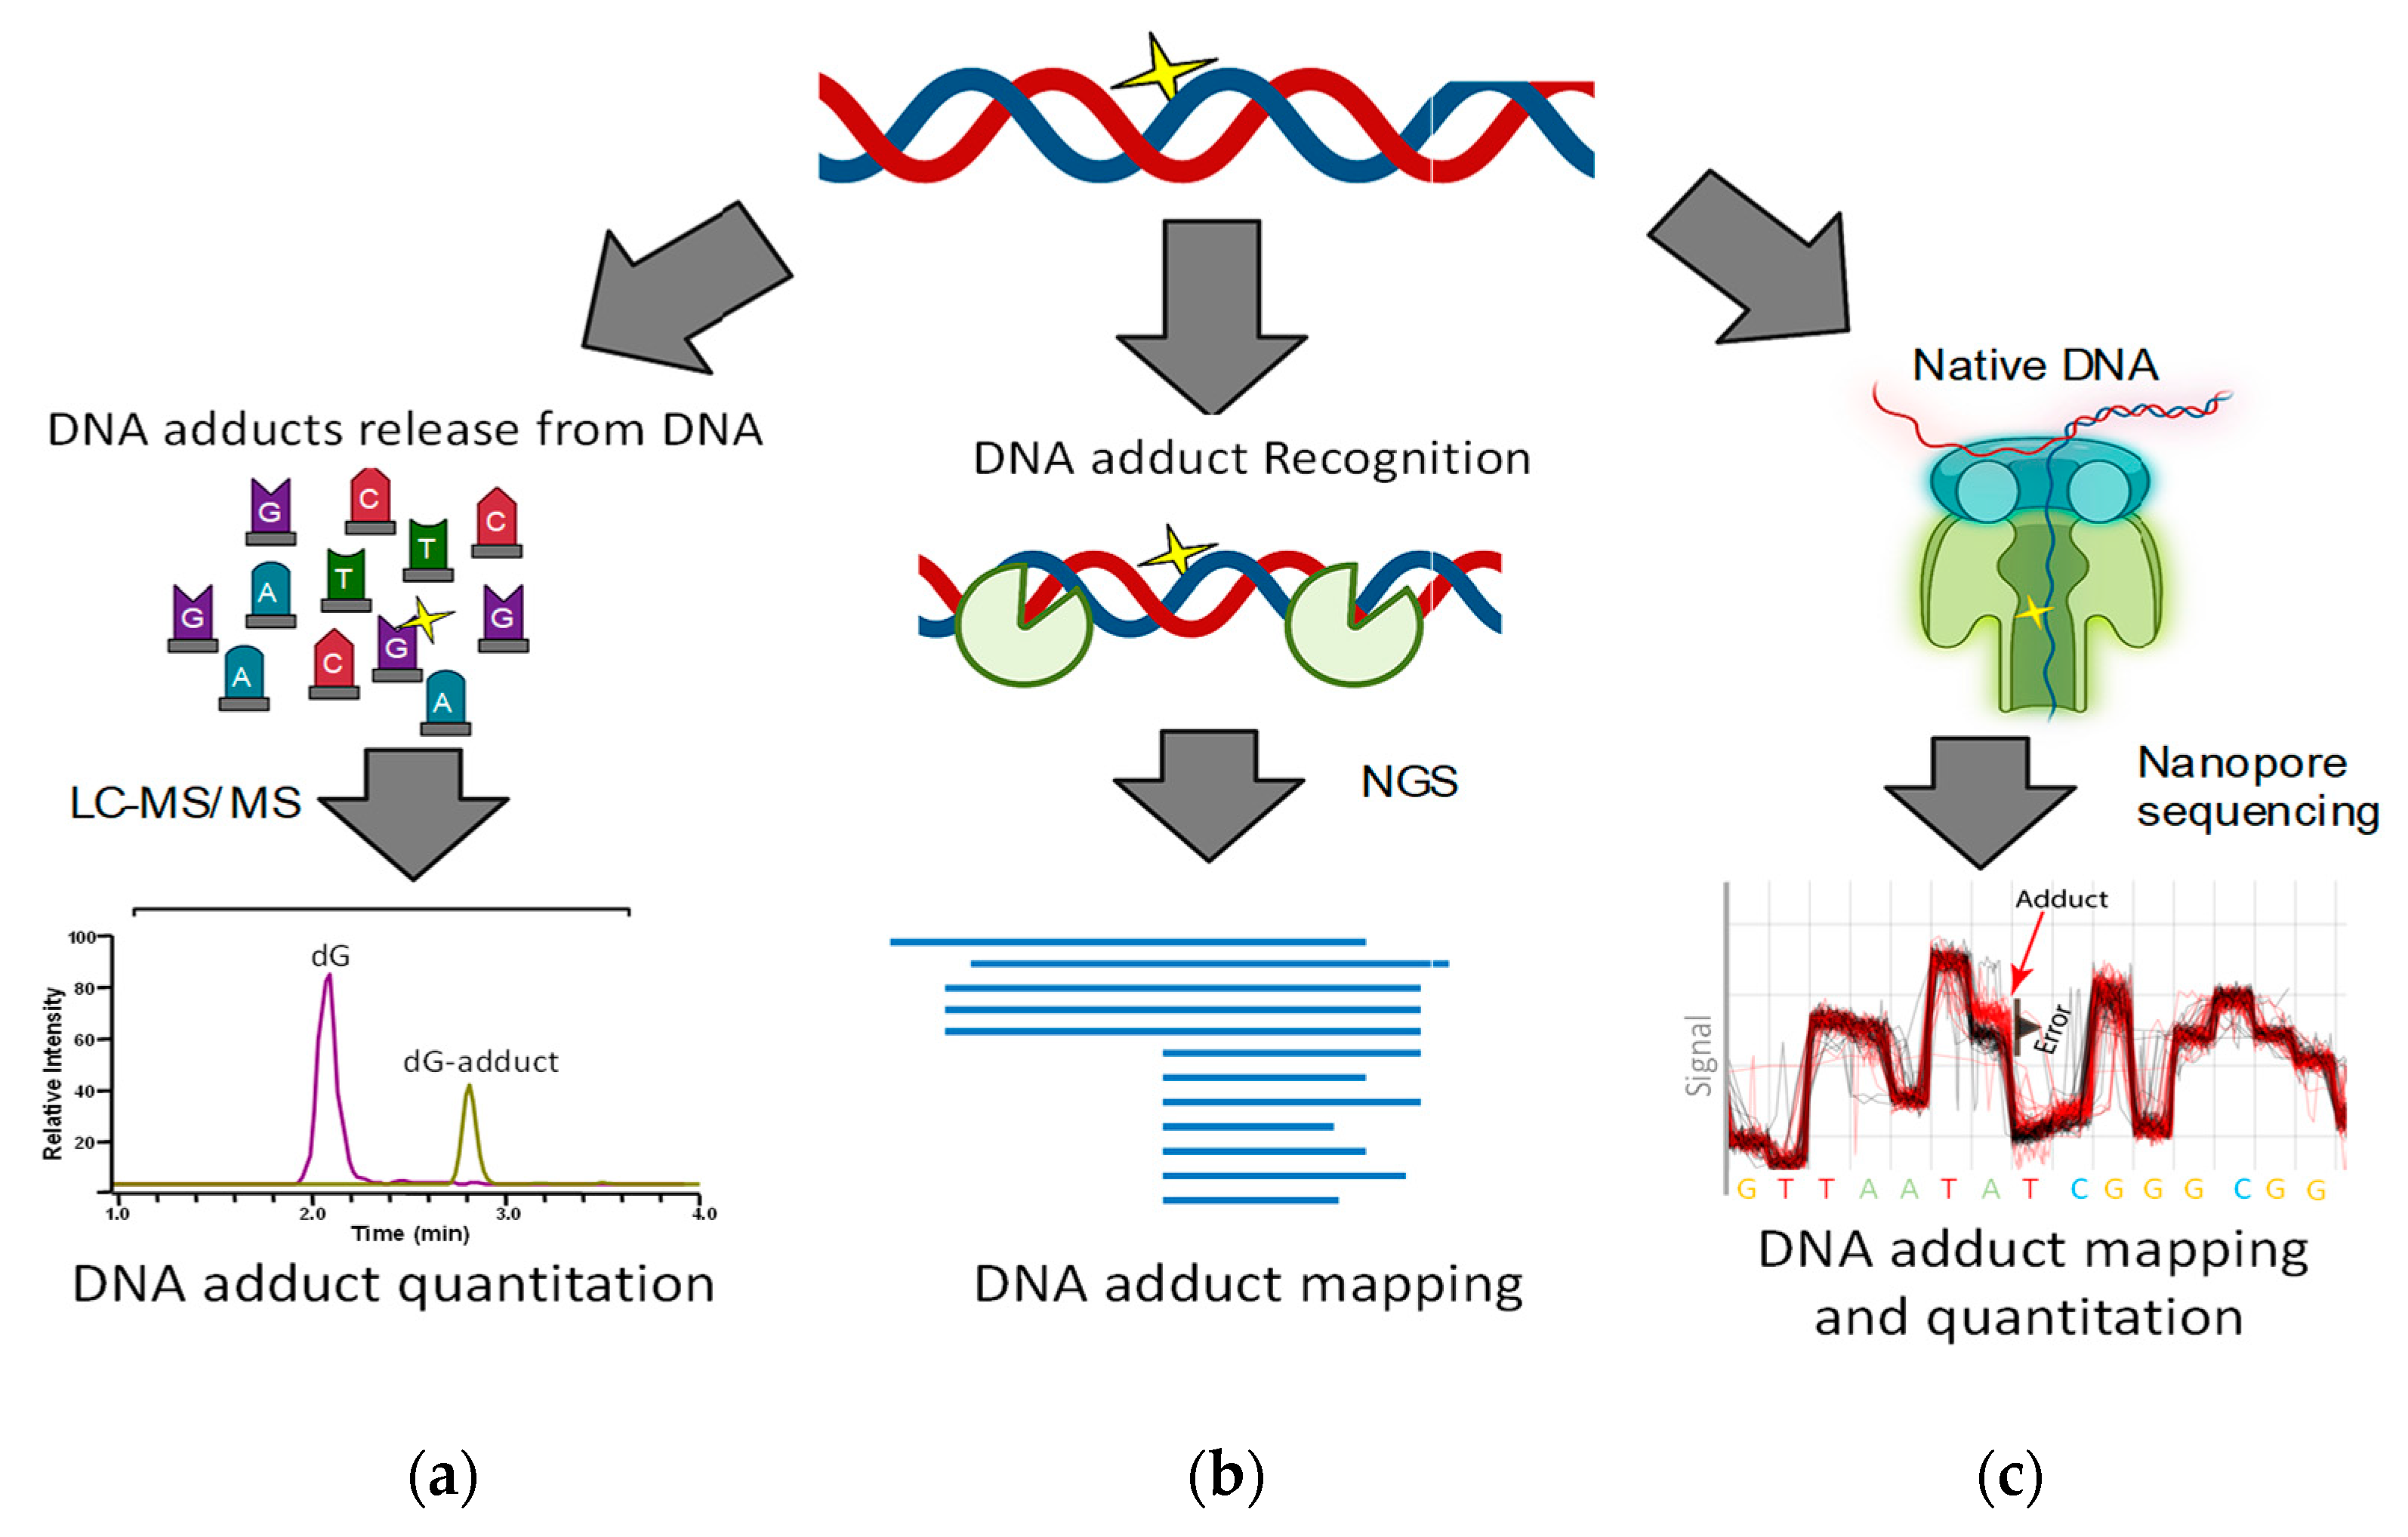
The introduction of electrospray ionization by Dole and others in 1968 [28] and its subsequent application to proteins by Fenn et al. in 1990 revolutionized biochemistry [29]. Electrospray ionization coupled with mass-spectrometry is now a commonly used technique for qualitative and quantitative analyses of many types of compounds, including DNA adducts [26,27]. Improvements in mass analyzers allows monitoring of thousands of molecules simultaneously with ultra-high mass resolution and accuracy [30,31,32,33]. The basic and most frequently used approach for quantitation of DNA adducts is to isolate DNA, liberate the DNA adducts from DNA by chemical means or enzyme hydrolysis, and quantitate the released 2′-deoxyribonucleoside- and nucleobase-adducts by LC-MS (Scheme 1a) [34]. To improve sensitivity and measurement accuracy, various sample enrichment procedures maybe included such as solid phase and liquid–liquid extraction or pre-separation by HPLC [3], and stable isotope standards are added at the beginning to account for any potential loss during sample workup [35,36,37,38].
2.2. Adductomics, Nontargeted and Qualitative Screening of DNA Adducts
While most studies apply targeted mass spectrometry using authentic DNA adduct standards, efforts are underway to move towards nontargeted ‘omics’ type screening of DNA adducts to obtain a complete measure of the exposome [39]. Therefore, DNA adducts are monitored in various modes of data-dependent or multistage (MSn) scanning modes [19,40]. DNA adductomics methods have been reviewed extensively [18,20,32,37].
Independent of a targeted or nontargeted approach, results are reported as number or concentration of DNA adducts per DNA, or the corresponding unmodified 2′-deoxyribo-nucleosides (e.g., fmol/mg DNA, fmol/µmol dG). The mass spectrometry-based detection provides a high level of chemical specificity but no site-specificity.
2.3. Amplification-Based Mapping of DNA Adducts
Various methods have been developed for genome-wide and site-specific mapping of DNA damage. The general approach is based on mapping sequencing stop sites to localize the adducts [41,42,43]. Therefore, DNA adducts are first recognized or modified by enzymatic or chemical means, taking advantage of DNA repair enzymes to mark and excise DNA adducts (Scheme 1b). The marked or cleaved DNA is then amplified and sequenced and the location of DNA adducts are obtained from strand ends or mismatched base pairs [41,42,43].
For example, Denissenko et al. used UvrABC excision nuclease, in combination with ligation-mediated polymerase chain reaction (PCR) to map the sites of bulky DNA adducts [44,45,46]. More recently, cyclobutene pyrimidine dimers (CPDs) were mapped using immunoprecipitation based DIIP assay [21] or CPD-seq utilizing DNA cleavage mediated by T4 endonuclease V and APE1 [47,48]. XR-seq [49] and tXR-seq rely on TFIIH-mediated enrichment of damage-containing fragments cleaved by mammalian nucleotide excision repair enzymes [50,51,52]. Cisplatin-seq takes advantage of the HMG box A of HMGB1 protein’s preferentially binding to distorted DNA structures for selective enrichment of cisplatin-modified DNA [53]. Further, click chemistry, Click-Code-Seq, has been successfully applied to label 8-oxo-7,8-dihydroguanine (8-oxo-dG) or 5-hydroxymethylcytosine (5hmdC) sites in DNA prior to next-generation sequencing [54,55]. DNA adduct mapping methods have been reviewed extensively [56,57,58].
Results are given as modified versus unmodified sites or motifs with high level of site-specificity. Unfortunately, these elegant methods are limited by (i) the breadth of enzyme specificity, which may identify a mixture of DNA adducts; (ii) excision of short DNA fragments that sometimes cannot be aligned with absolute certainty; (iii) reliance on completion of chemical reactions; (iv) restricted applicability to one type or class of DNA adducts; (v) the inability to distinguish different DNA adducts; (vi) limited chemical specificity; and (vii) lack of antibodies with suitable specificity for the adducts of interest.
2.4. Single Molecule DNA Sequencing
A relatively new method for analysis of DNA adducts is based on single molecule sequencing. This novel technology sequences and counts single DNA molecules, whether they are whole genomes or DNA fragments.
2.4.1. Nanopore Technology
Nanopore-type technology utilizes electrochemical forces to pull single-stranded DNA in native form through tiny pores (Scheme 1c). The accompanying changes in electric current indicate the physicochemical properties of the DNA nucleobases transiting through the pore, revealing the DNA sequence and potential DNA adducts [59]. A DNA adduct modulates the nanopore ion current signal while entering, passing through, and exiting the nanopore. This results in an electric current signature characteristic for the DNA adduct within a given 7-base sequence that includes the DNA adduct and the three adjacent 3′ and 5′ nucleotides that reside in the nanopore [59].
Burrows and colleagues pioneered the application of nanopore-type technology for sequencing DNA adducts in single-stranded DNA. With custom-made solid-state or protein-based nanopores, they showed the proof-of-principle for detecting N2-BPDE-dG-induced adducts [60], abasic sites [61,62,63], and other DNA adducts [64], including 8-oxo-dG [65,66,67].
Oxford Nanopore Technologies (ONT)
PacBio DNA Sequencer
While technically not a nanopore system, the PacBio RSII DNA sequencer also employs the single-molecule real-time (SMRT) sequencing principle. The DNA strands are converted into loops and amplified by a polymerase. The unique time needed by the polymerase for elongation of the DNA is indicative of the base added and DNA sequence.
2.4.2. Data Types and Analyses
While ONT uses the disturbance in the ion signals, the PacBio system makes use of the time delay of the polymerase to identify the DNA sequence. The standard base calling algorithms for both systems are optimized for the four main nucleobases (A, T, G, and C), and report errors when encountering unknown bases, potential DNA adducts. Therefore, efforts are under way to expand base calling algorithms to enable detection of DNA adducts and epigenetic modifications. Multiple groups successfully applied ONT for genome-wide detection of epigenetic modifications, such as 5-methyl-2′-deoxycytidine (5 mdC) and N6-methyl-2′-deoxyadenosine (N6 mdA) [71,72,73,74]. Similarly, the PacBio system has been shown to be suitable for simultaneous detection of N6 mdA, 5mdC, and 5hmdC [75]. The latter, is also capable for detection of the unique phosphothioate modifications of the phospho-ribose backbone, found in some bacteria [76,77]. Expansion of these commercial platforms to high abundant epigenetic marks is the first step to enable them to detect any DNA modifications, including DNA adducts derived from endogenous or exogenous sources.
ONT/ELIGOS
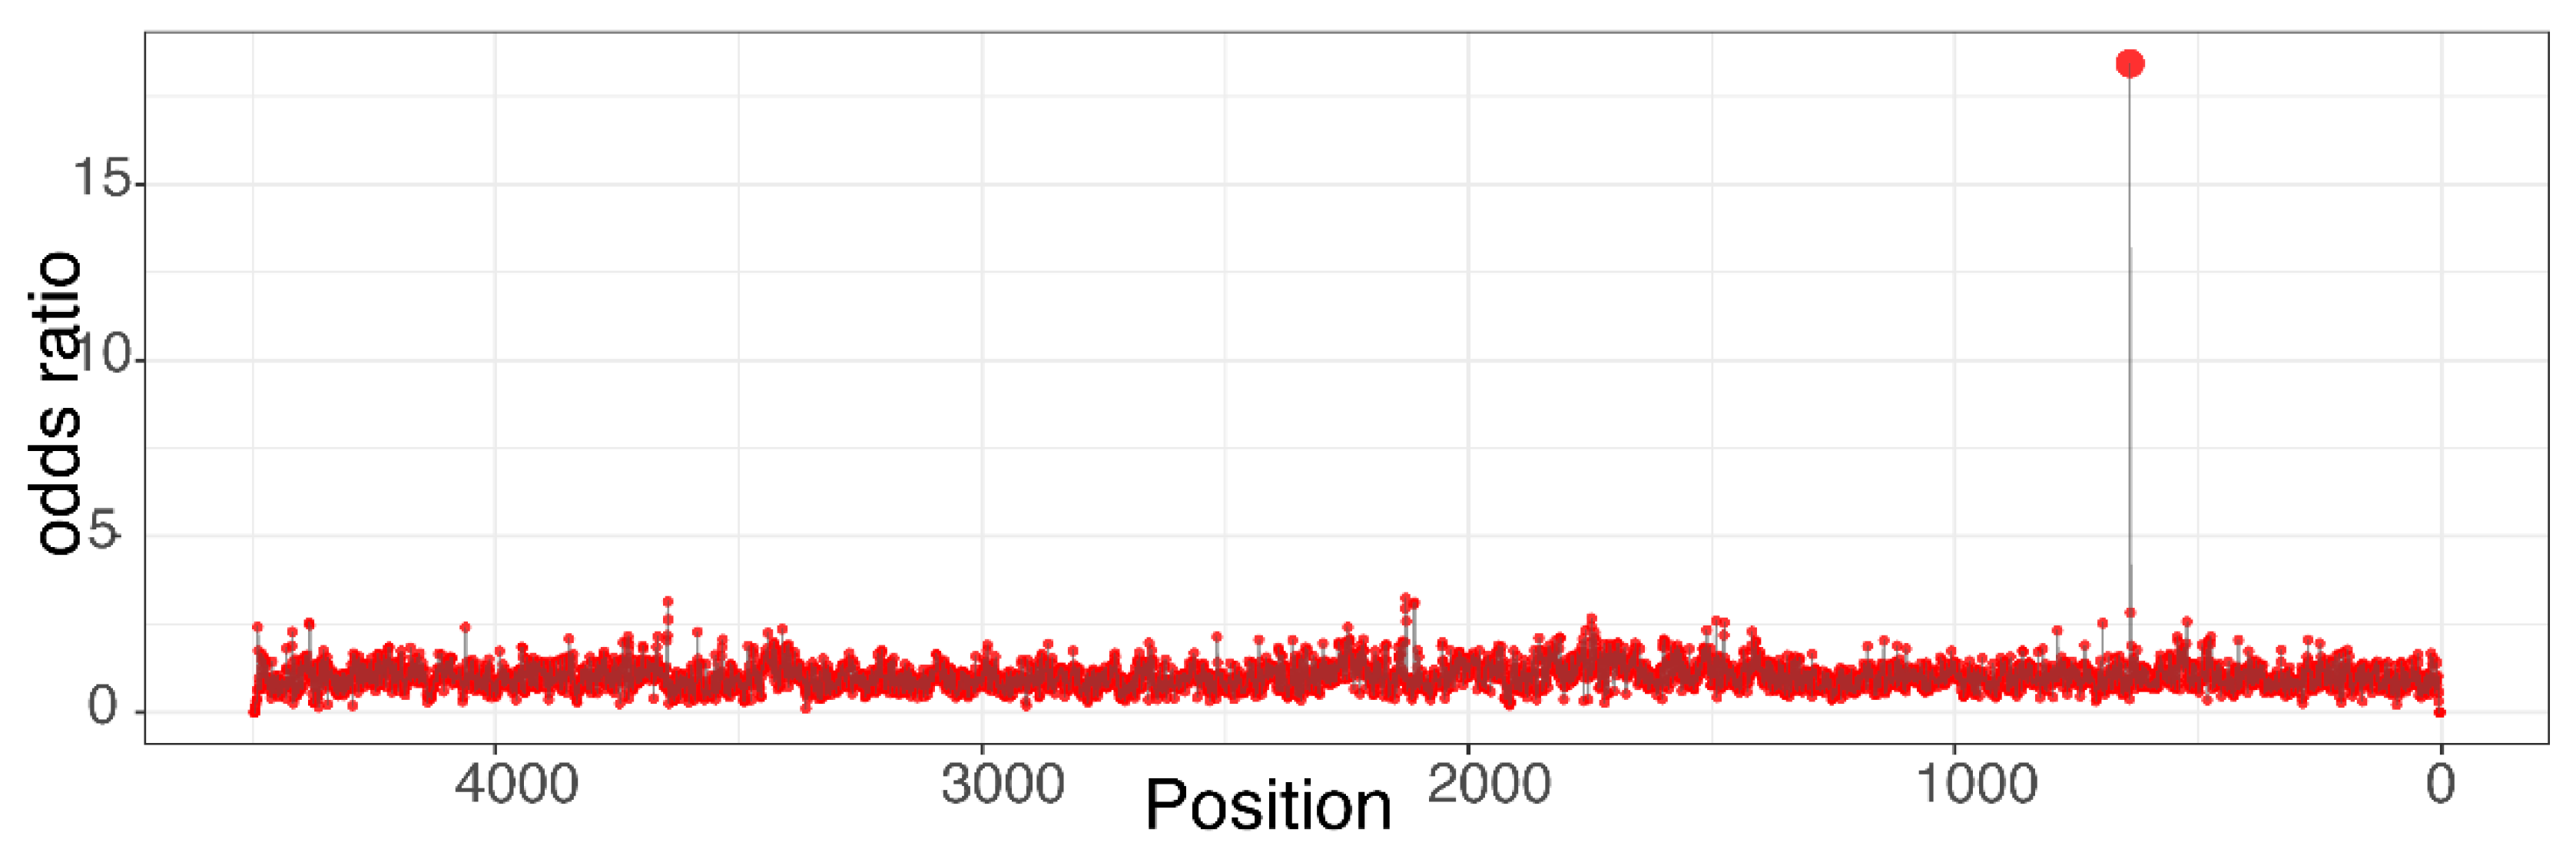
Our team developed the Epitranscriptional/Epigenomical Landscape Inferring from Glitches of ONT Signals (ELIGOS) software that uses ONT data to simultaneously detect RNA and DNA modifications, including DNA adducts [59,78,79]. The ONT/ELIGOS platform is a powerful tool for (i) detecting DNA adducts and (ii) discriminating DNA adducts of different sizes, regiochemistry, and functional groups [59]. ELIGOS takes the error information from the standard base-calling algorithm and calculates the odds ratios at each site as an indicator for a potential DNA adduct (Figure 1) [59].
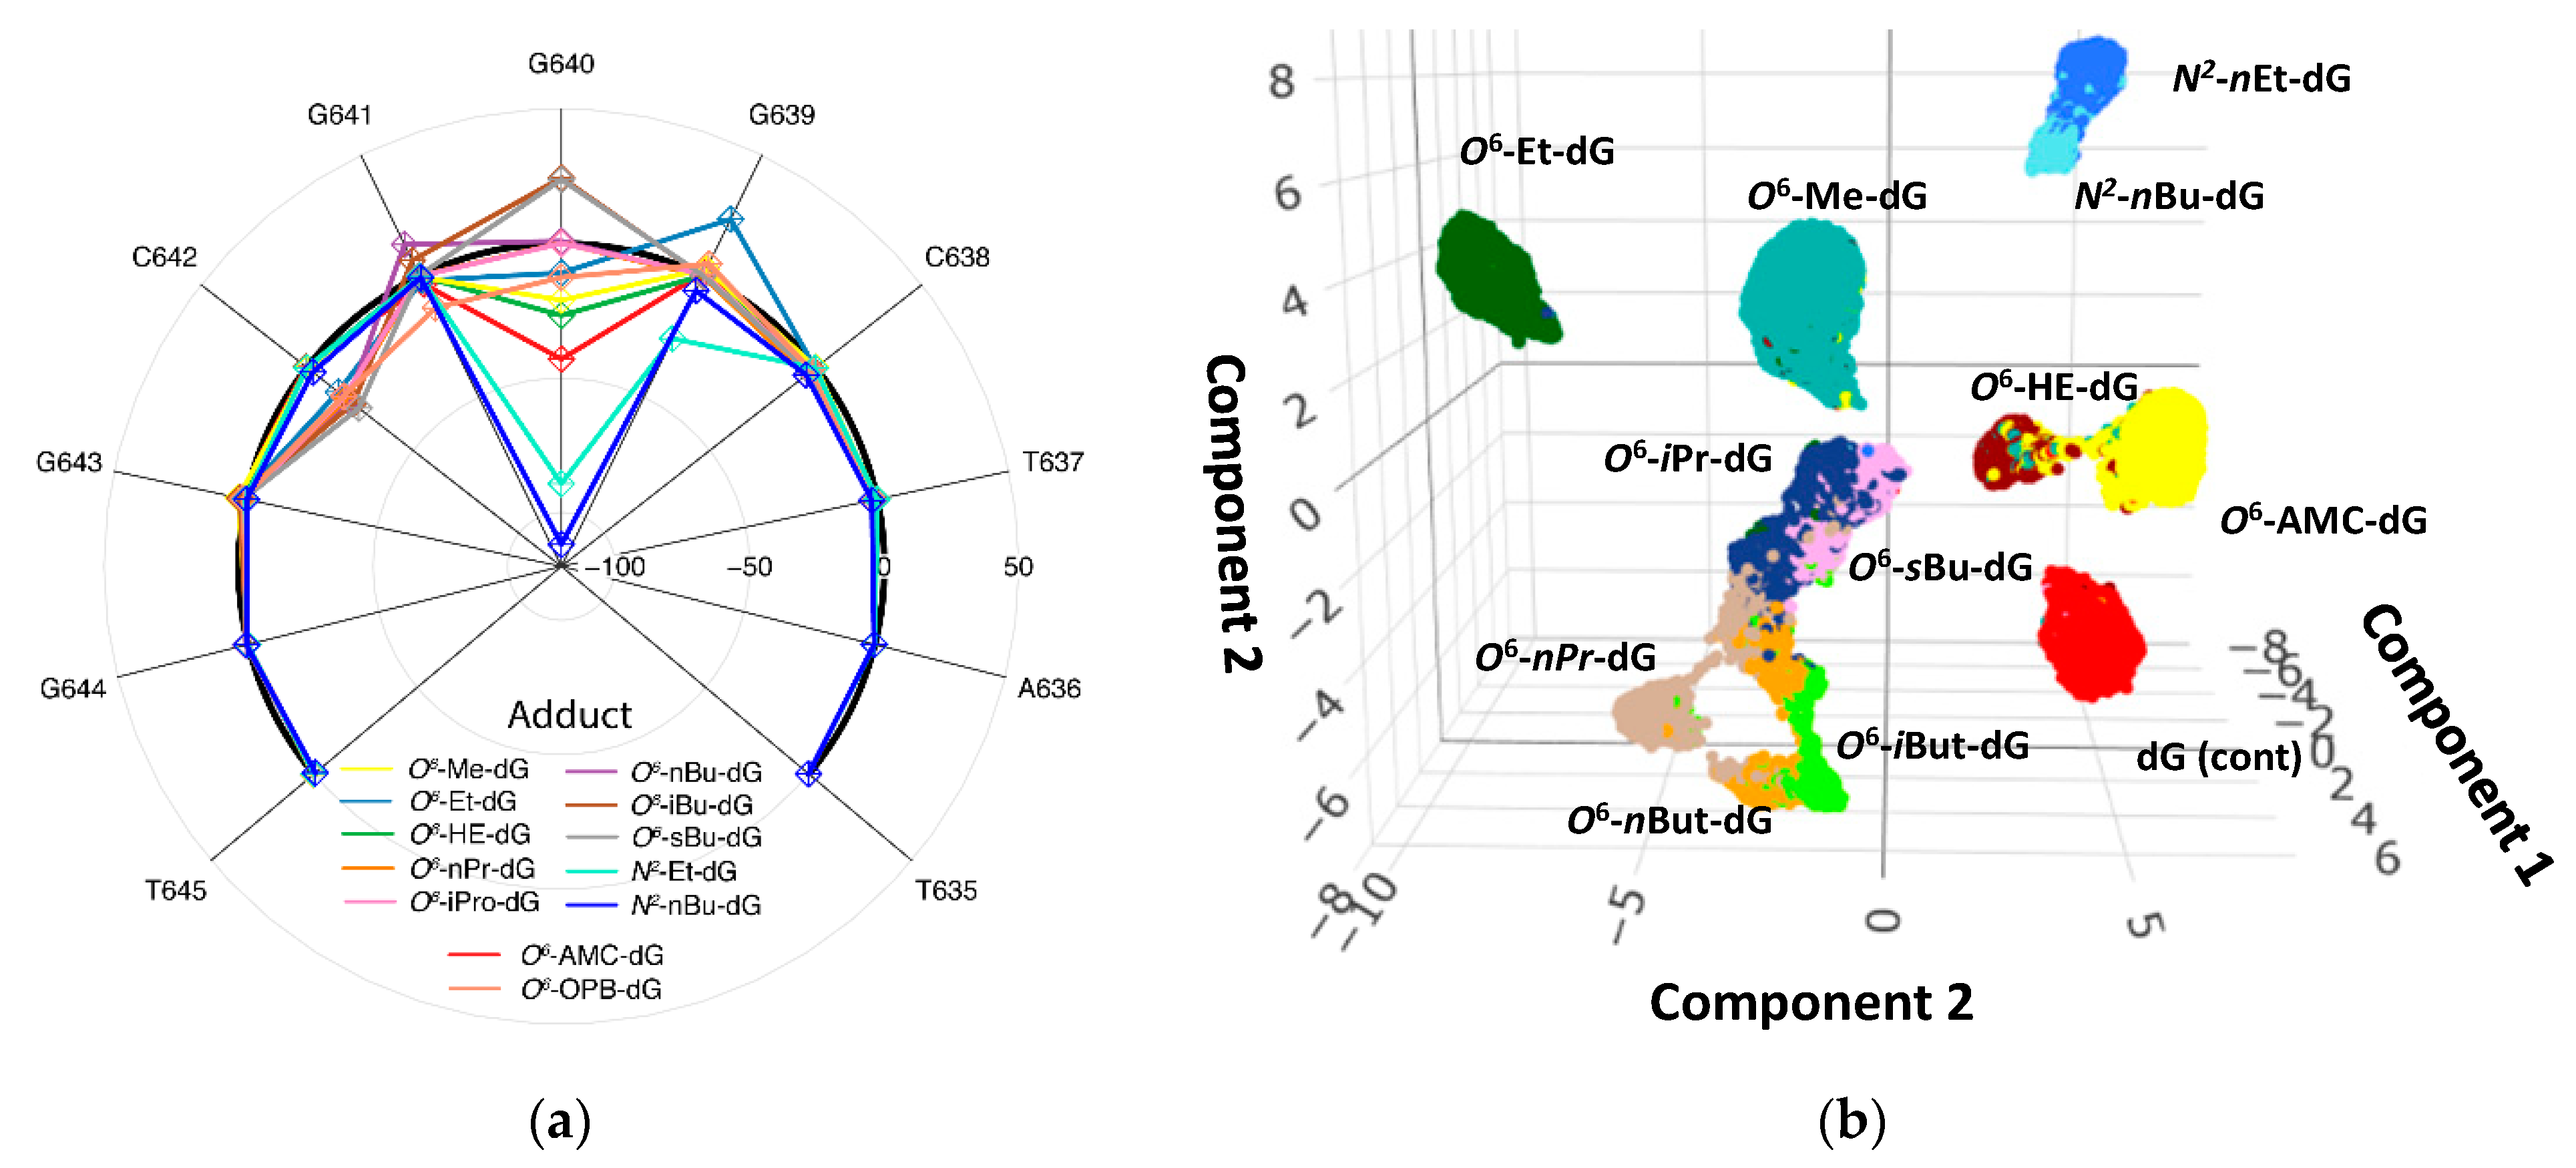
Next, ELIGOS generates a radar plot displaying the multiplex disturbances of the re-squiggled ONT signal from the DNA adduct in relationship to the dG-containing control plasmid (Figure 2a) [59]. The radar plot shows an 11-base sequence that covers the DNA adduct along with five preceding and five trailing deoxynucleotides that dwell in the nanopore during sequencing [59,80]. These radar plots are characteristic of each DNA adduct at each given position. The radar plots are used to identify the type of DNA adduct by comparing them with plots of standard DNA that contains the DNA adduct at the same sequence position and within the same sequence context (Figure 2a). Disturbances in the raw ONT signal are used for multivariant statistical analyses to obtain a measure of separation, as shown in Figure 2b.
2.4.3. CRISPR/cas-9 Targeted Sequencing
DNA adduct measurement by single molecule sequencing technologies will generate a huge amount of data because the DNA adduct levels are extremely low. In principle, one would need to sequence the whole genome 108 times to get a DNA adduct level at each site of 1 adduct/108 unmodified 2′-deoxyribonucleosides (nnt) as commonly reported. However, drawing from previous mapping approaches using CRISPR/cas-9, targeted sequencing will increase the number of reads and thereby sensitivity at the sites of interest such as mutation hotspots or cancer driver genes [81,82,83]. The CRISPR/cas-9 targeted sequencing may target DNA segments of 1000 to 10,000 base pairs in length that can be read by ONT as a single molecule.
2.4.4. Limit of Detection
The results of these single molecule analyses are number of DNA adduct X at Site Y per total number of DNA molecules / DNA molecules analyzed containing the site of interest, including unmodified DNA and DNA molecules carrying mutations or modification at different sites. In theory, a DNA segment of 2000 base pairs length that has been read 100,000 times has a limit of detection of
- one adduct at a given site/per 105 unmodified bases at position Y (e.g., alkyl-dG/105 dG at position Y);
- five adducts per 109 unmodified nucleotides (e.g., alkyl-dG/109 nnt);
- or approximately one adduct per 109 corresponding nucleotides (e.g., alkyl-dG/109 dG).
These theoretical limits of detection of ONT/ELIGIOS are in the range of the levels reported for endogenous and exogenous DNA adducts.
3. Discussion
Below we highlight some selected studies showing the application and utility of DNA adduct research.
3.1. DNA Adduct Levels
The first question in the DNA adduct field was, and still is, to demonstrate the formation of exposure-induced DNA adducts. For example, benzo[a]pyrene (B[a]P), a ubiquitous environmental and occupational carcinogen and a tobacco smoke constituent has been studied extensively. B[a]P requires metabolic activation to the reactive 7,8,-diepoxy-9,10-dihydroxy-benzo[a]pyrene (BPDE) that ultimately forms the promutagenic N2-BPDE-dG adduct. Applying an ultra-sensitive LC-MS method, with a limit of detection of 1 N2-BPDE-dG adduct per 1011 nucleotides (1 adduct per about 30 human cells) levels in lung DNA of smokers and nonsmokers were 3.1 and 1.3 N2-BPDE-dG adducts per 1011 nucleotides, respectively [84].
With increases in sensitivity of the methodologies, it became apparent that DNA adducts are also formed by reactive compounds of endogenous origin, such as the N7-(2-hydroxyethyl) guanine [85,86], 1,N6-ethenodeoxyadenosine(edA), 3,N4-ethenodeoxycytosine (εdC), and N2,3-ethenoguanine(εG) [87,88]. In addition, oxidatively generated modifications of DNA have been shown to be present in all cellular DNA [89,90]. The discrepancies in levels of 8-oxo-dG determined by different methods were attributed to artifacts leading to an over-estimation of the true levels. To address this issue, the European Standards Committee on Oxidative DNA Damage (ESCODD) initiated an elegant multi-laboratory comparison study to build consensus [91,92]. Ten laboratories quantitated 8-oxodG in DNA from HeLa cells and established a background level of 1 to 4 8-oxo-dG per 106 dG [92,93]. Endogenous 8-oxo-dG in human peripheral blood lymphocytes measured by LC-MS are about one 8-oxo-dG per 106 dG [89,94,95]. Consequently, endogenous 8-oxo-dG levels are 5 orders of magnitude higher than the exposure-derived N2-BPDE-dG [84].
Most studies are on base adducts, potentially disrupting the DNA base paring. However, adduct formation at the phosphor-ribose backbone was proposed long ago and has recently been shown for DNA-phosphate adducts formed by the tobacco-specific nitrosamine 4-(methylnitrosamino)-1-(3-pyridyl)-1-butanone [96].
3.2. DNA Adductomics
The emergence of nontargeted adductomics will generate a huge amount of DNA adduct data, presumably representing the exposome. Studies of true DNA adductomics are limited, but first reports are very promising. For example, applying a nontargeted ‘omics’ approach, thousands of potential DNA adduct m/z features were observed in human tissues such as lung, bronchia, or saliva [97,98,99]. A challenging task will be to accurately identify the low abundant DNA adducts resulting from exogenous sources that are dwarfed by epigenetic marks and endogenous DNA adducts that are present at levels several orders of magnitude higher [100,101].
3.3. DNA Adduct Mapping
The second question in the DNA adduct field was, and still is, to determine the location of exposure-induced DNA adducts. Therefore, the mapping of B[a]P-derived DNA adducts has been reported genome-wide [60] and for specific genes such as P53 [102], kRAS, and hRAS [103], suggesting DNA adduct formation at mutation hotspots in these genes. B[a]P treatment however has been shown to also induce oxidative stress, which is known to cause multiple DNA lesions recognized by the UvrABC Nuclease, potentially confounding the results [104]. Elegant stable isotope-labeled experiments confirmed the preferred binding of BPDE to the mutation hotspot sequence motif in TP53 [105].
Further, several approaches have been developed for genome-wide mapping of 8-oxo-dG with various degrees of resolution (reviewed by Poetsch [58]). The mapping revealed accumulation of 8-oxo-dG at sites of high nucleosome occupancy in yeast, and different types of GC repeats accumulate large amounts of 8-oxo-dG, particularly telomeres and microsatellites [54], suggesting that DNA adduct formation is not random across the genome. These DNA adduct mapping studies highlight the importance of the DNA adduct location to elucidate subsequent biological outcomes.
3.4. Single Molecule DNA Sequencing
The current nanopore-type Single Molecule DNA Sequencing technologies do not reach the chemical specificity obtained by mass spectrometry, but efforts are underway to combine nanopore with mass spectrometry [106,107,108]. Further, since the ion signal disturbances are caused by physio-chemical properties of the DNA molecule transitioning the nanopore, refined artificial intelligence (AI)-assisted data analyses may allow chemically specific identifications of the DNA adducts at any location in the genome. This novel technology is still in the implementation phase, and future studies are needed to evaluate and establish chemical specificity, sensitivity, and accuracy for measuring DNA adducts. It is conceivable that the ONT and PacBio platforms are unsuitable for measuring interstrand crosslinks because they are both sequencing single-stranded DNA. Therefore, efforts and developments are on the way to use wider pores to perform sequencing of double-stranded DNA [109,110,111]. Crosslinks of DNA to whole proteins will probably not work with this new technology.
4. Conclusions
With the current technologies on hand, it is easy to determine whether DNA adducts form in the target tissue to establish the internal dose derived from external exposure. When the goal is to understand the exposome, mass spectrometry-based adductomics is the method of choice. Detection and quantitation of DNA adducts derived from a mixture of pollutants in the target tissue will unambiguously demonstrate, with high chemical specificity, that the subject has been exposed and that the toxicant has reached the tissue of concern.
If the goal is to understand how exposure leads to changes in cell homeostasis and promotes or prevents disease development, many DNA adduct mapping approaches are available. These mapping methodologies will enable the investigator to demonstrate, with biological specificity, that the exposure or treatment induces modifications in the DNA at the promotor or gene region of interest.
The new Single Molecule DNA Sequencing technologies are expected to be suitable for addressing both questions mentioned above simultaneously. They will provide a comprehensive picture of the DNA adducts types, levels, and their locations across the nuclear and mitochondrial genome.
Lastly, the previous paradigm of increased DNA adducts being equal to increased risk for mutations and cancer need to be revisited since DNA adduct locations may be the driving indicator for cancer risk. If so, we need a better understanding of site-specific effects of DNA adducts on DNA structure and function, epigenetic marks, and subsequent gene expressions associated with disease development. Therefore, a novel approach is needed for meaningful interpretation of the DNA adductome-based exposomes and future DNA adduct maps to improve our understanding of cancer etiology and explain the origin of mutational signatures established for various tumor types [112].
Author Contributions
This commentary was conceptualized by G.B. The original draft was prepared by G.B. and reviewed by I.N., who prepared the figures and visualizations. All authors have read and agreed to the published version of the manuscript.
Funding
The National Institute of General Medical Sciences of the National Institutes of Health (P20GM125503).
Institutional Review Board Statement
Not applicable.
Informed Consent Statement
Not applicable.
Data Availability Statement
Not applicable.
Acknowledgments
We are thankful to David Ussery for careful review of the manuscript and constructive comments.
Conflicts of Interest
The authors declare no conflict of interest.
References
- Swenberg, J.A.; Lu, K.; Moeller, B.C.; Gao, L.; Upton, P.B.; Nakamura, J.; Starr, T.B. Endogenous versus Exogenous DNA Adducts: Their Role in Carcinogenesis, Epidemiology, and Risk Assessment. Toxicol. Sci. 2011, 120, S130–S145. [Google Scholar] [CrossRef] [PubMed]
- Reiner, B.; Zamenhof, S. Studies on the Chemically Reactive Groups of Deoxyribonucleic Acids. J. Biol. Chem. 1957, 228, 475–486. [Google Scholar] [CrossRef]
- Hwa Yun, B.; Guo, J.; Bellamri, M.; Turesky, R.J. DNA Adducts: Formation, Biological Effects, and New Biospecimens for Mass Spectrometric Measurements in Humans. Mass Spectrom. Rev. 2020, 39, 55–82. [Google Scholar] [CrossRef]
- Tarun, M.; Rusling, J.F. Measuring DNA Nucleobase Adducts Using Neutral Hydrolysis and Liquid Chromatography-Mass Spectrometry. Crit. Rev. Eukaryot. Gene Expr. 2005, 15, 295–316. [Google Scholar] [CrossRef]
- Boysen, G.; Hecht, S.S. Analysis of DNA and Protein Adducts of Benzo[a]Pyrene in Human Tissues Using Structure-Specific Methods. Mutat. Res. 2003, 543, 17–30. [Google Scholar] [CrossRef]
- Boysen, G.; Pachkowski, B.F.; Nakamura, J.; Swenberg, J.A. The Formation and Biological Significance of N7-Guanine Adducts. Mutat. Res. 2009, 678, 76–94. [Google Scholar] [CrossRef] [Green Version]
- Van Zeeland, A.A. Molecular Dosimetry of Chemical Mutagens. Relationship between DNA Adduct Formation and Genetic Changes Analyzed at the Molecular Level. Mutat. Res. 1996, 353, 123–150. [Google Scholar] [CrossRef]
- De Bont, R.; van Larebeke, N. Endogenous DNA Damage in Humans: A Review of Quantitative Data. Mutagenesis 2004, 19, 169–185. [Google Scholar] [CrossRef] [PubMed] [Green Version]
- Rundle, A. Carcinogen-DNA Adducts as a Biomarker for Cancer Risk. Mutat. Res. 2006, 600, 23–36. [Google Scholar] [CrossRef] [PubMed]
- Bartsch, H. DNA Adducts in Human Carcinogenesis: Etiological Relevance and Structure-Activity Relationship. Mutat. Res. 1996, 340, 67–79. [Google Scholar] [CrossRef]
- Harris, C.C. Chemical and Physical Carcinogenesis: Advances and Perspectives for the 1990s. Cancer Res. 1991, 51, 5023s–5044s. [Google Scholar]
- Harvey, R.G. Historical Overview of Chemical Carcinogenesis. In Chemical Carcinogenesis; Penning, T.M., Ed.; Humana Press: Totowa, NJ, USA, 2011; Volume 6, pp. 1–26. ISBN 9781617379949. [Google Scholar]
- Hartwig, A.; Arand, M.; Epe, B.; Guth, S.; Jahnke, G.; Lampen, A.; Martus, H.-J.; Monien, B.; Rietjens, I.M.C.M.; Schmitz-Spanke, S.; et al. Mode of Action-Based Risk Assessment of Genotoxic Carcinogens. Arch. Toxicol. 2020, 94, 1787–1877. [Google Scholar] [CrossRef] [PubMed]
- La, D.K.; Swenberg, J.A. DNA Adducts: Biological Markers of Exposure and Potential Applications to Risk Assessment. Mutat. Res. 1996, 365, 129–146. [Google Scholar] [CrossRef]
- Phillips, D.H. DNA Adducts as Markers of Exposure and Risk. Mutat. Res./Fundam. Mol. Mech. Mutagenesis 2005, 577, 284–292. [Google Scholar] [CrossRef]
- Poirier, M.C. DNA Adducts as Exposure Biomarkers and Indicators of Cancer Risk. Environ. Health Perspect. 1997, 105 (Suppl. 4), 907–912. [Google Scholar]
- Pottenger, L.H.; Boysen, G.; Brown, K.; Cadet, J.; Fuchs, R.P.; Johnson, G.E.; Swenberg, J.A. Understanding the Importance of Low-Molecular Weight (Ethylene Oxide- and Propylene Oxide-Induced) DNA Adducts and Mutations in Risk Assessment: Insights from 15 Years of Research and Collaborative Discussions. Environ. Mol. Mutagenesis 2019, 60, 100–121. [Google Scholar] [CrossRef] [PubMed] [Green Version]
- Balbo, S.; Turesky, R.J.; Villalta, P.W. DNA Adductomics. Chem. Res. Toxicol. 2014, 27, 356–366. [Google Scholar] [CrossRef] [PubMed]
- Walmsley, S.J.; Guo, J.; Wang, J.; Villalta, P.W.; Turesky, R.J. Methods and Challenges for Computational Data Analysis for DNA Adductomics. Chem. Res. Toxicol. 2019, 32, 2156–2168. [Google Scholar] [CrossRef]
- Guo, J.; Turesky, R.J. Emerging Technologies in Mass Spectrometry-Based DNA Adductomics. High-Throughput 2019, 8, 13. Available online: https://0-www-mdpi-com.brum.beds.ac.uk/2571-5135/8/2/13 (accessed on 13 December 2021). [CrossRef] [Green Version]
- Alhegaili, A.S.; Ji, Y.; Sylvius, N.; Blades, M.J.; Karbaschi, M.; Tempest, H.G.; Jones, G.D.D.; Cooke, M.S. Genome-Wide Adductomics Analysis Reveals Heterogeneity in the Induction and Loss of Cyclobutane Thymine Dimers across Both the Nuclear and Mitochondrial Genomes. Int. J. Mol. Sci. 2019, 20, 5112. [Google Scholar] [CrossRef] [PubMed] [Green Version]
- Gallo, V.; Khan, A.; Gonzales, C.; Phillips, D.H.; Schoket, B.; Györffy, E.; Anna, L.; Kovács, K.; Møller, P.; Loft, S.; et al. Validation of Biomarkers for the Study of Environmental Carcinogens: A Review. Biomark. Biochem. Indic. Expo. Response Susceptibility Chem. 2008, 13, 505–534. [Google Scholar] [CrossRef] [PubMed]
- Santella, R.M. Immunological Methods for Detection of Carcinogen-DNA Damage in Humans. Cancer Epidemiol. Biomark. Prev. 1999, 8, 733–739. [Google Scholar]
- Phillips, D.H.; Arlt, V.M. The 32p-Postlabeling Assay for DNA Adducts. Nat. Protoc. 2007, 2, 2772–2781. [Google Scholar] [CrossRef]
- Cummings, J.; French, R.C.; Smyth, J.F. Application of High-Performance Liquid Chromatography for Recognition of Covalent Nucleic Acid Modification with Anticancer Drugs. J. Chromatogr. 1993, 618, 251–276. [Google Scholar] [CrossRef]
- Koc, H.; Swenberg, J.A. Applications of Mass Spectrometry for Quantitation of DNA Adducts. J. Chromatogr. B 2002, 778, 323–343. [Google Scholar] [CrossRef]
- Farmer, P.B.; Singh, R. Use of DNA Adducts to Identify Human Health Risk from Exposure to Hazardous Environmental Pollutants: The Increasing Role of Mass Spectrometry in Assessing Biologically Effective Doses of Genotoxic Carcinogens. Mutat. Res. 2008, 659, 68–76. [Google Scholar] [CrossRef] [Green Version]
- Dole, M.; Mack, L.L.; Hines, R.L.; Mobley, R.C.; Ferguson, L.D.; Alice, M.B. Molecular Beams of Macroions. J. Chem. Phys. 1968, 49, 2240–2249. [Google Scholar] [CrossRef]
- Fenn, J.B.; Mann, M.; Meng, C.K.; Wong, S.F.; Whitehouse, C.M. Electrospray Ionization-Principles and Practice. Mass Spectrom. Rev. 1990, 9, 37–70. [Google Scholar] [CrossRef]
- Guo, J.; Villalta, P.W.; Weight, C.J.; Bonala, R.; Johnson, F.; Rosenquist, T.A.; Turesky, R.J. Targeted and Untargeted Detection of DNA Adducts of Aromatic Amine Carcinogens in Human Bladder by Ultra-Performance Liquid Chromatography-High-Resolution Mass Spectrometry. Chem. Res. Toxicol. 2018, 31, 1382–1397. [Google Scholar] [CrossRef]
- Guo, J.; Turesky, R.J.; Tarifa, A.; DeCaprio, A.P.; Cooke, M.S.; Walmsley, S.J.; Villalta, P.W. Development of a DNA Adductome Mass Spectral Database. Chem. Res. Toxicol. 2020, 33, 852–854. [Google Scholar] [CrossRef]
- Behl, T.; Rachamalla, M.; Najda, A.; Sehgal, A.; Singh, S.; Sharma, N.; Bhatia, S.; Al-harrasi, A.; Chigurupati, S.; Vargas-de-la-cruz, C.; et al. Applications of Adductomics in Chemically Induced Adverse Outcomes and Major Emphasis on DNA Adductomics: A Pathbreaking Tool in Biomedical Research. Int. J. Mol. Sci. 2021, 22, 141. [Google Scholar] [CrossRef] [PubMed]
- Olinski, R.; Rozalski, R.; Gackowski, D. Mass Spectrometry-Based Analysis of DNA Modifications: Potential Applications in Basic Research and Clinic. Methods Mol. Biol. 2021, 2198, 27–35. [Google Scholar] [CrossRef] [PubMed]
- Ma, B.; Stepanov, I.; Hecht, S.S. Recent Studies on DNA Adducts Resulting from Human Exposure to Tobacco Smoke. Toxics 2019, 7, 16. [Google Scholar] [CrossRef] [Green Version]
- Monien, B.H. Mass Spectrometric DNA Adduct Quantification by Multiple Reaction Monitoring and Its Future Use for the Molecular Epidemiology of Cancer. Adv. Exp. Med. Biol. 2019, 1140, 743–751. [Google Scholar] [CrossRef] [PubMed]
- Tretyakova, N.; Goggin, M.; Sangaraju, D.; Janis, G. Quantitation of DNA Adducts by Stable Isotope Dilution Mass Spectrometry. Chem. Res. Toxicol. 2012, 25, 2007–2035. [Google Scholar] [CrossRef] [PubMed] [Green Version]
- Chang, Y.-J.; Cooke, M.S.; Hu, C.-W.; Chao, M.-R. Novel Approach to Integrated DNA Adductomics for the Assessment of in Vitro and in Vivo Environmental Exposures. Arch. Toxicol. 2018, 92, 2665–2680. [Google Scholar] [CrossRef]
- Chang, Y.J.; Cooke, M.S.; Chen, Y.R.; Yang, S.F.; Li, P.S.; Hu, C.W.; Chao, M.R. Is High Resolution a Strict Requirement for Mass Spectrometry-Based Cellular DNA Adductomics? Chemosphere 2021, 274, 129991. [Google Scholar] [CrossRef]
- Zhang, P.; Carlsten, C.; Chaleckis, R.; Hanhineva, K.; Huang, M.; Isobe, T.; Koistinen, V.M.; Meister, I.; Papazian, S.; Sdougkou, K.; et al. Defining the Scope of Exposome Studies and Research Needs from a Multidisciplinary Perspective. Environ. Sci. Technol. Lett. 2021, 8, 839–852. [Google Scholar] [CrossRef] [PubMed]
- Murray, K.J.; Carlson, E.S.; Stornetta, A.; Balskus, E.P.; Villalta, P.W.; Balbo, S. Extension of Diagnostic Fragmentation Filtering for Automated Discovery in DNA Adductomics. Anal. Chem. 2021, 93, 5754–5762. [Google Scholar] [CrossRef] [PubMed]
- Htun, H.; Johnston, B.H. Mapping Adducts of DNA Structural Probes Using Transcription and Primer Extension Approaches. Methods Enzymol. 1992, 212, 272–294. [Google Scholar] [CrossRef]
- Sinden, R.R.; Ussery, D.W. Analysis of DNA Structure In Vivo Using Psoralen Photobinding: Measurement of Supercoiling, Topological Domains, and DNA-Protein Interactions. Methods Enzymol. 1992, 212, 319–335. [Google Scholar] [CrossRef]
- Cao, B.; Wu, X.; Zhou, J.; Wu, H.; Liu, L.; Zhang, Q.; Demott, M.S.; Gu, C.; Wang, L.; You, D.; et al. Nick-Seq for Single-Nucleotide Resolution Genomic Maps of DNA Modifications and Damage. Nucleic Acids Res. 2020, 48, 6715–6725. [Google Scholar] [CrossRef] [PubMed]
- Denissenko, M.F.; Venkatachalam, S.; Ma, Y.H.; Wani, A.A. Site-Specific Induction and Repair of Benzo[a]Pyrene Diol Epoxide DNA Damage in Human H-Ras Protooncogene as Revealed by Restriction Cleavage Inhibition. Mutat. Res. 1996, 363, 27–42. [Google Scholar] [CrossRef]
- Denissenko, M.F.; Pao, A.; Tang, M.-s.; Pfeifer, G.P. Preferential Formation of Benzo[a]Pyrene Adducts at Lung Cancer Mutational Hotspots in P53. Science 1996, 274, 430–432. [Google Scholar] [CrossRef] [PubMed] [Green Version]
- Denissenko, M.F.; Chen, J.X.; Tang, M.S.; Pfeifer, G.P. Cytosine Methylation Determines Hot Spots of DNA Damage in the Human P53 Gene. Proc. Natl. Acad. Sci. USA 1997, 94, 3893–3898. [Google Scholar] [CrossRef] [Green Version]
- Mao, P.; Smerdon, M.J.; Roberts, S.A.; Wyrick, J.J. Chromosomal Landscape of UV Damage Formation and Repair at Single-Nucleotide Resolution. Proc. Natl. Acad. Sci. USA 2016, 113, 9057–9062. [Google Scholar] [CrossRef] [Green Version]
- Mao, P.; Brown, A.J.; Malc, E.P.; Mieczkowski, P.A.; Smerdon, M.J.; Roberts, S.A.; Wyrick, J.J. Genome-Wide Maps of Alkylation Damage, Repair, and Mutagenesis in Yeast Reveal Mechanisms of Mutational Heterogeneity. Genome Res. 2017, 27, 1674–1684. [Google Scholar] [CrossRef]
- Hu, J.; Li, W.; Adebali, O.; Yang, Y.; Oztas, O.; Selby, C.P.; Sancar, A. Genome-Wide Mapping of Nucleotide Excision Repair with XR-Seq. Nat. Protoc. 2019, 14, 248–282. [Google Scholar] [CrossRef] [PubMed]
- Li, W.; Hu, J.; Adebali, O.; Adar, S.; Yang, Y.; Chiou, Y.-Y.; Sancar, A. Human Genome-Wide Repair Map of DNA Damage Caused by the Cigarette Smoke Carcinogen Benzo[a]Pyrene. Proc. Natl. Acad. Sci. USA 2017, 114, 6752–6757. [Google Scholar] [CrossRef] [Green Version]
- Govindan, R.; Szczesna, A.; Ahn, M.; Schneider, C.; Gonzalez Mella, P.F.; Barlesi, F.; Han, B.; Ganea, D.E.; Von Pawel, J.; Vladimirov, V.; et al. Phase III Trial of Ipilimumab Combined with Paclitaxel and Carboplatin in Advanced Squamous Non-Small-Cell Lung Cancer. J. Clin. Oncol. Off. J. Am. Soc. Clin. Oncol. 2017, 35, 3449–3457. [Google Scholar] [CrossRef]
- Yang, Y.; Hu, J.; Selby, C.P.; Li, W.; Yimit, A.; Jiang, Y.; Sancar, A. Single-Nucleotide Resolution Analysis of Nucleotide Excision Repair of Ribosomal DNA in Humans and Mice. J. Biol. Chem. 2019, 294, 210–217. [Google Scholar] [CrossRef] [Green Version]
- Shu, X.; Xiong, X.; Song, J.; He, C.; Yi, C. Base-Resolution Analysis of Cisplatin-DNA Adducts at the Genome Scale. Angew. Chem. Int. Ed. Engl. 2016, 55, 14246–14249. [Google Scholar] [CrossRef] [PubMed] [Green Version]
- Wu, J.; McKeague, M.; Sturla, S.J. Nucleotide-Resolution Genome-Wide Mapping of Oxidative DNA Damage by Click-Code-Seq. J. Am. Chem. Soc. 2018, 140, 9783–9787. [Google Scholar] [CrossRef] [PubMed]
- Schutsky, E.K.; Denizio, J.E.; Hu, P.; Liu, M.Y.; Nabel, C.S.; Fabyanic, E.B.; Hwang, Y.; Bushman, F.D.; Wu, H.; Kohli, R.M. Nondestructive, Base-Resolution Sequencing of 5-Hydroxymethylcytosine Using a DNA Deaminase. Nat. Biotechnol. 2018, 36, 1083–1090. [Google Scholar] [CrossRef]
- Vitelli, V.; Galbiati, A.; Iannelli, F.; Pessina, F.; Sharma, S.; d’Adda di Fagagna, F. Recent Advancements in DNA Damage-Transcription Crosstalk and High-Resolution Mapping of DNA Breaks. Annu. Rev. Genom. Hum. Genet. 2017, 18, 87–113. [Google Scholar] [CrossRef] [PubMed]
- Amente, S.; Scala, G.; Majello, B.; Azmoun, S.; Tempest, H.G.; Premi, S.; Cooke, M.S. Genome-Wide Mapping of Genomic DNA Damage: Methods and Implications. Cell. Mol. Life Sci. 2021, 78, 6745–6762. [Google Scholar] [CrossRef] [PubMed]
- Poetsch, A.R. The Genomics of Oxidative DNA Damage, Repair, and Resulting Mutagenesis. Comput. Struct. Biotechnol. J. 2020, 18, 207–219. [Google Scholar] [CrossRef] [PubMed]
- Nookaew, I.; Jenjaroenpun, P.; Du, H.; Wang, P.; Wu, J.; Wongsurawat, T.; Moon, S.H.; Huang, E.; Wang, Y.; Boysen, G. Detection and Discrimination of DNA Adducts Differing in Size, Regiochemistry, and Functional Group by Nanopore Sequencing. Chem. Res. Toxicol. 2020, 33, 2944–2952. [Google Scholar] [CrossRef]
- Perera, R.T.; Fleming, A.M.; Johnson, R.P.; Burrows, C.J.; White, H.S. Detection of Benzo[a]Pyrene-Guanine Adducts in Single-Stranded DNA Using the α-Hemolysin Nanopore. Nanotechnology 2015, 26, 074002. [Google Scholar] [CrossRef] [Green Version]
- An, N.; Fleming, A.M.; White, H.S.; Burrows, C.J. Crown Ether-Electrolyte Interactions Permit Nanopore Detection of Individual DNA Abasic Sites in Single Molecules. Proc. Natl. Acad. Sci. USA 2012, 109, 11504–11509. [Google Scholar] [CrossRef] [PubMed] [Green Version]
- An, N.; Fleming, A.M.; Rosecrans, N.C.; Liao, Y.; Burrows, C.J. Synthesis of Site-Specific Crown Ether Adducts to DNA Abasic Sites: 8-Oxo-7,8-Dihydro-2’-Deoxyguanosine and 2’-Deoxycytidine. Methods Mol. Biol. 2019, 1973, 15–25. [Google Scholar] [CrossRef] [PubMed]
- Liu, Z.J.; Martínez Cuesta, S.; van Delft, P.; Balasubramanian, S. Sequencing Abasic Sites in DNA at Single-Nucleotide Resolution. Nat. Chem. 2019, 11, 629–637. [Google Scholar] [CrossRef]
- Tan, C.S.; Fleming, A.M.; Ren, H.; Burrows, C.J.; White, H.S. γ-Hemolysin Nanopore Is Sensitive to Guanine-to-Inosine Substitutions in Double-Stranded DNA at the Single-Molecule Level. J. Am. Chem. Soc. 2018, 140, 14224–14234. [Google Scholar] [CrossRef] [PubMed]
- Zeng, T.; Fleming, A.M.; Ding, Y.; Ren, H.; White, H.S.; Burrows, C.J. Nanopore Analysis of the 5-Guanidinohydantoin to Iminoallantoin Isomerization in Duplex DNA. J. Org. Chem. 2018, 83, 3973–3978. [Google Scholar] [CrossRef] [PubMed]
- Fleming, A.M.; Ding, Y.; Burrows, C.J. Oxidative DNA Damage Is Epigenetic by Regulating Gene Transcription via Base Excision Repair. Proc. Natl. Acad. Sci. USA 2017, 114, 2604–2609. [Google Scholar] [CrossRef]
- Ding, Y.; Fleming, A.M.; Burrows, C.J. Sequencing the Mouse Genome for the Oxidatively Modified Base 8-Oxo-7,8-Dihydroguanine by OG-Seq. J. Am. Chem. Soc. 2017, 139, 2569–2572. [Google Scholar] [CrossRef] [PubMed] [Green Version]
- Payne, A.; Holmes, N.; Rakyan, V.; Loose, M. BulkVis: A Graphical Viewer for Oxford Nanopore Bulk FAST5 Files. Bioinformatics 2019, 35, 2193–2198. [Google Scholar] [CrossRef]
- Tyson, J.R.; O’Neil, N.J.; Jain, M.; Olsen, H.E.; Hieter, P.; Snutch, T.P. MinION-Based Long-Read Sequencing and Assembly Extends the Caenorhabditis Elegans Reference Genome. Genome Res. 2018, 28, 266–274. [Google Scholar] [CrossRef] [Green Version]
- Xu, L.; Seki, M. Recent Advances in the Detection of Base Modifications Using the Nanopore Sequencer. J. Hum. Genet. 2020, 65, 25–33. [Google Scholar] [CrossRef] [Green Version]
- Rand, A.C.; Jain, M.; Eizenga, J.M.; Musselman-Brown, A.; Olsen, H.E.; Akeson, M.; Paten, B. Mapping DNA Methylation with High-Throughput Nanopore Sequencing. Nat. Methods 2017, 14, 411–413. [Google Scholar] [CrossRef] [Green Version]
- Simpson, J.T.; Workman, R.E.; Zuzarte, P.C.; David, M.; Dursi, L.J.; Timp, W. Detecting DNA Cytosine Methylation Using Nanopore Sequencing. Nat. Methods 2017, 14, 407–410. [Google Scholar] [CrossRef] [PubMed]
- Liu, Q.; Fang, L.; Yu, G.; Wang, D.; Xiao, C.-L.; Wang, K. Detection of DNA Base Modifications by Deep Recurrent Neural Network on Oxford Nanopore Sequencing Data. Nat. Commun. 2019, 10, 2449. [Google Scholar] [CrossRef] [Green Version]
- Ni, P.; Huang, N.; Zhang, Z.; Wang, D.-P.; Liang, F.; Miao, Y.; Xiao, C.-L.; Luo, F.; Wang, J. DeepSignal: Detecting DNA Methylation State from Nanopore Sequencing Reads Using Deep-Learning. Bioinformatics 2019, 35, 4586–4595. [Google Scholar] [CrossRef] [PubMed]
- Flusberg, B.A.; Webster, D.R.; Lee, J.H.; Travers, K.J.; Olivares, E.C.; Clark, T.A.; Korlach, J.; Turner, S.W. Direct Detection of DNA Methylation during Single-Molecule, Real-Time Sequencing. Nat. Methods 2010, 7, 461–465. [Google Scholar] [CrossRef] [Green Version]
- Cao, B.; Chen, C.; DeMott, M.S.; Cheng, Q.; Clark, T.A.; Xiong, X.; Zheng, X.; Butty, V.; Levine, S.S.; Yuan, G.; et al. Genomic Mapping of Phosphorothioates Reveals Partial Modification of Short Consensus Sequences. Nat. Commun. 2014, 5, 3951. [Google Scholar] [CrossRef] [PubMed] [Green Version]
- Ahlgren, N.A.; Chen, Y.; Needham, D.M.; Parada, A.E.; Sachdeva, R.; Trinh, V.; Chen, T.; Fuhrman, J.A. Genome and Epigenome of a Novel Marine Thaumarchaeota Strain Suggest Viral Infection, Phosphorothioation DNA Modification and Multiple Restriction Systems. Environ. Microbiol. 2017, 19, 2434–2452. [Google Scholar] [CrossRef]
- Jenjaroenpun, P.; Wongsurawat, T.; Pereira, R.; Patumcharoenpol, P.; Ussery, D.W.; Nielsen, J.; Nookaew, I. Complete Genomic and Transcriptional Landscape Analysis Using Third-Generation Sequencing: A Case Study of Saccharomyces Cerevisiae CEN.PK113-7D. Nucleic Acids Res. 2018, 46, e38. [Google Scholar] [CrossRef] [Green Version]
- Wongsurawat, T.; Jenjaroenpun, P.; Taylor, M.K.; Lee, J.; Tolardo, A.L.; Parvathareddy, J.; Kandel, S.; Wadley, T.D.; Kaewnapan, B.; Athipanyasilp, N.; et al. Rapid Sequencing of Multiple RNA Viruses in Their Native Form. Front. Microbiol. 2019, 10, 260. [Google Scholar] [CrossRef] [PubMed]
- Wick, R.R.; Judd, L.M.; Holt, K.E. Performance of Neural Network Basecalling Tools for Oxford Nanopore Sequencing. Genome Biol. 2019, 20, 129. [Google Scholar] [CrossRef] [Green Version]
- Gilpatrick, T.; Lee, I.; Graham, J.E.; Raimondeau, E.; Bowen, R.; Heron, A.; Downs, B.; Sukumar, S.; Sedlazeck, F.J.; Timp, W. Targeted Nanopore Sequencing with Cas9-Guided Adapter Ligation. Nat. Biotechnol. 2020, 38, 433–438. [Google Scholar] [CrossRef]
- Veres, A.; Gosis, B.S.; Ding, Q.; Collins, R.; Ragavendran, A.; Brand, H.; Erdin, S.; Cowan, C.A.; Talkowski, M.E.; Musunuru, K. Low Incidence of Off-Target Mutations in Individual CRISPR-Cas9 and TALEN Targeted Human Stem Cell Clones Detected by Whole-Genome Sequencing. Cell Stem Cell 2014, 15, 27–30. [Google Scholar] [CrossRef] [Green Version]
- Wongsurawat, T.; Jenjaroenpun, P.; de Loose, A.; Alkam, D.; Ussery, D.W.; Nookaew, I.; Leung, Y.K.; Ho, S.M.; Day, J.D.; Rodriguez, A. A Novel Cas9-Targeted Long-Read Assay for Simultaneous Detection of IDH1/2 Mutations and Clinically Relevant MGMT Methylation in Fresh Biopsies of Diffuse Glioma. Acta Neuropathol. Commun. 2020, 8, 87. [Google Scholar] [CrossRef]
- Villalta, P.W.; Hochalter, J.B.; Hecht, S.S. Ultrasensitive High-Resolution Mass Spectrometric Analysis of a DNA Adduct of the Carcinogen Benzo[a]Pyrene in Human Lung. Anal. Chem. 2017, 89, 12735–12742. [Google Scholar] [CrossRef]
- Walker, V.E.; Fennel, T.R.; Upton, P.B.; Skopek, T.R.; Prevost, V.; Shuker, D.E.G.; Swenberg, J.A. Molecular Dosimetry of Ethylene Oxide: Formation and Persistence of 7-(2-Hydroxyethyl)Guanine in DNA Following Repeated Exposures of Rats and Mice. Cancer Res. 1992, 52, 4328–4334. [Google Scholar]
- Walker, V.E.; Fennell, T.R.; Boucheron, J.A.; Fedtke, N.; Ciroussel, F.; Swenberg, J.A. Macromolecular Adducts of Ethylene Oxide: A Literature Review and a Time-Course Study on the Formation of 7-(2-Hydroxyethyl)Guanine Following Exposures of Rats by Inhalation. Mutat. Res. 1990, 233, 151–164. [Google Scholar] [CrossRef]
- Guengerich, F.P.; Persmark, M. Mechanism of Formation of Ethenoguanine Adducts from 2-Haloacetaldehydes: 13C-Labeling Patterns with 2-Bromoacetaldehyde. Chem. Res. Toxicol. 1994, 7, 205–208. [Google Scholar] [CrossRef] [PubMed]
- Nair, J.; Barbin, A.; Bartsch, H. Etheno DNA-Base Adducts from Endogenous Reactive Species. Mutat. Res.-Fundam. Mol. Mech. Mutagenesis 1999, 424, 59–69. [Google Scholar] [CrossRef]
- Collins, A.R.; Cadet, J.; Moller, L.; Poulsen, H.E.; Viña, J. Are We Sure We Know How to Measure 8-Oxo-7,8-Dihydroguanine in DNA from Human Cells? Arch. Biochem. Biophys. 2004, 423, 57–65. [Google Scholar] [CrossRef] [PubMed]
- Collins, A.; Gedik, C.; Vaughan, N.; Wood, S.; White, A.; Dubois, J.; Rees, J.F.; Loft, S.; Møller, P.; Poulsen, H.; et al. Measurement of DNA Oxidation in Human Cells by Chromatographic and Enzymic Methods. Free Radic. Biol. Med. 2003, 34, 1089–1099. [Google Scholar] [CrossRef]
- Lunec, J. ESCODD: European Standards Committee on Oxidative DNA Damage. Free Radic. Res. 1998, 29, 601–608. [Google Scholar] [CrossRef]
- Collins, A. Comparison of Different Methods of Measuring 8-Oxoguanine as a Marker of Oxidative DNA Damage. Free Radic. Res. 2000, 32, 333–341. [Google Scholar] [CrossRef]
- ESCODD. Comparative Analysis of Baseline 8-Oxo-7,8-Dihydroguanine in Mammalian Cell DNA, by Different Methods in Different Laboratories: An Approach to Consensus. Carcinogenesis 2002, 23, 2129–2133. [Google Scholar] [CrossRef]
- Boysen, G.; Collins, L.B.; Liao, S.; Luke, A.M.; Pachkowski, B.F.; Watters, J.L.; Swenberg, J.A. Analysis of 8-Oxo-7,8-Dihydro-2’-Deoxyguanosine by Ultra High Pressure Liquid Chromatography-Heat Assisted Electrospray Ionization-Tandem Mass Spectrometry. J. Chromatography. B Anal. Technol. Biomed. Life Sci. 2010, 878, 375–380. [Google Scholar] [CrossRef] [Green Version]
- Watters, J.J.L.; Satia, J.J.A.; da Costa, K.-A.; Boysen, G.; Collins, L.B.; Morrow, J.D.; Milne, G.L.; Swenberg, J.A.; Costa, K. Comparison of Three Oxidative Stress Biomarkers in a Sample of Healthy Adults. Biomarkers 2009, 14, 587–595. [Google Scholar] [CrossRef]
- Ma, B.; Zarth, A.T.; Carlson, E.S.; Villalta, P.W.; Upadhyaya, P.; Stepanov, I.; Hecht, S.S. Identification of More than 100 Structurally Unique DNA-Phosphate Adducts Formed during Rat Lung Carcinogenesis by the Tobacco-Specific Nitrosamine 4-(Methylnitrosamino)-1-(3-Pyridyl)-1-Butanone. Carcinogenesis 2018, 39, 232–241. [Google Scholar] [CrossRef] [PubMed] [Green Version]
- Kanaly, R.A.; Matsui, S.; Hanaoka, T.; Matsuda, T. Application of the Adductome Approach to Assess Intertissue DNA Damage Variations in Human Lung and Esophagus. Mutat. Res./Fundam. Mol. Mech. Mutagenesis 2007, 625, 83–93. [Google Scholar] [CrossRef]
- Bessette, E.E.; Goodenough, A.K.; Langouët, S.; Yasa, I.; Kozekov, I.D.; Spivack, S.D.; Turesky, R.J. Screening for DNA Adducts by Data-Dependent Constant Neutral Loss-Triple Stage Mass Spectrometry with a Linear Quadrupole Ion Trap Mass Spectrometer. Anal. Chem. 2009, 81, 809–819. [Google Scholar] [CrossRef] [Green Version]
- Bessette, E.E.; Spivack, S.D.; Goodenough, A.K.; Wang, T.; Pinto, S.; Kadlubar, F.F.; Turesky, R.J. Identification of Carcinogen DNA Adducts in Human Saliva by Linear Quadrupole Ion Trap/Multistage Tandem Mass Spectrometry. Chem. Res. Toxicol. 2010, 23, 1234–1244. [Google Scholar] [CrossRef] [Green Version]
- Iwashita, Y.; Ohnishi, I.; Matsushita, Y.; Ohtsuka, S.; Yamashita, T.; Inaba, K.; Fukazawa, A.; Ochiai, H.; Matsumoto, K.; Kurono, N.; et al. Geospatial Assessments of DNA Adducts in the Human Stomach: A Model of Field Cancerization. Cancers 2021, 13, 3728. [Google Scholar] [CrossRef] [PubMed]
- Ohnishi, I.; Iwashita, Y.; Matsushita, Y.; Ohtsuka, S.; Yamashita, T.; Inaba, K.; Fukazawa, A.; Ochiai, H.; Matsumoto, K.; Kurono, N.; et al. Mass Spectrometric Profiling of DNA Adducts in the Human Stomach Associated with Damage from Environmental Factors. Genes Environ. Off. J. Jpn. Environ. Mutagen Soc. 2021, 43, 12. [Google Scholar] [CrossRef]
- Tang, M.S.; Zheng, J.B.; Denissenko, M.F.; Pfeifer, G.P.; Zheng, Y. Use of UvrABC Nuclease to Quantify Benzo[a]Pyrene Diol Epoxide-DNA Adduct Formation at Methylated versus Unmethylated CpG Sites in the P53 Gene. Carcinogenesis 1999, 20, 1085–1089. [Google Scholar] [CrossRef]
- Dittrich, K.A.; Krugh, T.R. Mapping of (+/−)-Anti-Benzo[a]Pyrene Diol Epoxide Adducts to Human c-Ha-Ras1 Protooncogene. Chem. Res. Toxicol. 1991, 4, 277–281. [Google Scholar] [CrossRef]
- Briedé, J.J.; Godschalk, R.W.L.; Emans, M.T.G.; de Kok, T.M.C.M.; van Agen, E.; van Maanen, J.; van Schooten, F.-J.; Kleinjans, J.C.S. In Vitro and in Vivo Studies on Oxygen Free Radical and DNA Adduct Formation in Rat Lung and Liver during Benzo[a]Pyrene Metabolism. Free. Radic. Res. 2004, 38, 995–1002. [Google Scholar] [CrossRef]
- Matter, B.; Wang, G.; Jones, R.; Tretyakova, N. Formation of Diastereomeric Benzo[a]Pyrene Diol Epoxide-Guanine Adducts in P53 Gene-Derived DNA Sequences. Chem. Res. Toxicol. 2004, 17, 731–741. [Google Scholar] [CrossRef] [PubMed]
- Bush, J.; Maulbetsch, W.; Lepoitevin, M.; Wiener, B.; Mihovilovic Skanata, M.; Moon, W.; Pruitt, C.; Stein, D. The Nanopore Mass Spectrometer. Rev. Sci. Instrum. 2017, 88. [Google Scholar] [CrossRef]
- Maulbetsch, W.; Wiener, B.; Poole, W.; Bush, J.; Stein, D. Preserving the Sequence of a Biopolymer’s Monomers as They Enter an Electrospray Mass Spectrometer. Phys. Rev. Appl. 2016, 6, 054006. [Google Scholar] [CrossRef] [Green Version]
- Brodbelt, J.S. Photodissociation Mass Spectrometry: New Tools for Characterization of Biological Molecules. Chem. Soc. Rev. 2014, 43, 2757–2783. [Google Scholar] [CrossRef]
- Sun, X.; Song, L.; Yang, W.; Zhang, L.; Liu, M.; Li, X.; Tian, G.; Wang, W. Nanopore Sequencing and Its Clinical Applications. Methods Mol. Biol. 2020, 2204, 13–32. [Google Scholar] [CrossRef]
- Lin, B.; Hui, J.; Mao, H. Nanopore Technology and Its Applications in Gene Sequencing. Biosensors 2021, 11, 214. [Google Scholar] [CrossRef]
- Robertson, J.W.F.; Ghimire, M.L.; Reiner, J.E. Nanopore Sensing: A Physical-Chemical Approach. Biochim. Biophys. Acta-Biomembr. 2021, 1863, 183644. [Google Scholar] [CrossRef]
- Totsuka, Y.; Watanabe, M.; Lin, Y. New Horizons of DNA Adductome for Exploring Environmental Causes of Cancer. Cancer Sci. 2020, 112, 7–15. [Google Scholar] [CrossRef] [PubMed]
Scheme 1.
Overview of current approaches for measuring DNA adduct levels and mapping the location of DNA adducts. (a) DNA digestion or release of DNA adducts, prior to quantitation by LC-MS. (b) Labeling of DNA adduct sites prior to localizing by amplification-base sequencing. (c) Single molecule sequencing using nanopore-based technologies.

Figure 1.
Representative odds ratios plot of a plasmid carrying a DNA adduct at position G640. The odds ratios of individual position were calculated using ELIGOS by comparing error at specific base on negative strand between plasmid carrying a DNA adduct at position G640 with the control plasmid, which has no adduct. Using the approach, the correct adduct location can be identified.

Figure 2.
Characterization and separation of DNA adducts based on raw ONT signal: (a) radar plot displaying the disturbance in raw ONT signal of 12 DNA adducts at position G640, compared with dG-containing control plasmid.; (b) dimensional reduction analysis plot of the re-squiggle signals of ONT reads from 12 plasmids containing a site-specific DNA adduct or dG (red) at position G640. The separation is driven by the alkyl chain length and, to some extent, by the isomeric structures for the propyl- and butyl-adducts.

Publisher’s Note: MDPI stays neutral with regard to jurisdictional claims in published maps and institutional affiliations. |
© 2022 by the authors. Licensee MDPI, Basel, Switzerland. This article is an open access article distributed under the terms and conditions of the Creative Commons Attribution (CC BY) license (https://creativecommons.org/licenses/by/4.0/).
Share and Cite
MDPI and ACS Style
Boysen, G.; Nookaew, I. Current and Future Methodology for Quantitation and Site-Specific Mapping the Location of DNA Adducts. Toxics 2022, 10, 45. https://0-doi-org.brum.beds.ac.uk/10.3390/toxics10020045
AMA Style
Boysen G, Nookaew I. Current and Future Methodology for Quantitation and Site-Specific Mapping the Location of DNA Adducts. Toxics. 2022; 10(2):45. https://0-doi-org.brum.beds.ac.uk/10.3390/toxics10020045
Chicago/Turabian StyleBoysen, Gunnar, and Intawat Nookaew. 2022. "Current and Future Methodology for Quantitation and Site-Specific Mapping the Location of DNA Adducts" Toxics 10, no. 2: 45. https://0-doi-org.brum.beds.ac.uk/10.3390/toxics10020045
Note that from the first issue of 2016, this journal uses article numbers instead of page numbers. See further details here.