
Lead and Cadmium Bioaccumulation in Fresh Cow’s Milk in an Intermediate Area of the Central Andes of Peru and Risk to Human Health

 ,
,
Abstract
:1. Introduction
2. Materials and Methods
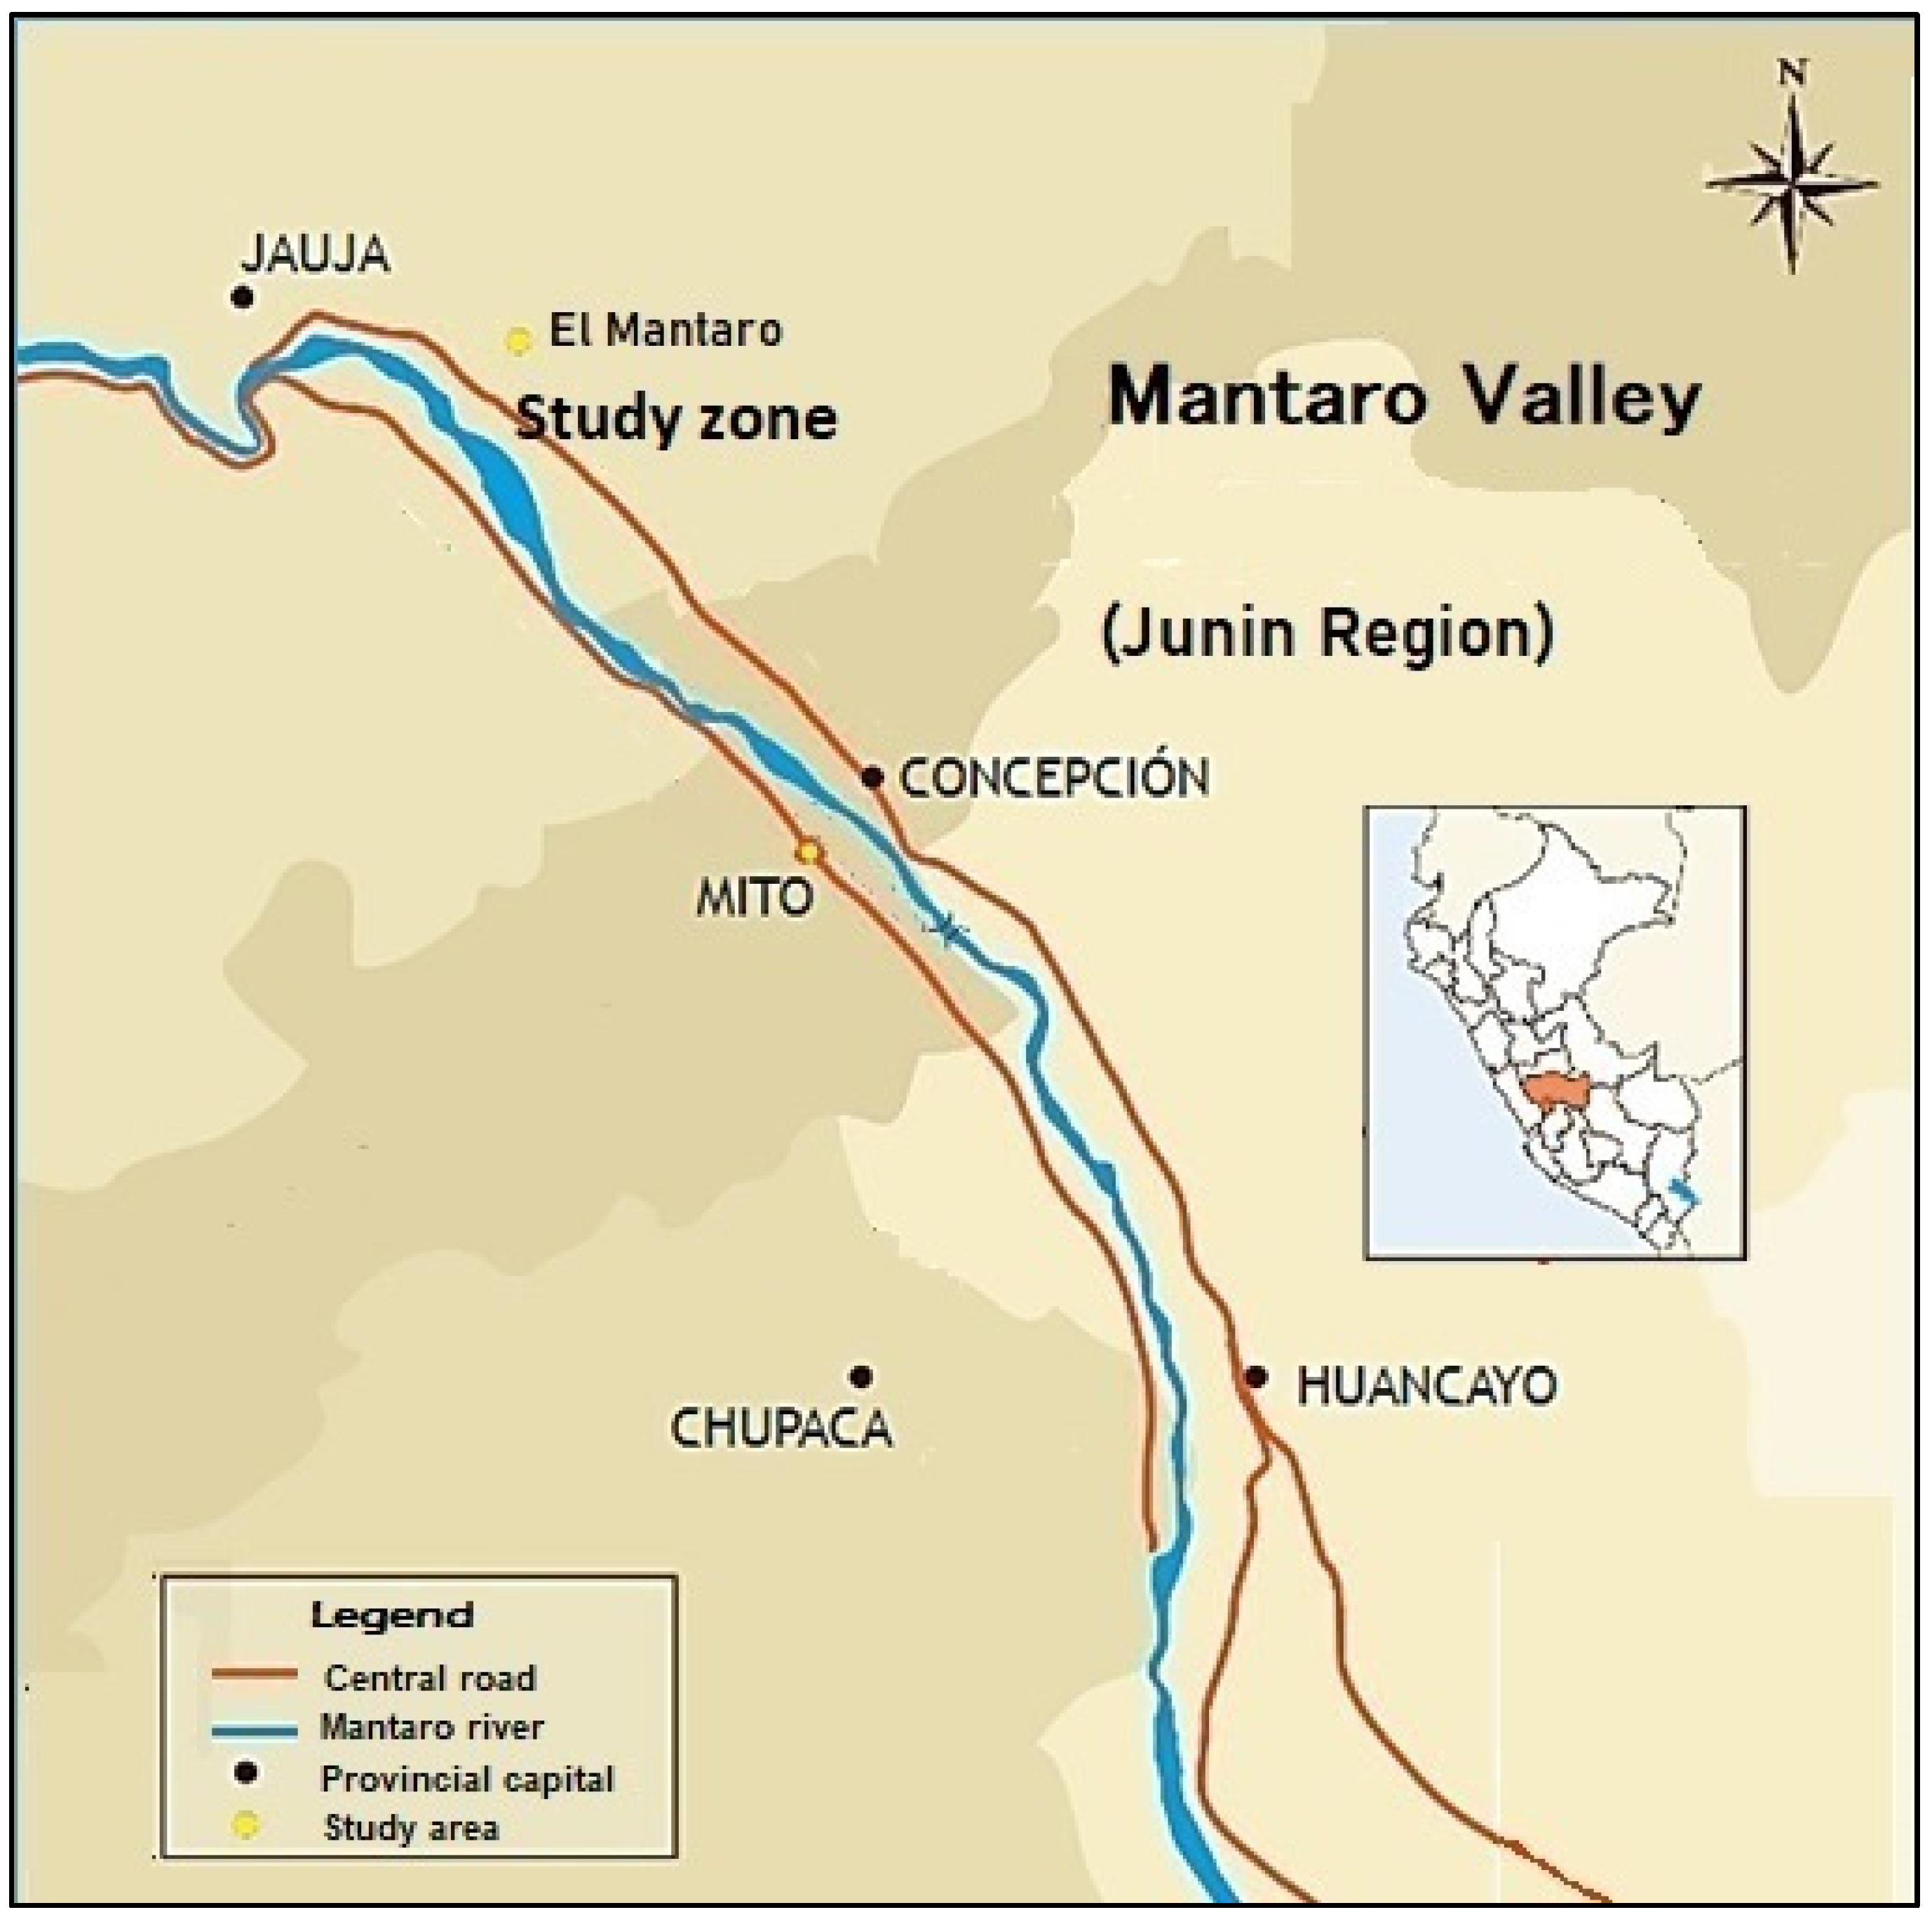
2.1. Study Area
2.2. Sample Preparation and Analysis
2.3. Risk Assessment
2.3.1. Exposure Assessment (EDI)
2.3.2. Dietary Risk Coefficient (DRC)
2.3.3. Target Hazard Quotient (THQ)
2.3.4. Hazard Index (HI)
2.3.5. Data Processing Techniques
3. Results
3.1. Concentration of Pb and Cd in the Milk Assessed
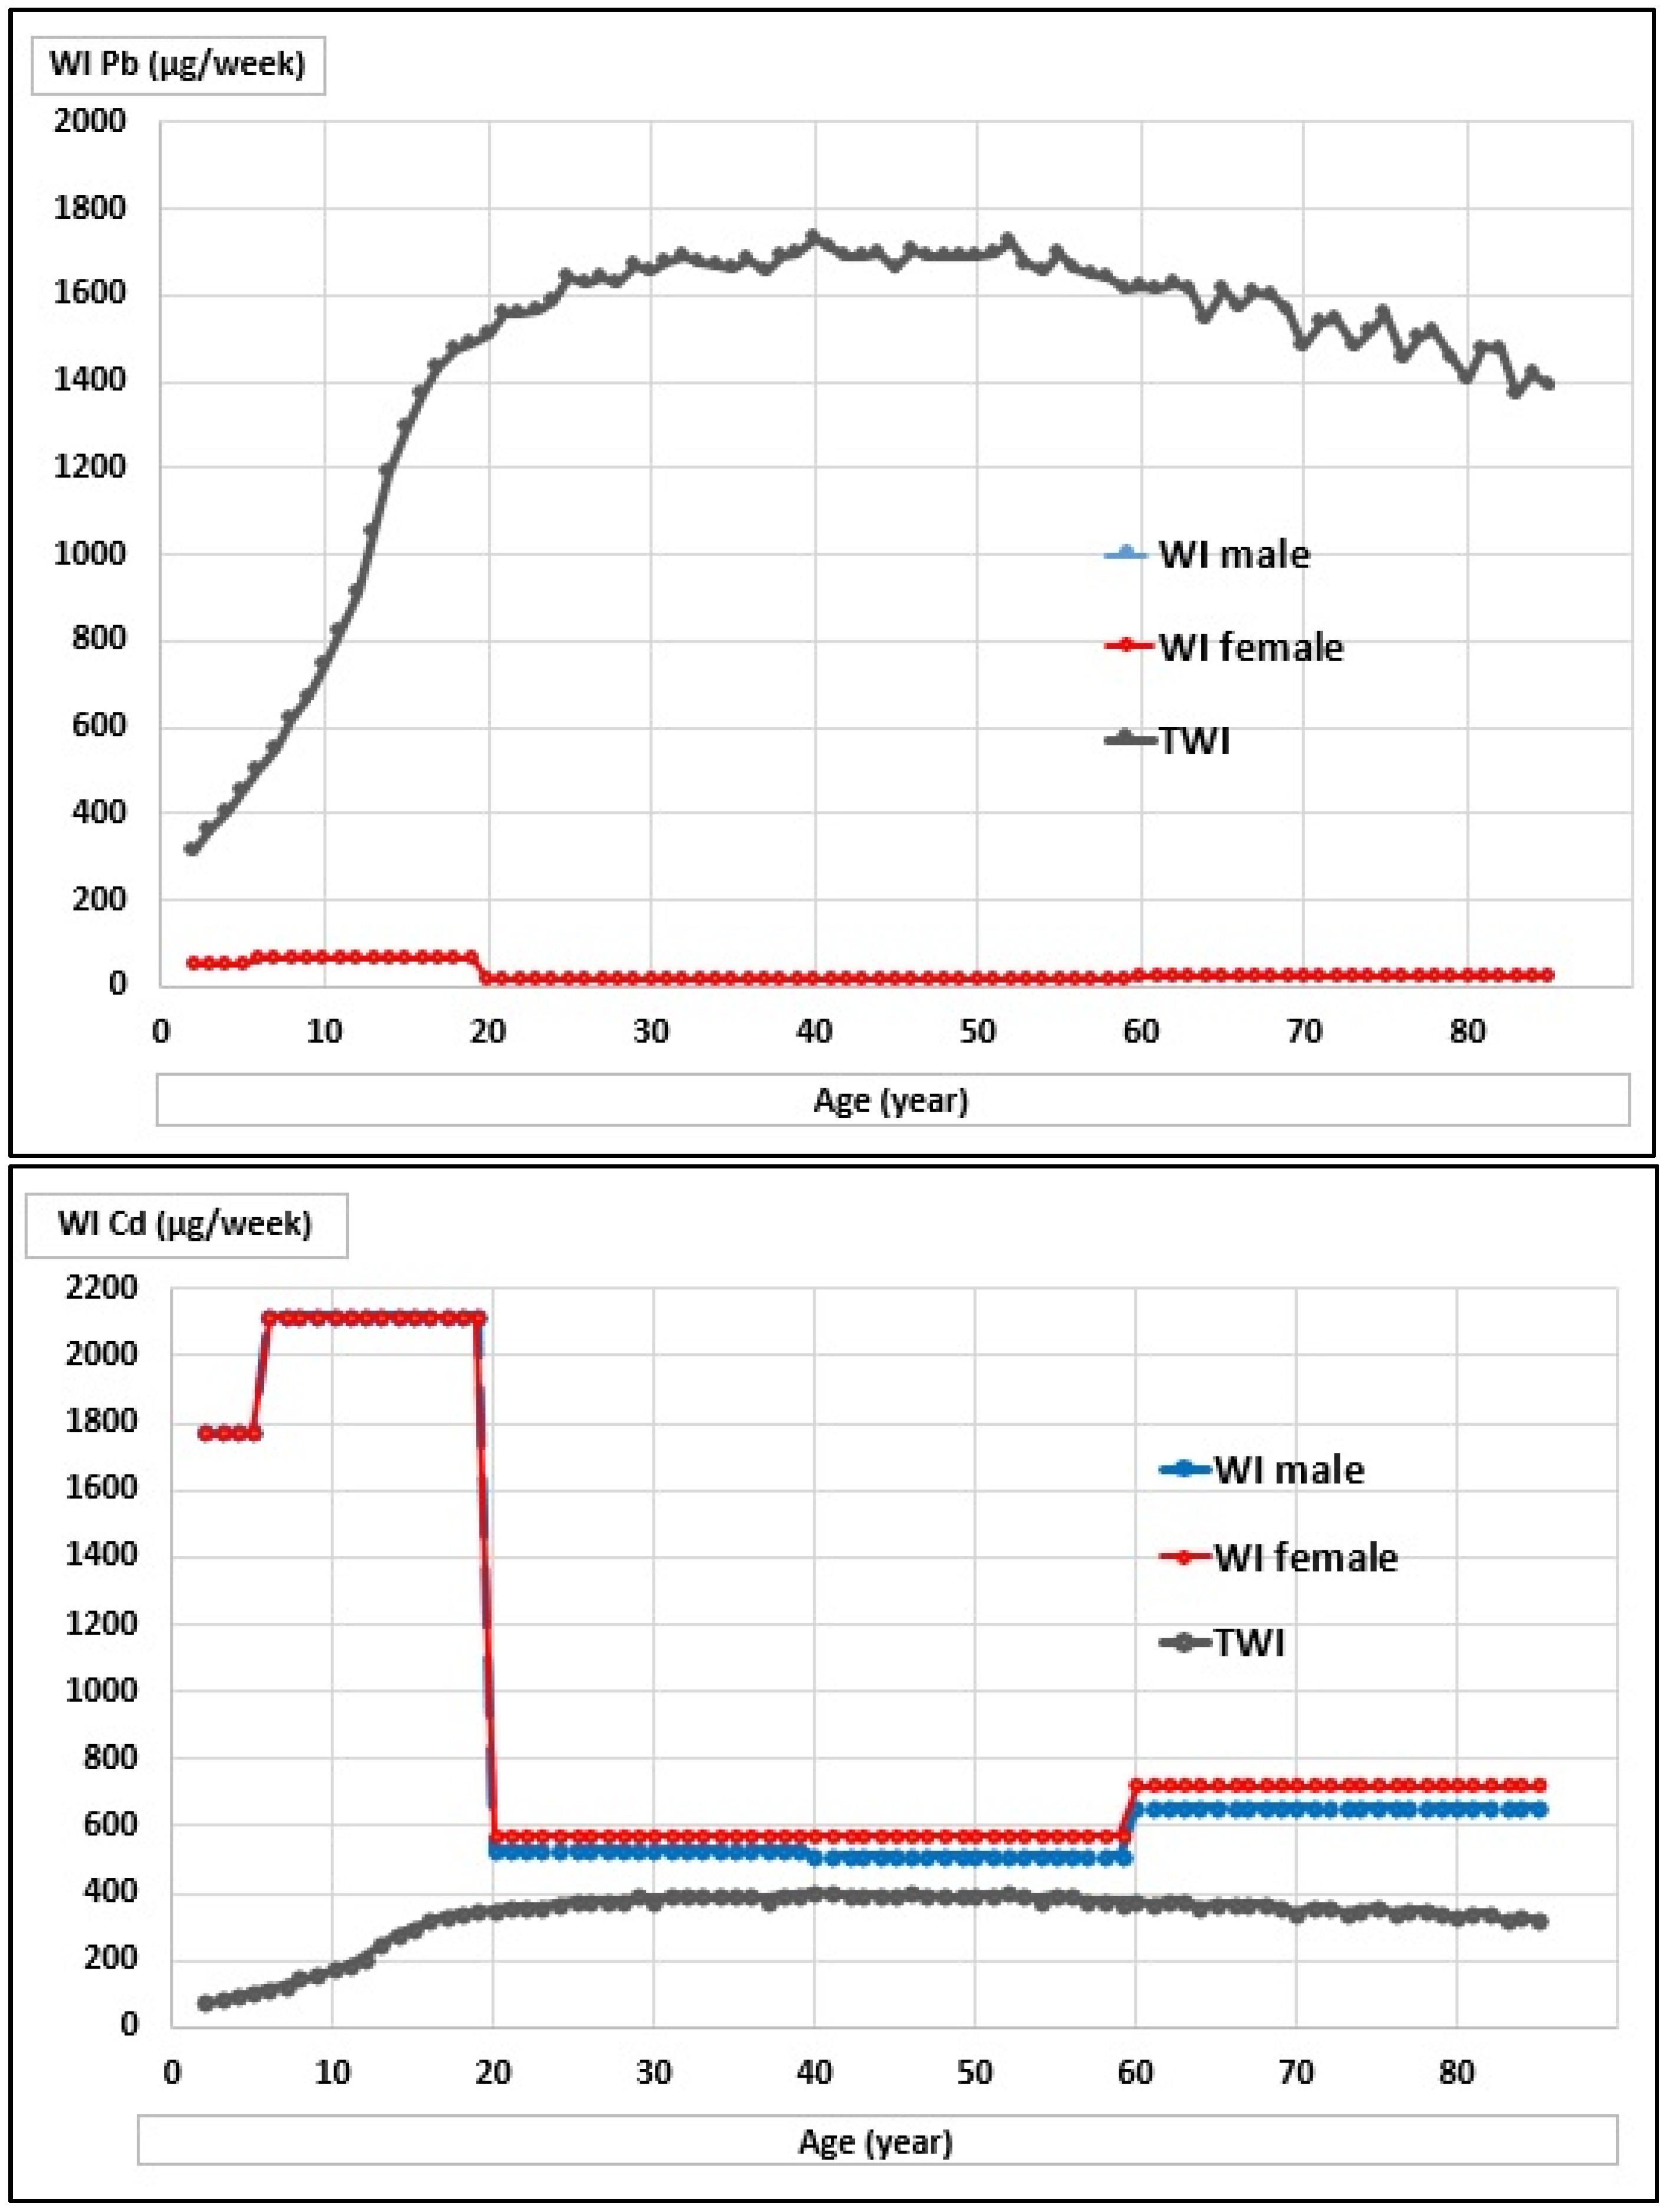
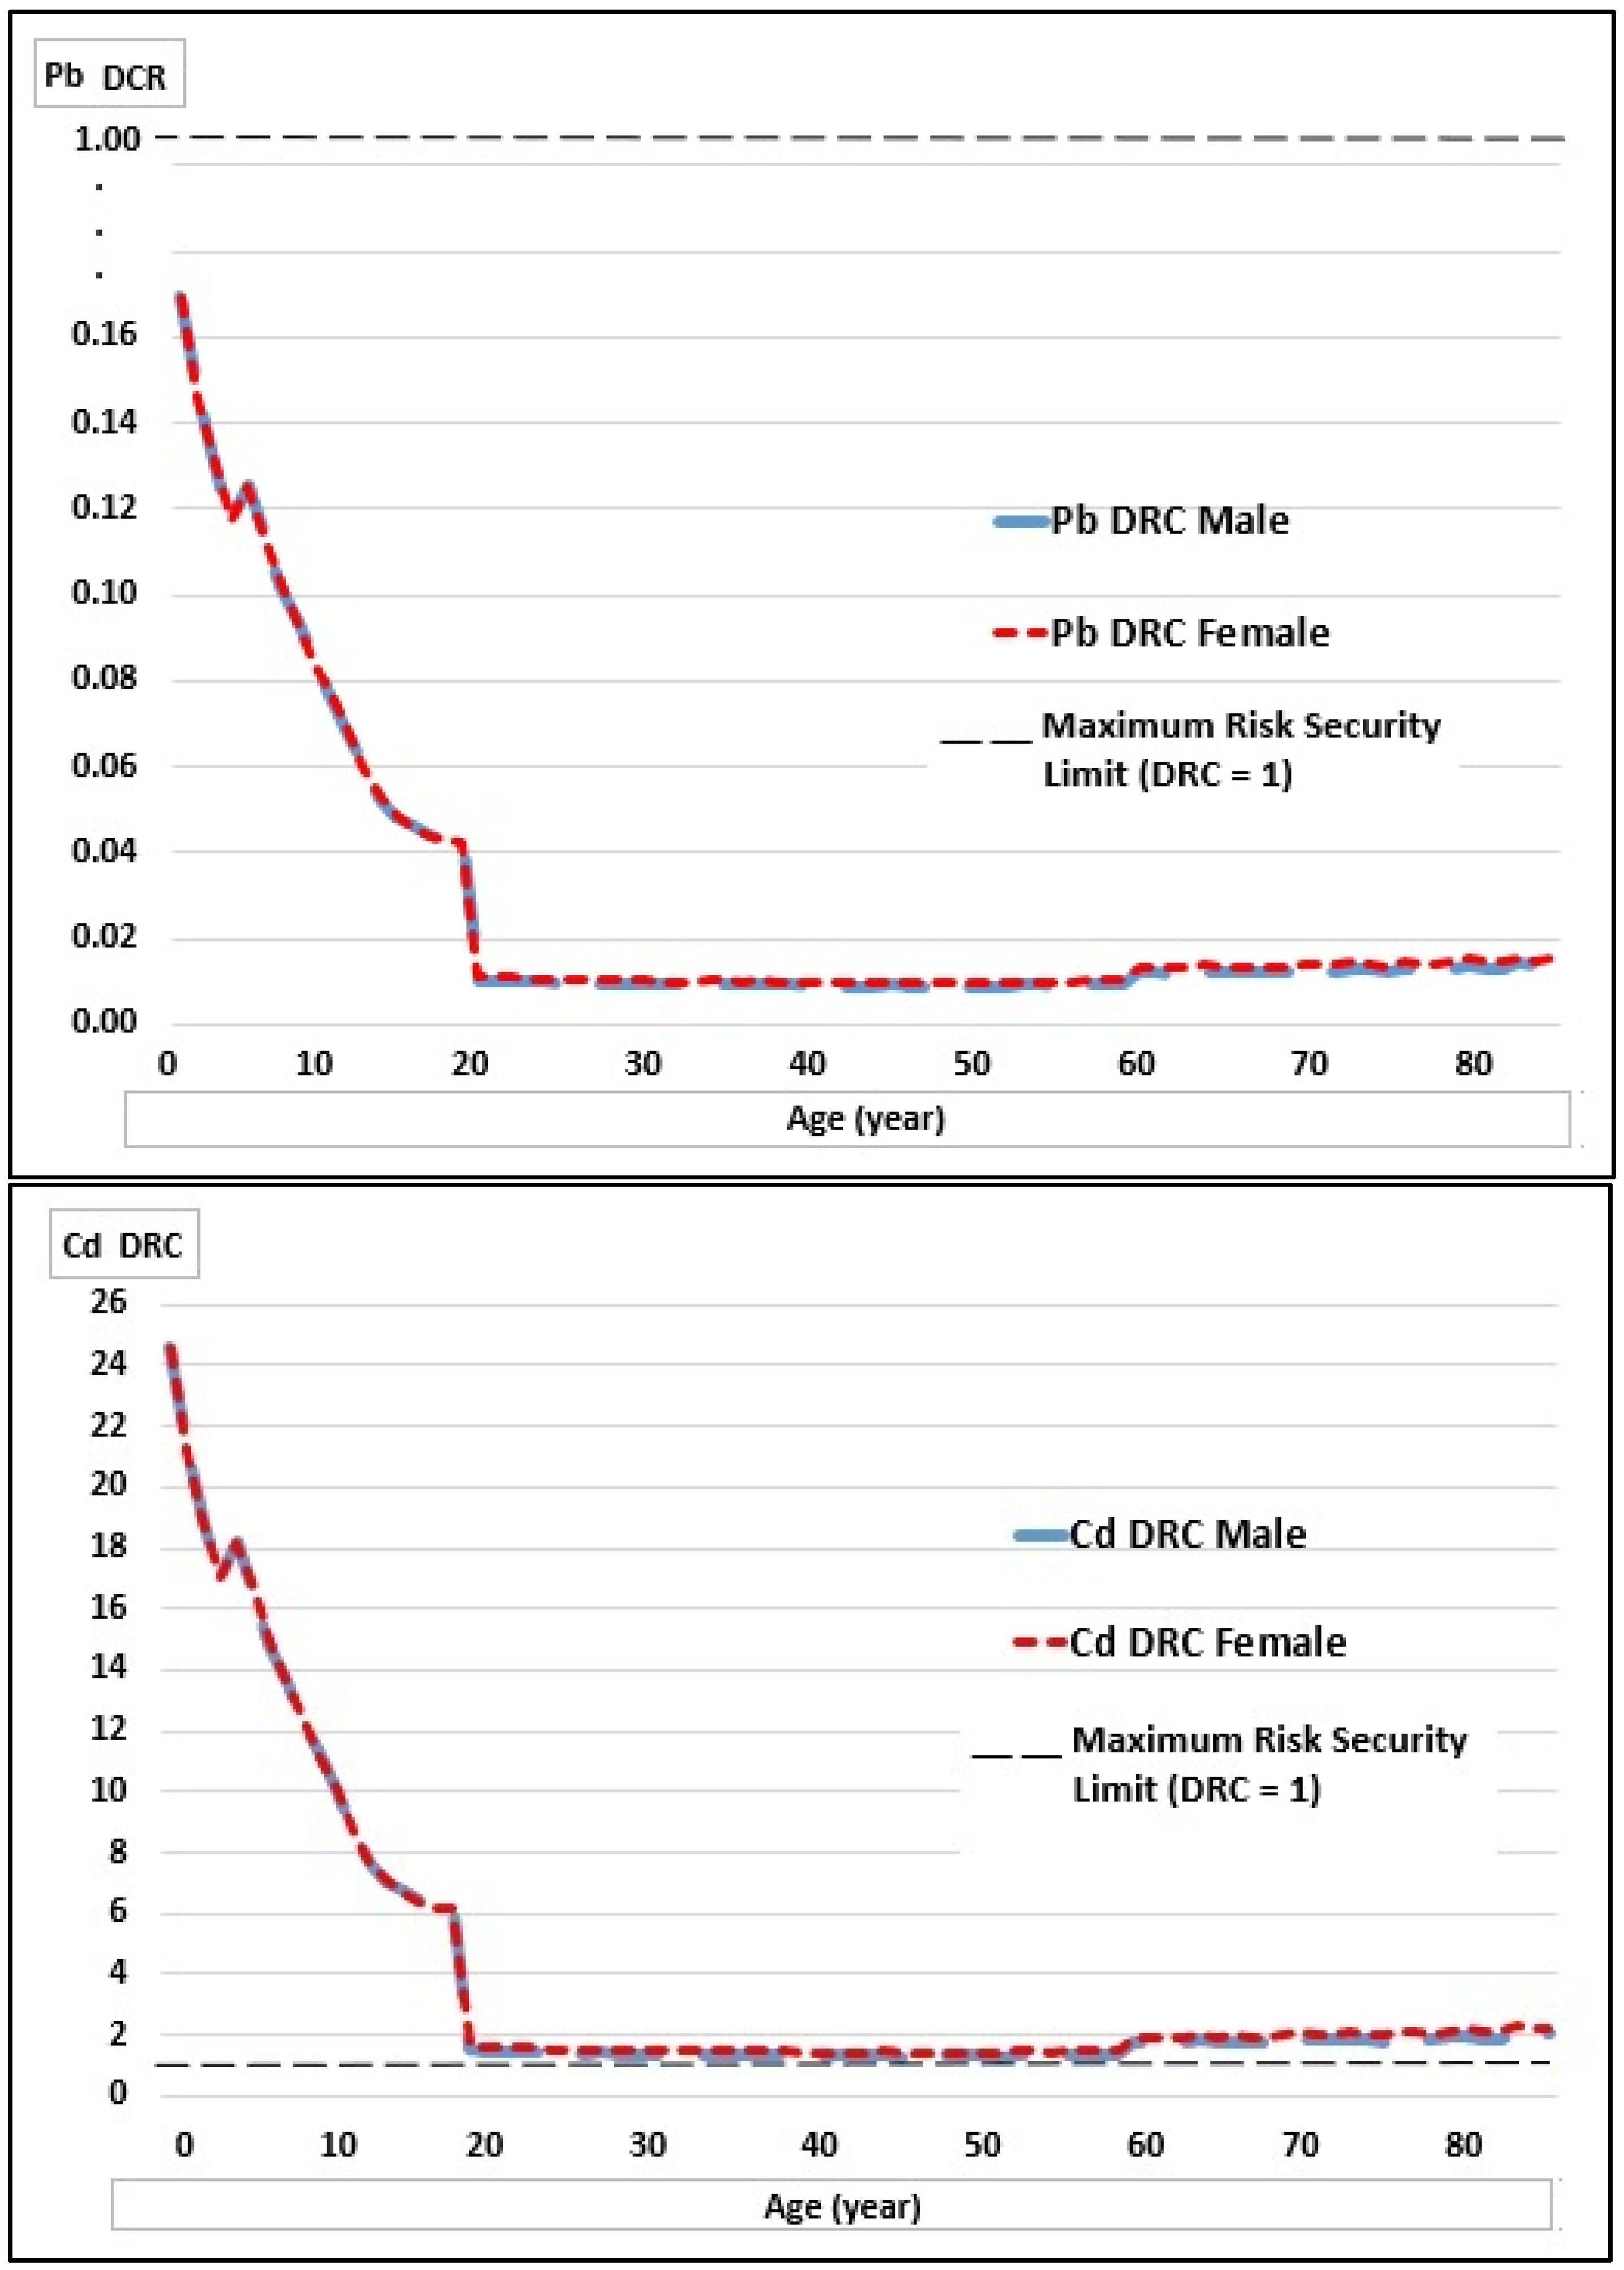
3.2. Dietary Intake and Risk to Pb and Cd from Milk Consumption
3.3. Target Hazard Quotient (THQ)
3.4. Hazard Index
4. Discussion
4.1. Concentration of Pb and Cd in Raw Milk
4.2. Dietary Intake and Risk to Pb and Cd from Milk Consumption
4.3. Implications for Peru
5. Conclusions
Author Contributions
Funding
Institutional Review Board Statement
Informed Consent Statement
Data Availability Statement
Acknowledgments
Conflicts of Interest
References
- Foroutan, A.; Guo, A.C.; Vazquez-Fresno, R.; Lipfert, M.; Zhang, L.; Zheng, J.; Badran, H.; Budinski, Z.; Mandal, R.; Ametaj, B.N.; et al. Chemical Composition of Commercial Cow’s Milk. J. Agric. Food Chem. 2019, 67, 4897–4914. [Google Scholar] [CrossRef] [PubMed]
- Marshall, T.A.; Curtis, A.M.; Cavanaugh, J.E.; Warren, J.J.; Levy, S.M. Higher longitudinal milk intakes are associated with increased height in a birth cohort followed for 17 years. J. Nutr. 2018, 148, 1144–1149. [Google Scholar] [CrossRef] [PubMed]
- Givens, D.I. MILK Symposium review: The importance of milk and dairy foods in the diets of infants, adolescents, pregnant women, adults, and the elderly. J. Dairy Sci. 2020, 103, 9681–9699. [Google Scholar] [CrossRef] [PubMed]
- Alexander, D.D.; Bylsma, L.C.; Vargas, A.J.; Cohen, S.S.; Doucette, A.; Mohamed, M.; Irvin, S.R.; Miller, P.E.; Watson, H.; Fryzek, J.P. Dairy consumption and CVD: A systematic review and meta-analysis. Br. J. Nutr. 2016, 115, 737–750. [Google Scholar] [CrossRef] [Green Version]
- Guo, J.; Astrup, A.; Lovegrove, J.A.; Gijsbers, L.; Givens, D.I.; Soedamah-Muthu, S.S. Milk and dairy consumption and risk of cardiovascular diseases and all-cause mortality: Dose–response meta-analysis of prospective cohort studies. Eur. J. Epidemiol. 2017, 32, 269–287. [Google Scholar] [CrossRef] [Green Version]
- Su, C.; Gao, Y.; Qu, X.; Zhou, X.; Yang, X.; Huang, S.; Han, L.; Zheng, N.; Wang, J. The Occurrence, Pathways, and Risk Assessment of Heavy Metals in Raw Milk from Industrial Areas in China. Toxics 2021, 9, 320. [Google Scholar] [CrossRef]
- Hasan, G.M.; Kabir, M.H.; Miah, M.A. Determination of heavy metals in raw and pasteurized liquid milk of Bangladesh to assess the potential health risks. Food Res. 2022, 6, 233–237. [Google Scholar] [CrossRef]
- De la Cueva, F.; Naranjo, A.; Puga Torres, B.; Aragón, E. Presence of heavy metals in raw bovine milk from Machachi, Ecuador (Presencia de metales pesados en leche cruda bovina de Machachi, Ecuador). Rev. Cienc. Vida 2021, 33, 21–30. Available online: https://orcid.org/10.17163/lgr.n33.2021.02 (accessed on 12 November 2021).
- Sarsembayeva, N.B.; Abdigaliyeva, T.B.; Utepova, Z.A.; Biltebay, A.N.; Zhumagulova, S.Z. Heavy metal levels in milk and fermented milk products produced in the Almaty region, Kazakhstan. Vet. World 2020, 13, 609–613. [Google Scholar] [CrossRef] [Green Version]
- Chirinos-Peinado, D.; Castro-Bedriñana, J. Lead and cadmium blood levels and transfer to milk in cattle reared in a mining area. Heliyon 2020, 6, e03579. [Google Scholar] [CrossRef]
- Safonov, V. Assessment of Heavy Metals in Milk Produced by Black-and-White Holstein Cows from Moscow. Curr. Res. Nutr. Food Sci. J. 2020, 8, 410–415. [Google Scholar] [CrossRef]
- Koyuncu, M.; Alwazeer, D. Determination of trace elements, heavy metals, and antimony in polyethylene terephthalate–bottled local raw cow milk of Iğdır region in Turkey. Environ. Monit. Assess. 2019, 191, 666. [Google Scholar] [CrossRef] [PubMed]
- Sujka, M.; Pankiewicz, U.; Kowalski, R.; Mazurek, A.; Ślepecka, K.; Góral, M. Determination of the content of Pb, Cd, Cu, Zn in dairy products from various regions of Poland. Open Chem. 2019, 17, 694–702. [Google Scholar] [CrossRef]
- Sobhanardakani, S. Human Health Risk Assessment of Cd, Cu, Pb and Zn through Consumption of Raw and Pasteurized Cow’s Milk. Iran J. Public Health 2018, 47, 1172–1180. [Google Scholar]
- Norouzirad, R.; González-Montaña, J.R.; Martínez-Pastor, F.; Hosseini, H.; Shahrouzian, A.; Khabazkhoob, M.; Malayeri, F.A.; Bandani, H.; Paknejad, M.; Foroughi-Nia, B.; et al. Lead and cadmium levels in raw bovine milk and dietary risk assessment in areas near petroleum extraction industries. Sci. Total Environ. 2018, 635, 308–314. [Google Scholar] [CrossRef]
- Harlia, E.; Rahmah, K.N.; Suryanto, D. Food safety of milk and dairy product of dairy cattle from heavy metal contamination. IOP Conf. Ser. Environ. Earth Sci. 2018, 102, 012050. [Google Scholar] [CrossRef]
- Shahbazi, Y.; Ahmadi, F.; Fakhari, F. Voltammetric determination of Pb, Cd, Zn, Cu and Se in milk and dairy products collected from Iran: An emphasis on permissible limits and risk assessment of exposure to heavy metals. Food Chem. 2016, 192, 1060–1067. [Google Scholar] [CrossRef]
- Noori, N.; Noudoost, B.; Hatami Nia, M. The assessment of lead pollution in milk collected from all dairy farms in Lorestan province, Iran. Toxin Rev. 2016, 35, 196–200. [Google Scholar] [CrossRef]
- Muhib, M.I.; Chowdhury, M.A.Z.; Easha, N.J.; Rahman, M.M.; Shammi, M.; Fardous, Z.; Bari, M.L.; Uddin, M.K.; Kurasaki, M.; Alam, M.K. Investigation of heavy metal contents in cow milk samples from area of Dhaka, Bangladesh. Int. J. Food Contam. 2016, 3, 16. [Google Scholar] [CrossRef]
- MIDAGRI. Anuario Estadístico de la Producción Ganadera y Avícola 2020; León Hinostroza, C., Ed.; Ministerio de Desarrollo Agrario y Riego—Midagri: Lima, Peru, 2021; Available online: https://bit.ly/3BBIvxs (accessed on 24 August 2021).
- Castro González, N.P.; Moreno-Rojas, R.; Calderón Sánchez, F.; Moreno Ortega, A.; Meneses, M.J. Assessment risk to children’s health due to consumption of cow’s milk in polluted areas in Puebla and Tlaxcala, Mexico. Food Addit. Contam. Part B Surveill. 2017, 10, 200–207. [Google Scholar] [CrossRef]
- López-Rodríguez, G.; Galván, M.; González-Unzaga, M.; Hernández Ávila, J.; Pérez-Labra, M. Blood toxic metals and hemoglobin levels in Mexican children. Environ. Monit. Assess. 2017, 189, 179. [Google Scholar] [CrossRef] [PubMed]
- Castro-Bedriñana, J.; Chirinos-Peinado, D.; Ríos-Ríos, E. Lead content and placental weight and its association with gestational age, weight, length and hemoglobin in newborns of metallurgical region—Peru. Rev. Toxicol. 2016, 33, 88–92. Available online: http://rev.aetox.es/wp/wp-content/uploads/2016/12/33-2-2.pdf (accessed on 21 November 2021).
- Bellinger, D.C.; Malin, A.; Wright, R.O. Chapter One—The Neurodevelopmental Toxicity of Lead: History, Epidemiology, and Public Health Implications. In Advances in Neurotoxicology; Aschner, M., Costa, L.G., Eds.; Academic Press: Cambridge, MA, USA, 2018; Volume 2, pp. 1–16. [Google Scholar] [CrossRef]
- Garí, M.; Grzesiak, M.; Krekora, M.; Kaczmarek, P.; Jankowska, A.; Król, A.; Kaleta, D.; Jerzyńska, J.; Janasik, B.; Kuraś, R.; et al. Prenatal exposure to neurotoxic metals and micronutrients and neurodevelopmental outcomes in early school age children from Poland. Environ. Res. 2022, 204, 112049. [Google Scholar] [CrossRef] [PubMed]
- Luo, H.; Gu, R.; Ouyang, H.; Wang, L.; Shi, S.; Ji, Y.; Bao, B.; Liao, G.; Xu, B. Cadmium exposure induces osteoporosis through cellular senescence, associated with activation of NF-κB pathway and mitochondrial dysfunction. Environ. Pollut. 2021, 290, 118043. [Google Scholar] [CrossRef] [PubMed]
- WHO. IARC Monographs on the Identification of Carcinogenic Hazards to Humans. Agents Classified by the IARC Monographs; World Health Organization: Geneva, Switzerland, 2021; pp. 1–130. Available online: https://monographs.iarc.who.int/agents-classified-by-the-iarc/ (accessed on 20 January 2022).
- ATSDR. The ATSDR 2019 Substance Priority List; Agency for Toxic Substances and Disease Registry: Atlanta, GA, USA, 2020. Available online: https://www.atsdr.cdc.gov/spl/ (accessed on 12 February 2022).
- Ahamed, M.; Siddiqui, M.K. Environmental lead toxicity and nutritional factors. Clin. Nutr. 2007, 26, 400–408. [Google Scholar] [CrossRef]
- Khan, K.; Khan, H.; Lu, Y.; Ihsanullah, I.; Nawab, J.; Khan, S.; Shah, N.S.; Shamshad, I.; Maryam, A. Evaluation of toxicological risk of foodstuffs contaminated with heavy metals in Swat, Pakistan. Ecotoxicol. Environ. Saf. 2014, 108, 224–232. [Google Scholar] [CrossRef]
- Khan, M.; Malik, R.; Muhammad, S.; Ullah, F.; Qadir, A. Health risk assessment of consumption of heavy metals in market food crops from Sialkot and Gujranwala districts, Pakistan. Hum. Ecol. Risk Assess. Int. J. 2015, 21, 327–337. [Google Scholar] [CrossRef]
- Sobhanardakani, S.; Tayebi, L.; Hosseini, S.V. Health risk assessment of arsenic and heavy metals (Cd, Cu, Co, Pb, and Sn) through consumption of caviar of Acipenser persicus from southern Caspian Sea. Environ. Sci. Pollut. Res. 2018, 25, 2664–2671. [Google Scholar] [CrossRef]
- Zhou, X.; Zheng, N.; Su, C.; Wang, J.; Soyeurt, H. Relationships between Pb, As, Cr, and Cd in individual cows’ milk and milk composition and heavy metal contents in water, silage, and soil. Environ. Pollut. 2019, 255, 113322. [Google Scholar] [CrossRef]
- Castro-Bedriñana, J.; Chirinos-Peinado, D.; García-Olarte, E.; Quispe-Ramos, R. Lead transfer in the soil-root-plant system in a highly contaminated Andean area. PeerJ 2021, 9, e10624. [Google Scholar] [CrossRef]
- Castro–González, N.P.; Calderón–Sánchez, F.; Pérez–Sato, M.; Soní–Guillermo, E.; Reyes–Cervantes, E. Health risk due to chronic heavy metal consumption via cow’s milk produced in Puebla, Mexico, in irrigated wastewater areas. Food Addit. Contam. Part B 2019, 12, 38–44. [Google Scholar] [CrossRef] [PubMed]
- Boudebbouz, A.; Boudalia, S.; Bousbia, A.; Habila, S.; Boussadia, M.I.; Gueroui, Y. Heavy metals levels in raw cow milk and health risk assessment across the globe: A systematic review. Sci. Total Environ. 2021, 751, 141830. [Google Scholar] [CrossRef] [PubMed]
- Castro-Bedrinana, J.; Chirinos-Peinado, D.; Ríos-Ríos, E.; Machuca-Campuzano, M.; Gomez-Ventura, E. Dietary risk of milk contaminated with lead and cadmium in areas near mining-metallurgical industries in the Central Andes of Peru. Ecotoxicol. Environ. Saf. 2021, 220, 112382. [Google Scholar] [CrossRef] [PubMed]
- Codex Alimentarius Commission. Report of the 50th Session of the Codex Committee on Food Additives and Contaminants; Codex Alimentarius Commission: Hague, The Netherlands, 2011. [Google Scholar]
- European-Union. Commission Regulation (EU) 2015/1005 of 25 June 2015 Amending Regulation (EC) N° 1881/2006 as Regards Maximum Levels of Lead in Certain Foodstuffs. Off. J. Eur. Union 2015, 161, 9–12. Available online: http://eur-lex.europa.eu/legal-content/EN/TXT/PDF/?uri=CELEX:32015R1005&from=EN (accessed on 20 January 2022).
- Malhat, F.; Hagag, M.; Saber, A.; Fayz, A.E. Contamination of Cows milk by heavy metal in Egypt. Bull. Environ. Contam. Toxicol. 2012, 88, 611–613. [Google Scholar] [CrossRef]
- NTP. NTP. NTP 202.001. Leche y productos lácteos. Leche cruda. Requisitos. In Catálogo de Normas Técnicas Sobre Productos Lácteos, 6th ed.; CID INACAL: Lima, Peru, 2016. [Google Scholar]
- NTP. 202.112, 1998. Leche y Productos Lácteos. Leche Cruda. Muestreo de Productos Lácteos; CID INACAL: Lima, Peru, 2016. [Google Scholar]
- Latimer, G.W. AOAC Official Method 973.35 Lead in Evaporated Milk Atomic Absorption Spectrophotometric Method, 20th ed.; AOAC International: Rockville, MD, USA, 2016; Volume 1. [Google Scholar]
- Ministerio del Ambiente (MINAM). 2017. Decreto Supremo N° 011-2017-MINAM. Aprueban Estándares de Calidad Ambiental (ECA) para Suelo (Approval of Environmental Quality Standards (EQS) for Soil). Available online: https://sinia.minam.gob.pe/download/file/fid/64487 (accessed on 20 January 2022).
- Aparco, J.; Bauista-Olortegui, W.; Astete-Robilliard, L.; Pillaca, J. Assessment of nutritional status, dietary intake patterns and physical activity in schoolchildren in the Cercado of Lima. Rev. Peru. Med. Exp. Salud Publica 2016, 33, 633–639. [Google Scholar] [CrossRef] [Green Version]
- USDA. Dairy Update. Country: Peru. United States Department of Agricultura. Foreing Agricultural Service. Report number: PE2020–0024. 2020. Available online: https://www.fas.usda.gov/data/peru-dairy-update (accessed on 20 January 2022).
- Dror, D.K.; Allen, L.H. Dairy product intake in children and adolescents in developed countries: Trends, nutritional contribution, and a review of association with health outcomes. Nutr. Rev. 2013, 72, 68–81. [Google Scholar] [CrossRef]
- Singh, G.M.; Micha, R.; Khatibzadeh, S.; Shi, P.; Lim, S.; Andrews, K.G.; Engell, R.E.; Ezzati, M.; Mozaffarian, D.; Global Burden of Diseases Nutrition and Chronic Diseases Expert Group (NutriCoDE). Global, regional, and national consumption of sugar-sweetened beverages, fruit juices, and milk: A systematic assessment of beverage intake in 187 countries. PLoS ONE 2015, 10, e0124845. [Google Scholar] [CrossRef] [Green Version]
- Restrepo-Betancur, L.; Peña-Serna, C.; Zapata-López, N. Milk Availability of South American Countries in the Last Five Decades: Elements for Analysis and Future Prospects. Inf. Tecnol. 2019, 30, 77–84. [Google Scholar] [CrossRef] [Green Version]
- CENAN-INEI. Estado Nutricional en el Perú. Componente Nutricional ENAHO-CENAN-INS; Ministerio de Salud: Lima, Peru, 2011; Available online: https://bvs.minsa.gob.pe/local/MiNSA/1843.pdf (accessed on 15 December 2021).
- Christophoridis, C.; Kosma, A.; Evgenakis, E.; Bourliva, A.; Fytianos, K. Determination of heavy metals and health risk assessment of cheese products consumed in Greece. J. Food Compos. Anal. 2019, 82, 103238. [Google Scholar] [CrossRef]
- Năstăsescu, V.; Mititelu, M.; Goumenou, M.; Docea, A.O.; Renieri, E.; Udeanu, D.I.; Oprea, E.; Arsene, A.L.; Dinu-Pîrvu, C.E.; Ghica, M. Heavy metal and pesticide levels in dairy products: Evaluation of human health risk. Food Chem. Toxicol. 2020, 146, 111844. [Google Scholar] [CrossRef] [PubMed]
- JECFA. Joint FAO/WHO Expert Committee on Food Additives. Evaluation of Certain Food Additives and Contaminants. 73 Report, 2010; Technical Report Series; WHO: Geneva, Switzerland, 2011; N°. 960; p. 237. Available online: http://apps.who.int/iris/bitstream/handle/10665/44515/WHO_TRS_960_eng.pdf (accessed on 14 December 2021).
- EFSA (European Food Safety Authority). Cadmium dietary exposure in the European population. EFSA J. 2012, 10, 2551. Available online: https://www.efsa.europa.eu/en/efsajournal/pub/2551 (accessed on 24 October 2021). [CrossRef]
- Food and Agriculture Organization; World Health Organization. Safety Evaluation of Certain Food Additives and Contaminants: Prepared by the Seventy Fourth Meeting of the Joint FAO/WHO Expert Committee on Food Additives (JECFA); World Health Organization: Geneva, Switzerland, 2012. [Google Scholar]
- Jin, Y.; Liu, P.; Sun, J.; Wang, C.; Min, J.; Zhang, Y.; Wang, S.; Wu, Y. Dietary exposure and risk assessment to lead of the population of Jiangsu province, China. Food Addit. Contam. Part A 2014, 31, 1187–1195. [Google Scholar] [CrossRef] [PubMed]
- Juric, A.K.; Batal, M.; David, W.; Sharp, D.; Schwartz, H.; Ing, A.; Fediuk, K.; Black, A.; Tikhonov, C.; Chan, H.M.; et al. Risk assessment of dietary lead exposure among First Nations people living on-reserve in Ontario, Canada using a total diet study and a probabilistic approach. J. Hazard. Mater. 2018, 344, 55–63. [Google Scholar] [CrossRef] [PubMed]
- Rahmani, J.; Fakhri, Y.; Shahsavani, A.; Bahmani, Z.; Urbina, M.A.; Chirumbolo, S.; Keramati, H.; Moradi, B.; Bay, A.; Bjørklund, G. A systematic review and meta-analysis of metal concentrations in canned tuna fish in Iran and human health risk assessment. Food Chem. Toxicol. 2018, 118, 753–765. [Google Scholar] [CrossRef]
- USEPA IRIS (US Environmental Protection Agency’s Integrated Risk Information System). Environmental Protection Agency Region I, Washington DC. 20460. 2011. Available online: http://www.epa.gov/iris/ (accessed on 14 December 2021).
- USEPA (United States Environmental Protection Agency EPA). Region III Risk-Based Concentration (RBC) Table 2008 Region III, 1650 Arch Street, Philadelphia, Pennsylvania 19103; USEPA: Washington, DC, USA, 2012. [Google Scholar]
- USEPA. USEPA Regional Screening Levels (RSLs)—User’s Guide. 2021. Available online: https://www.epa.gov/risk/regional-screening-levels-rsls-users-guide#toxicity (accessed on 14 December 2021).
- Liu, X.; Song, Q.; Tang, Y.; Li, W.; Xu, J.; Wu, J.; Wang, F.; Brookes, P.C. Human health risk assessment of heavy metals in soil-vegetable system: A multi-medium analysis. Sci. Total Environ. 2013, 463, 530–540. [Google Scholar] [CrossRef]
- Islam, S.; Ahmed, K.; Al Mamun, H.; Raknuzzaman, M. The concentration, source and potential human health risk of heavy metals in the commonly consumed foods in Bangladesh. Ecotoxicol. Environ. Saf. 2015, 122, 462–469. [Google Scholar] [CrossRef]
- Lante, A.; Lomolino, G.; Cagnin, M.; Spettoli, P. Content and characterisation of minerals in milk and in Crescenza and Squacquerone Italian fresh cheeses by ICP-OES. Food Control 2006, 17, 229–233. [Google Scholar] [CrossRef]
- Akinwunmi, F.; Akinhanmi, T.F.; Atobatele, Z.A.; Adewole, O.; Odekunle, K.; Arogundade, L.A.; Odukoya, O.O.; Olayiwola, O.M.; Ademuyiwa, O. Heavy metal burdens of public primary school children related to playground soils and classroom dusts in Ibadan North-West local government area, Nigeria. Environ. Toxicol. Pharmacol. 2017, 49, 21–26. [Google Scholar] [CrossRef]
- ATSDR. Lead Toxicity. Case Studies in Environmental Medicine (CSEM). 2019. Available online: https://www.atsdr.cdc.gov/csem/lead/docs/CSEM-Lead_toxicity_508.pdf (accessed on 14 December 2021).
- Neal, A.P.; Guilarte, T.R. Molecular neurobiology of lead (Pb (2+)): Effects on synaptic function. Mol. Neurobiol. 2010, 42, 151–160. [Google Scholar] [CrossRef] [Green Version]
- Andjušić, L.; Spasić, Z.; Milošević, B. Influence of industrial air pollutants on the content of cadmium in lucerne and cow milk. Maced. J. Anim. Sci. 2012, 2, 305–308. Available online: http://www.mjas.ukim.edu.mk/files/MJAS-02-3-_2012_120-Andjushic.pdf (accessed on 20 January 2022).
- Ismail, A.; Riaz, M.; Akhtar, S.; Goodwill, J.E.; Sun, J. Heavy metals in milk: Global prevalence and health risk assessment. Toxin Rev. 2017, 38, 1–12. [Google Scholar] [CrossRef]
- Ismail, A.; Riaz, M.; Akhtar, S.; Ismail, T.; Amir, M.; Zafar-ul-Hye, M. Heavy metals in vegetables and respective soils irrigated by canal, municipal waste and tube well waters. Food Addit. Contam. Part B 2014, 7, 213–219. [Google Scholar] [CrossRef] [PubMed]
- Affum, A.O.; Osae, S.D.; Kwaansa-Ansah, E.E.; Miyittah, M.K. Quality assessment and potential health risk of heavy metals in leafy and non-leafy vegetables irrigated with groundwater and municipal-waste-dominated stream in the Western Region, Ghana. Heliyon 2020, 6, e05829. [Google Scholar] [CrossRef]
- Adbol-Samad, A.; Nasseri, E.; Esfarjani, F.; Mohammadi-Nasrabadi, F.; Hashemi Moosavi, M.; Hoseini, H. A systematic review and meta-analysis of lead and cadmium concentrations in cow milk in Iran and human health risk assessment. Environ. Sci. Pollut. Res. 2020, 27, 10147–10159. [Google Scholar] [CrossRef]
- Chata Quenta, A. Presencia de Metales Pesados (Hg, As, Pb y Cd) en el Agua y Leche en la Cuenca del río Coata. Bachelor’s Thesis, Universidad Nacional del Altiplano, Puno, Peru, 2015. Available online: http://repositorio.unap.edu.pe/handle/UNAP/1930 (accessed on 24 October 2021).
- Bárcena, L. Determinación de Metales Tóxicos en la Leche de Ganado Bovino en el Ámbito de la Microcuenca Lechera de Umachiri, Región Puno. Master’s Thesis, Universidad Nacional del Altiplano, Puno, Peru, 2011. Available online: http://repositorio.unap.edu.pe/handle/UNAP/351 (accessed on 20 January 2022).
- Loganathan, P.; Hedley, M.J.; Grace, N.D. Pasture soils contaminated with fertilizer-derived cadmium and fluorine: Livestock effects. Rev. Environ. Contam. Toxicol. 2008, 192, 29–66. [Google Scholar] [CrossRef]
- Jiao, W.; Chen, W.; Chang, A.C.; Page, A.L. Environmental risks of trace elements associated with long-term phosphate fertilizers applications: A review. Environ. Pollut. 2012, 168, 44–53. [Google Scholar] [CrossRef]
- Oliva, M.; Camas, D.E.; Valqui, X.J.; Meléndez, J.B.; Leiva, S. Quantitative Determination of Cadmium (Cd) in Soil-Plant System in Potato Cropping (Solanum tuberosum var. Huayro). Adv. Agric. 2019, 2019, 9862543. [Google Scholar] [CrossRef] [Green Version]
- Cullen, J.T.; Maldonado, M.T. Biogeochemistry of Cadmium and Its Release to the Environment. In Cadmium: From Toxicity to Essentiality. Metal Ions in Life Sciences; Sigel, A., Sigel, H., Sigel, R., Eds.; Springer: Dordrecht, The Netherlands, 2013; Volume 11. [Google Scholar] [CrossRef]
- Nie, X.; Duan, X.; Zhang, M.; Zhang, Z.; Liu, D.; Zhang, F.; Wu, M.; Fan, X.; Yang, L.; Xia, X. Cadmium accumulation, availability, and rice uptake in soils receiving long-term applications of chemical fertilizers and crop straw return. Environ. Sci. Pollut. Res. 2019, 26, 31243–31253. [Google Scholar] [CrossRef]
- Rigby, H.; Smith, S.R. The significance of cadmium entering the human food chain via livestock ingestion from the agricultural use of biosolids, with special reference to the UK. Environ. Int. 2020, 143, 105844. [Google Scholar] [CrossRef]
- CDC. Response to Advisory Committee on Childhood Lead Poisoning Prevention Recommendations in “Low Level Lead Exposure Harms Children: A Renewed Call of Primary Prevention”; CDC: Atlanta, GA, USA, 2012. Available online: https://www.cdc.gov/nceh/lead/acclpp/cdc_response_lead_exposure_recs.pdf (accessed on 24 October 2021).
- Dolan, L.; Flannery, B.; Hoffman-Pennesi, D.; Gavelek, A.; Jones, O.; Kanwal, R.; Wolpert, B.; Gensheimer, K.; Dennis, S.; Fitzpatrick, S. A review of the evidence to support interim reference level for dietary lead exposure in adults. Regul. Toxicol. Pharmacol. 2020, 111, 104579. [Google Scholar] [CrossRef] [PubMed]
- Flannery, B.; Dolan, L.; Hoffman-Pennesi, D.; Gavelek, A.; Jones, O.; Kanwal, R.; Wolpert, B.; Gensheimer, K.; Dennis, S.; Fitzpatrick, S. US Food & Drug Administration’s Interim Reference Levels for Dietary Lead Exposure in Children and Women of Childbearing Age. Regul. Toxicol. Pharmacol. 2019, 110, 104516. [Google Scholar] [CrossRef] [PubMed]
- Bakircioglu, D.; Topraksever, N.; Yurtsever, S.; Kizildere, M.; Kurtulus, Y. Investigation of macro, micro and toxic element concentrations of milk and fermented milks products by using an inductively coupled plasma optical emission spectrometer, to improve food safety in Turkey. Microchem. J. 2018, 136, 133–138. [Google Scholar] [CrossRef]
- Martins, E.; Malpeli, A.; Asens, D.; Telese, L.; Fasano, V.; Vargas, V.; Tavella, M.; Colman, J. Contribution of diet to lead exposure among children aged 1 to 7 years in La Plata, Buenos Aires. Arch. Argent. Pediatr. 2018, 116, 14–20. [Google Scholar] [CrossRef]
- EFSA. European Food Safety Authority, Panel on Contaminants in the Food Chain (CONTAM); scientific opinion on tolerable weekly intake for cadmium. EFSA J. 2011, 9, 1975. Available online: https://www.efsa.europa.eu/en/efsajournal/pub/ (accessed on 24 October 2021).
- Lu, J.; Lan, J.; Li, X.; Zhu, Z. Blood lead and cadmium levels are negatively associated with bone mineral density in young female adults. Arch. Public Health 2021, 79, 116. [Google Scholar] [CrossRef]
- González, N.; Calderón, J.; Rúbies, A.; Timoner, I.; Castell, V.; Domingo, J.L.; Nadal, M. Dietary intake of arsenic, cadmium, mercury and lead by the population of Catalonia, Spain: Analysis of the temporal trend. Food Chem. Toxicol. 2019, 132, 110721. [Google Scholar] [CrossRef]
- IARC. WHO/IARC (World Health Organization/International Agency for Research on Cancer). List of Classifications, Agents Classified by the IARC Monographs. 2017. Available online: http://monographs.iarc.fr/ENG/Classification/latest_classif.php (accessed on 24 October 2021).
- IARC (Inorganic and Organic Lead Compounds). IARC Monographs on the Evaluation of Carcinogenic Risks to Humans; International Agency for Research on Cancer: Lyon, France, 2006; Volume 87, 529p, Available online: https://publications.iarc.fr/_publications/media/download/2742/4c6e963acd7ad3b767d0720848796ef7099dd02a.pdf (accessed on 24 October 2021).
- Satarug, S.; Vesey, D.; Gobe, G. Health risk assessment of dietary cadmium intake: Do current guidelines indicate how much is safe? Environ. Health Perspect. 2017, 125, 284–288. [Google Scholar] [CrossRef]


| Year | Country | Samples (n) | Rank (ug/kg) | Means (ug/kg) | Method | Reference |
|---|---|---|---|---|---|---|
| 2022 | Bangladeshi | 64 | 0.005–0.02 | 0.013 ± 0.004 | AAS | [7] Hasan et al., 2022 |
| 2021 | Ecuador | 58 | 1.6–719 | 208 | AAS | [8] De la cueva et al., 2021 |
| 2020 | Kazajstan | 120 | 1–8 | 4.5 | AAS | [9] Sarsembayeva et al., 2020 |
| 2020 | Peru | 20 | 540–600 | 580 ± 18 | AAS | [10] Chirinos & Castro, 2020 |
| 2020 | Russia | 1500 | 75–110 | 88 | AAS | [11] Safonov, 2020 |
| 2019 | Turkey | 20 | 25–124 | - | ICP-MS | [12] Koyuncu & Alwazeer, 2019 |
| 2019 | Poland | 12–13 | - | ICP-MS | [13] Sujka et al., 2019 | |
| 2018 | Iran | 72 | - | 32.83 ± 20.8 | ICP-OES | [14] Sobhanardakani, 2018 |
| 2018 | Iran | 118 | 0–250 | 47 ± 3.9 | GFAAS | [15] Norouzirad et al., 2018 |
| 2018 | Indonesia | 30 | - | 558 ± 43 | AAS | [16] Harlia et al., 2018 |
| 2016 | Iran | 50 | - | 14 | Voltametry | [17] Shahbazi et al., 2016 |
| 2016 | Iran | 85 | 0.7–23.7 | 3.24 ± 1.32 | AAS | [18] Noori et al., 2016 |
| Year | Country | Samples (n) | Rank (ug/kg) | Means (ug/kg) | Method | Reference |
|---|---|---|---|---|---|---|
| 2022 | Bangladeshi | 64 | 0.021–0.045 | 0.032 ± 0.005 | AAS | [7] Hasan et al., 2022 |
| 2020 | Kazajstan | 120 | 2.5–2.9 | 2.7 | AAS | [9] Sarsembayeva et al., 2020 |
| 2020 | Peru | 20 | 11–32 | 19.7 ± 7.3 | AAS | [10] Chirinos & Castro, 2020 |
| 2020 | Russia | 1500 | 4–11 | 7.7 | AAS | [11] Safonov, 2020 |
| 2019 | Turkey | 20 | 0.1–4.0 | - | ICP-MS | [12] Koyuncu & Alwazeer, 2019 |
| 2019 | Poland | 0–6.7 | - | ICP-MS | [13] Sujka et al., 2019 | |
| 2018 | Iran | 118 | 0–100 | 4.7 ± 1 | GFAAS | [15] Norouzirad et al., 2018 |
| 2018 | Indonesia | 30 | - | 110 | AAS | [16] Harlia et al., 2018 |
| 2016 | Iran | 50 | - | 1 | Voltametric | [17] Shahbazi et al., 2016 |
| 2016 | Bangladeshi | 90 | <1–75 | 53 | FASS | [19] Muhib et al., 2016 |
| Variable | Mean | SD | VC, % | Minimum | Maximum | MPL, µg/kg |
|---|---|---|---|---|---|---|
| Pb, µg/kg | 15b | 2.6 | 17.90 | 10 | 20 | 20 a |
| Cd, µg/kg | 505 a | 123.2 | 24.41 | 280 | 690 | 2.6 b |
| Age (Year) | Body Weight/sex (kg) | DMI (kg) | EDI Pb (µg/kg BW/d) | EDI Cd (µg/kg BW/d) | EDI Pb/d (µg) | EDI Cd/d (µg) | |||||
|---|---|---|---|---|---|---|---|---|---|---|---|
| Male | Female | Male | Female | Male | Female | Male | Female | Male | Female | ||
| 2 | 12.40 | 11.80 | 0.500 | 0.605 | 0.636 | 20.36 | 21.40 | 7.5 | 7.5 | 252 | 252 |
| 5 | 17.90 | 17.40 | 0.500 | 0.419 | 0.431 | 14.11 | 14.51 | 7.5 | 7.5 | 252 | 252 |
| 10 | 29.60 | 29.80 | 0.600 | 0.304 | 0.302 | 10.24 | 10.17 | 9.0 | 9.0 | 310 | 310 |
| 15 | 51.70 | 49.30 | 0.600 | 0.174 | 0.183 | 5.86 | 6.15 | 9.0 | 9.0 | 310 | 310 |
| 20 | 60.30 | 53.50 | 0.157 | 0.038 | 0.046 | 1.27 | 1.54 | 2.3 | 2.4 | 76 | 82 |
| 30 | 66.30 | 59.60 | 0.157 | 0.034 | 0.041 | 1.15 | 1.38 | 2.3 | 2.4 | 76 | 82 |
| 40 | 69.30 | 61.60 | 0.154 | 0.032 | 0.039 | 1.06 | 1.32 | 2.2 | 2.4 | 74 | 81 |
| 50 | 67.60 | 60.70 | 0.154 | 0.032 | 0.040 | 1.09 | 1.34 | 2.2 | 2.4 | 74 | 81 |
| 60 | 64.80 | 59.20 | 0.195 | 0.043 | 0.052 | 1.44 | 1.74 | 2.8 | 3.1 | 93 | 103 |
| 70 | 59.30 | 54.50 | 0.195 | 0.047 | 0.056 | 1.58 | 1.89 | 2.8 | 3.1 | 93 | 103 |
| 80 | 56.30 | 52.90 | 0.195 | 0.049 | 0.058 | 1.66 | 1.95 | 2.8 | 3.1 | 93 | 103 |
| 85 | 55.60 | 49.50 | 0.195 | 0.050 | 0.062 | 1.68 | 2.08 | 2.8 | 3.1 | 93 | 103 |
| Age (Year) | WI Pb (µg) | WI Cd (µg) | TWI (µg) | DRC Pb | DRC Cd | |||||
|---|---|---|---|---|---|---|---|---|---|---|
| Male | Female | Male | Female | Pb | Cd | Male | Female | Male | Female | |
| 2 | 52.50 | 52.50 | 1767 | 1767 | 310 | 72 | 0.17 | 0.17 | 24.6 | 24.6 |
| 5 | 52.50 | 52.50 | 1767 | 1767 | 448 | 104 | 0.12 | 0.12 | 17.0 | 17.0 |
| 10 | 63.00 | 63.00 | 2121 | 2121 | 740 | 172 | 0.09 | 0.09 | 12.4 | 12.4 |
| 15 | 63.00 | 63.00 | 2121 | 2121 | 1293 | 300 | 0.05 | 0.05 | 7.0 | 7.0 |
| 20 | 15.86 | 17.12 | 534 | 576 | 1508 | 350 | 0.01 | 0.01 | 1.5 | 1.7 |
| 30 | 15.86 | 17.12 | 534 | 576 | 1658 | 385 | 0.01 | 0.01 | 1.4 | 1.5 |
| 40 | 15.86 | 17.12 | 534 | 576 | 1663 | 386 | 0.01 | 0.01 | 1.4 | 1.5 |
| 50 | 15.33 | 16.90 | 516 | 569 | 1665 | 386 | 0.01 | 0.01 | 1.3 | 1.5 |
| 60 | 15.83 | 16.90 | 516 | 569 | 1695 | 393 | 0.01 | 0.01 | 1.3 | 1.5 |
| 70 | 19.43 | 21.42 | 654 | 721 | 1483 | 354 | 0.01 | 0.01 | 1.9 | 2.1 |
| 80 | 19.43 | 21.42 | 654 | 721 | 1408 | 327 | 0.01 | 0.02 | 2.0 | 2.2 |
| 85 | 19.43 | 21.42 | 654 | 721 | 1390 | 322 | 0.01 | 0.02 | 2.0 | 2.2 |
Publisher’s Note: MDPI stays neutral with regard to jurisdictional claims in published maps and institutional affiliations. |
© 2022 by the authors. Licensee MDPI, Basel, Switzerland. This article is an open access article distributed under the terms and conditions of the Creative Commons Attribution (CC BY) license (https://creativecommons.org/licenses/by/4.0/).
Share and Cite
Chirinos-Peinado, D.; Castro-Bedriñana, J.; Ríos-Ríos, E.; Mamani-Gamarra, G.; Quijada-Caro, E.; Huacho-Jurado, A.; Nuñez-Rojas, W. Lead and Cadmium Bioaccumulation in Fresh Cow’s Milk in an Intermediate Area of the Central Andes of Peru and Risk to Human Health. Toxics 2022, 10, 317. https://0-doi-org.brum.beds.ac.uk/10.3390/toxics10060317
Chirinos-Peinado D, Castro-Bedriñana J, Ríos-Ríos E, Mamani-Gamarra G, Quijada-Caro E, Huacho-Jurado A, Nuñez-Rojas W. Lead and Cadmium Bioaccumulation in Fresh Cow’s Milk in an Intermediate Area of the Central Andes of Peru and Risk to Human Health. Toxics. 2022; 10(6):317. https://0-doi-org.brum.beds.ac.uk/10.3390/toxics10060317
Chicago/Turabian StyleChirinos-Peinado, Doris, Jorge Castro-Bedriñana, Elva Ríos-Ríos, Gloria Mamani-Gamarra, Elías Quijada-Caro, Analí Huacho-Jurado, and Wilfredo Nuñez-Rojas. 2022. "Lead and Cadmium Bioaccumulation in Fresh Cow’s Milk in an Intermediate Area of the Central Andes of Peru and Risk to Human Health" Toxics 10, no. 6: 317. https://0-doi-org.brum.beds.ac.uk/10.3390/toxics10060317