
Composition, Source Apportionment, and Health Risk of PM2.5-Bound Metals during Winter Haze in Yuci College Town, Shanxi, China


Department of Chemistry and Chemical Engineering, Jinzhong University, Jinzhong 030619, China
*
Author to whom correspondence should be addressed.
Toxics 2022, 10(8), 467; https://0-doi-org.brum.beds.ac.uk/10.3390/toxics10080467
Submission received: 26 June 2022
/
Revised: 28 July 2022
/
Accepted: 8 August 2022
/
Published: 11 August 2022
(This article belongs to the Special Issue Potentially Toxic Elements Pollution in Urban and Suburban Environments)
Abstract
:The composition, source, and health risks of PM2.5-bound metals were investigated during winter haze in Yuci College Town, Shanxi, China. The 24-h PM2.5 levels of 34 samples ranged from 17 to 174 μg·m−3, with a mean of 81 ± 35 μg·m−3. PM2.5-bound metals ranked in the following order: Zn > Cu > Pb > As > Ni > Cr (VI) > Cd > Co. The concentrations of 18% As and 100% Cr (VI) exceeded the corresponding standards of the Ambient Air Quality Standards set by China and the WHO. Subsequently, positive matrix factorization analyses revealed that the three major sources of metals were combustion (37.91%), traffic emissions (32.19%), and industry sources (29.9%). Finally, the non-carcinogenic risks for eight metals indicated that only 2.9% of the samples exceeded a threshold value of one, and As accounted for 45.31%. The total carcinogenic risk values for six metals (As, Cd, Co, Cr (VI), Ni, and Pb) were in the range from 10−6 to 10−4, with Cr (VI) and As accounting for 80.92% and 15.52%, respectively. In conclusion, winter haze in Yuci College Town was characterized by higher metal levels and health risks; among the metals, As and Cr (VI) were probably the main contributors.

1. Introduction
Atmospheric haze has attracted considerable attention, especially during winter. Atmospheric fine particulate matter (PM2.5) plays an important role in hazy episodes and is the fifth leading cause of death globally after high blood pressure, smoking, diabetes, and hypercholesterolemia [1]. It is significantly associated with the incidence and mortality of bronchitis, asthma, and lung cancer [2]. PM2.5 can be attached to a wide variety of chemical contaminants, such as polycyclic aromatic hydrocarbons (PAHs), heavy metals, nitrogen oxides, and emerging pollutants [3]. Some toxicants can be absorbed by the human respiratory system and can affect human health.
Studies on PM2.5-bound metals have been performed throughout the world; in some areas, the concentrations of PM2.5-bound metals have exceeded the threshold range of the WHO global air quality guidelines [4], such as in Isfahan of Iran [5], Saudi Arabia [6], Kitakyushu of Japan [7], as well as Beijing–Tianjin–Hebei [8], Xi’an [9], Guangzhou [10], and Taiyuan in China [11]. The source apportionment of heavy metals has helped to establish targeted pollution control strategies; for instance, coal burning, industrial pollution, and traffic often have been identified as the major contributors of metals [12,13,14]. In addition, PM2.5-bound metals pose health risks to humans [15]. Some metals have been identified as toxic and hazardous air pollutants in China [16] and some metals (e.g., As, Cd, Co, Cr, Ni, and Pb) have been defined by the WHO as carcinogenic to humans [17]. Therefore, a better understanding of the composition, source apportionment, and carcinogenic risk of metals in PM2.5 is crucial to protect human health, especially during haze periods.
Yuci College Town is located in the Yuci District, Jinzhong City, Shanxi Province, China, adjacent to the provincial capital of Taiyuan City. It covers an area of approximate 12 km2. It is a campus of provincial colleges and universities built by Shanxi Province. Currently, there are nearly ten colleges and universities, such as Taiyuan University of Technology, Shanxi Medical University, Taiyuan Normal University, and Jinzhong University. The total number of teachers and students in Yuci College Town is about 150,000. The campus has experienced frequent heavy air pollution in the past, particularly in winter. For instance, from January 2016 to December 2018, heavy air pollution events occurred 23 times for a total of 88 days in Jinzhong, Shanxi, China [18]. The predominant source of pollution was PM2.5, which accounted for 78.3% of the total pollution.
Shanxi Province is well-known for its coal resources in China, and coal mining is considered to be one of the most significant sources of heavy metal contamination. As previously reported, heavy metal pollution from As and its carcinogenic risk to humans have been reported in Shanxi’ mines [19]. Atmospheric PM2.5 pollution levels are very important to the health of teachers and students. However, investigations of PM2.5-bound heavy metal pollution are lacking in Yuci College Town, Shanxi, China (YCT of China), especially during winter haze periods.
The objectives of the present study were (1) to measure the concentrations of heavy metals (including As, Cd, Co, Cr, Cu, Ni, Pb, and Zn) in PM2.5 in YCT of China; (2) to analyze the source apportionment; and (3) to assess the health risks (non-carcinogenic and carcinogenic) of exposure to eight heavy metals, via inhalation exposure, during winter haze periods.
2. Experiments and Methods
2.1. PM2.5 Sample Collection
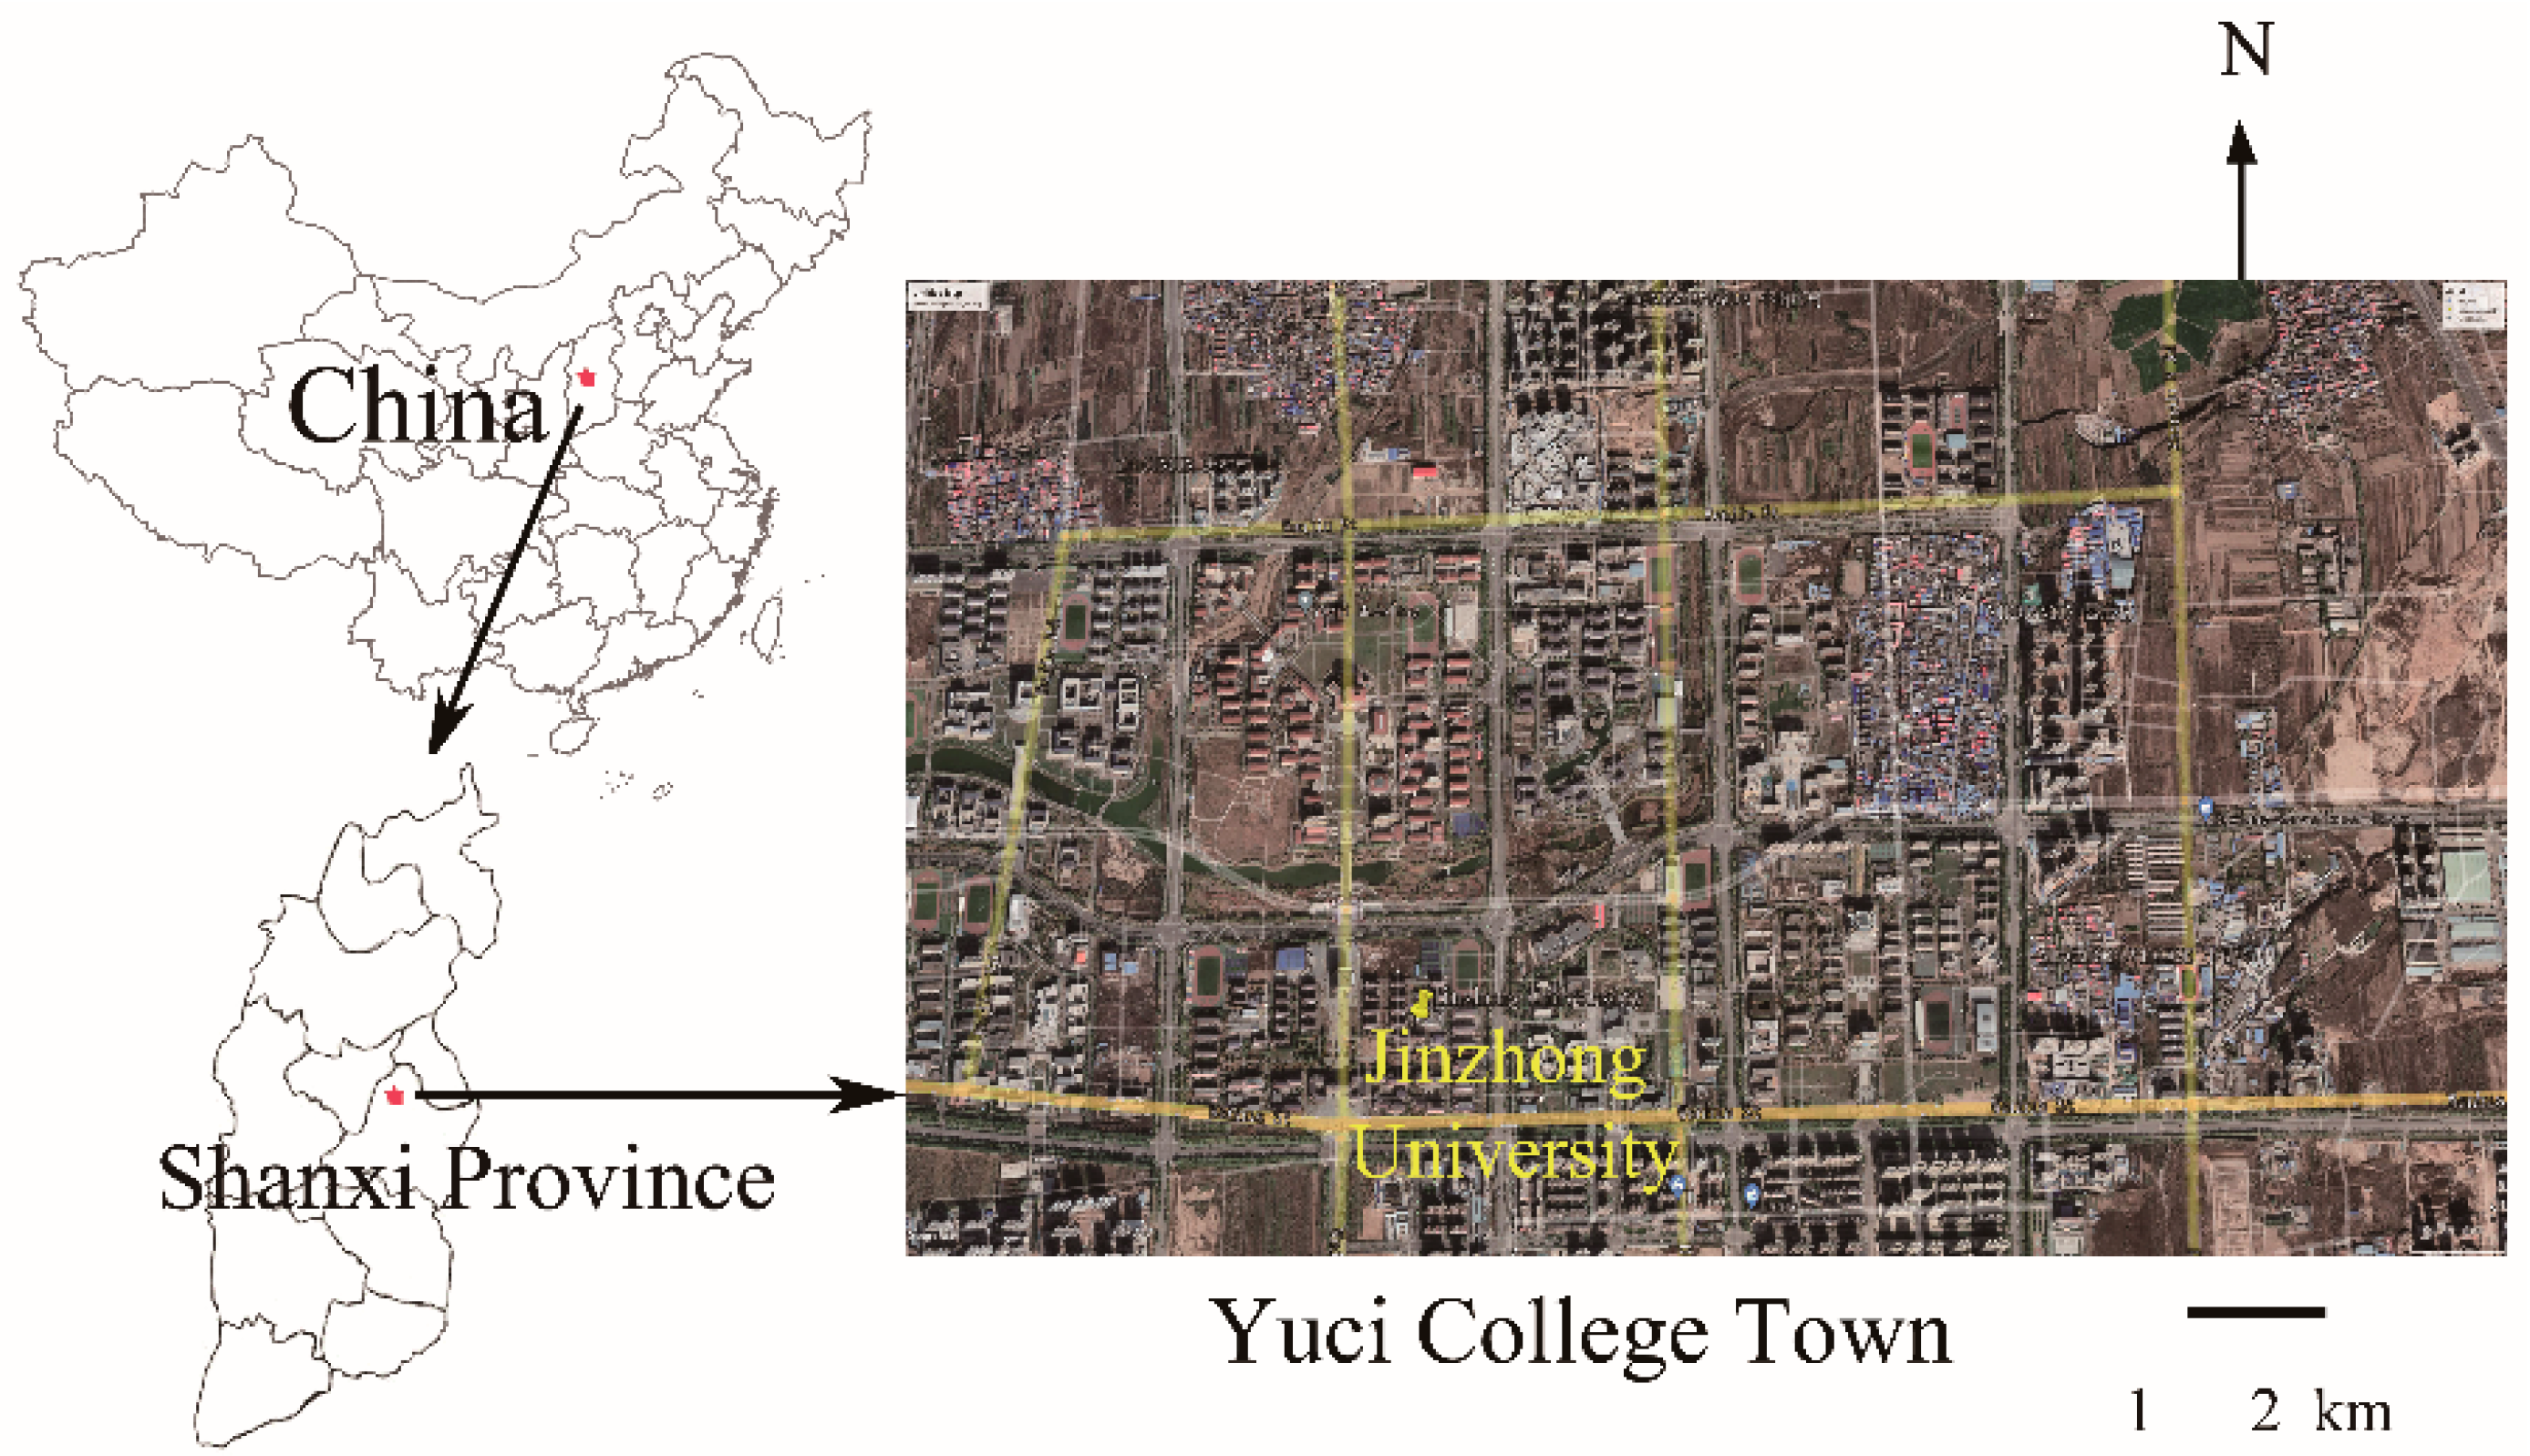
Figure 1 describes the location of the sampling site in Jinzhong University (Yuci district, Jinzhong City, Shanxi Province, China). This site is located at the southwest of Yuci College Town as well as multiple campuses and residential areas, representing an urban area. From 3 November 2020 to 9 December 2020, a total of 34 daily PM2.5 samples were collected using a medium flow particle sampler and quartz fiber filters at a gas flow rate of 100 L·min−1. The sampler was placed 15 m from the ground and surrounded by pollution-free emission sources. The daily 24-h mean of PM2.5 was calculated using the gravimetric method [20]. The filters were all baked at 450 °C for 4 h before sampling to remove organic contaminants. Then, the filters were placed in boxes with constant humidity (50% ± 5%) and temperature (24 ± 1 °C) for use. The filters were weighed after sampling, and the sensitivity of the balance was 0.01 mg. Finally, the filters were stored at −20 °C, and pollutants were extracted within 2 months.
2.2. Metals Analysis
The PM2.5 filters were digested on mixed acid, dissolved using a microwave digestion system, and the concentrations of eight metals (As, Cd, Co, Cr, Cu, Ni, Pb, and Zn) were analyzed by internal calibration using an inductively coupled plasma–mass spectrometer (ICP-MS, Agilent 7700), according to the method of HJ 657-2013 in China [21]. The concentration of Cr (VI) was calculated to be 1/7 of the measured Cr concentration according to the US EPA regional screening levels [22]. Detailed information on the digestion, internal standards (Table S1), and detection limit for metal analysis are shown in the Supplementary Information (SI).
2.3. PMF Model
The positive matrix factorization (PMF) model is widely used for source apportionment of PM2.5. It can simply transform the input data (multiple pollutant data arranged in matrix form) into a factor profile matrix and a factor contribution matrix. Detailed information was obtained according to the US EPA PMF 5.0 Fundamentals and User Guide [23]. Uncertainties (Unc) were calculated using the following equation:
If the concentration was higher than the method detection limit (MDL):
If the concentration was less than or equal to the MDL:
In addition, the rate of Qrobust/Qtrue was calculated to determine the optimal number of factors, and bootstrap (BS) and displacement (DISP) analyses were performed to estimate the uncertainties of the PMF model.
2.4. Human Health Risk Assessment
Health risks of heavy metals in PM2.5 were estimated via the inhalation pathway, as proposed by the US EPA [11]. The exposure concentration (EC) was calculated to assess the carcinogenic risk using Equation (3):
where EC is the exposure concentration (μg·m−3), CA is the contaminant concentration in air (μg·m−3), ET is the exposure time (24 h·d−1), EF is the exposure frequency (180 d·y−1), ED is the exposure duration (24 y for adults), and AT is the averaging lifetime: for non-carcinogens (24 × 365 × 24 h) and for carcinogens (70 × 365 × 24 h).
EC = (CA × ET × EF × ED)/AT
The hazard index (HI) is traditionally used to assess the overall non-carcinogenic risk posed by multiple chemicals, and it was hypothesized that all metal risks were additive effects despite existing synergistic effects, the equation for HI is defined as follow:
where HQ is the hazard quotient (unitless) and RfCi is the reference concentration of ith heavy metal (μg·m−3) for inhalation (Table 1). According to the US EPA [24], if the HI value is less than one, the exposed population is unlikely to experience obvious adverse health effects. In contrast, if the HI value exceeds one, an adverse effect may occur for a specific population.
HI = ∑HQi = ∑ECi/RfCi
Carcinogenic risk (CR) is defined as the probability of an individual developing any type of cancer throughout their lifetime owing to exposure to carcinogenic hazards. CR was summarized by inhalation for an individual over a lifetime according to the following equation:
where IUR is the inhalation unit risk (μg·m−3)−1 (Table 1). According to the US EPA [24], a CR lower than 10−6 indicates an acceptable level, a CR range of 10−6 to 10−4 is generally considered a potential risk level, and a CR above 10−4 is likely to be harmful to the human body.
CR = ∑CRi = ∑IUR × ECi
2.5. Air Mass Backward Trajectory
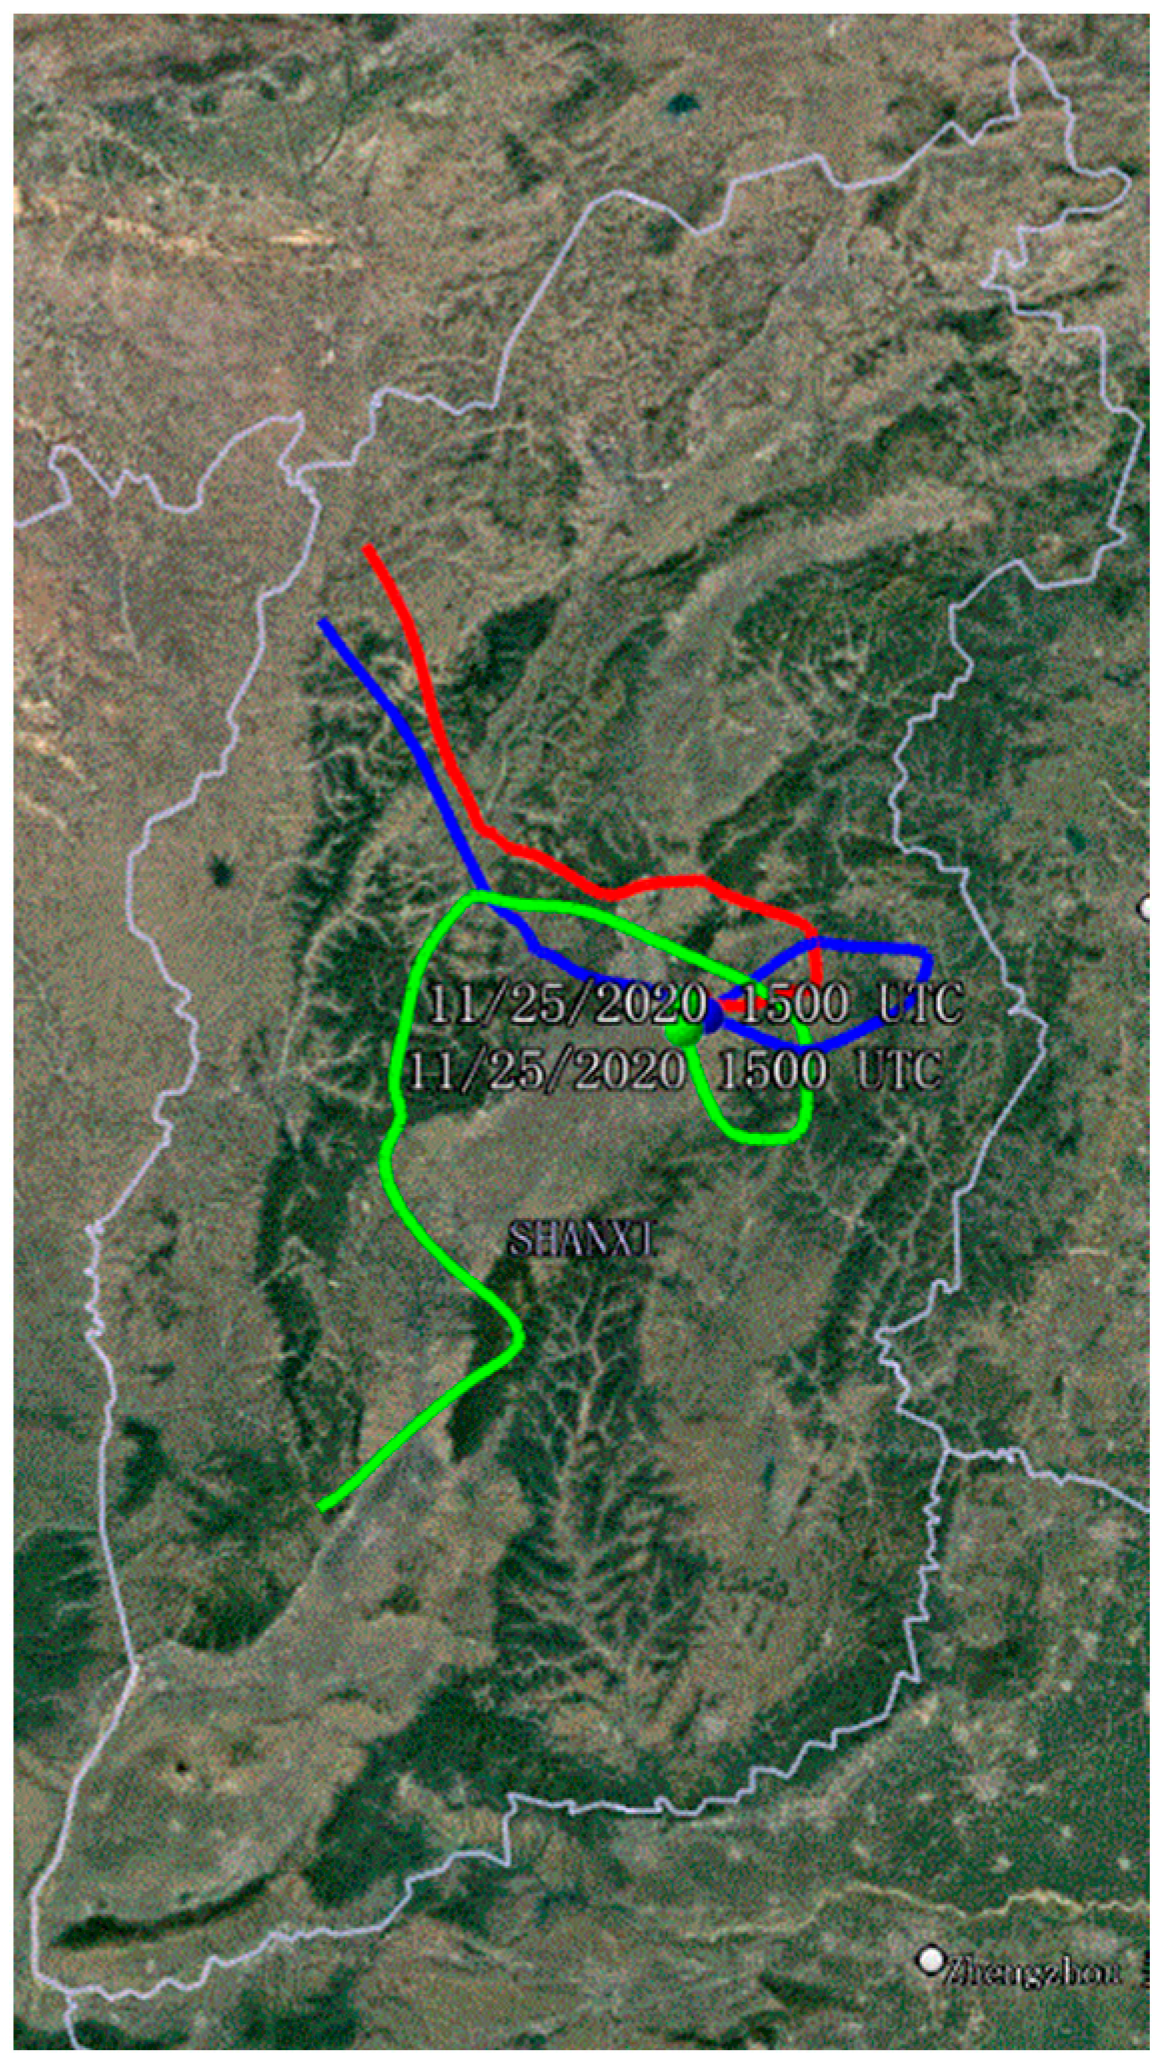
Backward trajectory was performed using the hybrid single-particle Lagrangian integrated trajectory (HYSPLIT) online model from the National Oceanic and Atmospheric Administration [27]. The start altitude was chosen at three different heights (50, 500, and 1000 m), representing the low, middle, and upper atmosphere, respectively. The global data assimilation system (GDAS) data of 72-h backward trajectories on 25 November 2020 are presented in Figure S1.
2.6. Network Data Collection
The consumption of end-use energy, the number of days that reached the air quality standards, and the annual mean concentrations of PM2.5 in Shanxi, China, were collected from the Shanxi Statistics Yearbook [28].
3. Results and Discussion
3.1. Mass Levels of PM2.5
The levels of PM2.5 are presented in Table S2, and their descriptive statistics are presented in Table 2. The daily PM2.5 concentrations of 34 samples ranged from 17 to 174 μg·m−3, with a median of 74 μg·m−3 and an average concentration of 81 ± 35 μg·m−3; 94% of the samples exceeded Grade I (35 μg·m−3) of the Chinese ambient air quality standards [29]; none of the samples reached the WHO’s AQG level (15 μg·m−3) in 2021 [30]; however, 53% of the samples reached the Grade II standard (75 μg·m−3) [29] and Interim Target-1 (75 μg·m−3) of the WHO global air quality guidelines [30]. During the sampling period, there were two heavy haze episodes, including 11 to 16 November and 24 to 26 November. During haze episodes, the PM2.5 concentrations averaged over 100 μg·m−3 and peaked at 127 and 174 μg·m−3, respectively. These results indicate that air pollution during winter was severe in this area.
3.2. Concentrations of Heavy Metals in PM2.5
The levels of eight PM2.5-bound heavy metals are presented in Table S2 and their descriptive statistics are presented in Table 2. The total concentration of the eight metals was 235.87 ± 161.88 ng·m−3. The daily mean levels of the heavy metals were ranked in the order Zn > Cu > Pb > As > Ni > Cr (VI) > Cd > Co. Zn was the most abundant metal with a mean of 191.87 ± 145.92 ng·m−3, followed by Cu (20.04 ± 17.35), Pb (14.95 ± 9.09), As (4.71 ± 2.70), Ni (1.82 ± 1.48), Cr (VI) (1.31 ± 0.77), Cd (0.89 ± 0.86), and Co (0.29 ± 0.38) ng·m−3. Moreover, the concentrations of Cd, Ni, and Pb in all samples were lower than the annual values recommended by the WHO [4] and China [29] (Table 2). However, the concentrations of 18% As and 100% Cr (VI) exceeded the Grade Ⅱ standard of the Chinese Ambient Air Quality Standards [29]. There were no corresponding standards for Co, Cu, and Zn. These results are similar to those found in other areas; for instance, the levels of As and Cr (VI) greatly exceeded their corresponding threshold values in 60 cities in China [31].
In recent years, the mean concentrations of the metals in PM2.5 have been obtained from China and abroad, and the results of other studies are summarized in Table 3.
For As, the average concentration during the 2020 winter haze periods in YCT of China was lower than that in Changzhi, Shanxi, China [32]. For other provinces in China, the average concentration of As, during the 2020 winter haze episodes in YCT of China, were higher than those in Beijing [33], Chengdu [34], Guangzhou [10], and Lanzhou [35]. Worldwide, it was higher than those in Tˇrinec-Kosmos of Czech Republic [36] and Kitakyushu of Japan [7]. In contrast, the average concentration of As in the 2020 winter haze episodes in YCT of China was lower than those in Yuci and Taiyuan [11] in 2017 within Shanxi Province. For other provinces in China, it was lower than those in Chongqing [37], Handan [38], Xi’an [9], and Xuanwu [10]. For worldwide, it was lower than those in Iasi of Romania [39], Isfahan of Iran [5], Karaj of Iran [40], and Saudi Arabia [6].
For Cr (VI), since total chromium concentrations were only available from the literature in some regions, the concentrations of Cr (VI) were also calculated to be 1/7 of the Cr concentration according to the US EPA regional screening levels [22]. For comparison, the mean concentration of Cr (VI) during the 2020 winter haze periods in YCT of China was higher than those in Tˇrinec-Kosmos of Czech Republic [36], Iasi of Romania [39], Koldata of India [41], Kitakyushu of Japan [7], Saudi Arabia [6], Los Angeles of USA [12], Beijing [33], and Chongqing [37] of China. Conversely, the concentrations of Cr (VI) in the remaining regions were higher than that of YCT in China. It has been suggested that Cr (VI) in PM2.5 is very common and is a common air pollution problem worldwide. More stringent measures are required to control Cr pollution in the future.
Overall, the PM2.5-bound heavy metal contents were generally high in the YCT of China, with severe As and Cr (VI) contamination in PM2.5 during winter haze periods.
3.3. Source Apportionment of PM2.5-Bound Elements
The source apportionment of eight heavy metals in PM2.5 was conducted using the PMF model [23]. Two to six factors were used for each dataset to determine the optimal solutions. Finally, the optimum result with a three-factor solution (Qrobust = 1141.5, Qtrue = 1255.4, Qrobust/Qtrue = 0.91, 92–100% of BS runs, and no swaps of DISP runs) was selected based on the interpretability of the source profiles and the results of the modeling diagnostics. The correlation coefficient (R2) values between the predicted data and the input data ranged from 0.69 to 0.92, meaning a good fit of the model.
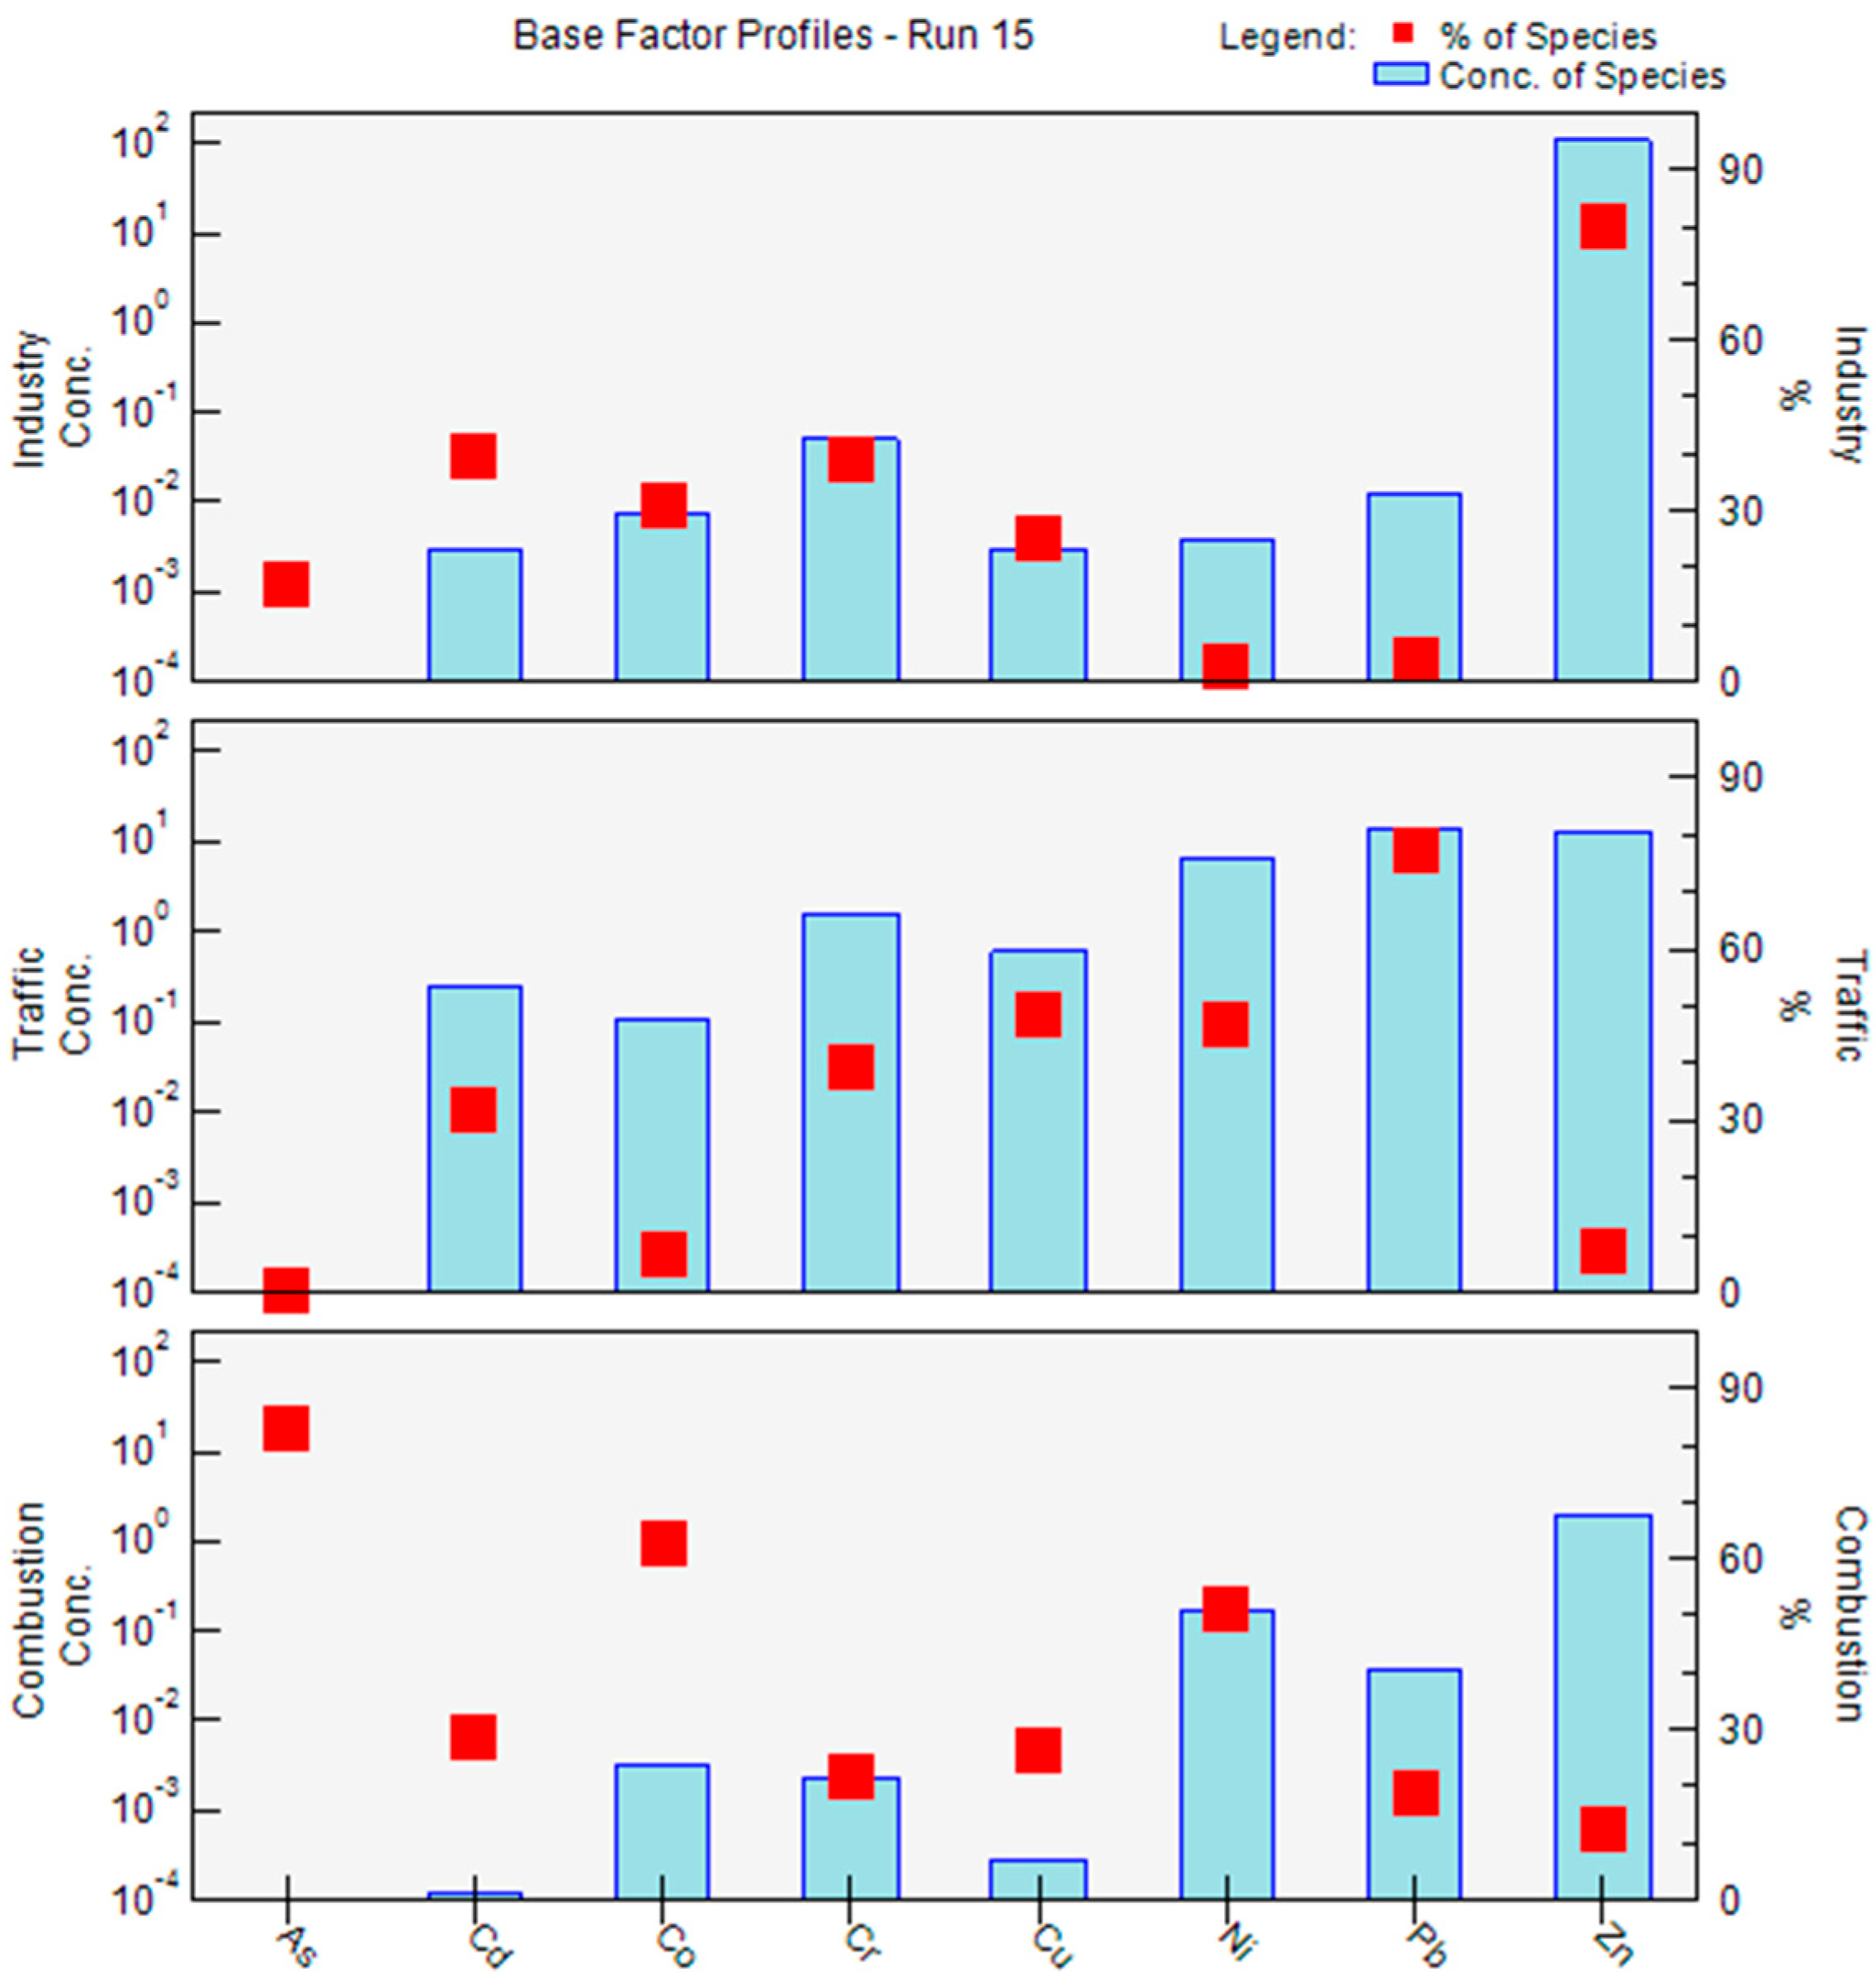
As shown in the factor profile in Figure 2, the PMF resolved three factor profiles, namely, industry, traffic, and combustion, as the three anthropogenic sources contributing to the total PM2.5-bound metals. Factor 1 was associated with high loadings of Cd (39.9%), Cr (VI) (39.2%), and Zn (80.3%). A previous study reported that Cr (VI) originated from the glassmaking industry, while Ni originated from steelworks [45]. Therefore, Factor 1 was identified as an industrial source. Factor 2 accounted for 48.8% and 77.6% of the Cu and Pb concentrations, respectively. Cu and Zn have been documented as surrogates for brake wear [46]. Pb emissions may result from the use of leaded gasoline. Thus, Factor 2 was labeled as a traffic source. Factor 3 demonstrated high loadings of the metals As (82.7%), Co (62.6%), and Ni (50.8%). These elements are all related to coal combustion [47], and Ni is also typical of oil combustion [14]. Therefore, Factor 3 was regarded as “combustion sources”, which included emissions from oil and coal combustion.
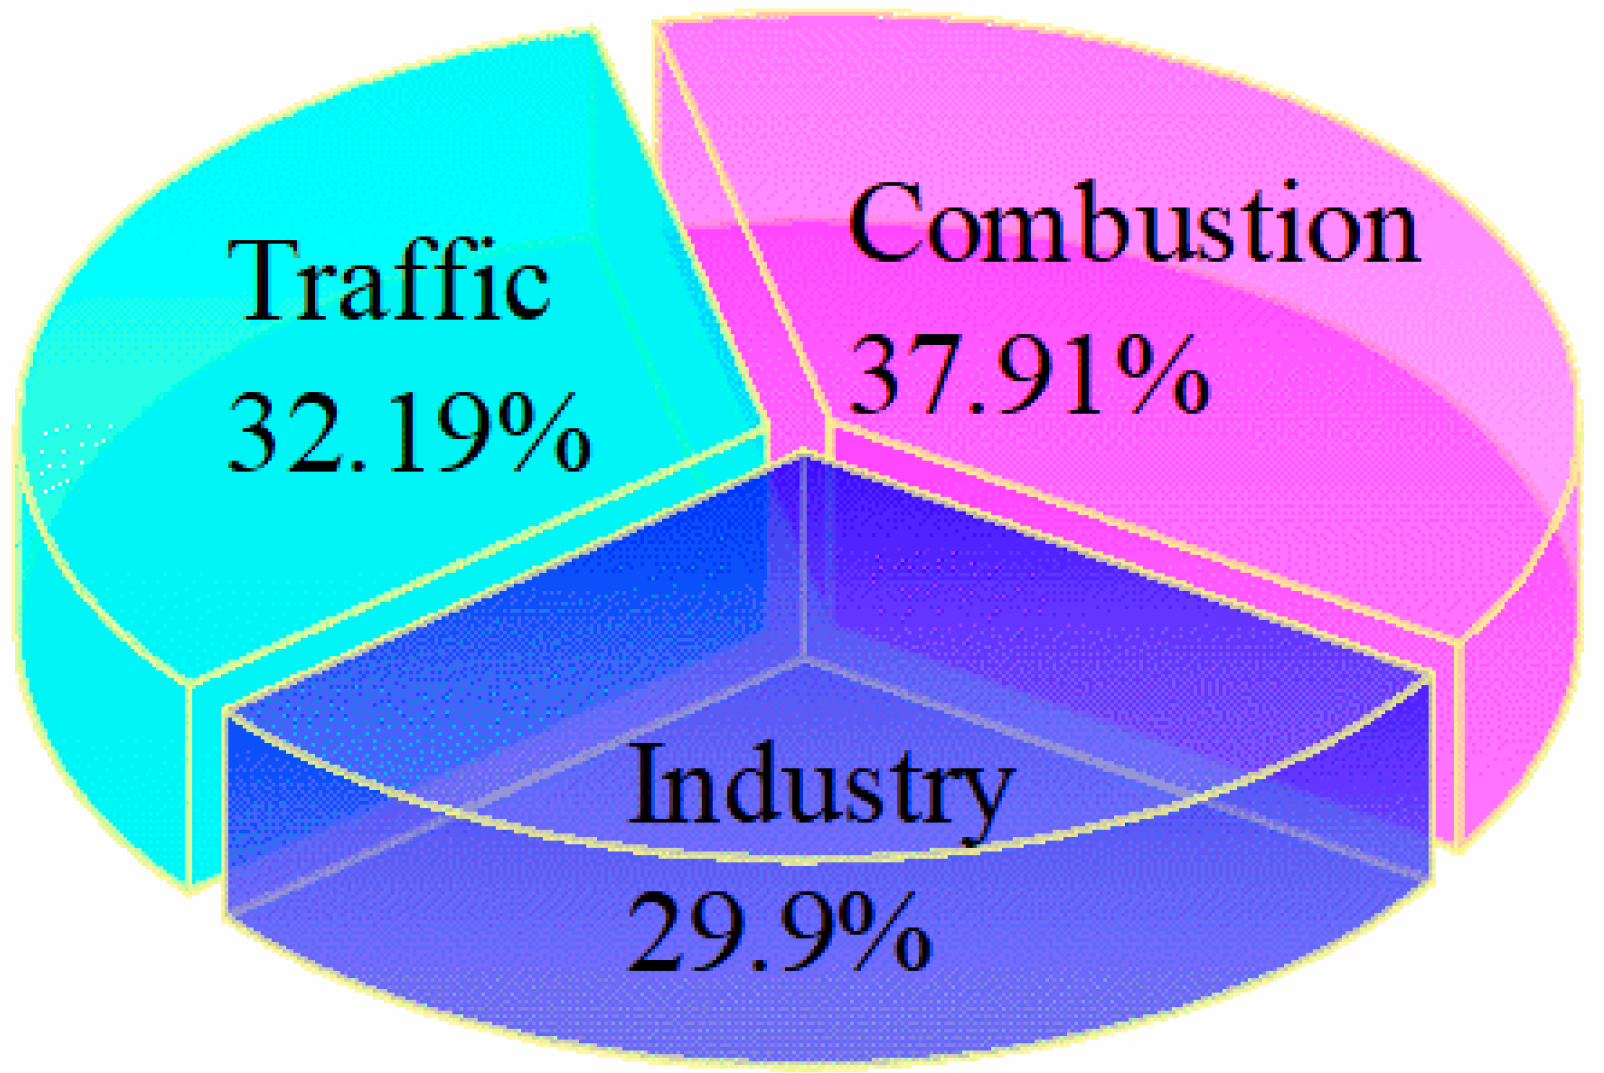
Overall, three major sources of PM2.5-bound heavy metals were characterized based on the PMF analyses. As shown in Figure 3, combustion was still the largest contributor to PM2.5-bound heavy metals (37.91%) in Jinzhong, China. The contribution of traffic emissions (32.19%) was ranked second, just higher than the industry source (29.9%).
Coal combustion was a main contributor that cannot be ignored. Shanxi is a famous coal province in China [48], and coal mining is considered one of the most important sources of heavy metal pollution [49]. More attention should be paid to the burning of coal for heating in winter, and the use of clean energy should be further increased.
The second contribution of traffic sources resulted from the increase in car ownership year by year. For example, the number of cars in Shanxi Province increased from 3.76 million in 2013 to 7.61 million in 2020 [28]. However, in the following years, this situation is expected to improve because of the continuous investment of new energy vehicles [50].
In fact, the formation of PM2.5 is very complex, and they involve adverse meteorological conditions, local emission accumulation, and regional transport, etc. [51]. Industrial sources of heavy metals in PM2.5 were likely to be regional transport because there were almost no industrial pollution sources around the sampling sites. Evidence of regional transport resulted from the analysis of the reverse trajectory. As shown, 72-h air mass backward trajectories occurred in haze episodes on 25 November 2020 (Figure 4); the results of 50 and 100 m were basically the same, and the air masses passed through Xinzhou-Taiyuan and reached Yuci after a roundabout in Yangquan. At 1000 m, the air mass passed through Linfen–Lvliang–Taiyuan, made a detour through Yangquan before reaching Yuci. These results indicated that most of the long-distance air masses were influenced by northwest winds and reached YTC of China through several industrial cities. This also indirectly suggested that the industrial pollution in YTC might come from regional transport rather than local sources. Due to the implementation of air pollution control policies and the shift of industrial production, industrial pollution is no longer the main source of pollution in YTC of China.
3.4. Human Health Risk Assessment
3.4.1. Non-Carcinogenic Risk Assessment
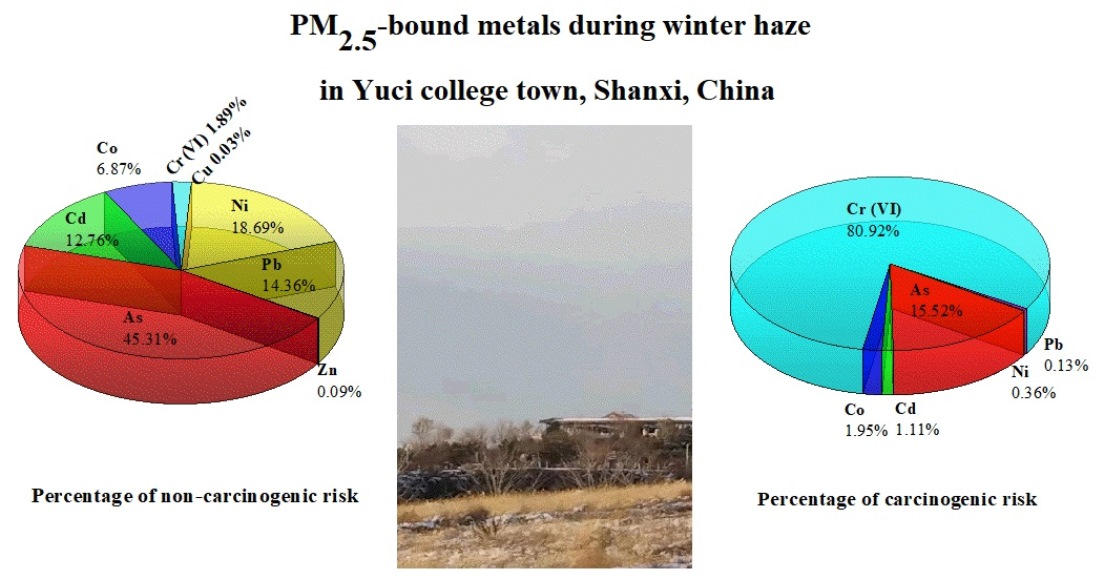
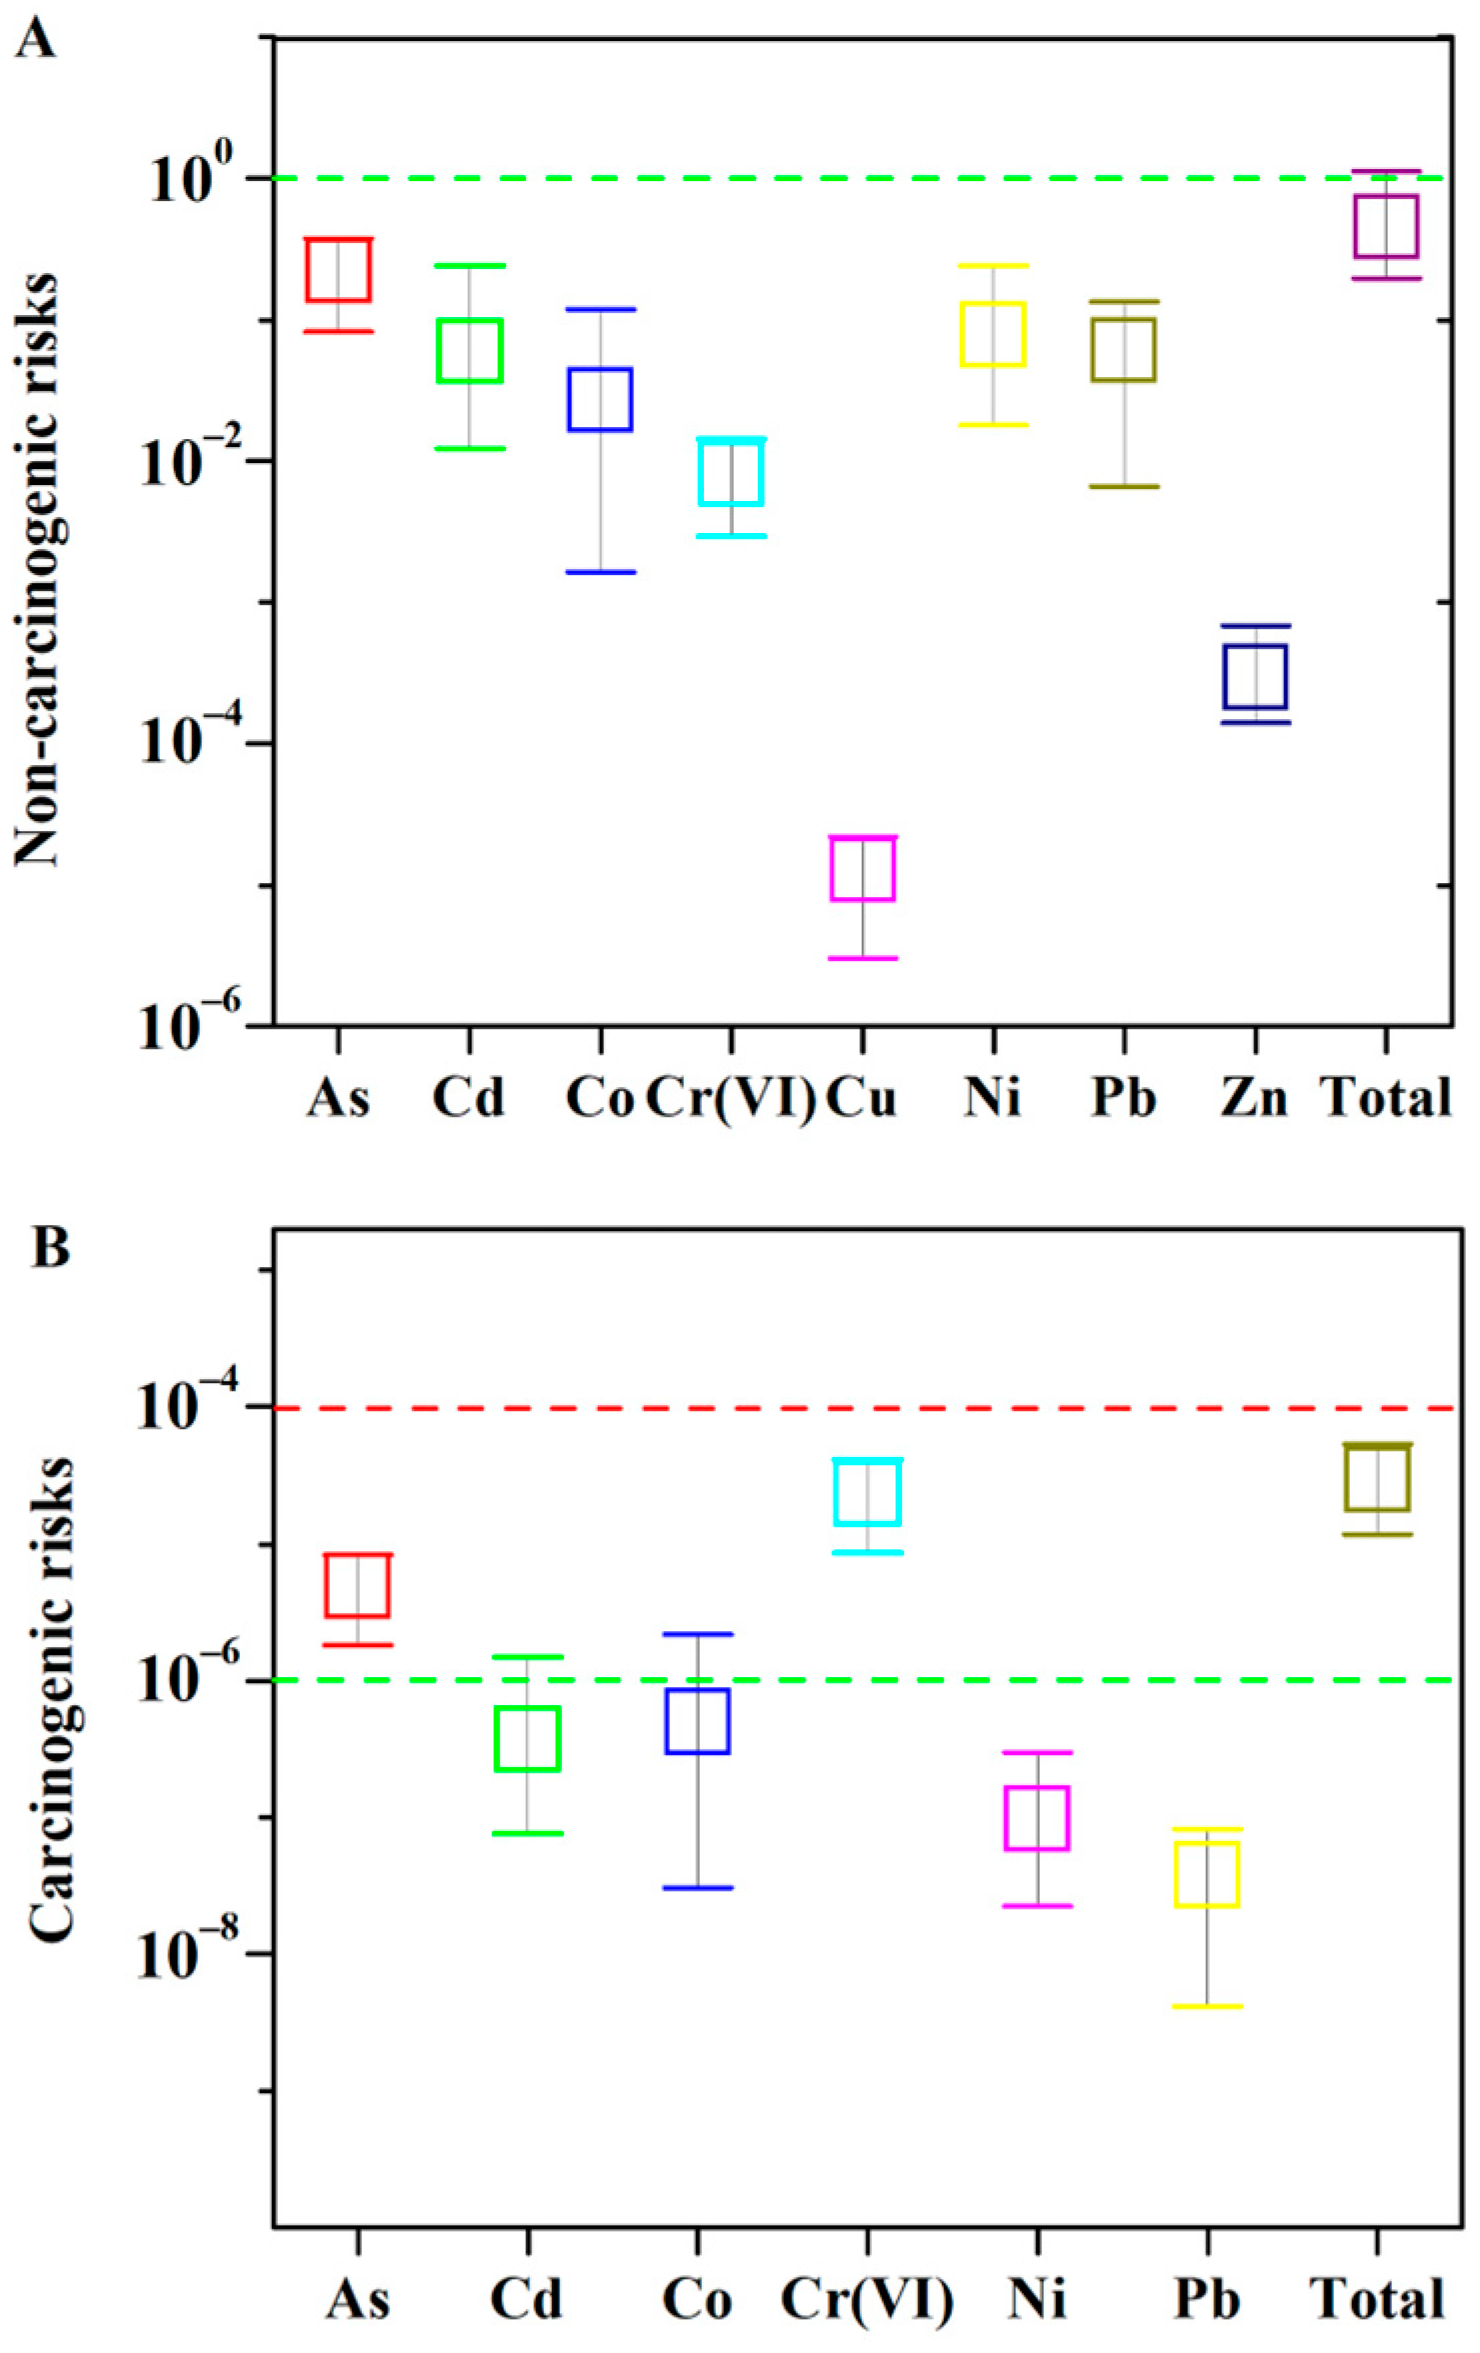
The non-carcinogenic risks of the eight PM2.5-bound metals were calculated via the inhalation route in YCT of China (Figure 5). HI values ranged from 0.052 to 1.12 in 34 samples with a median of 0.30 and a mean of 0.34 ± 0.21. In this study, 2.9% of the samples exceeded an acceptable threshold of one. Among the eight metals, As accounted for 45.31% of the entire HI value, which demonstrated that the metal As was probably the main contributor to non-carcinogenic risk, while the contributions of the remaining metals were negligible. It can be concluded that heavy metals in PM2.5 have low non-carcinogenic risks to the public in YCT of China.
3.4.2. Cancer Risk Assessment
The carcinogenic risk of exposure to six metals (As, Cd, Co, Cr, Ni and Pb) was estimated via the inhalation route and are presented in Figure 4. They ranged from 7.56 × 10⁻⁶ to 5.36 × 10⁻⁵, with an average value of (2.29 ± 1.30) × 10−5. The carcinogenic risk values all ranged from 10−6 to 10−4. Among the six metals, Cr (VI) was the main contributor to carcinogenic risk, accounting for 80.92 ± 6.20% of the total CR, and As accounted for 15.52 ± 5.42% of the total CR. These results demonstrated that the metals As and Cr (VI) were probably the main contributors to carcinogenic risk, while the contribution of the remaining metals was negligible. These values are lower than the total CR of metals in PM2.5 reported in Taiwan, China [52], but are higher than the total CR reported in Changzhi, China (10.31 × 10⁻⁶) [32]. These results are consistent with previous studies that indicated the CR also mainly resulted from the contribution of Cr in Shenzhen [53], Taiyuan and Yuci [11], and Changzhi [32] in China. In addition, Cr (VI) also contributed to the highest potential years of life lost in most cities, with a proportion of 72.7% across 60 cities in China [31].
In summary, the non-carcinogenic risks of heavy metals were negligible in PM2.5 in YCT of China. However, more attention should be paid to the carcinogenic risks of heavy metals, especially As and Cr (VI).
3.5. Policy Implication
A series of strict control measures have been implemented to prevent and control air pollution in China, and the PM2.5 levels have declined since 2013. For instance, China’s “Action Plan for the Prevention and Control of Air Pollution” was proclaimed in 2013; the “Blue Sky Protection” campaign was enacted in 2018; the 14th “Five-Year Plan for Modern Energy System” was issued in 2022; and the “Opinions on Further Strengthening the Prevention and Control of Heavy Metal Pollution” was issued in March 2022, which set two goals for 2025 and 2035. By 2025, the emissions of key heavy metal pollutants from key industries will be reduced by 5 percent as compared with those in 2020. By 2035, a heavy metal pollution prevention and control system and long-term mechanism will be established to comprehensively improve the ability to monitor environmental pollution, to control heavy metal pollution, and to prevent environmental risks. In addition, Shanxi has implemented many policies, such as promoting coal energy transformation, developing emerging industries, limiting the traffic volume in winter by odd or even days, and operating new energy vehicles.
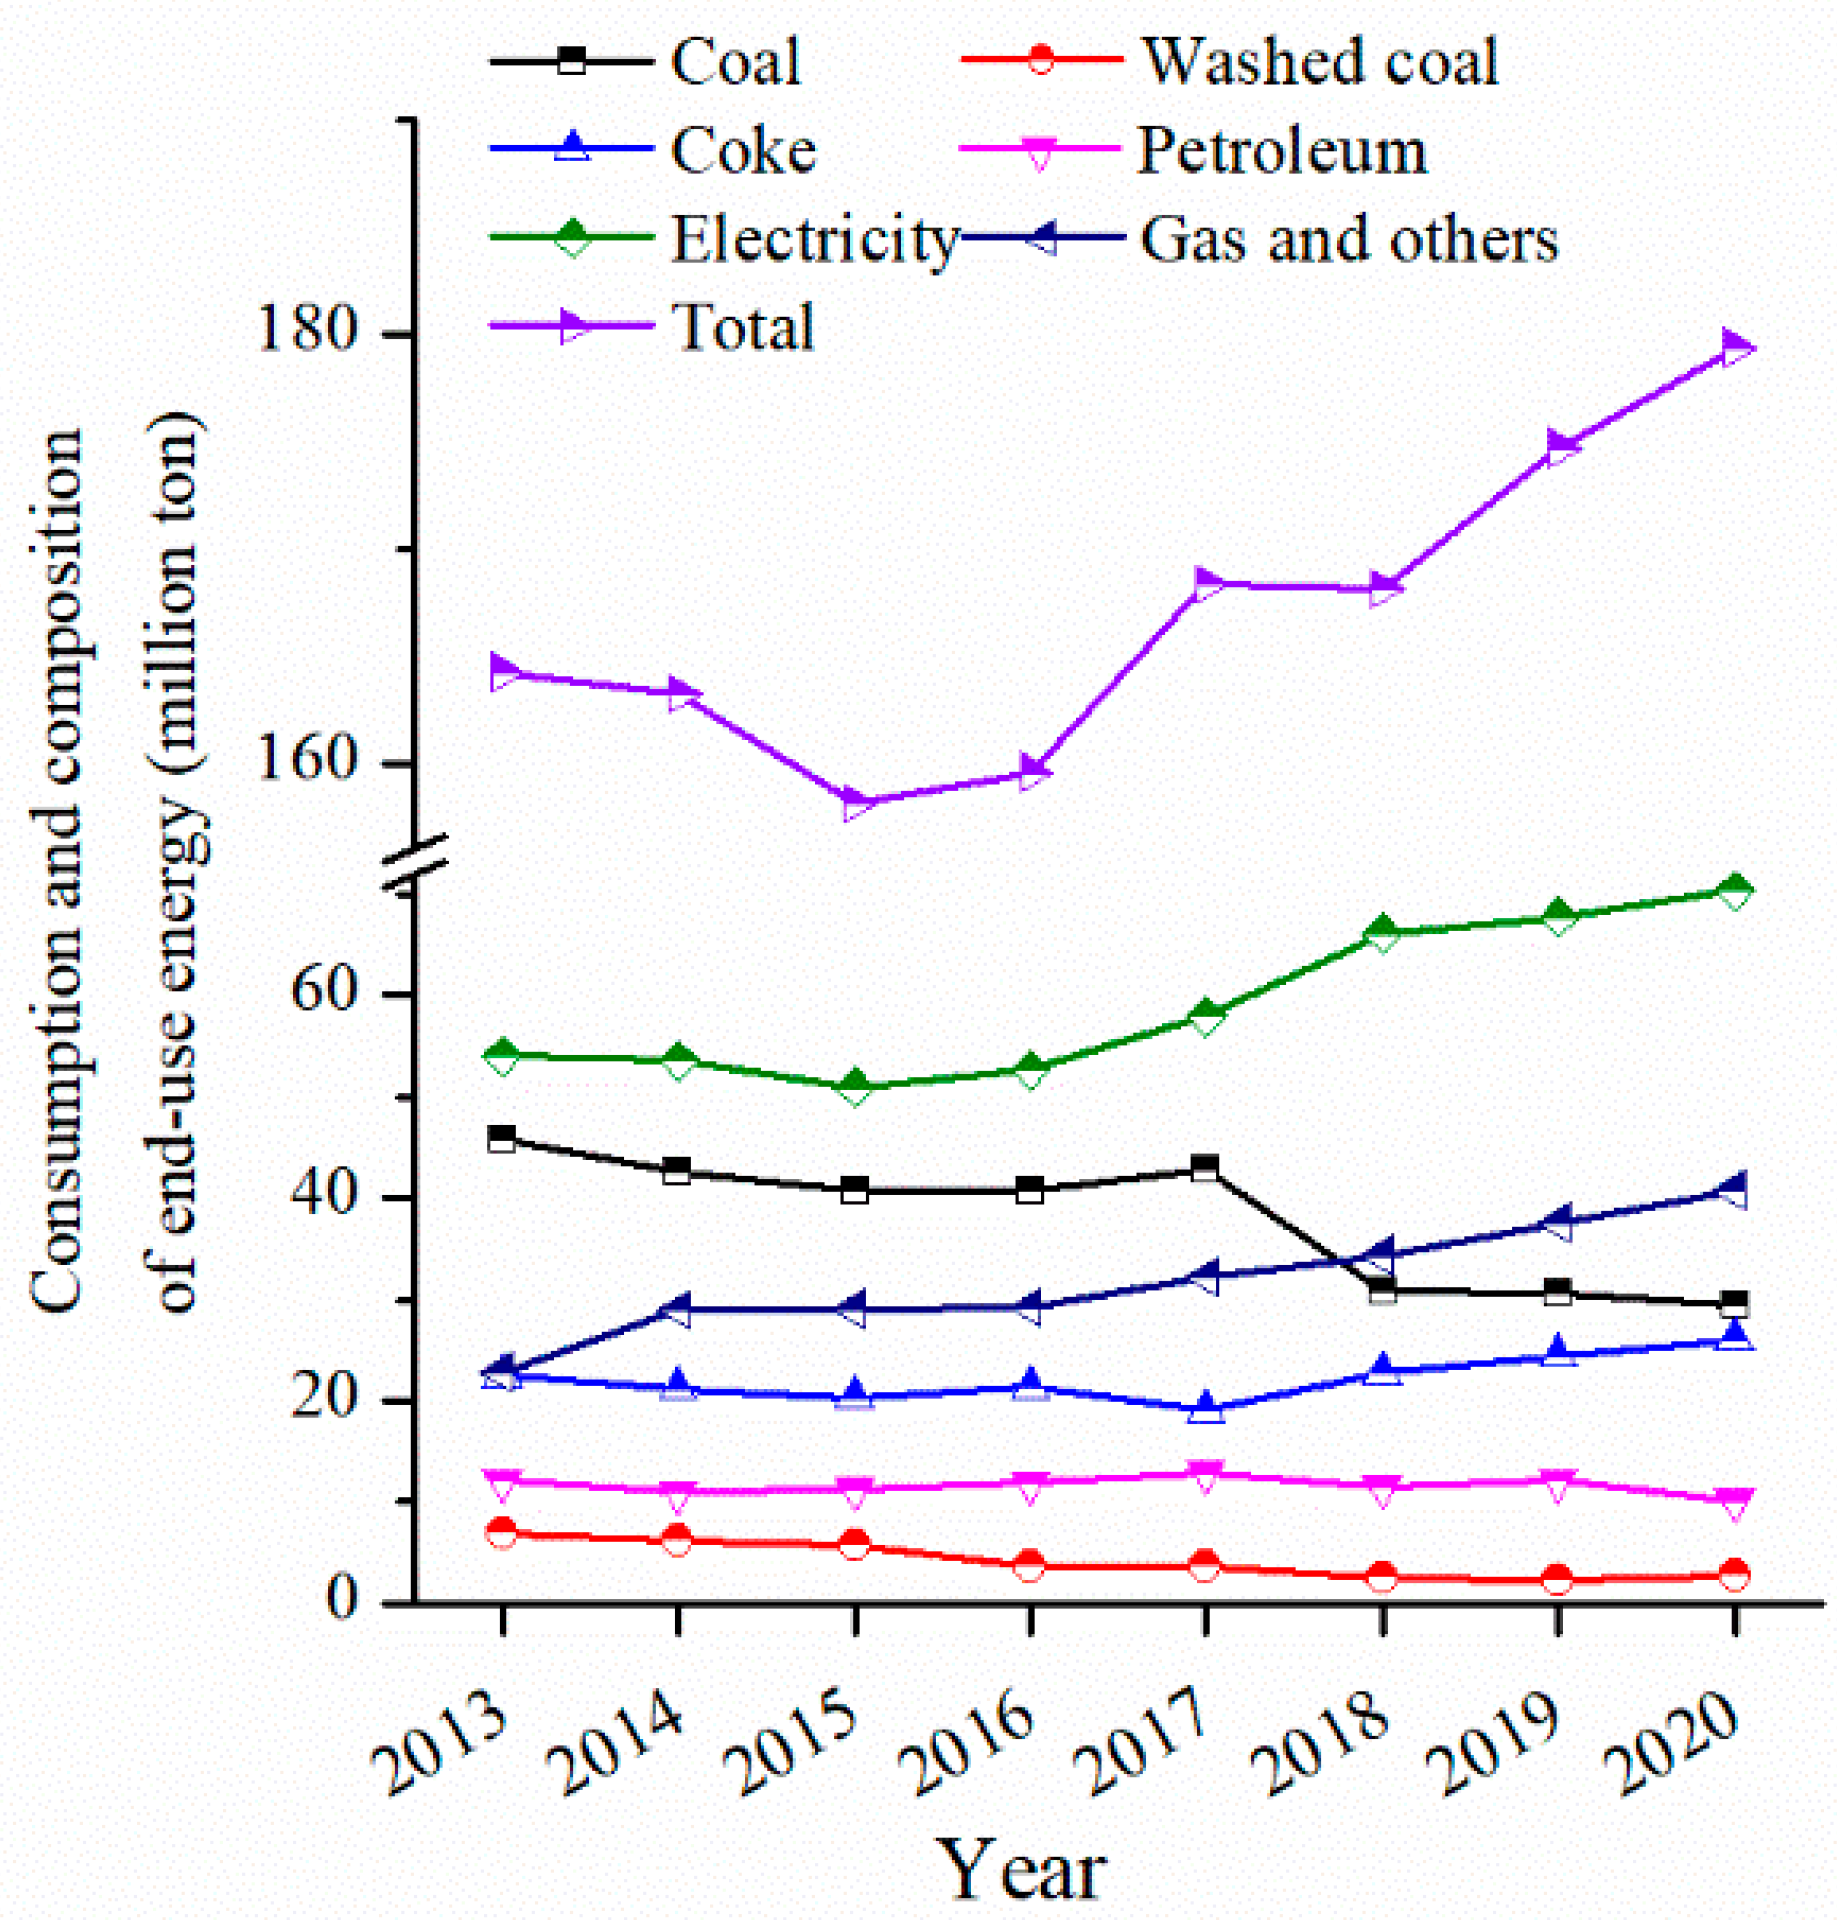
The implementation of coal banning was very effective in controlling air pollution during winter. For instance, the proportion of coal consumption in Shanxi Province decreased annually, while the proportion of electricity and natural gas increased. As shown in Figure 6 (original data were presented in Table S3), from 2013 to 2020, the proportion of coal consumption decreased from 27.92% to 16.39%, while electricity increased from 32.90% to 39.33% and natural gas increased from 13.89% to 22.72%.
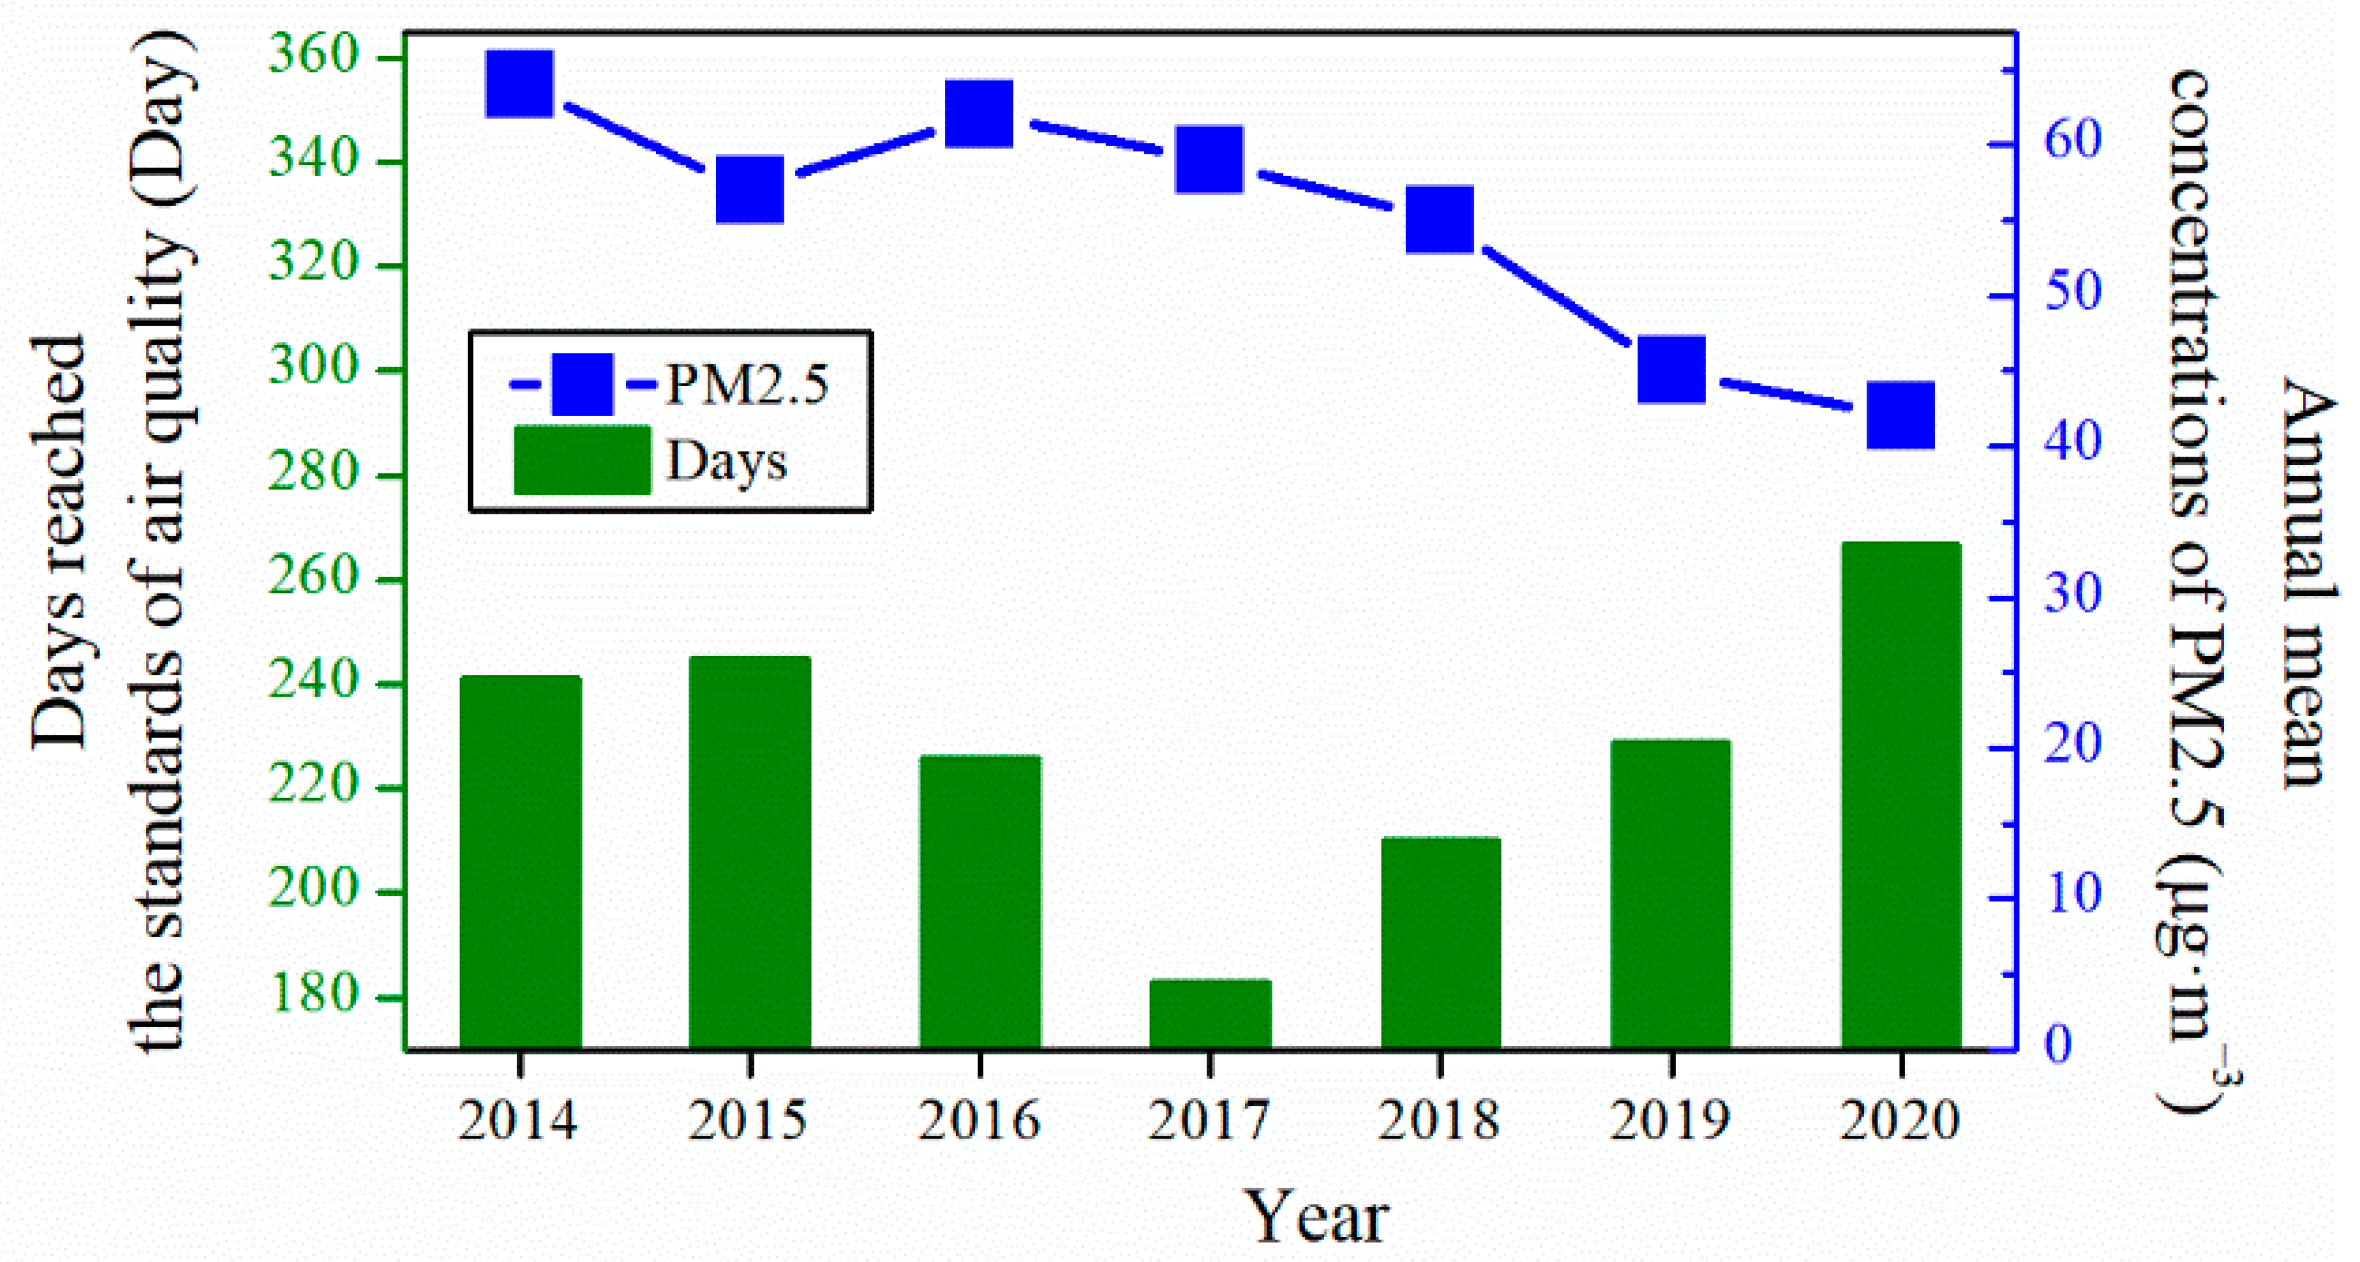
Air quality has improved significantly, owing to a series of strict control policies in China. The number of days that reached the air quality standards gradually increased, while the average annual PM2.5 level gradually decreased. As shown in Figure 7 (the original data are listed in Table S4), from 2014 to 2020, in Jinzhong, Shanxi Province, China, the number of days that reached the air quality standards increased from 241 to 267 days, while the annual mean concentrations of PM2.5 decreased from 64 to 42 μg·m−3. These results indicate that Shanxi’s energy transformation has achieved initial effects and will continue to control coal consumption and further increase the use of clean energy to win the battle for a blue sky in the future.
3.6. Limitations
First, there are two main types of health risk assessments of PM2.5-bound heavy metals. One type of health risk assessment is based solely on one exposure route, i.e., the inhalation route, while the other type of health risk assessments considers three exposure routes: inhalation, dermal, and oral intake. The former type was applied for health risk assessments in the industrial cities of Iran [40], Kolkata of India [41], Beijing of China [13], and Tianjin of China [38]. The latter type was used in Saudi Arabia [6], Hebei of China [54], and Shenzhen of China [53]. However, which is more representative? The models and parameters of health risk assessment should be optimized for specific populations and regions. Second, the traditional approach to heavy metals inherently hypothesizes that the carcinogenic risks of all metals are additive effects in a mixture. However, the synergistic or antagonistic effects may also occur during metabolism. For instance, three joint effects (synergistic, antagonistic, or additive effects) of the toxicity were all observed in the different component metal mixtures (Cd, Cr, Cu, Hg, Mn, Ni, Pb, and Zn) [55]. The mixtures of Cd + Pb [56], Cd + Ni [57], and Zn + Al [46] have synergistic effects [58], while Cd + Cu [59] and Cd + Zn [60] mixtures have antagonistic effects. In addition, heavy metals are only a small part of the PM2.5, which is also composed of other substances, such as organic matter, nitrate, sulfate, ammonium, elemental carbon, and chloride [61]. In future research, the above insufficiency should be overcome to assess the risk to human health more accurately.
4. Conclusions
In this study, the levels of eight metals in PM2.5 were detected during the 2020 winter haze periods in YCT of China. The 24-h PM2.5 levels of 34 samples ranged from 17 to 174 μg·m−3, with a mean of 81 ± 35 μg·m−3. The PM2.5-bound heavy metals ranked in the following order: Zn > Cu > Pb > As > Ni > Cr (VI) > Cd > Co. A total of 18% and 100% of the concentrations assessed in the samples for As and Cr, respectively, exceeded the corresponding threshold values of the Chinese Ambient Air Quality Standards and the WHO Global Air Quality Guidelines; the levels of As and Cr (VI) were also higher than those in some areas worldwide. Overall, higher PM2.5 levels were found in this area, suffering from severe As and Cr (VI) contamination during winter haze periods.
Based on the PMF model, combustion was the largest contributor to PM2.5-bound heavy metals (37.91%), followed by traffic emissions (32.19%) and industrial sources (29.9%). Finally, the potential health risks were estimated through exposure by the inhalation route. The non-carcinogenic risks of PM2.5-bound heavy metals were negligible, but the carcinogenic risk values were all within the potential level (10−6–10−4), and both As and Cr (VI) were the main contributors. Therefore, more attention should be paid to the prevention and control of As and Cr (VI) pollution in the environment. By reducing coal burning and using clean energy in winter, we will continue to reduce industrial source pollution, thereby making a positive contribution to reduce the occurrence of winter haze periods.
Supplementary Materials
The following supporting information can be downloaded at: https://www.mdpi.com/article/10.3390/toxics10080467/s1. Text: Detailed description of chemical analyses; Table S1: Isotopes of heavy metals, corresponding internal standards, and detection limit for ICP-MS analysis; Table S2: PM2.5 mass (μg·m–3) and its metals concentrations (ng·m−3) during winter in 2020 in the college town of Shanxi Province, China (n = 34); Table S3: The consumption, composition, and their proportion (%) of end-use energy (million ton) in recent years in Shanxi Province, China; Table S4: The days reached the standards of air quality in recent years and the annual mean concentrations of PM2.5 (μg·m−3) in Jinzhong, Shanxi Province, China; Figure S1. The 72-h back trajectories on 25 November 2020 in Yuci College Town, Shanxi, China. References [21,62,63,64,65,66,67,68,69] are cited in the supplementary materials.
Author Contributions
Funding acquisition, L.L. and H.Q.; methodology, X.L.; visualization, X.L.; writing—original draft, L.L.; writing—review and editing, H.Q. All authors have read and agreed to the published version of the manuscript.
Funding
This work was supported by the Natural Science Foundation of Shanxi Province, China (201901D111299 and 201901D111301), and the Scientific and Technological Innovation Programs of Higher Education Institutions in Shanxi, China (2020L0584).
Institutional Review Board Statement
Not applicable.
Informed Consent Statement
Not applicable.
Data Availability Statement
Not applicable.
Conflicts of Interest
The authors declare no conflict of interest.
References
- Cohen, A.J.; Brauer, M.; Burnett, R.; Anderson, H.R.; Frostad, J.; Estep, K.; Balakrishnan, K.; Brunekreef, B.; Dandona, L.; Dandona, R.; et al. Estimates and 25-year trends of the global burden of disease attributable to ambient air pollution: An analysis of data from the Global Burden of Diseases Study 2015. Lancet 2017, 389, 1907–1918. [Google Scholar] [CrossRef]
- Turner, M.C.; Krewski, D.; Diver, W.R.; Pope, C.A.; Burnett, R.T.; Jerrett, M.; Marshall, J.D.; Gapstur, S.M. Ambient air pollution and cancer mortality in the cancer prevention study II. Environ. Health Perspect. 2017, 125, 087013. [Google Scholar] [CrossRef] [PubMed]
- Landrigan, P.J.; Fuller, R.; Acosta, N.J.R.; Adeyi, O.; Arnold, R.; Basu, N.; Balde, A.B.; Bertollini, R.; Bose-O’Reilly, S.; Boufford, J.I.; et al. The Lancet Commission on pollution and health. Lancet 2018, 391, 462–512. [Google Scholar] [CrossRef]
- WHO. Air Quality Guidelines: Global Update 2005: Particulate Matter, Ozone, Nitrogen Dioxide, and Sulfur Dioxide; World Health Organization: Geneva, Switzerland, 2005.
- Soleimani, M.; Amini, N.; Sadeghian, B.; Wang, D.; Fang, L. Heavy metals and their source identification in particulate matter (PM2.5) in Isfahan City, Iran. J. Environ. Sci. 2018, 72, 166–175. [Google Scholar] [CrossRef] [PubMed]
- Abdulaziz, M.; Alshehri, A.; Yadav, I.C.; Badri, H. Pollution level and health risk assessment of heavy metals in ambient air and surface dust from Saudi Arabia: A systematic review and meta-analysis. Air Qual. Atmos. Health 2022, 15, 799–810. [Google Scholar] [CrossRef]
- Zhang, X.; Eto, Y.; Aikawa, M. Risk assessment and management of PM2.5-bound heavy metals in the urban area of Kitakyushu, Japan. Sci. Total Environ. 2021, 795, 148748. [Google Scholar] [CrossRef]
- Li, Z.Y.; Ma, H.Q.; Fan, L.; Zhao, P.; Wang, L.; Jiang, Y.J.; An, C.X.; Liu, A.Q.; Hu, Z.S.; Jin, H. Size distribution of inorganic elements in bottom ashes from seven types of bio-fuels across Beijing-Tianjin-Hebei Region, China. Aerosol Air Qual. Res. 2017, 17, 2450–2462. [Google Scholar] [CrossRef]
- Wu, T.; Liu, P.; He, X.; Xu, H.; Shen, Z. Bioavailability of heavy metals bounded to PM2.5 in Xi’an, China: Seasonal variation and health risk assessment. Environ. Sci. Pollut. Res. 2021, 28, 35844–35853. [Google Scholar] [CrossRef] [PubMed]
- Xie, J.; Jin, L.; Cui, J.; Luo, X.-S.; Li, J.; Zhang, G.; Li, X.-D. Health risk-oriented source apportionment of PM2.5-associated trace metals. Environ. Pollut. 2020, 262, 114655. [Google Scholar] [CrossRef] [PubMed]
- Liu, X.; Wang, Z.; Bai, H.; Zhang, S.; Mu, L.; Peng, L. Characteristics and health risk assessments of heavy metals in PM2.5 in Taiyuan and Yuci College Town, China. Air Qual. Atmos. Health 2020, 13, 909–919. [Google Scholar] [CrossRef]
- Farahani, V.J.; Soleimanian, E.; Pirhadi, M.; Sioutas, C. Long-term trends in concentrations and sources of PM2.5-bound metals and elements in central Los Angeles. Atmos. Environ. 2021, 253, 118361. [Google Scholar] [CrossRef]
- Yang, X.; Zheng, M.; Liu, Y.; Yan, C.; Liu, J.; Liu, J.; Cheng, Y. Exploring sources and health risks of metals in Beijing PM2.5: Insights from long-term online measurements. Sci. Total Environ. 2022, 814, 151954. [Google Scholar] [CrossRef] [PubMed]
- Sofowote, U.M.; Su, Y.; Dabek-Zlotorzynska, E.; Rastogi, A.K.; Brook, J.; Hopke, P.K. Sources and temporal variations of constrained PMF factors obtained from multiple-year receptor modeling of ambient PM2.5 data from five speciation sites in Ontario, Canada. Atmos. Environ. 2015, 108, 140–150. [Google Scholar] [CrossRef]
- Swietlik, R.; Trojanowska, M. Chemical fractionation in environmental studies of potentially toxic particulate-bound elements in urban air: A critical review. Toxics 2022, 10, 124. [Google Scholar] [CrossRef]
- MEEC (Ministry of Ecology and Environment of China). List of Toxic and Hazardous Air Pollutants (2018); Ministry of Ecology and Environment of China and National Health Commission of China: Beijing, China, 2019; (In Chinese). Available online: https://www.gov.cn/xinwen/2019-2002/2005/content_5364004.htm (accessed on 16 April 2022).
- IARC (International Agency for Research on Cancer). Agents Classified by the IARC Monographs, Volumes 1–130. 2021. Available online: https://monographs.iarc.who.int/agents-classified-by-the-iarc/ (accessed on 18 April 2022).
- Dong, Y.; Zhou, H.; Fu, Y.; Li, X.; Geng, H. Wavelet periodic and compositional characteristics of atmospheric PM2.5 in a typical air pollution event at Jinzhong city, China. Atmos. Pollut. Res. 2021, 12, 245–254. [Google Scholar] [CrossRef]
- Li, Z.; Ma, Z.; van der Kuijp, T.J.; Yuan, Z.; Huang, L. A review of soil heavy metal pollution from mines in China: Pollution and health risk assessment. Sci. Total Environ. 2014, 468, 843–853. [Google Scholar] [CrossRef]
- MEEC (Ministry of Ecology and Environment of China). Determination of Atmospheric Articles PM10 and PM2.5 in Ambient Air by Gravimetric Method; China Environmental Press: Beijing, China, 2011. (In Chinese)
- NEPSC (National Environmental Protection Standards of China). Ambient Air and Stationary Sourc Emission: Determination of Metals in Ambient Particulate Matter–Inductively Coupled Plasma/Mass Spectrometry (ICP-MS); China Environmental Science Press NEPSC: Beijing, China, 2013. (In Chinese) [Google Scholar]
- US EPA. Regional Screening Levels (RSLs)-Generic Tables as of November 2021. 2021. Available online: https://www.epa.gov/risk/regional-screening-levels-rsls-generic-tables (accessed on 16 April 2022).
- Norris, G.; Duvall, R.; Brown, S.; Bai, S. EPA Positive Matrix Factorization (PMF) 5.0 Fundamentals and User Guide; EPA/600/R-14/108; U.S. Environmental Protection Agency: Washington, DC, USA, 2014; pp. 1–136. [Google Scholar]
- US EPA. Risk Assessment Guidance for Superfund: Volume I: Human Health Evaluation Manual (Part F, Supplemental Guidance for Inhalation Risk Assessment); U.S. Environmental Protection Agency, Office of Emergency and Remedial Response: Washington, DC, USA, 2009.
- Oosthuizen, M.; Wright, C.Y.; Matooane, M.; Phala, N. Human health risk assessment of airborne metals to a potentially exposed community: A screening exercise. Clean Air J. 2015, 25, 51–57. [Google Scholar] [CrossRef]
- State of Michigan, USA. Chemical Update Worksheet. Michigan Department of Environmental Quality. 2016. Available online: https://www.michigan.gov/documents/deq/deq-rrd-chem-LeadDatasheet_527864_527867.pdf (accessed on 16 April 2022).
- NOAA (National Oceanic and Atmospheric Administration). Available online: https://www.ready.noaa.gov/HYSPLIT.php (accessed on 20 July 2022).
- SSY (Shanxi Statistics Yearbook). (In Chinese). Available online: http://www.shanxi.gov.cn/sj/tjnj/ (accessed on 18 April 2022).
- MEPC (Ministry of Environmental Protection of China). Ambient Air Quality Standards (GB 3095-2012), National Standards of the People’s Republic of China; China Environmental Press: Beijing, China, 2012. (In Chinese)
- WHO. WHO Global Air Quality Guidelines: Particulate Matter (PM2.5 and PM10), Ozone, Nitrogen Dioxide, Sulfur Dioxide and Carbon Monoxide: Executive Summary; WHO Regional Office for Europe: Copenhagen, Denmark, 2021. Available online: https://www.who.int/publications/i/item/9789240034433 (accessed on 18 April 2022).
- Liu, J.; Cao, H.; Zhang, Y.; Chen, H. Potential years of life lost due to PM2.5-bound toxic metal exposure: Spatial patterns across 60 cities in China. Sci. Total Environ. 2022, 812, 152593. [Google Scholar] [CrossRef]
- Duan, X.; Yan, Y.; Li, R.; Deng, M.; Hu, D.; Peng, L. Seasonal variations, source apportionment, and health risk assessment of trace metals in PM2.5 in the typical industrial city of Changzhi, China. Atmos. Pollut. Res. 2021, 12, 365–374. [Google Scholar] [CrossRef]
- Zhao, S.; Tian, H.; Luo, L.; Liu, H.; Wu, B.; Liu, S.; Bai, X.; Liu, W.; Liu, X.; Wu, Y.; et al. Temporal variation characteristics and source apportionment of metal elements in PM2.5 in urban Beijing during 2018-2019. Environ. Pollut. 2021, 268, 115856. [Google Scholar] [CrossRef]
- Qu, Y.; Gao, T.; Yang, C. Elemental characterization and source identification of the near-road PM2.5 using EDXRF in Chengdu, China. X-ray Spectrom. 2019, 48, 232–241. [Google Scholar] [CrossRef]
- Li, Y.; Zhao, B.; Duan, K.; Cai, J.; Niu, W.; Dong, X. Contamination characteristics, mass concentration, and source analysis of metal elements in PM2.5 in Lanzhou, China. Elem. Sci. Anthr. 2021, 9, 00125. [Google Scholar] [CrossRef]
- Seibert, R.; Nikolova, I.; Volná, V.; Krejčí, B.; Hladký, D. Air pollution sources’ contribution to PM2.5 concentration in the northeastern part of the Czech Republic. Atmosphere 2020, 11, 522. [Google Scholar] [CrossRef]
- Han, Y.; Wang, Z.; Zhou, J.; Che, H.; Tian, M.; Wang, H.; Shi, G.; Yang, F.; Zhang, S.; Chen, Y. PM2.5-bound heavy metals in southwestern China: Characterization, sources, and health risks. Atmosphere 2021, 12, 929. [Google Scholar] [CrossRef]
- Chen, R.; Jia, B.; Tian, Y.; Feng, Y. Source-specific health risk assessment of PM2.5-bound heavy metals based on high time-resolved measurement in a Chinese megacity: Insights into seasonal and diurnal variations. Ecotoxicol. Environ. Saf. 2021, 216, 112167. [Google Scholar] [CrossRef] [PubMed]
- Galon-Negru, A.G.; Olariu, R.I.; Arsene, C. Size-resolved measurements of PM2.5 water-soluble elements in Iasi, north-eastern Romania: Seasonality, source apportionment and potential implications for human health. Sci. Total Environ. 2019, 695, 133839. [Google Scholar] [CrossRef] [PubMed]
- Kermani, M.; Jonidi Jafari, A.; Gholami, M.; Arfaeinia, H.; Shahsavani, A.; Fanaei, F. Characterization, possible sources and health risk assessment of PM2.5-bound heavy metals in the most industrial city of Iran. J. Environ. Health Sci. Eng. 2021, 19, 151–163. [Google Scholar] [CrossRef]
- Mitra, S.; Das, R. Health risk assessment of construction workers from trace metals in PM2.5 from Kolkata, India. Arch. Environ. Occup. Health 2022, 77, 125–140. [Google Scholar] [CrossRef]
- Zhong, S.; Zhang, L.; Jiang, X.; Gao, P. Comparison of chemical composition and airborne bacterial community structure in PM2.5 during haze and non-haze days in the winter in Guilin, China. Sci. Total Environ. 2019, 655, 202–210. [Google Scholar] [CrossRef]
- Cai, A.; Zhang, H.; Wang, L.; Wang, Q.; Wu, X. Source apportionment and health risk assessment of heavy metals in PM2.5 in Handan: A typical heavily polluted city in North China. Atmosphere 2021, 12, 1232. [Google Scholar] [CrossRef]
- Xue, H.; Liu, G.; Zhang, H.; Hu, R.; Wang, X. Similarities and differences in PM10 and PM2.5 concentrations, chemical compositions and sources in Hefei City, China. Chemosphere 2019, 220, 760–765. [Google Scholar] [CrossRef] [PubMed]
- Ledoux, F.; Kfoury, A.; Delmaire, G.; Roussel, G.; El Zein, A.; Courcot, D. Contributions of local and regional anthropogenic sources of metals in PM2.5 at an urban site in northern France. Chemosphere 2017, 181, 713–724. [Google Scholar] [CrossRef] [PubMed]
- Hulskotte, J.H.J.; Roskam, G.D.; Denier van der Gon, H.A.C. Elemental composition of current automotive braking materials and derived air emission factors. Atmos. Environ. 2014, 99, 436–445. [Google Scholar] [CrossRef]
- Xu, M.; Yan, R.; Zheng, C.; Qiao, Y.; Han, J.; Sheng, C. Status of trace element emission in a coal combustion process: A review. Fuel Process. Technol. 2004, 85, 215–237. [Google Scholar] [CrossRef]
- Cao, X. Policy and regulatory responses to coalmine closure and coal resources consolidation for sustainability in Shanxi, China. J. Clean. Prod. 2017, 145, 199–208. [Google Scholar] [CrossRef]
- Liu, X.; Bai, Z.; Shi, H.; Zhou, W.; Liu, X. Heavy metal pollution of soils from coal mines in China. Nat. Hazards 2019, 99, 1163–1177. [Google Scholar] [CrossRef]
- Lin, B.; Shi, L. Do environmental quality and policy changes affect the evolution of consumers’ intentions to buy new energy vehicles. Appl. Energy 2022, 310, 118582. [Google Scholar] [CrossRef]
- Zhang, Q.; Zheng, Y.; Tong, D.; Shao, M.; Wang, S.; Zhang, Y.; Xu, X.; Wang, J.; He, H.; Liu, W.; et al. Drivers of improved PM2.5 air quality in China from 2013 to 2017. Proc. Natl. Acad. Sci. USA 2019, 116, 24463–24469. [Google Scholar] [CrossRef]
- Tsai, P.J.; Young, L.H.; Hwang, B.F.; Lin, M.Y.; Chen, Y.C.; Hsu, H.T. Source and health risk apportionment for PM2.5 collected in Sha-Lu area, Taiwan. Atmos. Pollut. Res. 2020, 11, 851–858. [Google Scholar] [CrossRef]
- Yan, R.-H.; Peng, X.; Lin, W.; He, L.-Y.; Wei, F.-H.; Tang, M.-X.; Huang, X.-F. Trends and challenges regarding the source-specific health risk of PM2.5-bound metals in a Chinese megacity from 2014 to 2020. Environ. Sci. Technol. 2022, 56, 6996–7005. [Google Scholar] [CrossRef] [PubMed]
- Li, X.; Yan, C.; Wang, C.; Ma, J.; Li, W.; Liu, J.; Liu, Y. PM2.5-bound elements in Hebei Province, China: Pollution levels, source apportionment and health risks. Sci. Total Environ. 2022, 806, 150440. [Google Scholar] [CrossRef]
- Lin, X.; Gu, Y.; Zhou, Q.; Mao, G.; Zou, B.; Zhao, J. Combined toxicity of heavy metal mixtures in liver cells. J. Appl. Toxicol. 2016, 36, 1163–1172. [Google Scholar] [CrossRef] [PubMed]
- Xu, X.; Li, Y.; Wang, Y.; Wang, Y. Assessment of toxic interactions of heavy metals in multi-component mixtures using sea urchin embryo-larval bioassay. Toxicol. Vitr. 2011, 25, 294–300. [Google Scholar] [CrossRef] [PubMed]
- Alsop, D.; Wood, C.M. Metal and pharmaceutical mixtures: Is ion loss the mechanism underlying acute toxicity and widespread additive toxicity in zebrafish? Aquat. Toxicol. 2013, 140, 257–267. [Google Scholar] [CrossRef] [PubMed]
- Gebara, R.C.; Alho, L.d.O.G.; Rocha, G.S.; da Silva Mansano, A.; Melão, M.d.G.G. Zinc and aluminum mixtures have synergic effects to the algae Raphidocelis subcapitata at environmental concentrations. Chemosphere 2020, 242, 125231. [Google Scholar] [CrossRef] [PubMed]
- Zhu, B.; Wu, Z.-F.; Li, J.; Wang, G.-X. Single and joint action toxicity of heavy metals on early developmental stages of Chinese rare minnow (Gobiocypris rarus). Ecotoxicol. Environ. Saf. 2011, 74, 2193–2202. [Google Scholar] [CrossRef] [PubMed]
- Mebane, C.A.; Dillon, F.S.; Hennessy, D.P. Acute toxicity of cadmium, lead, zinc, and their mixtures to stream-resident fish and invertebrates. Environ. Toxicol. Chem. 2012, 31, 1334–1348. [Google Scholar] [CrossRef] [PubMed]
- Liu, Z.; Gao, W.; Yu, Y.; Hu, B.; Xin, J.; Sun, Y.; Wang, L.; Wang, G.; Bi, X.; Zhang, G. Characteristics of PM2.5 mass concentrations and chemical species in urban and background areas of China: Emerging results from the CARE-China network. Atmos. Chem. Phys. 2018, 18, 8849–8871. [Google Scholar] [CrossRef]
- SSY. Table 6–15: Consumption and Composition of End-Use Energy in 2013; Shanxi Statistics Yearbook. 2014. Available online: http://tjj.shanxi.gov.cn/tjsj/tjnj/nj2014/html/njcx.htm (accessed on 25 June 2022).
- SSY. Table 6–13: Consumption and Composition of End-Use Energy in 2014; Shanxi Statistics Yearbook. 2015. Available online: http://tjj.shanxi.gov.cn/tjsj/tjnj/nj2015/indexch.htm (accessed on 25 June 2022).
- SSY. Table 6–13: Consumption and Composition of End-Use Energy in 2015; Shanxi Statistics Yearbook. 2016. Available online: http://tjj.shanxi.gov.cn/tjsj/tjnj/nj2016/indexch.htm (accessed on 25 June 2022).
- SSY. Table 6–13: Consumption and Composition of End-Use Energy in 2016; Shanxi Statistics Yearbook. 2017. Available online: http://tjj.shanxi.gov.cn/tjsj/tjnj/nj2017/indexch.htm (accessed on 25 June 2022).
- SSY. Table 6–13: Consumption and Composition of End-Use Energy in 2017; Shanxi Statistics Yearbook. 2018. Available online: http://tjj.shanxi.gov.cn/tjsj/tjnj/nj2018/indexch.htm (accessed on 25 June 2022).
- SSY. Table 6–13: Consumption and Composition of End-Use Energy in 2018; Shanxi Statistics Yearbook. 2020. Available online: http://tjj.shanxi.gov.cn/tjsj/tjnj/nj2019/zk/indexch.htm (accessed on 25 June 2022).
- SSY. Table 6–14: Consumption and Composition of End-Use Energy in 2019; Shanxi Statistics Yearbook. 2020. Available online: http://tjj.shanxi.gov.cn/tjsj/tjnj/nj2020/zk/indexch.htm (accessed on 25 June 2022).
- SSY. Table 6–13: Consumption and Composition of End-Use Energy in 2020; Shanxi Statistics Yearbook. 2021. Available online: http://tjj.shanxi.gov.cn/tjsj/tjnj/nj2021/zk/indexch.htm (accessed on 25 June 2022).
Figure 1.
Map of the sampling area in Yuci College Town, Shanxi, China.

Figure 2.
Source profiles obtained by the PMF analyses for Yuci College Town, Shanxi, China. Bars represent mass concentrations and red squares represent contribution percentages from each source factor.
Figure 2.
Source profiles obtained by the PMF analyses for Yuci College Town, Shanxi, China. Bars represent mass concentrations and red squares represent contribution percentages from each source factor.

Figure 3.
Contributions of identified sources to PM2.5-bound metal based on the PMF model in Yuci College Town, Shanxi, China.
Figure 3.
Contributions of identified sources to PM2.5-bound metal based on the PMF model in Yuci College Town, Shanxi, China.

Figure 4.
The 72-h back trajectories on 25 November 2020 in Yuci College Town, Shanxi, China. The red color line represents the height of 50 m; blue line: 500 m; green line: 1000 m.
Figure 4.
The 72-h back trajectories on 25 November 2020 in Yuci College Town, Shanxi, China. The red color line represents the height of 50 m; blue line: 500 m; green line: 1000 m.

Figure 5.
Non-carcinogenic (A) and carcinogenic (B) risks of exposure to PM2.5-bound metals estimated via the inhalation route in Yuci College Town, Shanxi, China (n = 34).
Figure 5.
Non-carcinogenic (A) and carcinogenic (B) risks of exposure to PM2.5-bound metals estimated via the inhalation route in Yuci College Town, Shanxi, China (n = 34).

Figure 6.
The composition of energy consumption in recent years in Shanxi Province, China.

Figure 7.
The number of days that reached the air quality standards in recent years and the annual mean concentrations of PM2.5 in Jinzhong, Shanxi Province, China.
Figure 7.
The number of days that reached the air quality standards in recent years and the annual mean concentrations of PM2.5 in Jinzhong, Shanxi Province, China.


Table 1.
Toxicological parameters of the heavy metals used for health risk assessment via the inhalation route.
Table 1.
Toxicological parameters of the heavy metals used for health risk assessment via the inhalation route.
| Contaminants | Class a | RfCi b | IUR b | |
|---|---|---|---|---|
| WHO | μg·m−3 | (μg·m−3)−1 | ||
| As | Arsenic | 1 | 0.015 | 0.0043 |
| Cd | Cadmium | 1 | 0.01 | 0.0018 |
| Co | Cobalt | 2B | 0.006 | 0.009 |
| Cr (VI) | Chromium | 1 | 0.1 | 0.084 |
| Cu | Copper | - c | 1000 d | - |
| Ni | Nickel | 2B | 0.014 | 0.00026 |
| Pb | Lead | 2B | 0.15 e | 0.000012 |
| Zn | Zinc | - | 300 | - |
a Class: Agents classified by IARC the monographs adapted with permission from Ref. [17]. 2021, International Agency for Research on Cancer. b RfCi: reference concentration of ith heavy metal; IUR: inhalation unit risk, with their values from the US EPA: Regional screening levels (RSLs)—Generic Tables [22]. c Not reported. d Data from the literature [25]. e Data from the literature [26].
Table 2.
Statistical description of the daily PM2.5 mass (μg·m−3) and the concentrations of its metals (ng·m−3) during winter in 2020 at Yuci College Town, Shanxi, China (n = 34).
Table 2.
Statistical description of the daily PM2.5 mass (μg·m−3) and the concentrations of its metals (ng·m−3) during winter in 2020 at Yuci College Town, Shanxi, China (n = 34).
| PM2.5 | As | Cd | Co | Cr (VI) | Cu | Ni | Pb | Zn | Sum | |
|---|---|---|---|---|---|---|---|---|---|---|
| Min | 17 | 0.43 | 0.04 | 0.01 | 0.39 | 0.69 | 0.22 | 1.04 | 0.71 | 27.92 |
| Median | 74 | 4.22 | 0.68 | 0.15 | 0.99 | 12.82 | 1.48 | 15.19 | 164.02 | 196.46 |
| Max | 174 | 11.36 | 4.88 | 1.61 | 2.91 | 67.15 | 6.82 | 40.52 | 823.39 | 905.26 |
| Mean | 81 | 4.71 | 0.89 | 0.29 | 1.31 | 20.04 | 1.82 | 14.95 | 191.87 | 235.87 |
| SD a | 35 | 2.70 | 0.86 | 0.38 | 0.77 | 17.35 | 1.48 | 9.09 | 145.92 | 161.88 |
| WHO guideline value b | 25 | 6.6 | 5 | - | 0.25 | - | 25 | 500 | - | |
| Grade II threshold c | 75 | 6 | 5 | - d | 0.025 | - | - | 500 | - |
Table 3.
A comparison of the results from other studies regarding the mean concentrations (ng·m−3) of PM2.5-bound heavy metals in urban regions.
Table 3.
A comparison of the results from other studies regarding the mean concentrations (ng·m−3) of PM2.5-bound heavy metals in urban regions.
| Country | Areas | Year | PM2.5 | As | Cd | Co | Cr (VI) | Cu | Ni | Pb | Zn | References |
|---|---|---|---|---|---|---|---|---|---|---|---|---|
| Czech Republic | Třinec-Kosmos | 2020 | 28 | 1.3 | 0.26 | 0.05 | 1.1/7 d | 4.6 | 0.81 | 11 | 34 | [36] |
| Romania | Iasi | 2016 | 20 | 5.70 | 0.33 | 0.09 | 1.78/7 | 7.70 | 24.3 | 1.99 | 33.9 | [39] |
| India | Kolkata | 2019 | 111.7 | - | 1.2 | 0.3 | 6.9/7 | 15 | 8.1 | 36 | 370 | [41] |
| Iran | Isfahan | 2015 | - a | 32.47 d | 5.77 | - | 57.4/7 | 13.76 | 7.43 | 46.72 | - | [5] |
| Iran | Karaj | 2019 | 67 | 32.1 | 84 | - | 49.5/7 | 203 | 60.8 | 133 | 242 | [40] |
| Japan | Kitakyushu | 2019 | 21.3 | 1.4 | - | - | 3.0/7 | 3.6 | 3.3 | 10.5 | 29.5 | [7] |
| Saudi Arabia | 2020 | - | 83 | 17 | - | 8/7 | 9 | 10 | 119 | 31 | [6] | |
| USA | Los Angeles | 2018 | 13.8 | - | 6 | 1 | 3/7 | 10 | 3 | 5 | 10 | [12] |
| China | Beijing | 2019 | - | 4.02 | - | - | 1.79/7 | 7.37 | 0.77 | 21.13 | 78.99 | [33] |
| Chengdu | 2018 | 113.2 | 4.5 | - | - | - | 7.5 | 7.7 | 21.9 | 60.8 | [34] | |
| Chongqing | 2019 | 97.1 | 7.56 | - | - | 4.29/7 | 15.83 | 1.39 | 37.93 | 94.22 | [37] | |
| Guangzhou | 2017 | 55 | 4.39 | 0.74 | 0.53 | 10.1/7 | 16.37 | 5.72 | 25.52 | 127.31 | [10] | |
| Guilin (haze) | 2017 | 144 | - | 19.0 | - | 11.5/7 | 17.4 | - | 78.8 | 300.7 | [42] | |
| Handan | 2017 | - | 11.94 | 2.74 | - | 11.1/7 | 23.17 | 2.11 | 104.3 | 286.9 | [43] | |
| Hefei | 2017 | 81 | - | - | - | 10/7 | 11.29 | - | 12.64 | 273.5 | [44] | |
| Lanzhou | 2018 | 73 | 3 | 1 | 1.3 | - | 29 | - | 407 | - | [35] | |
| Xi’an | 2016 | 50.1 | 117.2 | 16.3 | - | 343/7 | - | 11.3 | 35.0 | 267.1 | [9] | |
| Xuanwu | 2016 | 61.1 | 6.44 | 1.88 | 0.29 | 77.5/7 | 20.99 | 3.73 | 54.72 | 212.76 | [10] | |
| Shanxi, | Changzhi | 2018 | 56.1 | 4.9 | 0.7 | 0.2 | 14.3/7 | 7.8 | 4.2 | 30.8 | 82.3 | [32] |
| China | Taiyuan | 2017 | - | 8.15 | 1.07 | 1.20 | 29.9/7 | 29.56 | 12.69 | 94.36 | 230.57 | [11] |
| Yuci | 2017 | - | 9.45 | 1.12 | 0.70 | 11.7/7 | 14.66 | 3.56 | 91.29 | 263.26 | [11] | |
| Yuci | 2020 | 80.65 | 4.71 | 0.89 | 0.29 | 1.31 | 20.04 | 1.82 | 14.95 | 191.87 | This study | |
| WHO guideline value b | 25 | 6.6 | 5 | - | 0.25 | - | 25 | 500 | - | |||
| Grade II threshold c | 75 | 6 | 5 | - | 0.025 | - | - | 500 | - | |||
a Not reported. b WHO global air quality guidelines adapted with permission from Ref. [4]. 2005, World Health Organization. c Annual average concentrations of the Chinese ambient air quality standards [29]. d/7: The concentration of Cr (VI) was calculated to be 1/7 of the Cr concentration according to the US EPA regional screening levels [22]. Values higher than those in Yuci College Town are shown in bold.
Publisher’s Note: MDPI stays neutral with regard to jurisdictional claims in published maps and institutional affiliations. |
© 2022 by the authors. Licensee MDPI, Basel, Switzerland. This article is an open access article distributed under the terms and conditions of the Creative Commons Attribution (CC BY) license (https://creativecommons.org/licenses/by/4.0/).
Share and Cite
MDPI and ACS Style
Li, L.; Qi, H.; Li, X. Composition, Source Apportionment, and Health Risk of PM2.5-Bound Metals during Winter Haze in Yuci College Town, Shanxi, China. Toxics 2022, 10, 467. https://0-doi-org.brum.beds.ac.uk/10.3390/toxics10080467
AMA Style
Li L, Qi H, Li X. Composition, Source Apportionment, and Health Risk of PM2.5-Bound Metals during Winter Haze in Yuci College Town, Shanxi, China. Toxics. 2022; 10(8):467. https://0-doi-org.brum.beds.ac.uk/10.3390/toxics10080467
Chicago/Turabian StyleLi, Lihong, Hongxue Qi, and Xiaodong Li. 2022. "Composition, Source Apportionment, and Health Risk of PM2.5-Bound Metals during Winter Haze in Yuci College Town, Shanxi, China" Toxics 10, no. 8: 467. https://0-doi-org.brum.beds.ac.uk/10.3390/toxics10080467
Note that from the first issue of 2016, this journal uses article numbers instead of page numbers. See further details here.