Hunting for Toxic Industrial Chemicals: Real-Time Detection of Carbon Disulfide Traces by Means of Ion Mobility Spectrometry


1
Faculty of Environmental Science and Engineering, Babes-Bolyai University, RO-400294 Cluj-Napoca, Romania
2
“Raluca Ripan” Institute for Research in Chemistry, Babes-Bolyai University, RO-400294 Cluj-Napoca, Romania
3
Interdisciplinary Centre of Modern Technologies, Nicolaus Copernicus University, 87-100 Toruń, Poland
*
Authors to whom correspondence should be addressed.
Toxics 2020, 8(4), 121; https://0-doi-org.brum.beds.ac.uk/10.3390/toxics8040121
Submission received: 24 November 2020
/
Revised: 6 December 2020
/
Accepted: 10 December 2020
/
Published: 14 December 2020
(This article belongs to the Special Issue Environmental and Biological Monitoring: Analytical Methods and Assessment)
Abstract
:Sensitive real-time detection of vapors produced by toxic industrial chemicals (TICs) represents a stringent priority nowadays. Carbon disulfide (CS2) is such a chemical, being widely used in manufacturing synthetic textile fibers and as a solvent. CS2 is simultaneously a very reactive, highly flammable, irritant, corrosive, and highly toxic compound, affecting the central nervous system, cardiovascular system, eyes, kidneys, liver, skin, and reproductive system. This study was directed towards quick detection and quantification of CS2 in air, using time-of-flight ion mobility spectrometry (IMS); photoionization detection (PID) was also used as confirmatory technique. Results obtained indicated that IMS can detect CS2 at trace levels in air. The ion mobility spectrometric response was in the negative ion mode and presented one product ion, at a reduced ion mobility (K0) of 2.25 cm2 V−1 s−1. Our study demonstrated that by using a portable, commercial IMS system (model Mini IMS, I.U.T. GmbH Berlin Germany) one can easily measure CS2 at concentrations of 0.1 ppmv (0.3 mg m−3) in the negative ion mode, which is below the lowest threshold value of 1 ppmv given for industrial hygiene. A limit of detection (LOD) of ca. 30 ppbv (0.1 mg m−3) was also estimated.
1. Introduction
Ion mobility spectrometry (IMS) is a rapid, highly performant, and unique analytical technique, which is widely used for separating and identifying chemicals as vapors present in air samples, at trace and ultra-trace levels, after these chemicals are ionized at atmospheric pressure [1,2]. The IMS technique has an exceptional sensitivity, since it measures ionic currents in the pico-amperes (10−12 A) range [1,2,3,4]. The rapidity of ion separation in the gaseous phase and at atmospheric pressure is the principal advantage of ion mobility spectrometry (a single spectrum is being acquired in just several dozens of milliseconds), which combines perfectly with the outstanding sensitivity (in the low ppbv range for most chemicals). Moreover, the great comfort in the use of IMS instrumentation, which has also a compact, rugged, and miniaturized design, determines the increasing popularity of IMS—from sensing explosives [5,6], precursors of illegal drugs [7,8], or chemical weapons [9,10], to an increasing number of bio-medical [11,12] and industrial applications [13,14]. Moreover, the IMS technique has brought benefits in various fields, such as medicine, biology, industrial hygiene, security applications, and investigation of the environment [6].
Carbon disulfide is a linear non-polar molecule, a colorless liquid (with a pleasant smell—sweet—if it is pure; reagent grades are foul smelling) or faintly yellow (with an unpleasant odor like that of rotting radishes when it is impure), with moderate solubility in water and high lipophilicity [15,16]. The most important chemical and physical properties of CS2 are listed in Table 1.
Although CS2 is well known as a natural component released from geological oil and gas deposits, is naturally produced by microorganisms in the soil, or emitted as a result of vegetation fires and volcanoes [17,18]; however, the main sources of CS2 are anthropogenic. Therefore, CS2 is a toxic industrial compound (TIC), produced by the heating/burning of all carbon sources containing sulfur (charcoal, natural gas, oil) [15] and widely utilized in several important industries. For instance, the annual industrial production of CS2 was evaluated in 2010 to approximatively 75 million kilograms per year, only for use in rayon and cellophane production, as well as in oil, gas, agricultural, and metal processing industries [17].
The toxicity of CS2 has been described since 1850, by the French medical doctor August Delpech, who described that the abovementioned toxin causes the so-called “disulfide carbon neurosis” [19]. Later on it was revealed that the most relevant health problems connected with CS2 exposure are those related to the cardiovascular system and central nervous systems, as well as to retinal angiopathies and impairments of color vision [20]. Toxic effects on the female reproductive system, (menstrual disturbances and precocious menopause occurrence) that appeared in workers chronically exposed to CS2 in their workplace in the viscose industry were also well documented and discussed in a comprehensive review article [21]. An epidemiological study that extended over 10 years (1975–1985), including 251 workers exposed to CS2 and 124 controls, was realized in two viscose rayon factories in Czechoslovakia. The obtained results highlighted the increased mortality due to cardiovascular diseases of spinner workers exposed to high levels (between 9.6 and 48 ppm) of CS2 when compared with the less exposed workers [22]. Today, the neurotoxicity of CS2 [23], its vascular effects [24], cardiovascular and liver effects [25], and other effects [22] are well documented. The effect of prolonged exposure to CS2 in humans is summarized in Table S1, which is presented as Supplementary Material.
The OSHA permissible exposure limit (8-h time-weighted average (TWA)) is 20 ppmv (ca. 73 mg CS2 m−3 of air), while the recommended exposure limit (REL) for REL-TWA (time-weighted average) is only 1 ppmv (3.16 mg m−3); REL-STEL (short-term exposure limit) is 10 ppmv (31.6 mg m−3). The NIOSH recommendations are as the follows: the recommended exposure limit: 1 ppmv (3.16 mg m−3)—skin (10 h TWA); recommended exposure limit as 15 min short-term exposure limit (STEL): 10 ppmv (31.6 mg m−3)—skin. The oral lethal dose for a human was reported to be as low as 15 mL for an adult (upon ingestion of CS2), so the LD50 = ca. 250 mg CS2/kg body weight. The minimum lethal dose reported in humans was only 14 mg/kg body weight (1 g of CS2 for a 70 kg person). However, the exposure to 500 ppmv (for 30 min) can be life-threatening (IDLH—Immediately Dangerous to Life and Health; NIOSH) [26,27]. Death has been reported from exposure to a CS2 vapor concentration of 4815 ppm for 30 min [28].
Persistence of CS2 in the environment is rather low. The life time of CS2 in the air roughly ranges from 1 to 10 weeks [22]. The average decomposition half-time (t1/2) of CS2 vapors in the atmosphere is about 5 to 10 days [28]. The aquatic fate of CS2 does not imply its adsorption onto sediments or suspended solids, but rapid volatilization with half-lives ranging between 3 h and 2.5 days, a function of concrete conditions [28]. The database on occupational exposure to CS2 as a result of rayon fiber production is extensive. In Table 2, some selected examples from studies conducted after the 1990s, reported in different countries, are indicated. In the last years, more and more care has been taken to reduce CS2 pollution in the environment, and consequently human exposure to it. The global problem is a significant one, and pollution control standards are increasingly restrictive [18]. To address this, fast and sensitive analytical platforms able to detect CS2 at trace levels (and preferably at lower concentrations than the dangerous thresholds) are highly required. GC-MS and GC-FID, equipped with various types of columns [29], which are considered the gold standard in VOC analysis used in various fields [30,31,32,33,34], have been involved in CS2 detection in human breath and proved to have a detection sensitivity of 76 ng m−3 in case of GC-MS [35] and 5 μg m−3 in case of GC-FID [36]. However, GC-FID methods are not the most suitable to analyze CS2 because it lacks C–H bonds, which are necessary for the production of a good signal in FID [37]. Classical spectrophotometric methods are also useful (with limits of detection of 0.2 and 0.4 mg⋅m−3, respectively [38]), but they involve a laborious and time-consuming sample preparation. Recently, an innovative method for analysis of CS2 using a Polyarc/FID system was developed; a minimum detectable concentration of 0.14 ppmv was found [37].
We demonstrated through this study that IMS instrumentation is perfectly fitted for this type of application, presenting some strategic advantages (sensitivity, sensibility, and real-time response) compared with other techniques used before. Unspecific PID (photoionization detector) instrumentation, previously used for toxic VOCs monitoring in shoe shops [49] or soil contamination control [50], is also a suitable and useful technique to be used for quantification of CS2. The limits of detection of both PID and IMS are lower than the limits detected by the classically used instrumentation, while sample preparation is not required. The relevance of this manuscript relies on the importance of CS2 and to the related deleterious effects—on humans and on the environment—produced by its vapors. IMS has already proven to be a very useful and fast analytical technique for rapid trace detection of chemicals. We have proven that IMS can be used successfully to measure, in real time (several seconds), trace levels (sub parts-per-million, ppmv) of CS2 vapors in air. The minimum detectable concentration of CS2 was found to be around 100 ppbv (0.31 mg/m3), which is well below the lowest threshold limit established for industrial hygiene, which is 1 ppmv.
To the best of our knowledge, until now the detection and quantification of carbon disulfide using the IMS technique has not yet been described, and this is why the present work represents an original approach.
2. Materials and Methods
2.1. IMS Instrument Used
A portable ToF (Time-of-Flight) IMS instrument (size: 26.5 × 22 × 14 cm; weighing 3.8 kg), providing real-time responses (ca. 1 s), model Mini-IMS, manufactured by the company I.U.T. mbH Berlin, Germany, was used for CS2 detection and quantification. The IMS cell has a classic design with stacked rings, where the conducting rings are alternated with insulating rings. The drift length of the IMS cell was 55 mm; the internal diameter was 20 mm. The electric field intensity was ca. 400 V cm−1, the operating temperature of the IMS cell was around 50 °C, while the pressure inside the cell was atmospheric pressure (ca. 1000 mbar). The radioactive ionization source was using the β-emitting isotope 3H (tritium), which was embedded within a stainless-steel disc; the initial activity of the ionization source was 300 MBq. Drift gas purified dry air at a flowrate of 400 cm3 min−1 was used, which was recirculated in a closed-loop pneumatic circuit that contained a filter with a 10A molecular sieve.
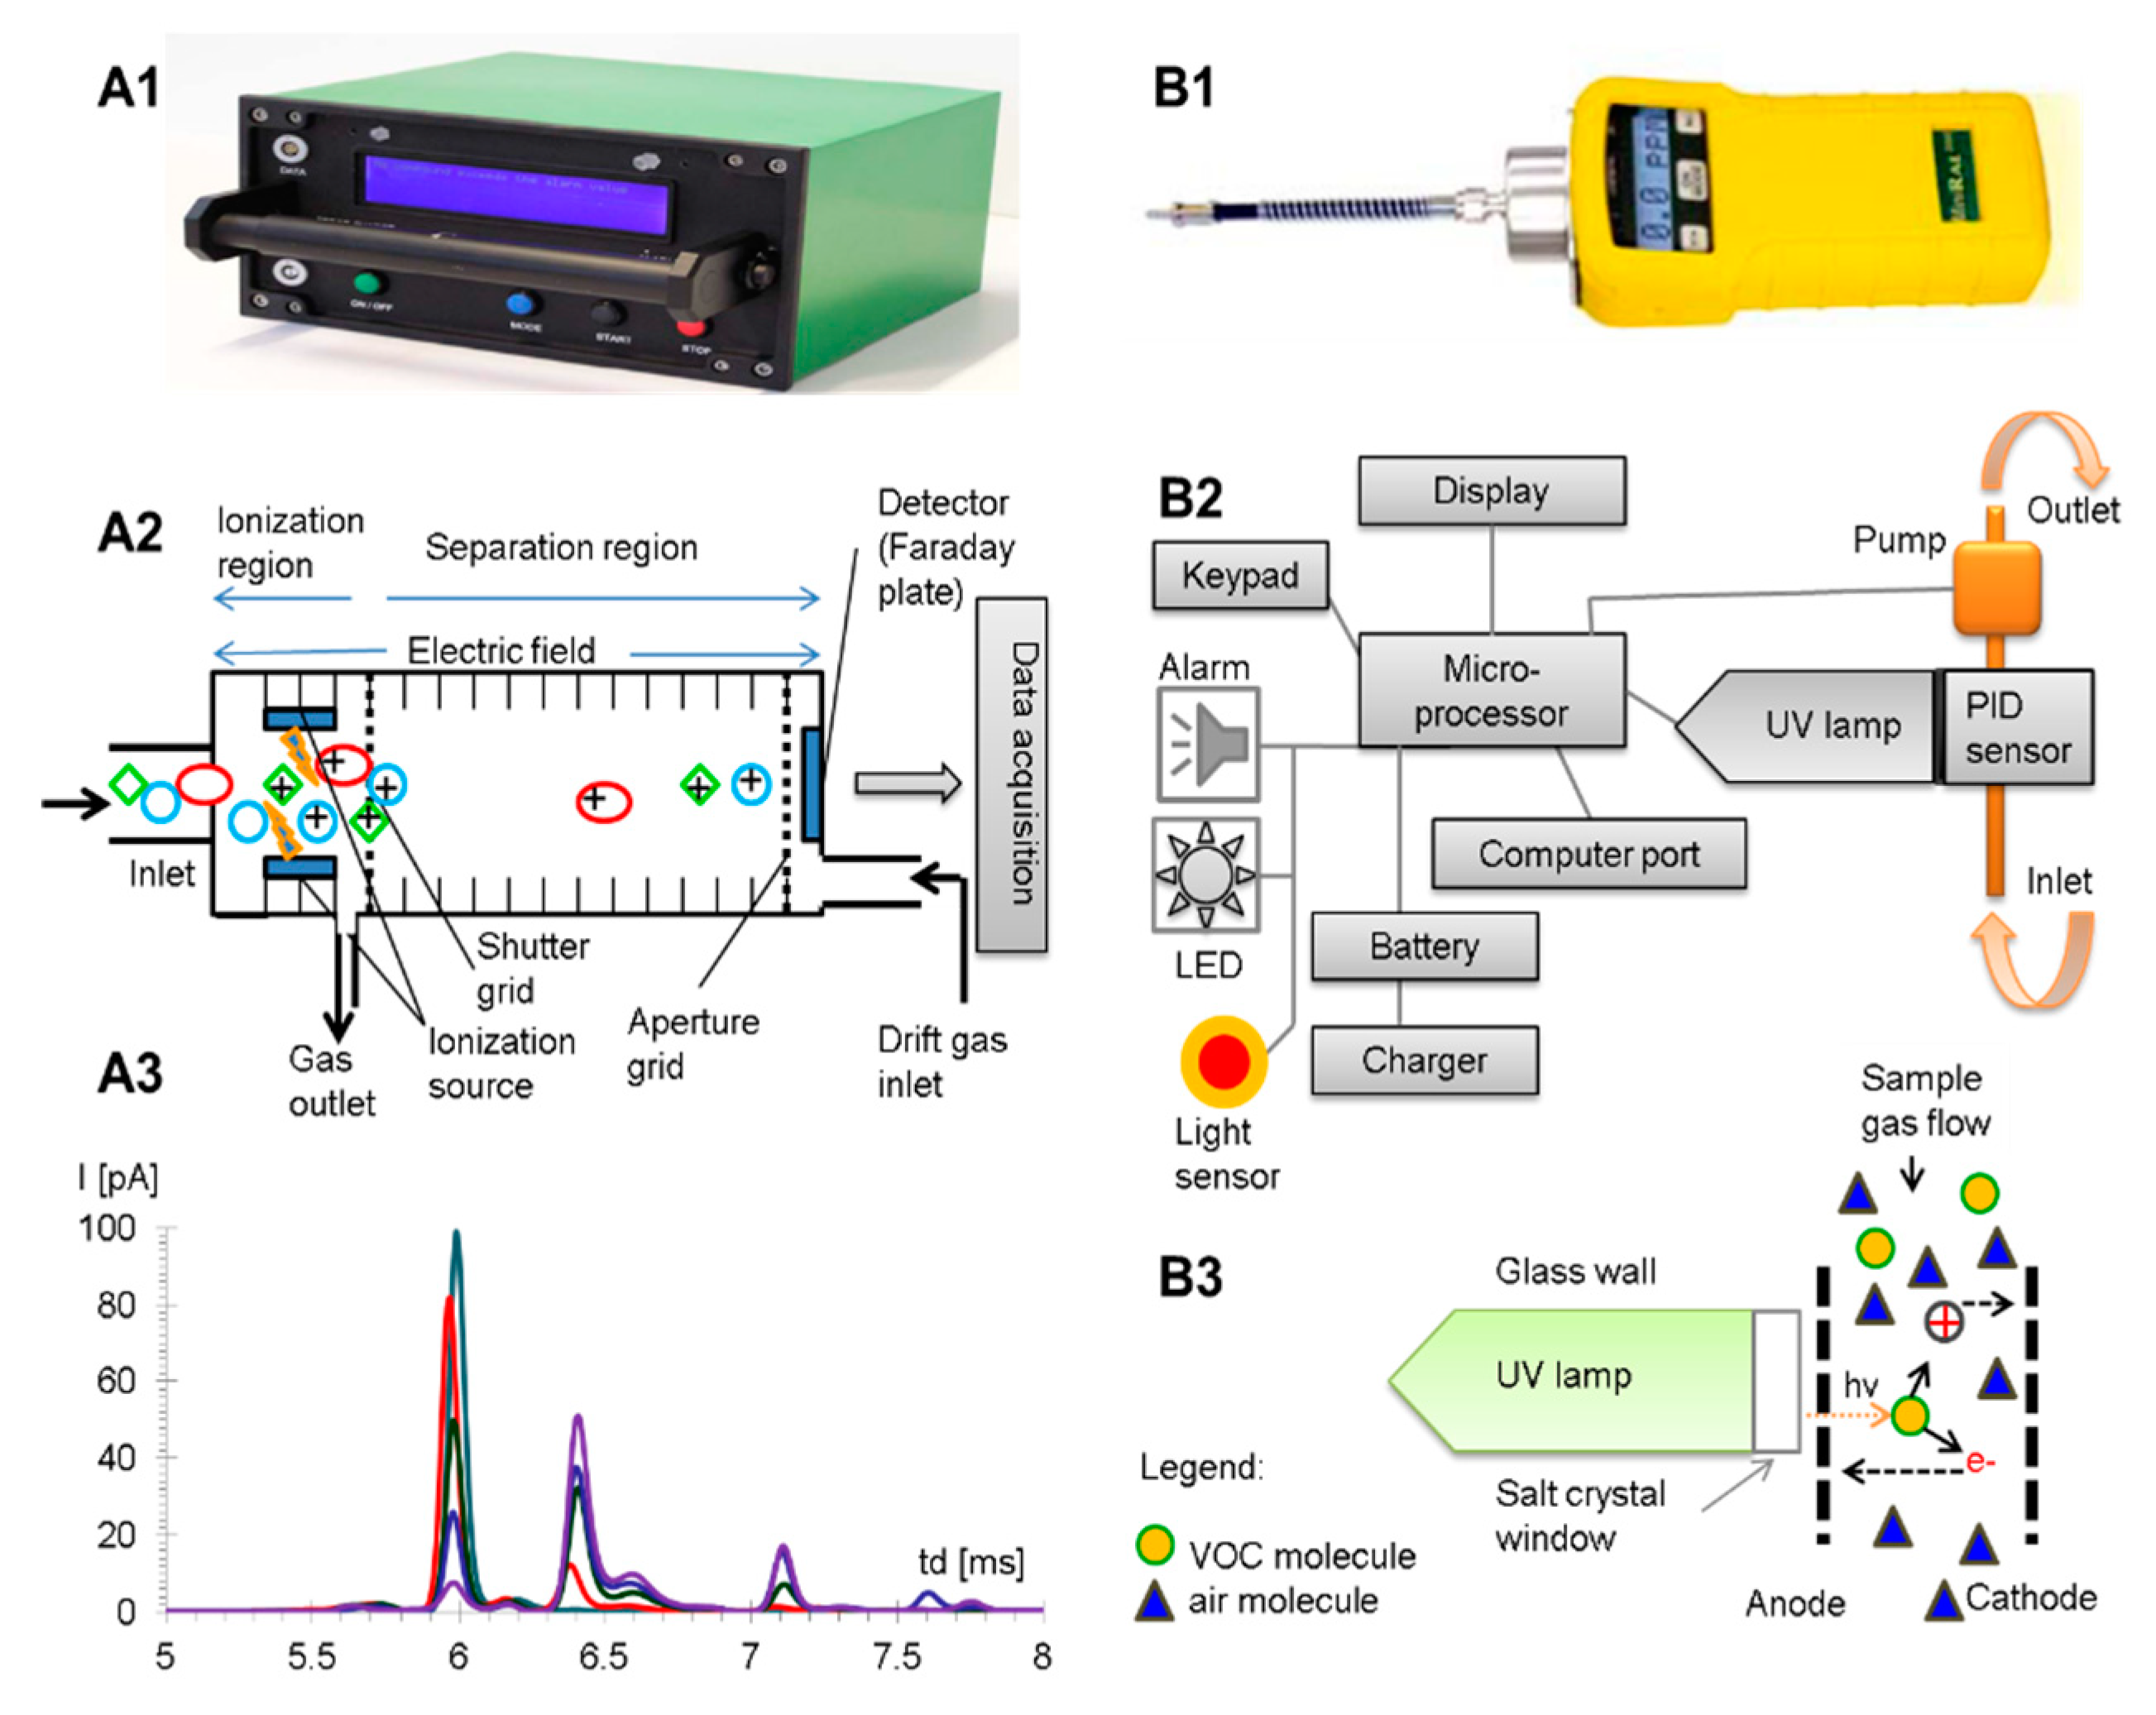
Sample air flow (50 cm3 min−1) was provided by a valve operated sequentially, and the inlet air flow (200 cm3 min−1) was secured by an inlet system using a sequentially pulsed valve. A minimal detectable concentration of vapors for an analyte is usually between 1 ppbv and 100 ppbv (depending on the proton affinities of the target analytes in the positive mode, or on the electron affinities in the negative mode, respectively). Power supply was given either by an internal rechargeable Li-Ion battery at 19 V DC (autonomous mode; min. operation time—ca. 8 h) or by mains (AC 220 V/50 Hz). The power consumption was only 6 W. The instrument was operated via a laptop computer, using the IMS Control Program Software, ver. 2.209 (IUT mbH). A photograph of the IMS instrument, together with a schematic of the IMS cell and a typical IMS response, are presented in Figure 1 (Part A).
The principle of IMS is based on separation of ions in the gaseous phase and at atmospheric pressure, based on the different drift velocities of the either positive or negative ions in a homogeneous DC electric field. The ionization process is a soft one, since the analyte molecules are not fragmented, and takes place in two stages—(a) formation of the reactant ions, followed by (b) generation of the product ions by collisional charge transfer from the reactant ions towards the analyte. Inside the radioactive ionization source, the first stage of ionization consists in formation of the so-called “reactant ions”, which are complex cluster ions like (H2O)nH+ (hydrated protons that form a vast majority), plus (H2O)mNH4+ and (H2O)uNO+ (in the positive ion mode) or (H2O)nO2− (in the negative ion mode) [1,2]. Each time when the sample of air that contains the target analyte CS2 is being introduced inside the IMS system, the tritium-based radioactive ionization source transforms the neutral analyte molecules present in the sample in positive and/or negative product ions. In ion mobility spectrometry, the ionization process that occurs is a soft one, because the molecules of the analyte keep their identity, in opposition to electron-impact mass spectrometry, where they are fragmented. After these reactant and product ions are being formed inside the ionization region; they are periodically injected, by means of an electronic shutter called the “shutter grid”, inside the drift region (which is actually the space between the shutter grid and the ion collector). Ions are being propelled towards the detector (a Faraday plate) by a constant DC electric field E with a relatively low intensity, usually in the range 100–500 V cm−1. Ions will therefore travel inside the drift cell with a constant drift speed, vd, which has a value of ca. 5–10 m s−1. Of course, when a certain ionic species reaches the detector, a very low ionic current (typically below 100 nA) will be produced, and then amplified and displayed. Nevertheless, a certain chemical produces ions that have a characteristic drift speed in a neutral drift gas; in other words, a substance may be identified on the basis of its drift time td and consequently of its ion mobility K, which is nothing else than a constant linking the ion’s drift speed vd to the intensity of the electric field: vd = K × E = ld/td (ld is drift length, and td is the drift time of a specific ion) [51]. Ion mobility can be therefore be expressed as K = vd/E = ld/(E⋅td), while the reduced ion mobility K0 takes into account the effects of temperature and pressure: K0 = K⋅(Tambient/Tcell)⋅(Pcell/Patmospheric). Currently, reduced ion mobility K0 is used extensively as a qualitative parameter, in order to characterize a certain compound [1,2].
2.2. PID Instrument Used
A PID ppbRAE Plus Model PGM-7240, produced by RAE Systems Inc., Sunnyvale, CA, USA, was used for measuring the concentrations of CS2. This is a very sensitive photo-ionization detector (1 ppbv to 200,000 ppbv), with a time response < 5 s, and which can be operated between −10 and +40 °C, used for measuring volatile photoionizable compounds. The PID instrument ppbRAE Plus has a highly compact design (size: 21.8 × 7.6 × 5.0 cm) with a mass of only 553 g and is equipped with a standard 10.6 eV UV lamp. The built-in sampling pump has an internal flow of 400 cm3 min−1. The PID instrument is powered by 4 AA alkaline batteries, which provide power for a duration of about 12 h of continuous operation.
The data is initially stored by an internal microprocessor and can be subsequently transferred to the PC computer by using a serial COM connection cable and the dedicated software ProRAE Suite, ver. 3.01a, 2004. Prior to analyses, the instrument was calibrated with a calibration gas cylinder, purchased from RAE Systems, Inc., containing isobutylene with a concentration of 10 ppmv in pure air. A PID photo, schematic of the component parts, and photoionization principle are presented in Figure 1 (Part B).
2.3. Sampling and Work Flow Procedure
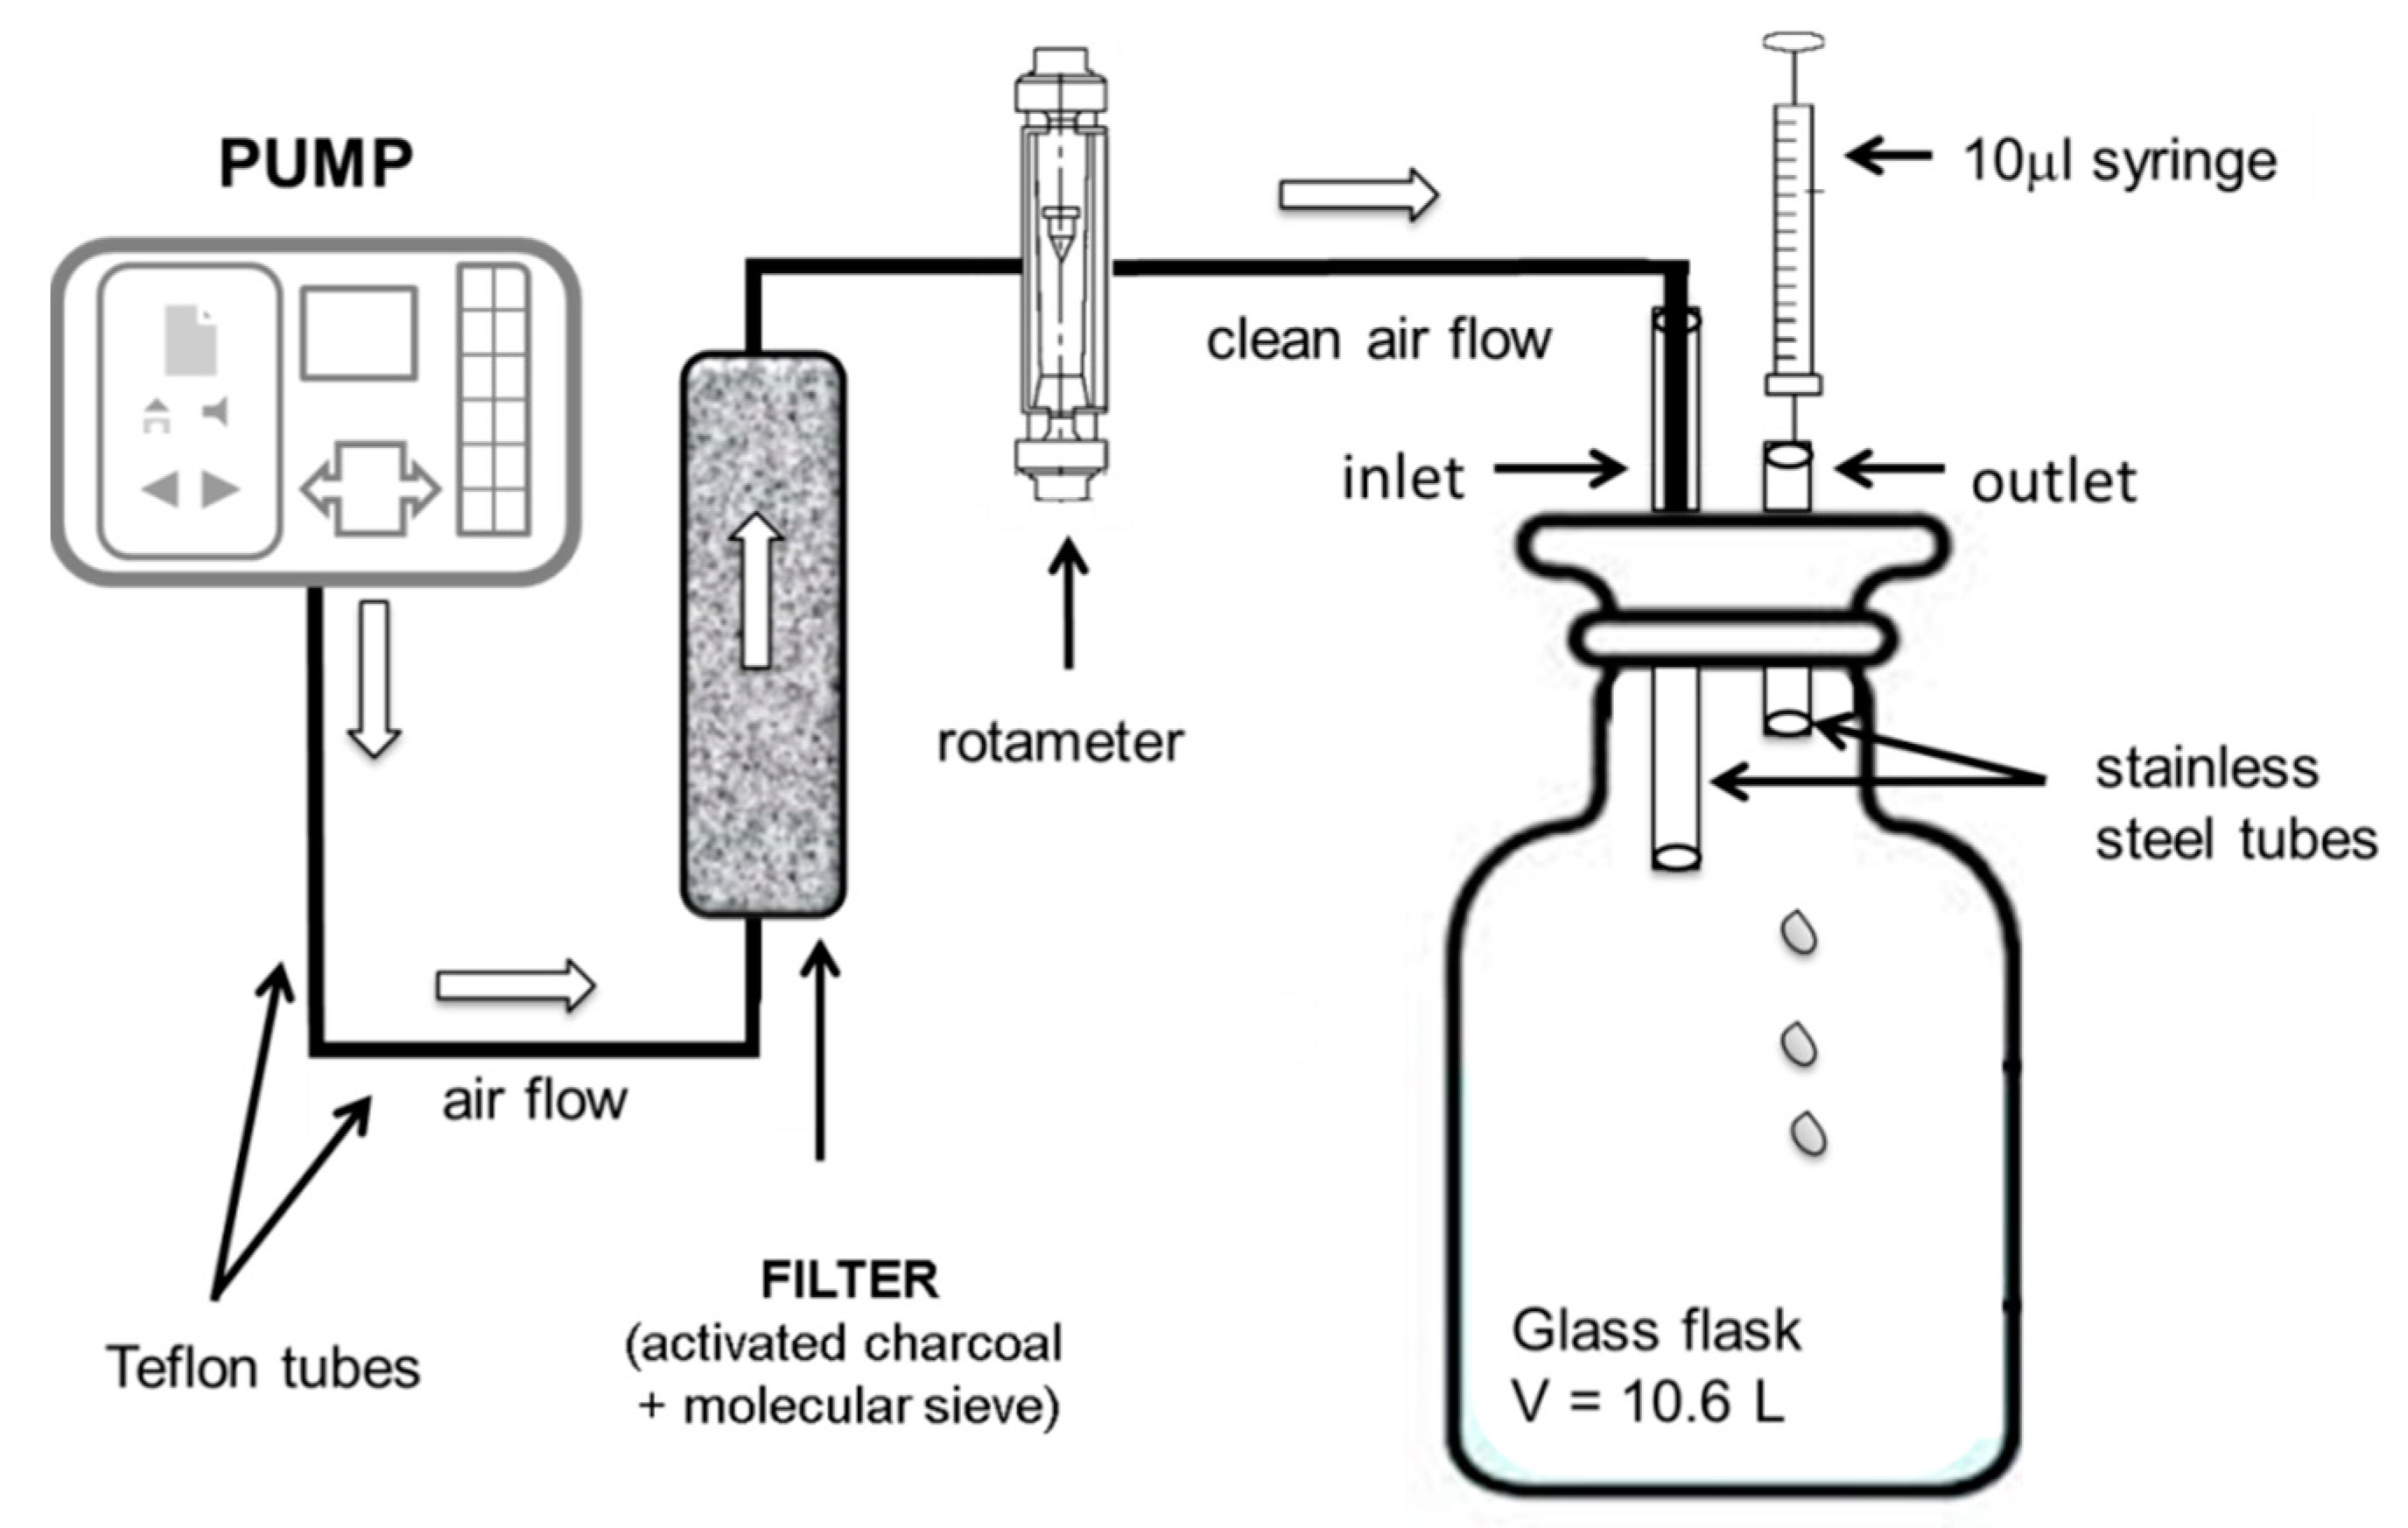
CS2 (with ≥99.5% purity) was purchased from Sigma-Aldrich (St. Louis, MO, USA). Test standard atmospheres at trace levels (ppmv) with known concentrations were obtained by using the exponential dilution method. In order to obtain the mentioned test atmospheres, 10 μL of CS2 (the equivalent of 378 ppmv) was injected inside a glass flask having a volume of 10.6 L, through a lid equipped with two ports (the inlet and outlet). After injecting the liquid pure CS2, clean air was pumped inside the glass flask through the inlet port, while the outlet port was used for sampling air with the desired CS2 vapor concentrations. A schematic diagram of the dynamic system used for the sampling is presented in Figure 2.
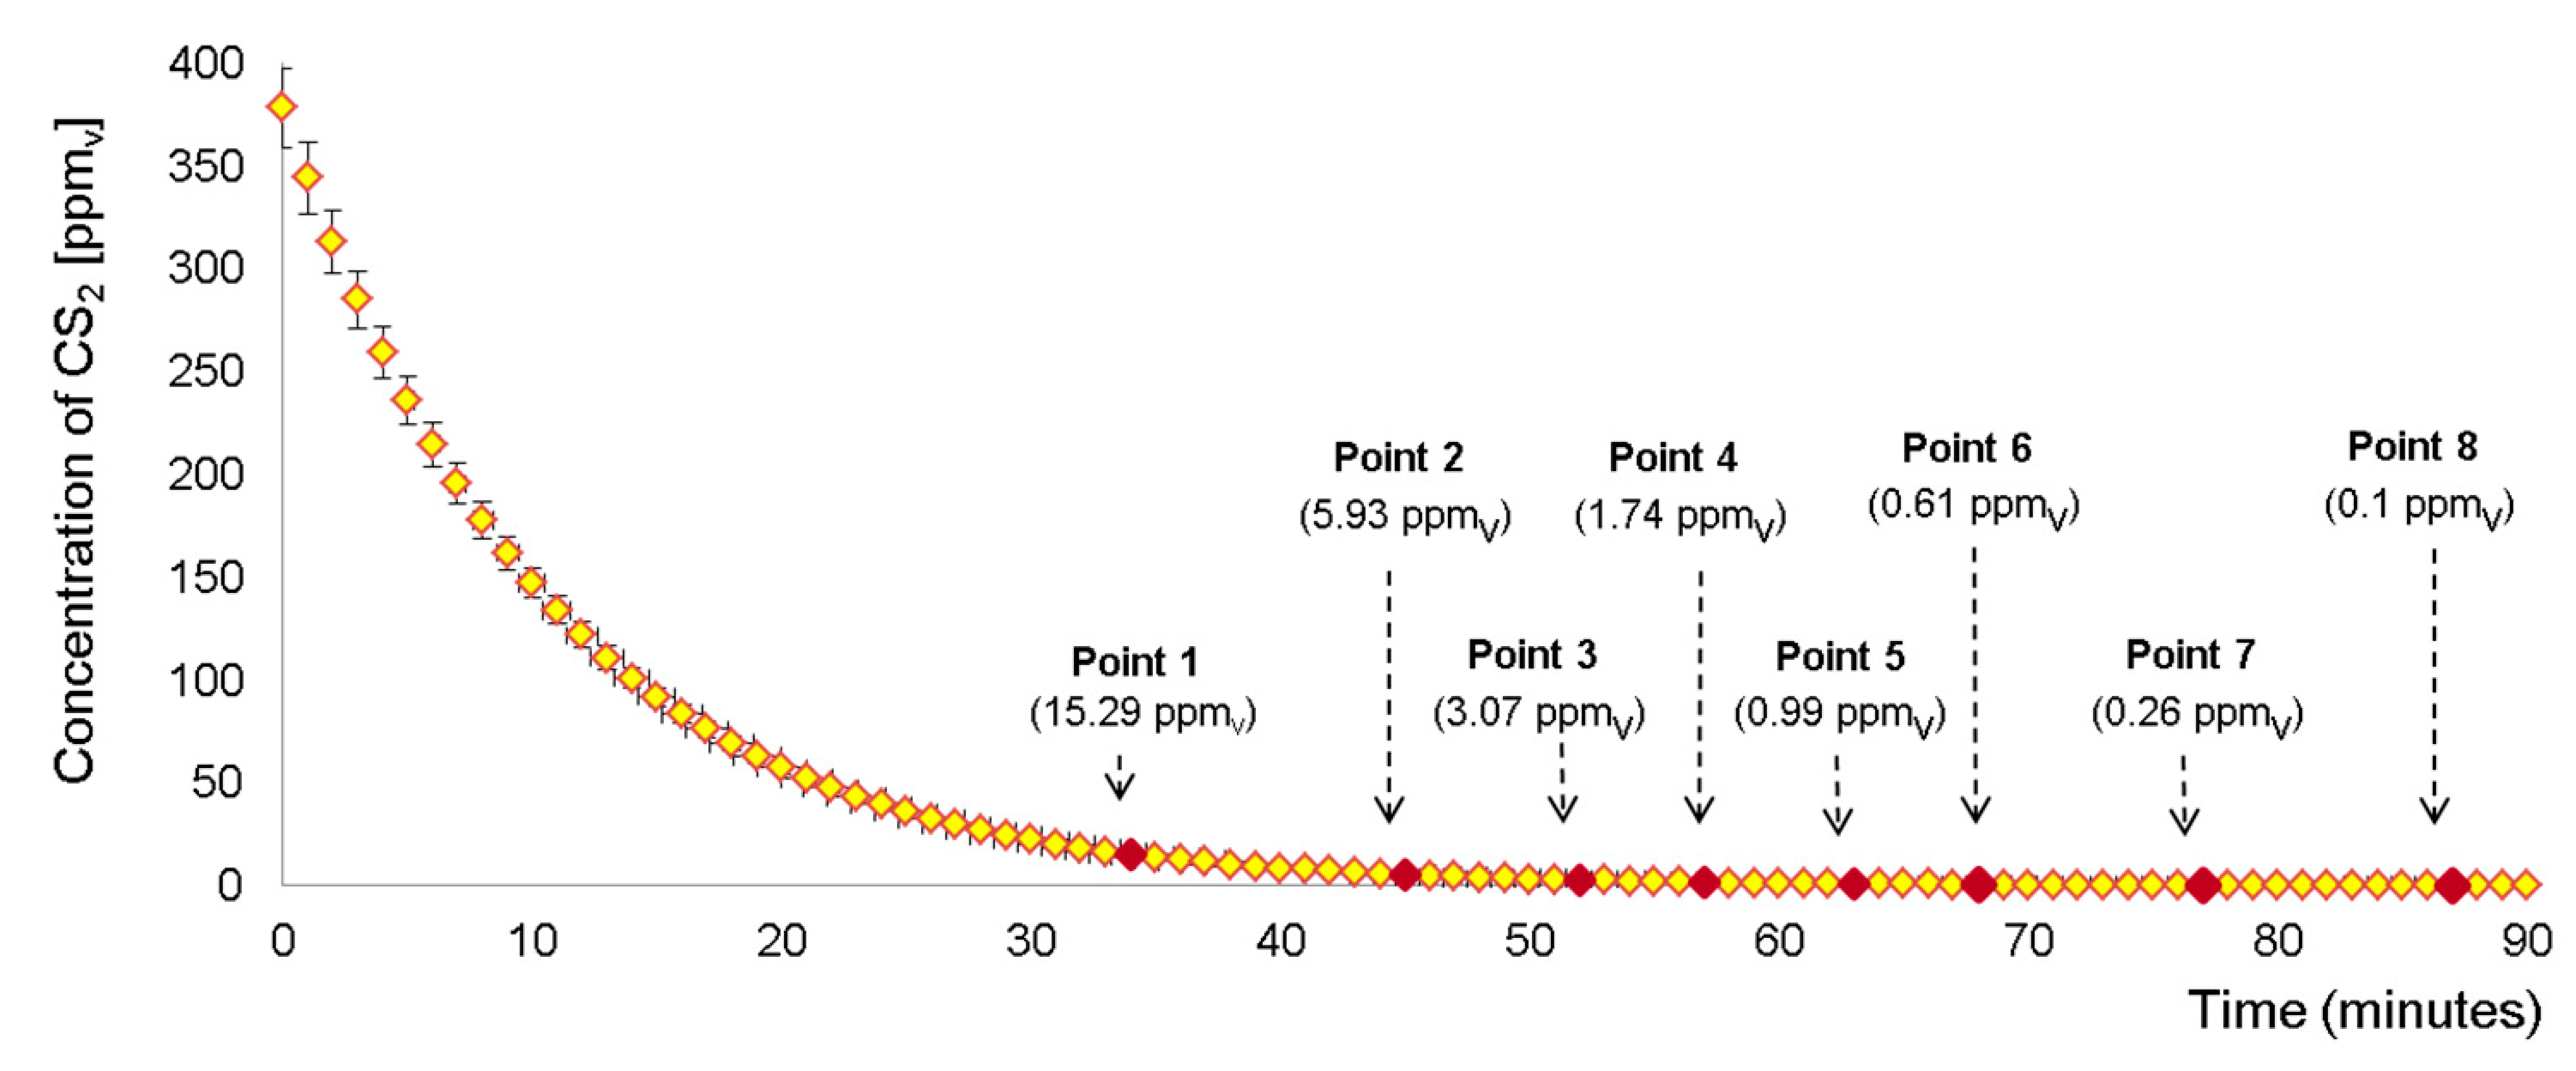
The air flow provided by the pump was 1 L min−1, while the sampling procedure occurred during 90 min. After each minute, the gas flow was stopped and the remaining CS2 vapor concentration in the flask was measured by the ppbRAE PID. The IMS measurements started only when the CS2 concentration was lower than the level of ca. 15 ppmv, in order to avoid the IMS contamination and the subsequent unwanted memory effects due to heavy saturation of the IMS instrument with the analyte.
3. Results
Experimental data generated by PID were continuously recorded during 90 min (one measurement per minute). Therefore, the PID readings were indicating the real concentration of the CS2 vapors inside the glass flask, at a certain moment in time. In the case of IMS, the measurements started when the vapor concentration arrived at 15 ppmv, and they were gathered simultaneously with the data produced by the PID instrument; eight different concentrations were investigated. The experiments were run in triplicate, during three different days, and a standard deviation between 7% and 2% was obtained for each concentration of CS2. The evolution of the analyte concentration during the exponential dilution experiment, obtained by using the PID device, is presented in Figure 3, in which the sampling points for the IMS measurements are marked as well.
The ion mobility spectrometric response from CS2 was obtained in the negative ion mode, which constitutes a real advantage for the identification of this TIC—since fewer compounds produce IMS responses in the negative ion mode compared to those generating responses in the positive ion mode.
Table 3 summarizes, in a succinct, logical, and clear manner, the experimental results coming from both analytical techniques based on the ionization of the chemicals at atmospheric pressure—IMS and PID. The measured CS2 concentration using the PID instrument was calculated by multiplying the PID reading (in ppbv units of isobutylene) with the PID correction factor for carbon disulfide (CFCS2 = 1.2) (for the UV lamp with a photon energy of 10.6 eV). We also have to emphasize at this point that the concentration of carbon disulfide vapors was checked continuously using the PID instrument ppbRAE Plus. In other words, by injecting a small volume of pure liquid CS2 (10 μL), we just intended to create a high initial concentration of CS2 vapors of ca. 380 ppmv, which has been further diluted using clean air in order to get a set of standard atmospheres with low vapor concentrations of carbon disulfide.
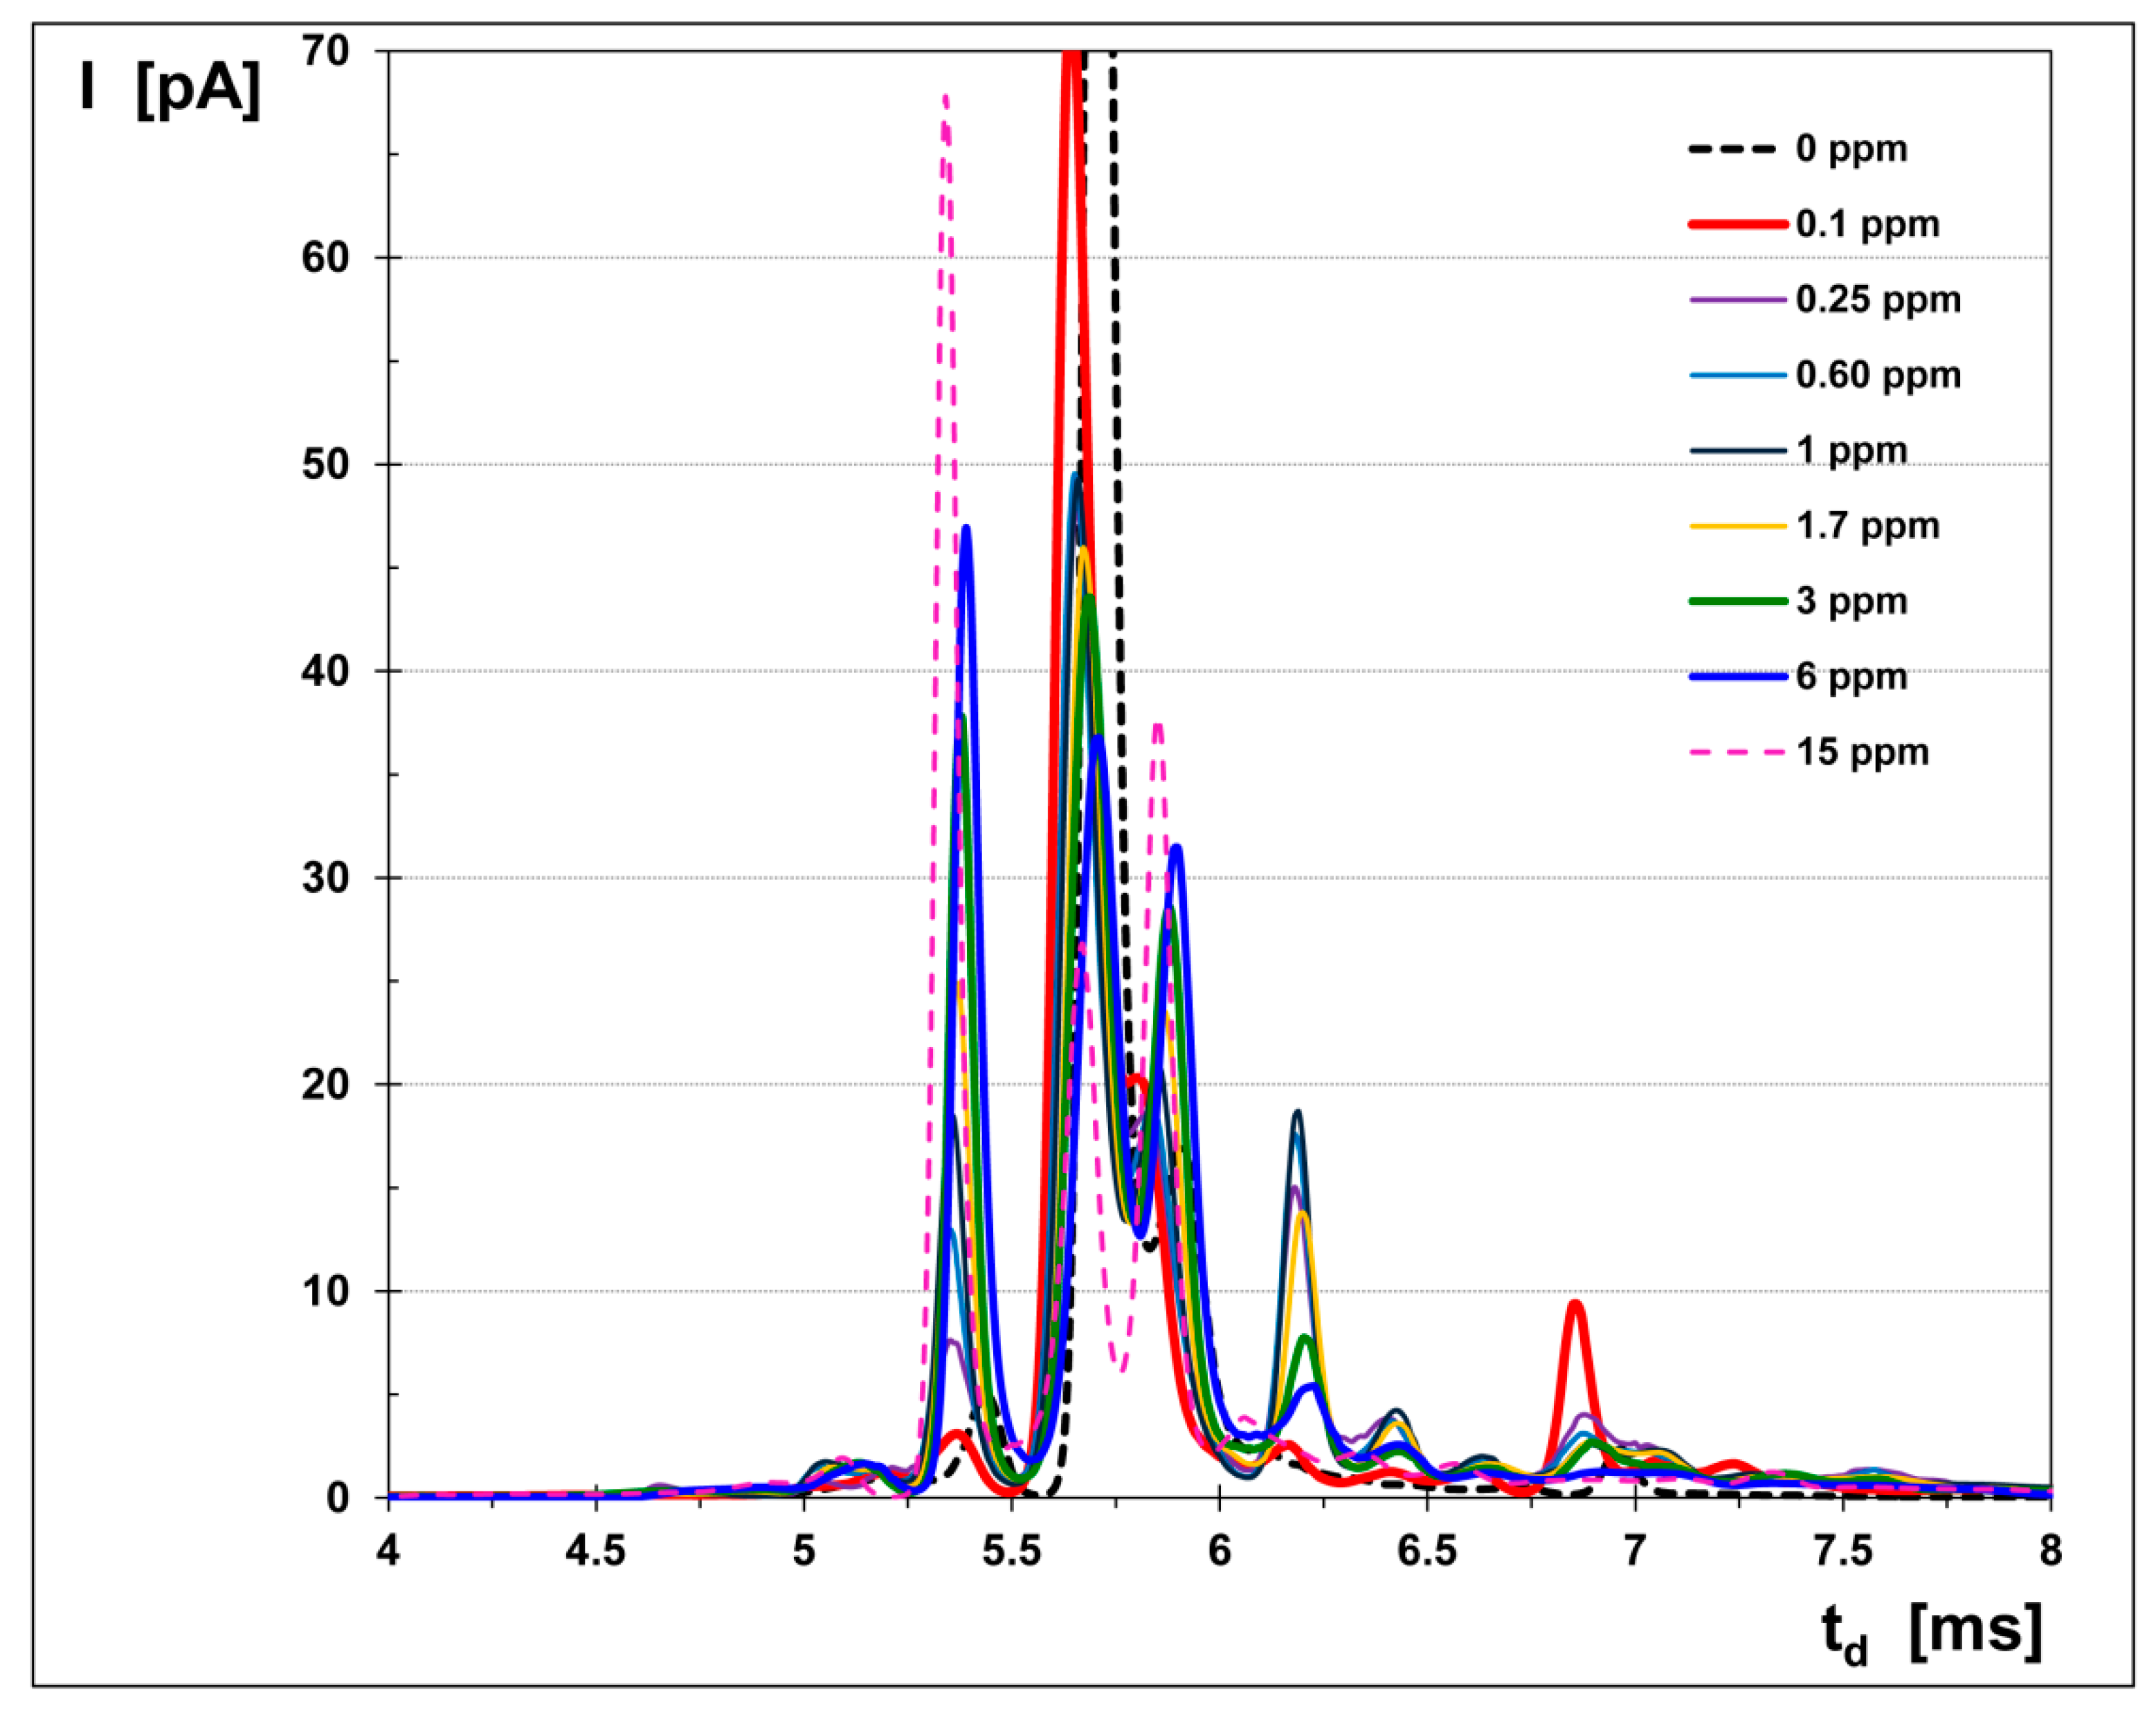
The ion mobility spectrometric response consisted of simple spectra, where one PIP (product ion peak) can be assigned to CS2 in the negative ion mode, at a drift time (td) = 5.38 ms. The negative reactant ion peak (RIP) was noticed at a drift time (td) = 5.68 ms.
The IMS spectra obtained in the negative mode are presented in Figure 4 and are perfectly illustrating the balance of the peaks’ intensity with the increase in the measured CS2 concentration. Thus, when the CS2 vapor concentration increases, the intensity of the negative RIP decreases while the height of the PIP increases. The peak observed at a drift time of ca. 6.2 ms is most probably generated by ultra-traces of acetic acid vapors, present as an impurity, since it remained relatively constant when the CS2 concentration changed.
The exact identity of both the reactant and product ions produced inside the IMS cell could be investigated and then assigned with a high degree of certainty only by coupling the IMS instrument with a mass spectrometer; this results in using a complex, hyphenated analytical system of the IMS-MS type. In fact, IMS-MS devices were used especially with the purpose of investigating the identity of the ions generated by highly toxic chemicals, such as chlorine and phosgene [9,10]. Identification of the ions generated by CS2 inside the IMS cell was not feasible in our study, because we have utilized only an IMS instrument. However, we can make the reasonable assumption that, in the negative ion mode, the product ion generated by carbon disulfide may be regarded as a sulfide negative ion.
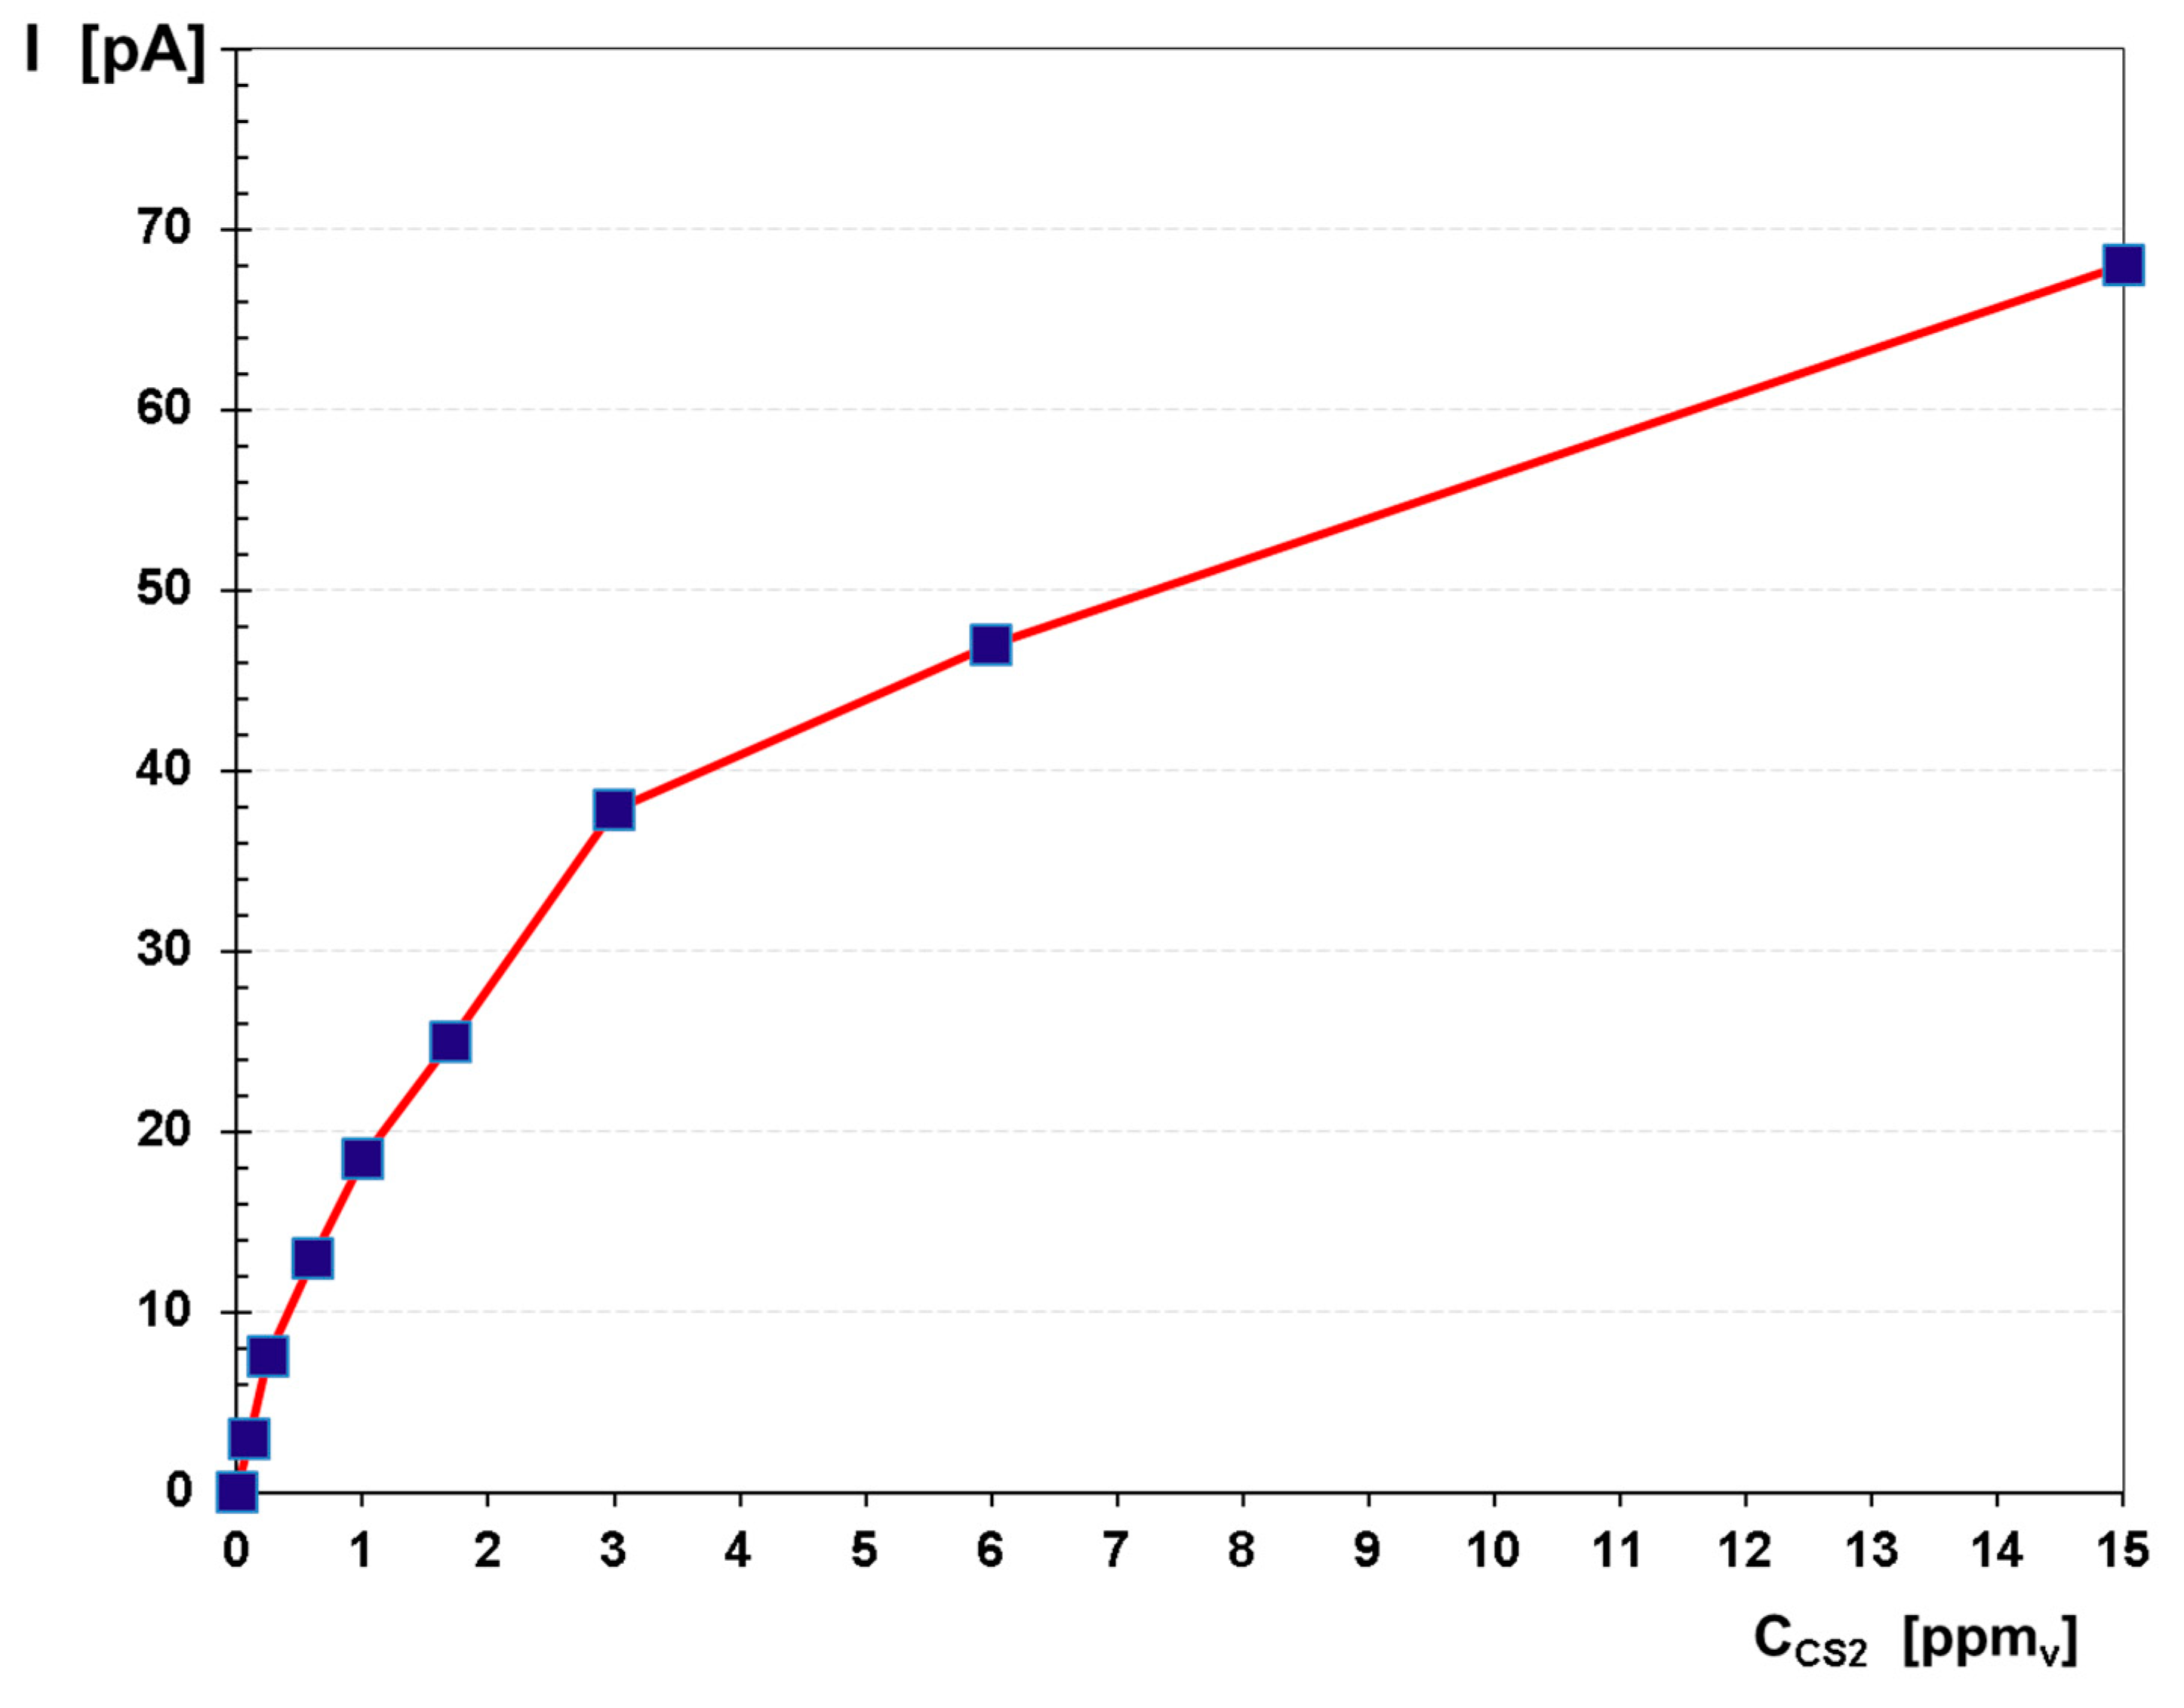
Quantitative data was used in order to build the calibration curve and then to evaluate the quantitative response of the ion mobility spectrometer to CS2. This calibration graph is given in Figure 5. A careful examination of both Figure 5 and of all the ion mobility spectra afferent to all the CS2 concentration levels (Figure 4) gives us the opportunity to extract the following conclusions:
- Total disappearance of the reactant ion peak RIP did not happen. It means, therefore, that saturation of the IMS instrument was not reached. In other words, contamination of the IMS cell has been successfully avoided, and, consequently, we may rely on the quantitative data provided by the IMS device.
- The minimum concentration measured was 100 ppbv (ca. 0.31 mg m−3) and the estimated minimum concentration level is thought to be ca. 30 ppbv (ca. 0.10 mg m−3).
- Saturation is thought to occur at around 20 ppmv (ca. 63 mg m−3) CS2, which is in total accordance with the well-known fact that the dynamic range of any IMS instrument that is equipped with a radioactive source extends to about two orders of magnitude.
The logarithmic-type calibration is totally specific to the IMS response from an instrument that uses a radioactive ionization source [1,2]. The negative ion mobility spectra obtained for the high concentrations (>3 ppmv) of analyte show a continuous decrease in the RIP amplitude with an increasing CS2 vapor concentration. However, even the spectra obtained for the maximum CS2 level, at 15 ppmv (47.5 mg m−3), clearly showed that the saturation threshold has still not been reached, since the reactant ion peak (RIP) still keeps an intensity of ca. 20% of its value when the carbon disulfide concentration was zero. Thus, we can claim that the golden rule of avoiding a heavy contamination of the IMS cell and gas lines inside the IMS instrument has been successfully obeyed. A heavy contamination of any IMS system must be avoided at any price, because it will produce unwanted memory effects and subsequent false alarms as well.
Nevertheless, all IMS spectra provide highly valuable information—both qualitative information, useful for characterizing a certain chemical (which resides in the drift time (td) and in the afferent reduced ion mobility (K0)), and quantitative information (included in the peak area/height). For any ionic cluster, the drift time is inversely proportional to mass and size, and proportional to its electrical charge. In summary, any peak of an ion mobility spectrum is characterized by a set of three numbers: (a) its drift time, td (in milliseconds); (b) its reduced ion mobility, K0 (in cm2 V−1 cm−1), and (3) its height (amplitude), hmax (in pA).
Qualitative information, which comprises the reduced ion mobility for both the negative reactant ion peak and for the CS2 product ion peak, is summarized in Table 4. A special mention to the fact that CS2 produces an ion that has a higher ion mobility (so travels faster) than the negative reactant ions; this situation is pretty rare and has been observed for very few target analytes, such as chlorine or hydrogen cyanide.
It is well worth mentioning here the ratio between the drift times of PIP and RIP, which is equivalent to the ratio of the reduced mobilities: td PIP/td RIP = K0 RIP/K0 PIP = 0.947.
For any analytical technique, including of course the IMS, the possible interferences are always a source of concern, for a variety of reasons—ranging from a loss in sensitivity to apparition of false alarms. However, it is absolutely needed to point out that in IMS only about 20% of the chemicals are generating product ions in the negative mode. Therefore, if a negative ion response is elicited, an ionization-based selectivity is obtained. In other words, the probability of having possible interfering chemicals in the negative operation mode is much lower, compared to the positive operation mode.
Resolution of the Mini IMS instrument, which is defined as the ratio between the drift time of a certain ion and its width at half height (RIMS = td/Δtd), also has been calculated for both the negative RIP ion and PIP ion generated by CS2. The results are given in Table 5.
The resolution is very close to the value of 50 indicated by the manufacturer and has an excellent value compared to other commercial portable IMS instruments with miniaturized measure cells (with lengths of ca. 4–5 cm), which display a lower resolution, usually between 10 and 15.
4. Discussion
In conclusion, we can claim that the carbon disulfide vapors in air were successfully measured at the trace and ultra-trace levels, between 100 ppbv and 15,000 ppbv, using IMS in the negative ion mode. Detection of CS2 in real time (several seconds) was successfully accomplished by IMS and by PID. Using IMS, a negative response was noticed, with one distinct and clearly separated product ion, with a reduced ion mobility, K0, of 2.25 cm2 V−1 s−1. In other words, the negative ion mode of the IMS response offers a good ionization-based selectivity in detection of CS2.
Quantitatively speaking, we emphasize that the concentration range that was investigated in the negative ion mode—from 0.1 to 15 ppmv CS2—has provided highly relevant pieces of information related to both the measurement range and the saturation. We have noticed that saturation starts to appear after ca. 15 ppmv of CS2. A minimum detectable concentration (MDC) of ca. 30 ppbv (0.10 mg m−3) CS2 was also estimated. We were able to measure 100 ppbv (0.31 mg m−3) of CS2 in air, a concentration that is 10 times lower than the REL TWA value (1 ppmv) and 5000 times lower than the IDLH value (500 ppmv).
We conclude that the portable ion mobility spectrometer model Mini-IMS manufactured by IUT mbH Berlin has a very good sensitivity for CS2 vapors present in air samples and can therefore be very useful in real-life situations that necessitate rapid detection of carbon disulfide vapors. The IMS instrument must of course be evaluated in real-life scenarios too, and this field evaluation could be the object of future studies. In conclusion, portable IMS instrumentation proves to be an invaluable tool in quickly detecting traces of CS2 as a toxic industrial chemical and in protecting the health of workers.
Validation
The suitability of the developed analytical method to its purpose was evaluated by using a simplified validation process, in which a set of parameters were assessed—limit of detection, limit of quantitation, linear range, sensitivity, accuracy, and trueness.
Limit of detection (LOD) is defined as being the lowest concentration that produces a signal-to-noise (S/N) ratio equal to 3, while limit of quantitation (LOQ) is defined as the lowest concentration that generates an S/N ratio equal to 10. The background signal—which is defined as the standard deviation of the background noise—was obtained by using the first 400 data points (IMS ionic currents for the time interval from 1.00 to 5.00 milliseconds, in increments of 0.01 millisecond) for every IMS spectrum; the resulting average value was s = 0.124 pA. Sensitivity (S) is defined as the increase in signal Y (in this case, peak height) with augmentation in concentration (S = ΔY/ΔC). Table 6 presents all these relevant figures of merit related to CS2 detection.
Precision was assessed by doing the analyses in triplicate (see Table 4). Accuracy was estimated by using the relative standard deviation (RSD), which was between 3.5% and 6.7% for the product ion peak generated by carbon disulfide, in the negative ion mode. A good repeatability of the results was noticed, since the RSD < 10%.
Traceability to a certified reference material (CRM), based on the standard of 10 ppmv i-butylene in air, used for calibrating the PID instrument, was realized. We re-emphasize again that the PID instrument has been used to verify all CS2 concentrations when those atmospheres were simultaneously interrogated using the IMS instrument. Consequently, the use of this CRM is supporting the trueness of the experimental results.
Future research directions that may be approached are investigations of CS2 using different types of ion mobility spectrometers, such as aspiration IMS instruments (a-IMS) or differential mobility spectrometers (DMS).
5. Conclusions
The successful detection and quantification of toxic industrial CS2, using time-of-flight IMS, are described here for the first time. Carbon disulfide was determined in the negative ion mode. Simple spectra with just one product ion peak were obtained. Reduced ion mobility for CS2 was found to be K0 = 2.25 cm2 V−1 s−1. Measurement of CS2 at 0.1 ppmv was realized, and an LOD of ca. 0.03 ppmv was estimated. Saturation is thought to appear at concentration levels above 20 ppmv CS2.
Supplementary Materials
The following are available online at https://0-www-mdpi-com.brum.beds.ac.uk/2305-6304/8/4/121/s1, Table S1: The effect of prolonged exposure at CS2 in humans.
Author Contributions
Conceptualization V.B.-B. and I.A.R.; software V.B.-B.; validation, V.B.-B. and I.A.R.; formal analysis V.B.-B. and I.A.R.; investigation V.B.-B.; resources V.B.-B.; data curation V.B.-B.; writing—original draft preparation I.A.R. and V.B.-B.; writing—review and editing V.B.-B. and I.A.R.; visualization, I.A.R.; supervision V.B.-B.; project administration V.B.-B.; funding acquisition, V.B.-B. and I.A.R. All authors have read and agreed to the published version of the manuscript.
Funding
Financial support for the open-access publication of this paper has been provided by Babeș-Bolyai University of Cluj-Napoca through Grants AGC30336/31.01.2020, AGC30337/31.01.2020 and AGC32362/22.06.2020.
Acknowledgments
Technical support provided by the company I.U.T. mbH Berlin, is gratefully acknowledged.
Conflicts of Interest
The authors declare no conflict of interest. The funder had no role in the design of the study; in the collection, analyses, or interpretation of data; in the writing of the manuscript, or in the decision to publish the results.
References
- Eiceman, G.; Karpas, Z. Ion. Mobility Spectrometry, 2nd ed.; Raton, B., Ed.; Taylor & Francis: Boca Raton, FL, USA, 2013; ISBN 0824758536. [Google Scholar]
- Bocos-Bintintan, V. Modern Techniques in Ultra-Trace Analysis, with Impact in Industrial Hygiene, Environmental Protection and Security Applications; Cluj University Press: Cluj Napoca, Romania, 2004. [Google Scholar]
- Ratiu, I.A.; Ligor, T.; Bocos-Bintintan, V.; Buszewski, B. Mass spectrometric techniques for the analysis of volatile organic compounds emitted from bacteria. Bioanalysis 2017, 9, 1069–1092. [Google Scholar] [CrossRef] [PubMed]
- Ratiu, I.A.; Bocos-Bintintan, V.; Monedeiro, F.; Milanowski, M.; Ligor, T.; Buszewski, B. An Optimistic Vision of Future: Diagnosis of Bacterial Infections by Sensing Their Associated Volatile Organic Compounds. Crit. Rev. Anal. Chem. 2019, 50, 501–512. [Google Scholar] [CrossRef] [PubMed]
- Du, Z.; Sun, T.; Zhao, J.; Wang, D.; Zhang, Z.; Yu, W. Development of a plug-type IMS-MS instrument and its applications in resolving problems existing in in-situ detection of illicit drugs and explosives by IMS. Talanta 2018, 184, 65–72. [Google Scholar] [CrossRef] [PubMed]
- Giannoukos, S.; Brkić, B.; Taylor, S.; Marshall, A.; Verbeck, G.F. Chemical Sniffing Instrumentation for Security Applications. Chem. Rev. 2016, 116, 8146–8172. [Google Scholar] [CrossRef]
- Ghira, G.B.; Raţiu, I.A.; Bocoş-Binţinţan, V. Fast characterization of pyridine using ion mobility spectrometry and photoionization detection. Environ. Eng. Manag. J. 2013, 12, 251–256. [Google Scholar]
- Bocos-Bintintan, V.; Ghira, G.B.; Anton, M.; Martiniuc, A.V.; Ratiu, I.A. Sensing precursors of illegal drugs—Rapid detection of acetic anhydride vapors at trace levels using photoionization detection and ion mobility spectrometry. Molecules 2020, 25, 1852. [Google Scholar] [CrossRef] [Green Version]
- Bocos-Bintintan, V.; Brittain, A.; Thomas, C.L.P. The response of a membrane inlet ion mobility spectrometer to chlorine and the effect of water contamination of the drying media on ion mobility spectrometric responses to chlorine. Analyst 2001, 126, 1539–1544. [Google Scholar] [CrossRef]
- Bocos-Bintintan, V.; Brittain, A.; Thomas, C.L.P. Characterisation of the phosgene response of a membrane inlet 63Ni ion mobility spectrometer. Analyst 2002, 127, 1211–1217. [Google Scholar] [CrossRef]
- Bocos-Bintintan, V.; Thomas, C.L.P.; Ratiu, I.A. Sensors’ array of aspiration ion mobility spectrometer as a tool for bacteria discrimination. Talanta 2020, 206, 120233. [Google Scholar] [CrossRef]
- Ratiu, I.A.; Bocos-Bintintan, V.; Patrut, A.; Moll, V.H.; Turner, M.; Thomas, C.L.P. Discrimination of bacteria by rapid sensing their metabolic volatiles using an aspiration-type ion mobility spectrometer (a-IMS) and gas chromatography-mass spectrometry GC-MS. Anal. Chim. Acta 2017, 982, 209–217. [Google Scholar] [CrossRef]
- Pietrzak, D.; Bieliński, D.M. Application of multi-capillary column-ion mobility spectrometry (MCC-IMS) in rubber chemistry and technology. Int. J. Ion Mobil. Spectrom. 2018, 21, 1–9. [Google Scholar] [CrossRef] [Green Version]
- Moll, V.; Bocoş-Binţinţan, V.; Raţiu, I.A.; Ruszkiewicz, D.; Thomas, C.L.P. Control of dopants/modifiers in differential mobility spectrometry using a piezoelectric injector. Analyst 2012, 137, 1458–1465. [Google Scholar] [CrossRef] [PubMed] [Green Version]
- Demartino, A.W.; Zigler, D.F.; Fukuto, J.M.; Ford, P.C. Carbon disulfide. Just toxic or also bioregulatory and/or therapeutic? Chem. Soc. Rev. 2017, 46, 21–39. [Google Scholar] [CrossRef] [PubMed] [Green Version]
- Elliott, S. The Solubility of Carbon Disulfide vapor in natural aqueous systems. Atmos. Environ. 1989, 23, 1977–1980. [Google Scholar] [CrossRef]
- WHO. Concise International Chemical Assessment Document (CICAD) 46: Carbon Disulfide; World Health Organization, United Nations Environment Program, International Labor Organization; WHO: Geneva, Switzerland, 2002. [Google Scholar]
- Rhodes, C.; Riddel, S.A.; West, J.; Williams, B.P.; Hutchings, G.J. Low-temperature hydrolysis of carbonyl sulfide and carbon disulfide: A review. Catal. Today 2000, 59, 443–464. [Google Scholar] [CrossRef]
- Delpech, A. Note sur les accidents que de’velope, chez les ouvriers en caoutchouc, l’inhalation du sulfure de carbone en vapeur. Acad. Imp. Med. 1856, 21, 350. [Google Scholar]
- Gelbke, H.P.; Göen, T.; Mäurer, M.; Sulsky, S.I. A review of health effects of carbon disulfide in viscose industry and a proposal for an occupational exposure limit. Crit. Rev. Toxicol. 2009, 39, 1–126. [Google Scholar] [CrossRef]
- Sieja, K.; von Mach-Szczypiński, J.; von Mach-Szczypiński, J. Health effect of chronic exposure to carbon disulfide (CS2) on women employed in viscose industry. Med. Pr. 2018, 69, 317–323. [Google Scholar] [CrossRef]
- U.S. Department Of Health And Human Service Public Health Service Agency for Toxic Substances and Disease Registry. Toxicological Profile for Carbon Disulfide; ATSDR: Atlanta, GA, USA, 1996.
- Huang, C.C. Carbon Disulfide Neurotoxicity: Taiwan Experience. Acta Neurol. Taiwanica 2004, 13, 3–9. [Google Scholar] [CrossRef]
- Tolonen, M. Vascular effects of carbon disulfide: A review. Scand. J. Work Environ. Health 1976, 1, 63–77. [Google Scholar] [CrossRef]
- Vanhoorne, M.; DeBacquer, D.; Barbiere, F. Epidemiological study of gastrointestinal and liver effects of carbon disulfide. Int. Arch. Occup. Environ. Health 1992, 63, 517–523. [Google Scholar] [CrossRef] [PubMed]
- OSHA Table Ac-1 Permissible Exposure Limits for Chemical Contaminants. Available online: https://www.dir.ca.gov/title8/ac1.pdf (accessed on 12 October 2020).
- Department Of Health And Human Service, Centers for Disease Control and Prevention National Institute for Occupational Safety and Health. Available online: https://www.cdc.gov/niosh/docs/2005-149/pdfs/2005-149.pdf (accessed on 12 October 2020).
- National Center for Biotechnology Information. PubChem Compound Summary for CID 6348, Carbon Disulfide; National Institute of Health: Bethesda, MD, USA. Available online: https://pubchem.ncbi.nlm.nih.gov/compound/6348 (accessed on 10 November 2020).
- Mametov, R.; Ratiu, I.A.; Monedeiro, F.; Ligor, T.; Buszewski, B. Evolution and Evaluation of GC Columns. Crit. Rev. Anal. Chem. 2019, 1–24. [Google Scholar] [CrossRef] [PubMed]
- Al-Suod, H.; Ratiu, I.A.; Ligor, M.; Ligor, T.; Buszewski, B. Determination of sugars and cyclitols isolated from various morphological parts of Medicago sativa L. J. Sep. Sci. 2018, 41, 1118–1128. [Google Scholar] [CrossRef] [PubMed]
- Buszewski, B.; Raiu, I.A.; Milanowski, M.; Pomastowski, P.; Ligor, T. The effect of biosilver nanoparticles on different bacterial strains’ metabolism reflected in their VOCs profiles. J. Breath Res. 2018, 12, 027105. [Google Scholar] [CrossRef] [Green Version]
- Ratiu, I.A.; Bocos Bintintan, V.; Turner, M.; Moll, V.H.; Thomas, P. Discrimination of chemical profiles of some bacterial species by analysing culture headspace air samples using TD-GC/MS. Curr. Anal. Chem. 2014, 10, 488–497. [Google Scholar] [CrossRef]
- Ratiu, I.A.; Ligor, T.; Bocos-Bintintan, V.; Szeliga, J.; MacHała, K.; Jackowski, M.; Buszewski, B. GC-MS application in determination of volatile profiles emitted by infected and uninfected human tissue. J. Breath Res. 2019, 13, 026003. [Google Scholar] [CrossRef]
- Ratiu, I.A.; Al-Suod, H.; Ligor, M.; Ligor, T.; Railean-Plugaru, V.; Buszewski, B. Complex investigation of extraction techniques applied for cyclitols and sugars isolation from different species of Solidago genus. Electrophoresis 2018, 39, 1966–1974. [Google Scholar] [CrossRef]
- Phillips, M. Detection of carbon disulfide in breath and air: A possible new risk factor for coronary artery disease. Int. Arch. Occup. Environ. Health 1992, 64, 119–123. [Google Scholar] [CrossRef]
- Campbell, L.; Jones, A.H.; Wilson, H.K. Evaluation of occupational exposure to carbon disulphide by blood, exhaled air, and urine analysis. Am. J. Ind. Med. 1985, 8, 143–153. [Google Scholar] [CrossRef]
- Spanjers, C. Sub 1 mg/kg (1 ppm) Detection of Carbon Disulfide with the Polyarc System Application Note; Activated Research Company, LLC: Eden Prairie, MN, USA, 2017; pp. 1–3. [Google Scholar]
- Pitschmann, V.; Kobliha, Z.; Tušarová, I. Spectrophotometric determination of carbon disulphide in the workplace air. J. Chem. 2013, 2013. [Google Scholar] [CrossRef]
- Riihimäki, V.; Kivistö, H.; Peltonen, K.; Helpiö, E.; Aitio, A. Assessment of exposure to carbon disulfide in viscose production workers from urinary 2-thiothiazolidine-4-carboxylic acid determinations. Am. J. Ind. Med. 1992, 22, 85–97. [Google Scholar] [CrossRef] [PubMed]
- Krstev, S.; Perunicić, B.; Farkić, B.; Varagić, M. Environmental and biological monitoring in carbon disulfide exposure assessment. Med. Lav. 1993, 84, 473–481. [Google Scholar]
- Chu, C.C.; Huang, C.C.; Chen, R.S.; Shih, T.S. Polyneuropathy induced by carbon disulphide in viscose rayon workers. Occup. Environ. Med. 1995, 52, 404–407. [Google Scholar] [CrossRef] [PubMed]
- Kuo, H.W.; Lai, J.S.; Lin, M.; Su, E.S. Effects of exposure to carbon disulfide (CS2) on electrocardiographic features of ischemic heart disease among viscose rayon factory workers. Int. Arch. Occup. Environ. Health 1997, 70, 61–66. [Google Scholar] [CrossRef] [PubMed]
- Kuligowski, D. The influence of chronic exposure to carbon disulfide on metabolism of catecholamines and serotonin in women. Ann. Acad. Med. Stetin. 1996, 42, 139–156. [Google Scholar] [PubMed]
- Yang, X.F.; Lee, B.L.; New, A.L.; Ong, H.Y.; Ma, L.; Zhang, Q.; Ong, C.N. Urinary homovanillic acid and vanillylmandelic acid in workers exposed to carbon disulfide. Am. J. Ind. Med. 1996, 29, 269–274. [Google Scholar] [CrossRef]
- Reinhardt, F.; Drexler, H.; Bickel, A.; Claus, D.; Ulm, K.; Angerer, J.; Lehnert, G.; Neundörfer, B. Electrophysiological investigation of central, peripheral and autonomic nerve function in workers with long-term low-level exposure to carbon disulphide in the viscose industry. Int. Arch. Occup. Environ. Health 1997, 70, 249–256. [Google Scholar] [CrossRef]
- Vanhoorne, M.; Van Den Berge, L.; Devreese, A.; Tijtgat, E.; Van Poucke, L.; Van Peteghem, C. Survey of chemical exposures in a viscose rayon plant. Ann. Occup. Hyg. 1991, 35, 619–631. [Google Scholar] [CrossRef]
- De Fruyt, F.; Thiery, E.; De Bacquer, D.; Vanhoorne, M. Neuropsychological effects of occupational exposures to carbon disulfide and hydrogen sulfide. Int. J. Occup. Environ. Health 1998, 4, 139–146. [Google Scholar] [CrossRef]
- Guidotti, T.L.; Hoffman, H. Indicators of cardiovascular risk among workers exposed to high intermittent levels of carbon disulphide. Occup. Med. (Chic. ILL) 1999, 49, 507–515. [Google Scholar] [CrossRef] [Green Version]
- Bocos-Bintintan, V.; Smolenschi, A.; Ratiu, I.-A. Rapid Determination of Indoor Air Contaminants in Shoe Shops using Photoionization Detectors. Stud. Univ. Babes-Bolyai Chem. 2016, 61, 203–212. [Google Scholar]
- Bocos-Bintintan, V.; Ratiu, I.A.; Al-Suod, H. Real time monitoring of soil contamination with diesel fuel using photoionization detectors. Arab J. Basic Appl. Sci. 2019, 26, 446–452. [Google Scholar] [CrossRef] [Green Version]
- Moll, V.H.; Bocoş-Binţinţan, V.; Chappell, J.; Hutt, D.; Raţiu, I.A.; Thomas, C.L.P. Optimisation of piezoelectric injection of dopants and drift gas modifiers in transverse ion mobility spectrometry. Int. J. Ion Mobil. Spectrom. 2010, 13, 149–155. [Google Scholar] [CrossRef]
Figure 1.
Schematic of the instrumentation used for the experiments. Part A: IMS, where (A1)—photo of IMS; (A2)—IMS cell and operating principle; (A3)—typical IMS response. Part B: PID ppbRAE Plus, where (B1)—photo of PID; (B2)—component parts of the PID system; (B3)—photoionization principle.
Figure 1.
Schematic of the instrumentation used for the experiments. Part A: IMS, where (A1)—photo of IMS; (A2)—IMS cell and operating principle; (A3)—typical IMS response. Part B: PID ppbRAE Plus, where (B1)—photo of PID; (B2)—component parts of the PID system; (B3)—photoionization principle.

Figure 2.
Schematic of the dynamic system used for the sampling.

Figure 3.
Evolution of the CS2 exponential dilution gathered with PID, as well as the sampling points used for the IMS measurements.
Figure 3.
Evolution of the CS2 exponential dilution gathered with PID, as well as the sampling points used for the IMS measurements.

Figure 4.
The ion mobility spectrometric response for CS2, obtained in the negative mode. Note: Although all spectra were collected from 1 to 20 ms, for the sake of clarity only the useful part of these spectra is presented—namely, the temporal interval, from 4 to 8 ms, which included all peaks.
Figure 4.
The ion mobility spectrometric response for CS2, obtained in the negative mode. Note: Although all spectra were collected from 1 to 20 ms, for the sake of clarity only the useful part of these spectra is presented—namely, the temporal interval, from 4 to 8 ms, which included all peaks.

Figure 5.
Calibration graphs for CS2 in the negative ion mode, normalized for the background air; the peak height of the single-product ion peak is plotted.
Figure 5.
Calibration graphs for CS2 in the negative ion mode, normalized for the background air; the peak height of the single-product ion peak is plotted.


| Substance Name and Formula | Properties | Observations |
|---|---|---|
| Carbon disulfide CS2 (S=C=S) CAS#: 75-15-0 EC#: 200-843-6 | Molecular mass: 76.15 g mol−1 Boiling point: 46.2 °C Melting point: −111.61 °C Density: 1.263 g cm−3 @ 20 °C Refractive index: 1.6319 @ 20 °C Flash point: −30 °C Auto-ignition temperature: 90 °C Relative density of vapors: 2.67 (air = 1) Vapor pressure: 360 mm Hg @ 25 °C Relative evaporation rate: 22.6 (Butyl acetate = 1) Ionization energy: 10.08 eV Vaporization enthalpy: 84.1 cal g−1 Octanol-water coefficient (log Kow): 1.94 Solubility: water solubility: 2.1 g L−1; Soluble in: ethanol, benzene, ether, chloroform Explosive limits: 1% vol. LEL; 50% vol. UEL | Risks: flammable in both liquid and vapors forms; causes serious skin and eyes irritation; affects fertility and is a teratogenic agent in case of repeated or prolonged exposure. Reactivity: very flammable; stable in storage; upon heating it decomposes to form toxic sulfur oxides; may explode on heating, shock or friction. Conversion: 1 ppmv = 3.16 mg m−3 (20 °C) |
Table 2.
Emitted concentrations of CS2 as a result of rayon fiber production.
| Country | Point of Measurement in Viscose Factory | Recorded Concentration (mg m−3) | Reference | |
|---|---|---|---|---|
| 8-h TWA | Range | |||
| Finland | viscose rayon fiber factory | 9.4 | 4.7–25 | [39] |
| viscose sheeting production | 13 | 0.6–28 | ||
| Yugoslavia | in the spinning rooms | 63 | [40] | |
| manufacturing departments | 19 | |||
| Taiwan | in the cutting areas | 125–210 | 470–940 | [41] |
| in the spinning areas | 47–310 | |||
| in the ripening area | 170 | [42] | ||
| filament spinning | 61 | |||
| Poland | synthetic fibers factory | 9.4–23 | [43] | |
| Singapore | in a rayon factory | 8.4–63 | [44] | |
| Germany | in viscose rayon factory | 0.6–210 | [45] | |
| Belgium | centrifuge operator | 3.1 | [46] | |
| in the spinning areas | 150 | |||
| Bulgaria | viscose rayon production facility | 9.4–63 | [47] | |
| Canada | chemical company | 310–630 | [48] | |
| Czechoslovakia | viscose rayon factories | 30.4–152 | [22] | |
Table 3.
Summary of the quantitative results obtained from both the PID detector and the IMS instrument in the negative ion mode, respectively (three replicates were used for peak height, in order to calculate the standard deviation).
Table 3.
Summary of the quantitative results obtained from both the PID detector and the IMS instrument in the negative ion mode, respectively (three replicates were used for peak height, in order to calculate the standard deviation).
| CCS2—Measured with PID | IMS Data—Negative Ion Mode | |
|---|---|---|
| Drift Time td (ms) | Peak Height hmax (pA) | |
| 0 ppbv | NEG RIP 5.68 | 98.0 ± 4.2 |
| 0.10 ppmv | PIP 5.38 | 3.0 ± 0.2 |
| 0.25 ppmv | PIP 5.38 | 7.5 ± 0.4 |
| 0.60 ppmv | PIP 5.38 | 13.0 ± 0.8 |
| 1.00 ppmv | PIP 5.38 | 18.5 ± 1.1 |
| 1.70 ppmv | PIP 5.38 | 25.0 ± 1.3 |
| 3.00 ppmv | PIP 5.38 | 37.8 ± 1.6 |
| 6.00 ppmv | PIP 5.38 | 47.0 ± 1.9 |
| 15.00 ppmv | PIP 5.38 | 68.0 ± 2.4 |
Table 4.
Reduced ionic mobilities, K0, calculated for both the reactant ions and for the ions produced by CS2.
Table 4.
Reduced ionic mobilities, K0, calculated for both the reactant ions and for the ions produced by CS2.
| Operation Mode | Ion Drift Time, td (ms) | Drift Speed, vd = ld/td (m s−1) | Ion Mobility, K (cm2 V−1 s−1) | Reduced Ion Mobility 1, K0 (cm2 V−1 s−1) |
|---|---|---|---|---|
| Negative | RIP: 5.68 | 9.68 | 2.421 | 2.130 |
| PIP: 5.38 | 10.22 | 2.556 | 2.249 |
1—Experimental conditions were ld = 5.5 cm; E = ca. 400 V cm−1; P = 1003 mbar; T = 50 °C. Therefore: K = vd/E and K0 = (1/td) × (5.5⋅1003⋅293.15⋅103)/(400⋅1013.25⋅323.15) = 12.10/td.
Table 5.
Resolution of the Mini IMS for CS2.
| Ion Drift Time, td (ms) | Peak Width Al Half Maximum, Δtd (ms) | Resolution, RIMS |
|---|---|---|
| RIP: 5.68 | 0.13 | 43.7 |
| PIP: 5.38 | 0.13 | 41.4 |
Table 6.
Figures of merit related to the IMS detection of CS2 in the negative ion mode.
| Ion Mode | LOD (ppbv) | LOQ (ppbv) | Linear Range (ppbv) | Equation | R2 | S (pA/ppmv) |
|---|---|---|---|---|---|---|
| Negative | 27 | 90 | 90–3000 | Y = 11.462⋅X + 4.763 | 0.978 | 12.6 |
Publisher’s Note: MDPI stays neutral with regard to jurisdictional claims in published maps and institutional affiliations. |
© 2020 by the authors. Licensee MDPI, Basel, Switzerland. This article is an open access article distributed under the terms and conditions of the Creative Commons Attribution (CC BY) license (http://creativecommons.org/licenses/by/4.0/).
Share and Cite
MDPI and ACS Style
Bocos-Bintintan, V.; Ratiu, I.A. Hunting for Toxic Industrial Chemicals: Real-Time Detection of Carbon Disulfide Traces by Means of Ion Mobility Spectrometry. Toxics 2020, 8, 121. https://0-doi-org.brum.beds.ac.uk/10.3390/toxics8040121
AMA Style
Bocos-Bintintan V, Ratiu IA. Hunting for Toxic Industrial Chemicals: Real-Time Detection of Carbon Disulfide Traces by Means of Ion Mobility Spectrometry. Toxics. 2020; 8(4):121. https://0-doi-org.brum.beds.ac.uk/10.3390/toxics8040121
Chicago/Turabian StyleBocos-Bintintan, Victor, and Ileana Andreea Ratiu. 2020. "Hunting for Toxic Industrial Chemicals: Real-Time Detection of Carbon Disulfide Traces by Means of Ion Mobility Spectrometry" Toxics 8, no. 4: 121. https://0-doi-org.brum.beds.ac.uk/10.3390/toxics8040121
Note that from the first issue of 2016, this journal uses article numbers instead of page numbers. See further details here.