Article

Utilization of Tryptophan-like Fluorescence as a Proxy for E. coli Contamination in a Mixed-Land-Use Karst Basin

1
Department of Earth and Environmental Sciences, University of Kentucky, Lexington, KY 40506, USA
2
Kentucky Geological Survey, University of Kentucky, Lexington, KY 40506, USA
3
Department of Civil Engineering, University of Kentucky, Lexington, KY 40506, USA
*
Author to whom correspondence should be addressed.
Submission received: 2 March 2023 / Accepted: 17 March 2023 / Published: 23 March 2023
(This article belongs to the Special Issue Hydro-Geology of Karst Areas)

Abstract

:
Karst aquifers are susceptible to contamination by pathogenic microorganisms, such as those found in human and animal waste, because the surface and subsurface drainage are well integrated through dissolution features. Fecal contamination of water is commonly assessed by the concentration of thermotolerant coliform bacteria, especially E. coli. This method is time-consuming, taking ≥18 h between the start of incubation and subsequent enumeration, as well as the time required to collect and transport samples. We examined the utility of continuous monitoring of tryptophan-like fluorescence (TLF) as a real-time proxy for E. coli in a mixed-land-use karst basin in the Inner Bluegrass region of central Kentucky (USA). Two logging fluorometers were sequentially deployed at the outlet spring. During storm flow, TLF typically peaked after discharge, which suggests that TLF transport in the phreatic conduit is likely related to sediment transport. The ability of TLF and other parameters (48 h antecedent precipitation, turbidity, and air temperature) to predict E. coli concentrations was assessed using the Akaike information criterion (AIC) applied to linear regression models. Because both the models and baseline concentrations of TLF differed between fluorometers, TLF and instrument interaction were accounted for in the AIC. TLF was positively correlated with E. coli and, in conjunction with antecedent precipitation, was the best predictor of E. coli. However, a model that included air temperature and antecedent precipitation but not TLF predicted E. coli concentrations similarly well. Given the expense of the fluorometers and the performance of the alternate model, TLF may not be a cost-effective proxy for E. coli in this karst basin.

1. Introduction

Waterborne illnesses are often caused by enteric microorganisms, which can cause a range of ailments, such as diarrheal diseases in humans. In the USA, 750,000 to 5.9 million illnesses are contracted through groundwater annually, and as many as 50% of wells have some degree of fecal contamination [1]. The pathogenic microorganisms responsible for this contamination can enter the subsurface through a multitude of pathways, such as surface runoff, failing septic systems, overflowing sanitary sewers, and wastewater discharge. Karst aquifers are susceptible to contamination because the surface and subsurface drainage are integrated through dissolution features. The solution-enhanced flow paths allow for groundwater to flow very rapidly (tens to hundreds of meters per hour), which limits the straining and adsorption of particulate matter that occurs in other aquifers [2,3]. Bacteria can be transported in karst conduits and either remain in suspension as planktonic cells or adhere to sediments, where they can remain viable for weeks to months [4,5]. These bacteria can subsequently be remobilized with the resuspension of sediments following storms [6,7].
Thermotolerant coliform bacteria (TTCs), including fecal coliforms (FC) and E. coli, are the commonly accepted indicators of fecal contamination [8]. However, considerable time is required to test for these indicators. Prior to the enumeration of E. coli in the lab, samples must be incubated for ≥18 h, in addition to the time required for collection, transport, and preparation for analysis [9,10]. Therefore, contamination events can only be identified retroactively, after the public may have already been exposed. The sampling frequency is also of concern, as samples are commonly taken on a weekly or monthly basis, and contamination events can be missed entirely.
Given the challenges associated with monitoring TTCs, other parameters have been suggested as real-time proxies. These include turbidity [11,12] and fluorescent-dissolved organic matter (FDOM), particularly tryptophan-like fluorescence (TLF), also known as peak T. This describes the portion of FDOM that is excited at ~280 nm and emits at ~350 nm wavelength, similar to the amino acid tryptophan [13,14]. TLF is intrinsically related to labile organic carbon and microbial activity [15,16,17,18] and is generally associated with aromatic and proteinaceous compounds [19,20]. TLF has been positively correlated with TTC and/or E. coli counts in both groundwater [19,21,22,23,24] and surface water [25,26]. Sorensen et al. [21] concluded that TLF was more effective than other indicators (nitrate, chloride, turbidity, and sanitary risk scores) in predicting the number of TTCs present in a sample. Several studies [20,24,27,28] have found that TLF cannot classify sources containing <10 most-probable number (MPN) or colony-forming units (CFU) of indicator organisms/100 mL but can differentiate intermediate-risk classes from higher-risk classes (>10 MPN or cfu/100 mL).
Relatively few studies have examined TLF as a screening tool for E. coli in karst aquifers [19,22,23,29]. Of these, only Sorensen et al. [22] used field fluorometers for continuous measurements of TLF. To our knowledge, only one study has compared the performance of different field-deployable fluorometers [30], and only one study has examined TLF as a screening tool for E. coli in fresh waters in North America [26].
In this study, TLF was examined as a proxy for fecal contamination in a karst spring in the Inner Bluegrass region of central Kentucky (USA). E. coli concentrations were compared to TLF concentrations measured by two different field fluorometers, as well as several other environmental parameters, to determine the best predictive model of E. coli in the system. This was done to determine whether models that included TLF predicted E. coli significantly better than models without TLF. The relationship of TLF to discharge was also examined.

2. Materials and Methods
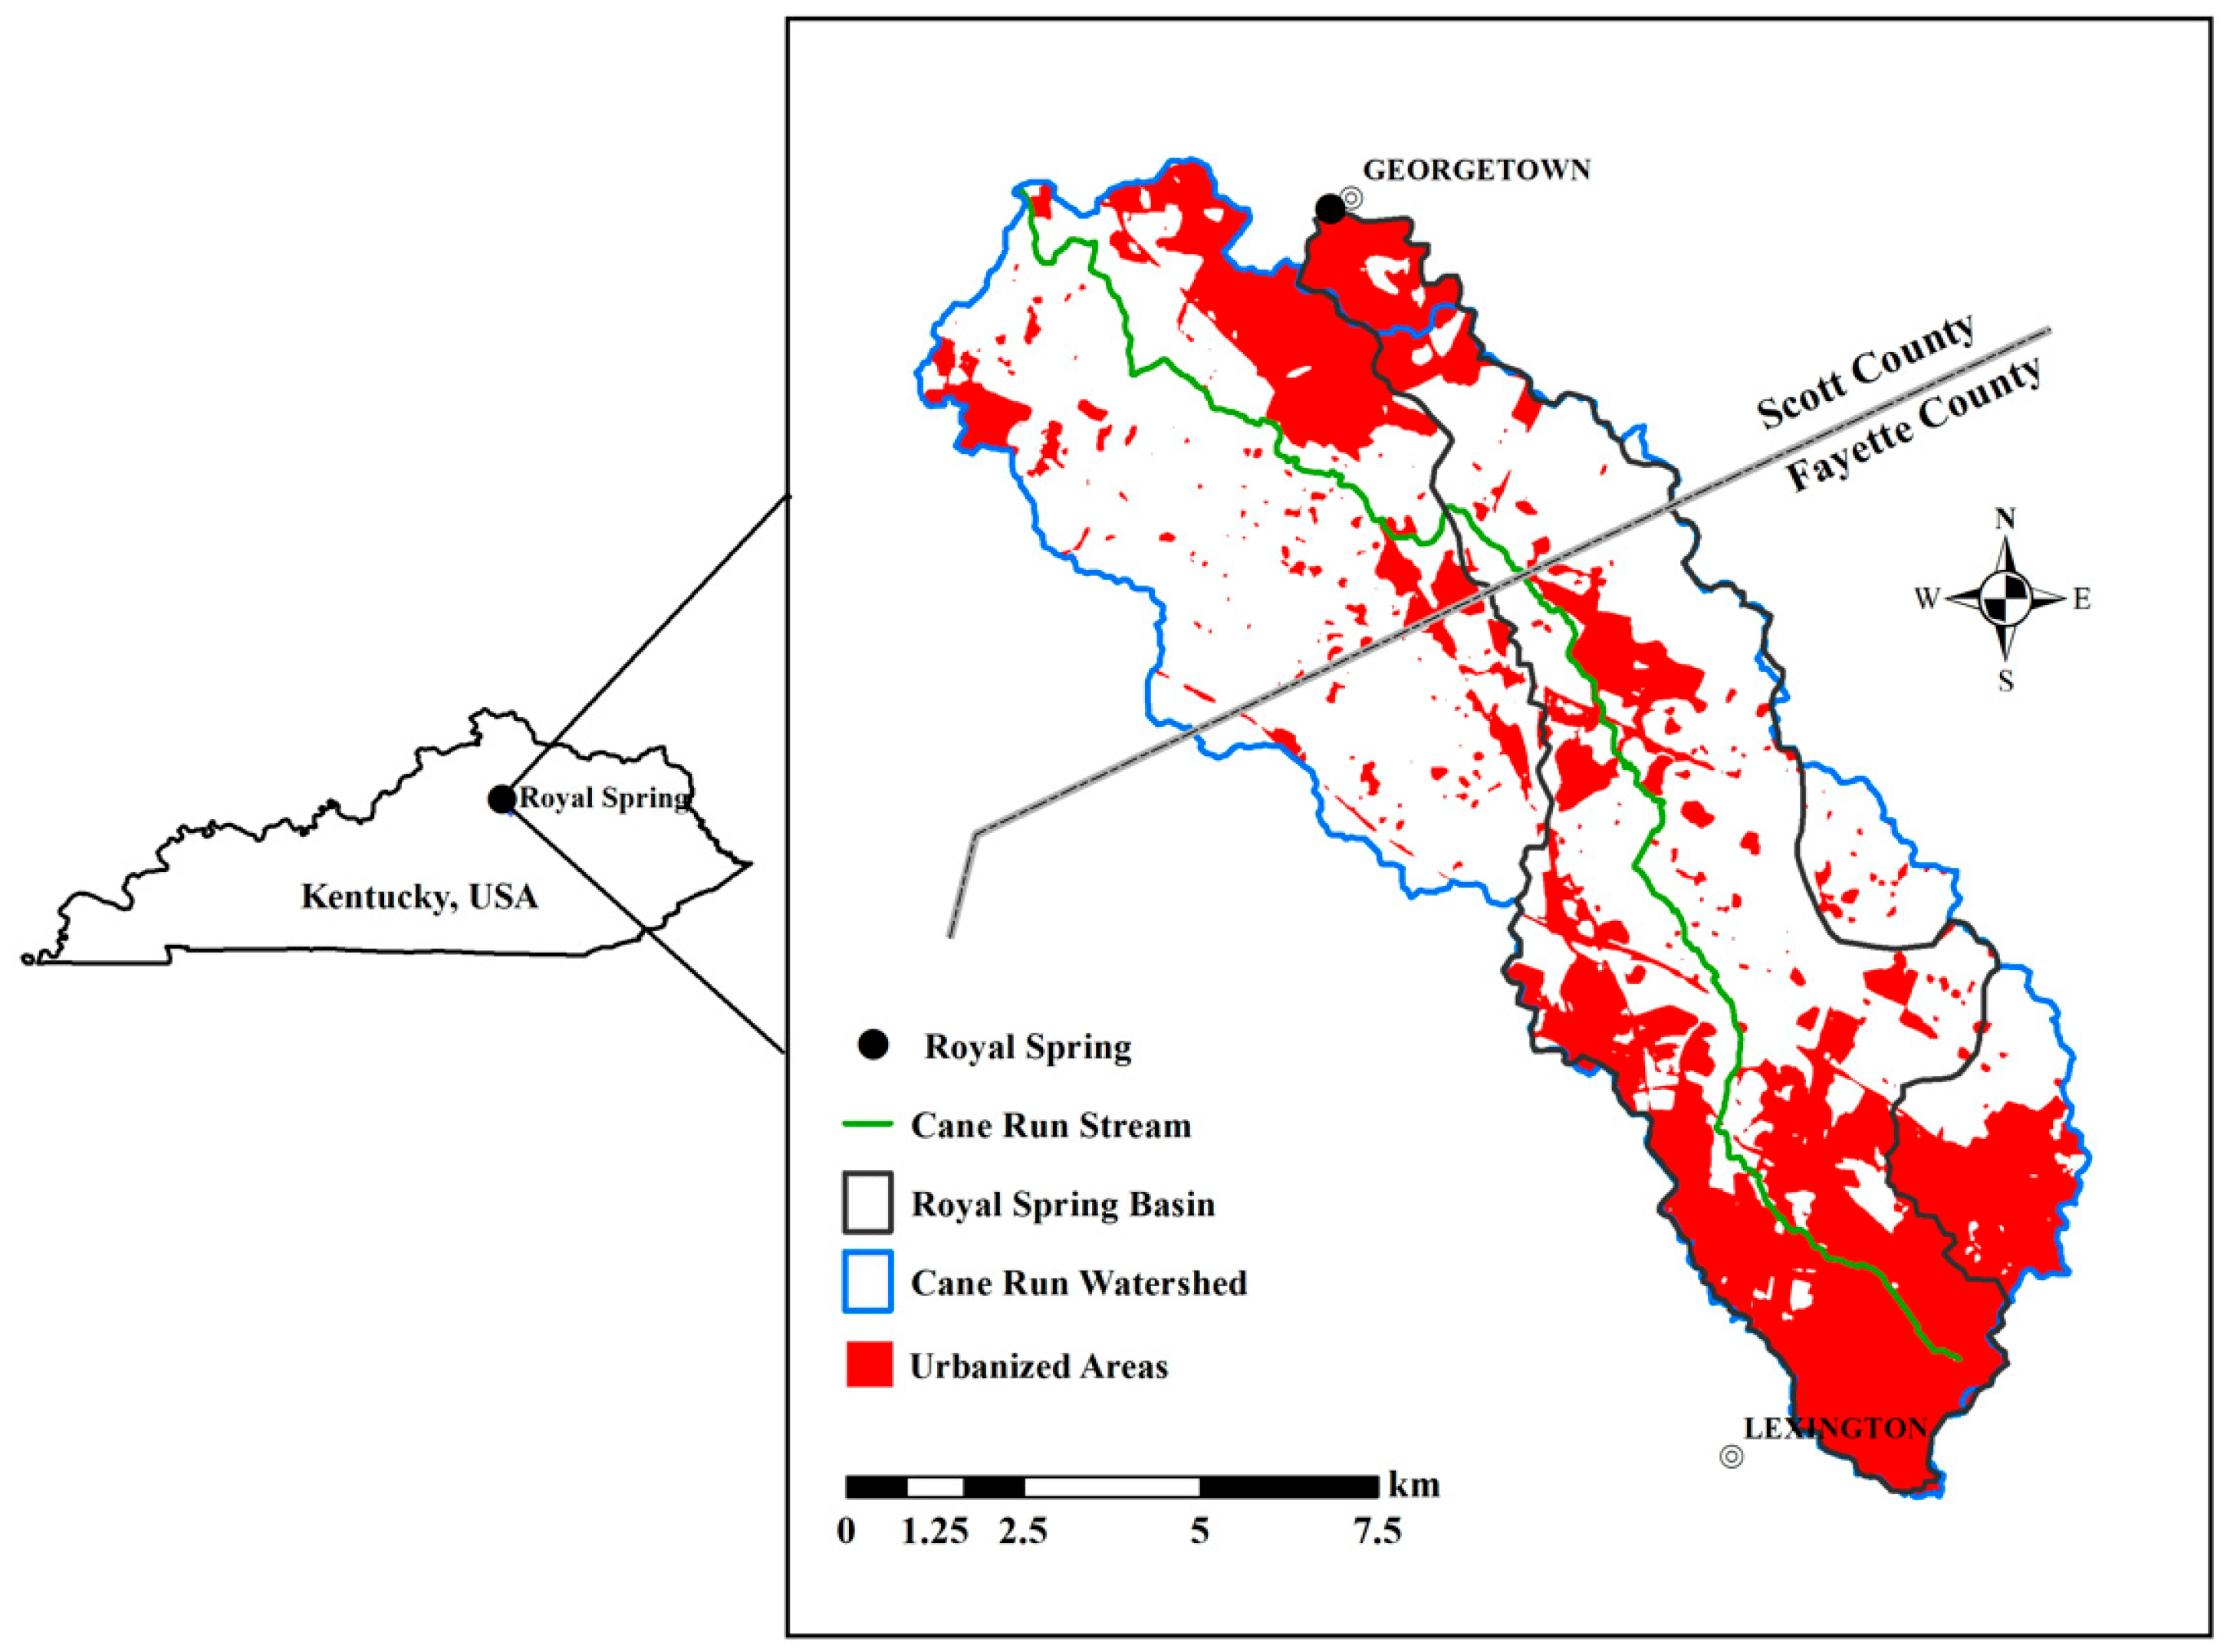
2.1. Study Area

This study was conducted within the Royal Spring karst groundwater basin (58 km2), which overlaps the Cane Run watershed (96 km2) in the Inner Bluegrass region [31] (Figure 1). The Inner Bluegrass region is underlain by the Lexington Limestone, a relatively flat-lying, Upper Ordovician-aged unit that contains interbedded thin shales [32,33]. This unit is underlain by the Tyrone Formation and is below the Clays Ferry Formation and is characterized by well-developed fluviokarst features and significant exchange between surface water and groundwater [34]. Between 2001 and 2020, the average annual temperature at Blue Grass Airport in Lexington (38.0408° N, 84.6058° W; ~19 km from Royal Spring) ranged from 12.5 to 14.8 °C, and average annual precipitation ranged from 851 to 1828 mm/year [35]. The region receives moderate to intense precipitation throughout the year.
Royal Spring (38.2095° N, 84.5618° W) emerges in Georgetown, the largest community in Kentucky that still relies primarily on groundwater for municipal water supply. Georgetown Municipal Water and Sewer Service directly served 33,075 people in 2020 [36]. Royal Spring is recharged by Cane Run, an ephemeral stream, via streambed infiltration [34]. Cane Run has been identified as impaired by fecal contamination that is likely sourced from sewage leaks [37].
Figure 1. Locations of Royal Spring groundwater basin and field sites in this study, modified from [38].
Hydrology 10 00074 g001
The Royal Spring basin is characterized by urbanization in its headwaters, which lie within the Lexington urban service boundary and near its outlet in Georgetown (Figure 1). Grazing and agricultural land account for much of the basin’s land use, with horse farms accounting for roughly 60% of the basin’s area. The watershed is heavily impacted by FC, eroded sediment, and nutrients (particularly phosphorus). Pollutants present in the watershed are sourced from class V injection wells [39], sanitary sewer overflows, failing sewer lines and septic tanks, straight pipes and other unpermitted discharges, livestock raising and other agricultural activities, waste from wild and domestic animals, lawn fertilizers, and urban and agricultural erosion [40]. Numerous dye traces and geophysical investigations have aided in understanding the physical structure of the karst basin as well as the geometry of the phreatic conduit feeding the spring [41,42,43,44]. Subsequent studies have also aided in understanding how sediment and bacteria can be remobilized in the phreatic conduit during periods of increased discharge [38,45].

2.2. Data Collection and Processing

Two in situ fluorometers manufactured by Turner Designs (Sunnyvale, CA, USA) were deployed for continuous monitoring: a Cyclops 7F outfitted with tryptophan optics and a C3 with optics for tryptophan, colored DOM (CDOM, which includes FDOM), and fluorescein dye. The Cyclops 7F was attached to a logger made by Precision Measurement Engineering (Vista, CA, USA) and calibrated following manufacturer instructions using a 2000 ppb tryptophan solution [46]. The C3 was calibrated following manufacturer protocol using a 5000-ppb tryptophan solution [47]. Each fluorometer was secured to a catwalk at Royal Spring, and the optics were cleaned every 1–4 weeks when the fluorometer was accessed during weekly sampling and when weather was conducive. Logging occurred at 15 min intervals. The 7F was deployed at Royal Spring from 4 August to 22 December 2021, and the C3 from 11 March through 22 June 2022.

2.3. Manual Monitoring and Laboratory Analyses

Manual monitoring was conducted weekly from 9 June 2021 to 22 June 2022, except for the week of 29 December 2021. Water temperature was recorded using a YSI meter (Xylem, Yellow Springs, OH, USA) at the time of sampling. In addition to weekly sampling events, a storm event was chosen for high-resolution sampling at Royal Spring from 19:00 on 5 May 2022 to 21:00 on 6 May 2022. Grab samples for IDEXX analysis were collected hourly throughout the duration of the event and processed <8 h after collection. For both the normal weekly sampling events and the storm event, grab samples were collected in autoclaved 1 L polypropylene bottles and stored on ice in a cooler. Upon returning to the laboratory, samples were prepared for E. coli enumeration by application of Colilert reagent and sealing of Quantitrays < 8 h after collection of the first sample [10]. The prepared samples were then incubated for 24–28 h at 35 °C and examined under a UV lamp to quantify E. coli. Blanks were collected approximately monthly or whenever there was suspicion of possible contamination during transport and were always ≤1 MPN/100 mL. On 11 August and 18 August 2021, E. coli values were beyond the readable range (>2419.6 MPN/100 mL). To avoid this problem, subsequent samples were diluted prior to analysis.

2.4. Data Sources and Treatment

Average daily air temperature and hourly precipitation data were taken from Blue Grass Airport [35]. Because antecedent precipitation is often correlated to E. coli in karst systems [48,49], precipitation totals were calculated for 48, 96, and 168 h preceding each sample. Missing values, which accounted for only ~1% of the precipitation dataset (12 values), were replaced by linear interpolation of the data points before and after the missing value. Of the 62 sampling events (including the samples taken during storm monitoring), 35, 52, and 60 were within 48, 96, and 168 h of discernible precipitation, respectively.
To relate TLF to E. coli, two logged data points were used, one directly before the E. coli sample was taken and one directly after, except as follows. On 4 August 2021, when the fluorometer was initially deployed, two measurements were taken after deployment. On 25 August, while the fluorometer was out of the water for cleaning, it recorded a TLF value, which was discarded. On 8 December, when the fluorometer was not submerged due to low water level at Royal Spring, the first two data points were recorded after the fluorometer was returned to the water. On 16 March and 30 March 2022, the fluorometer did not stabilize following redeployment until after the first reading. In this instance, the average of the TLF reading before the fluorometer was removed and the second reading after redeployment was taken to determine the TLF value. When a sample time coincided with a fluorometer reading, the average of the TLF value at that time and the values directly before and after were recorded. The mean TLF value was compared to the corresponding E. coli concentration for the same date. TLF values less than the minimum detection limit (3 ppb) were assumed equal to 3 ppb. E. coli concentrations less than the minimum detection limit (1 MPN/100 mL) or greater than the maximum detection limit (2419.6 MPN/100 mL for undiluted samples) were assumed equal to those respective limits.
Turbidity values were logged at 15 min intervals using a YSI EXO 3 multiparameter sonde (Xylem, Yellow Springs, OH, USA). The average of values directly before and after sample collection was used for comparison with E. coli. When the sampling time coincided with a turbidity measurement, the value at that time and the measurements before and after were averaged. In the case of missing data, the last turbidity measurement before the missing data period began and the first turbidity measurement after it ended were averaged.
Discharge measurements were recorded at 5 min intervals at the U.S. Geological Survey stream gauge at Royal Spring [50]; missing discharge values were linearly interpolated. For examining the relationship between discharge and TLF, discharge peaks were selected when discharge increased by a factor of 2.5 within 72 h and achieved a maximum value > 20 cfs (cubic feet per second; 570 L/s). This criterion for peak selection was determined by observing periods when TLF increased with discharge. Some smaller discharge peaks were visually apparent, but many of these smaller peaks lacked associated TLF peaks or were too close temporally to determine which peaks were associated. In the event of sustained discharge at the same level for 30 min or longer, the timestamp in the middle of the peak was recorded.

2.5. Statistical Analysis

A Pearson’s product–moment correlation test was used to determine correlations between TLF measured by each fluorometer and E. coli and between turbidity and E. coli. Linear regression models were created with E. coli as the response variable and with TLF, turbidity, 48 h antecedent rainfall, and air temperature as explanatory variables (Table 1). The interaction effect between the instrument and TLF values was used as an additional explanatory variable. From these models, the best-fit model was determined using the Akaike information criterion (AIC), which has been successfully used in studies involving water in karst media [51,52]. The AIC approach assigns a weight to how well each model fits the data while avoiding overfitting or underfitting by penalizing models that include extra predictive parameters [53]. The parameters used to predict E. coli were TLF alone, TLF and the instrument used to record it (as an interaction variable), 48 h antecedent precipitation, turbidity, and air temperature. Discharge values were not considered in the AIC because gauge data at Royal Spring display peaks and troughs resulting from pumping by the municipal water treatment plant [38]. Water temperature was not considered because pathogenic E. coli is not likely to exhibit primary growth in spring environments with relatively cool temperatures and low nutrient availability [54], and air temperature provides a better measure of seasonality. Analysis was conducted using the MuMIn package in R version 4.1.2 [55].

3. Results

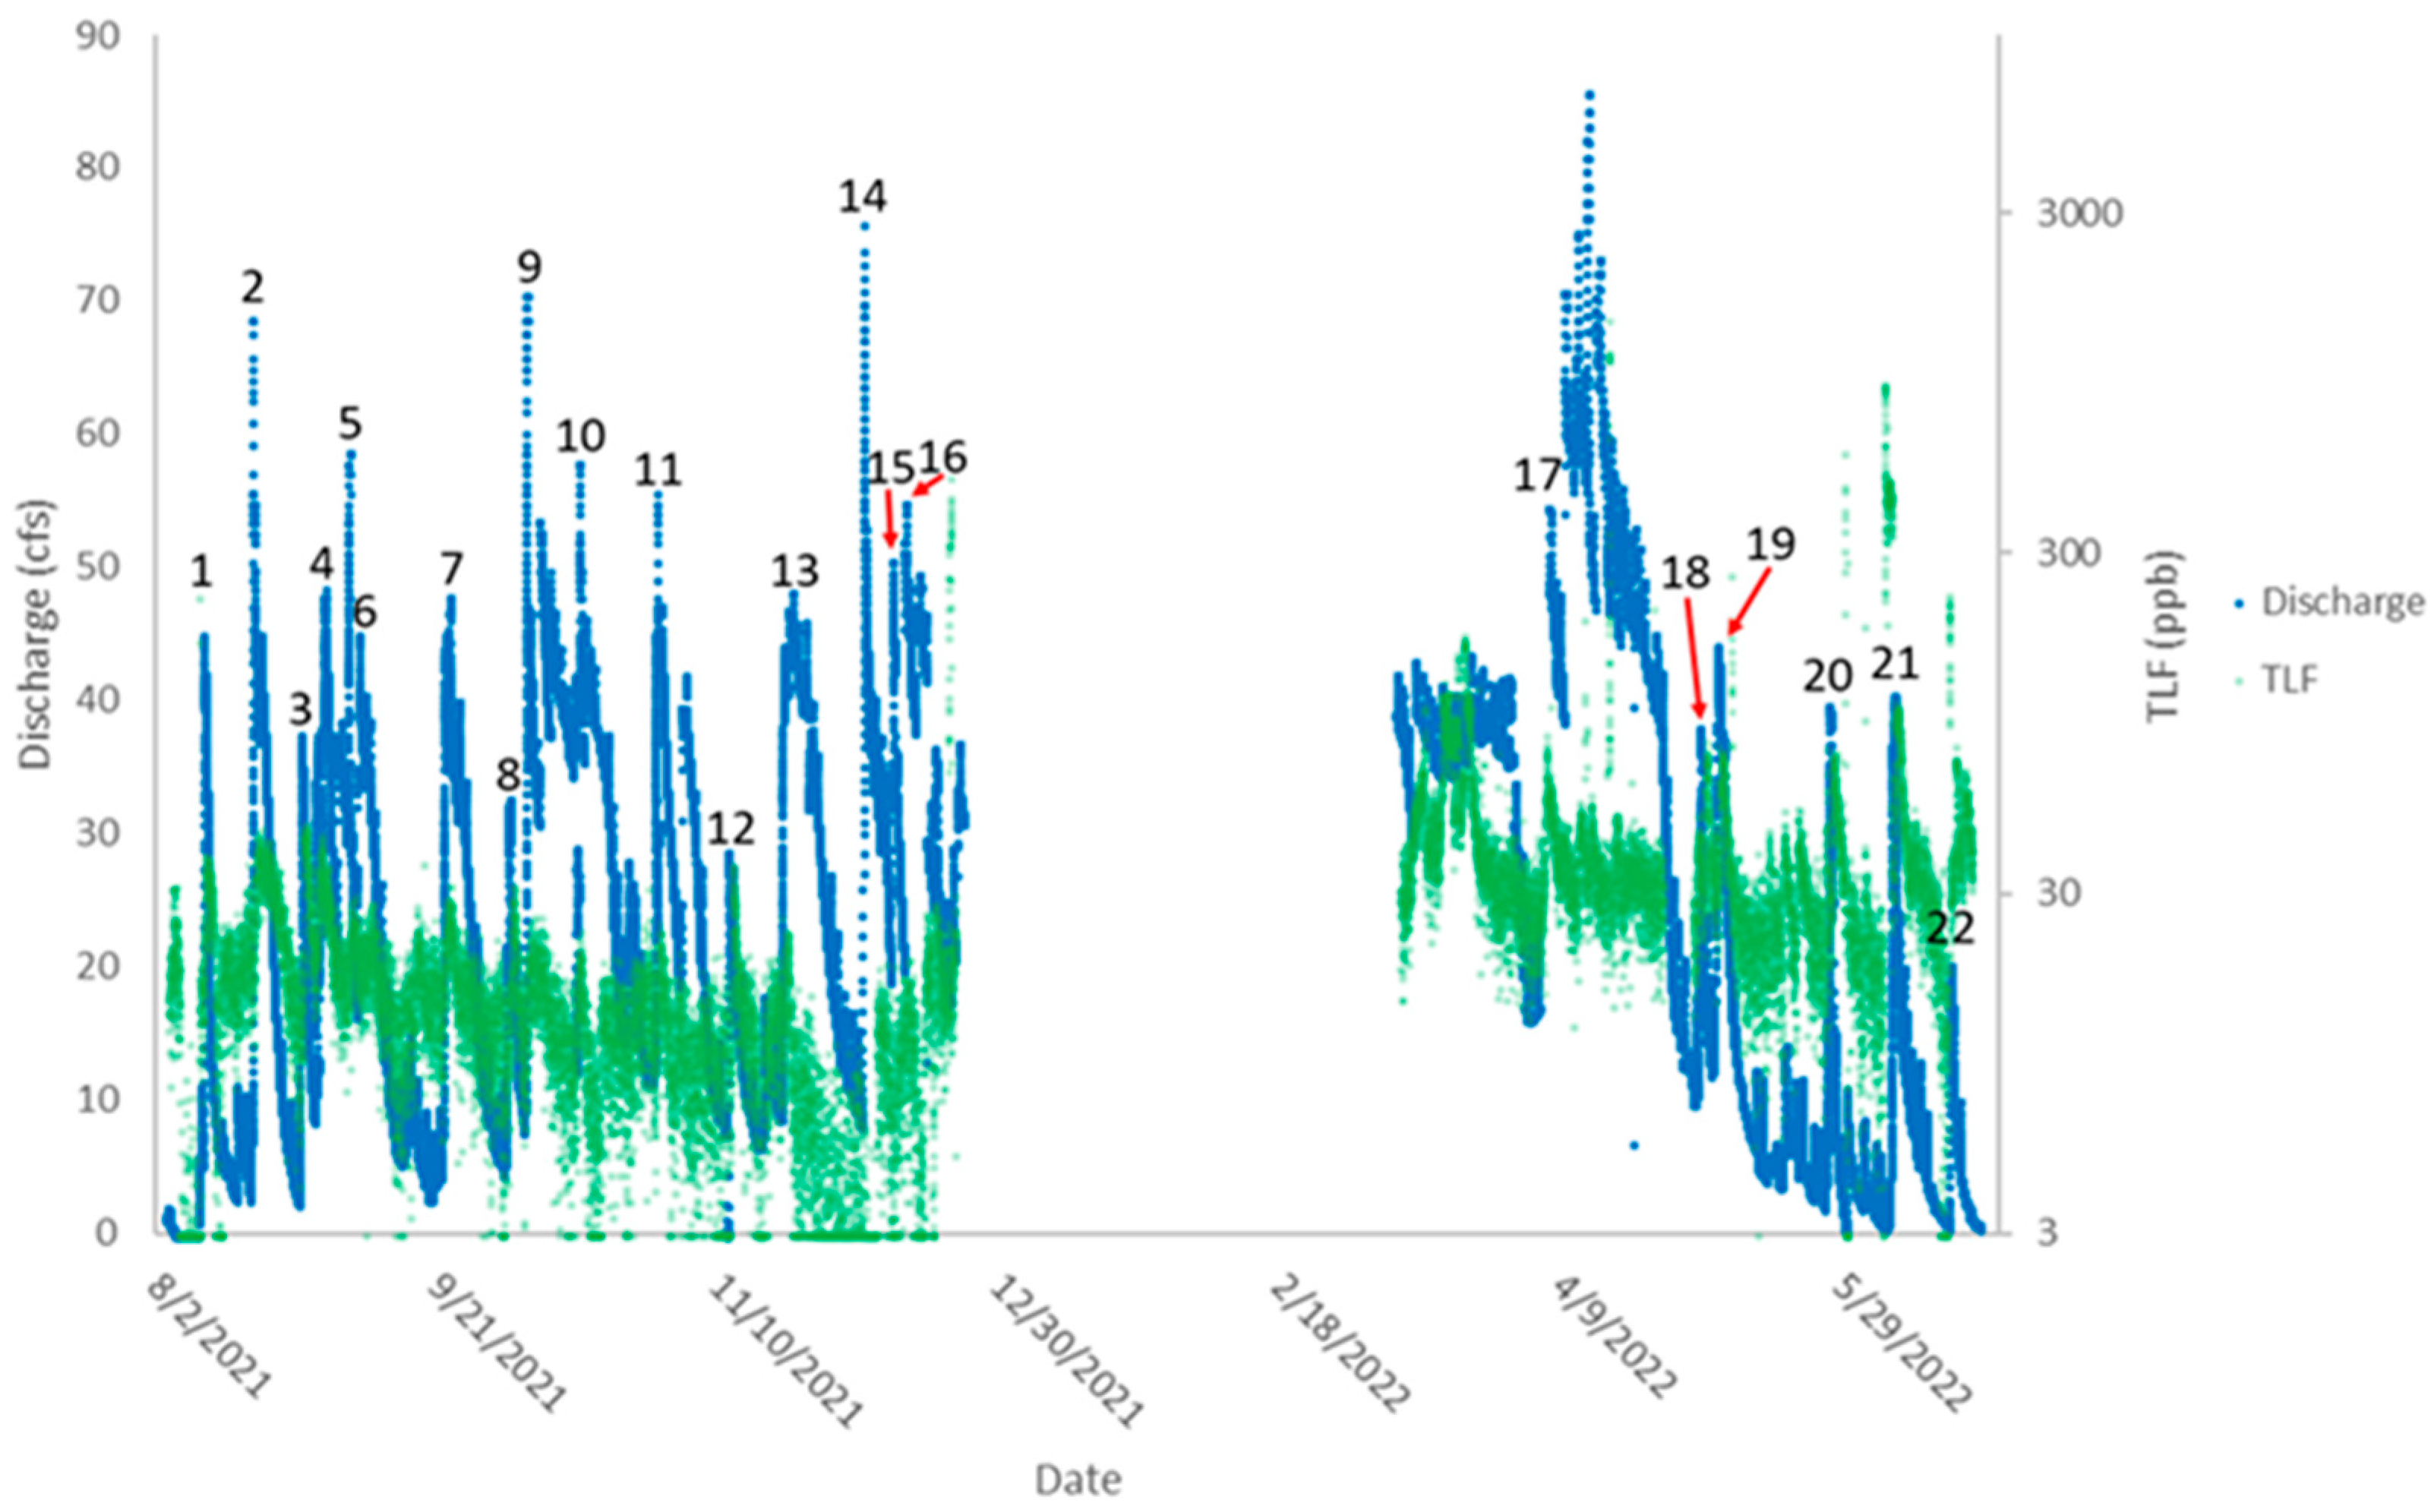
3.1. Precipitation and Discharge

Daily precipitation values at Blue Grass Airport ranged from 0 to 71 mm/day throughout the monitoring period. Daily air temperature ranged from −11.4 to 30.6 °C and averaged 14.2 °C. Assuming that precipitation was 0 for the 45 days when trace amounts (<0.25 mm) were recorded, the total measurable rainfall during the sampling period (379 days) was 1508 mm. The normalized value of annual precipitation during the study period was higher than 70% of the annual precipitation values from 2001 through 2020.
Mean daily discharge values at Royal Spring ranged from 21 to 1826 L/s. The average mean daily discharge over the course of the study was 731 L/s. From 2001 through 2020, the average mean daily discharge in a calendar year ranged from 257 L/s (2005) to 1113 L/s (2018) [50]. The average mean daily discharge during the sampling period was higher than 65% of the annual averages of mean daily discharge from 2001 through 2020.

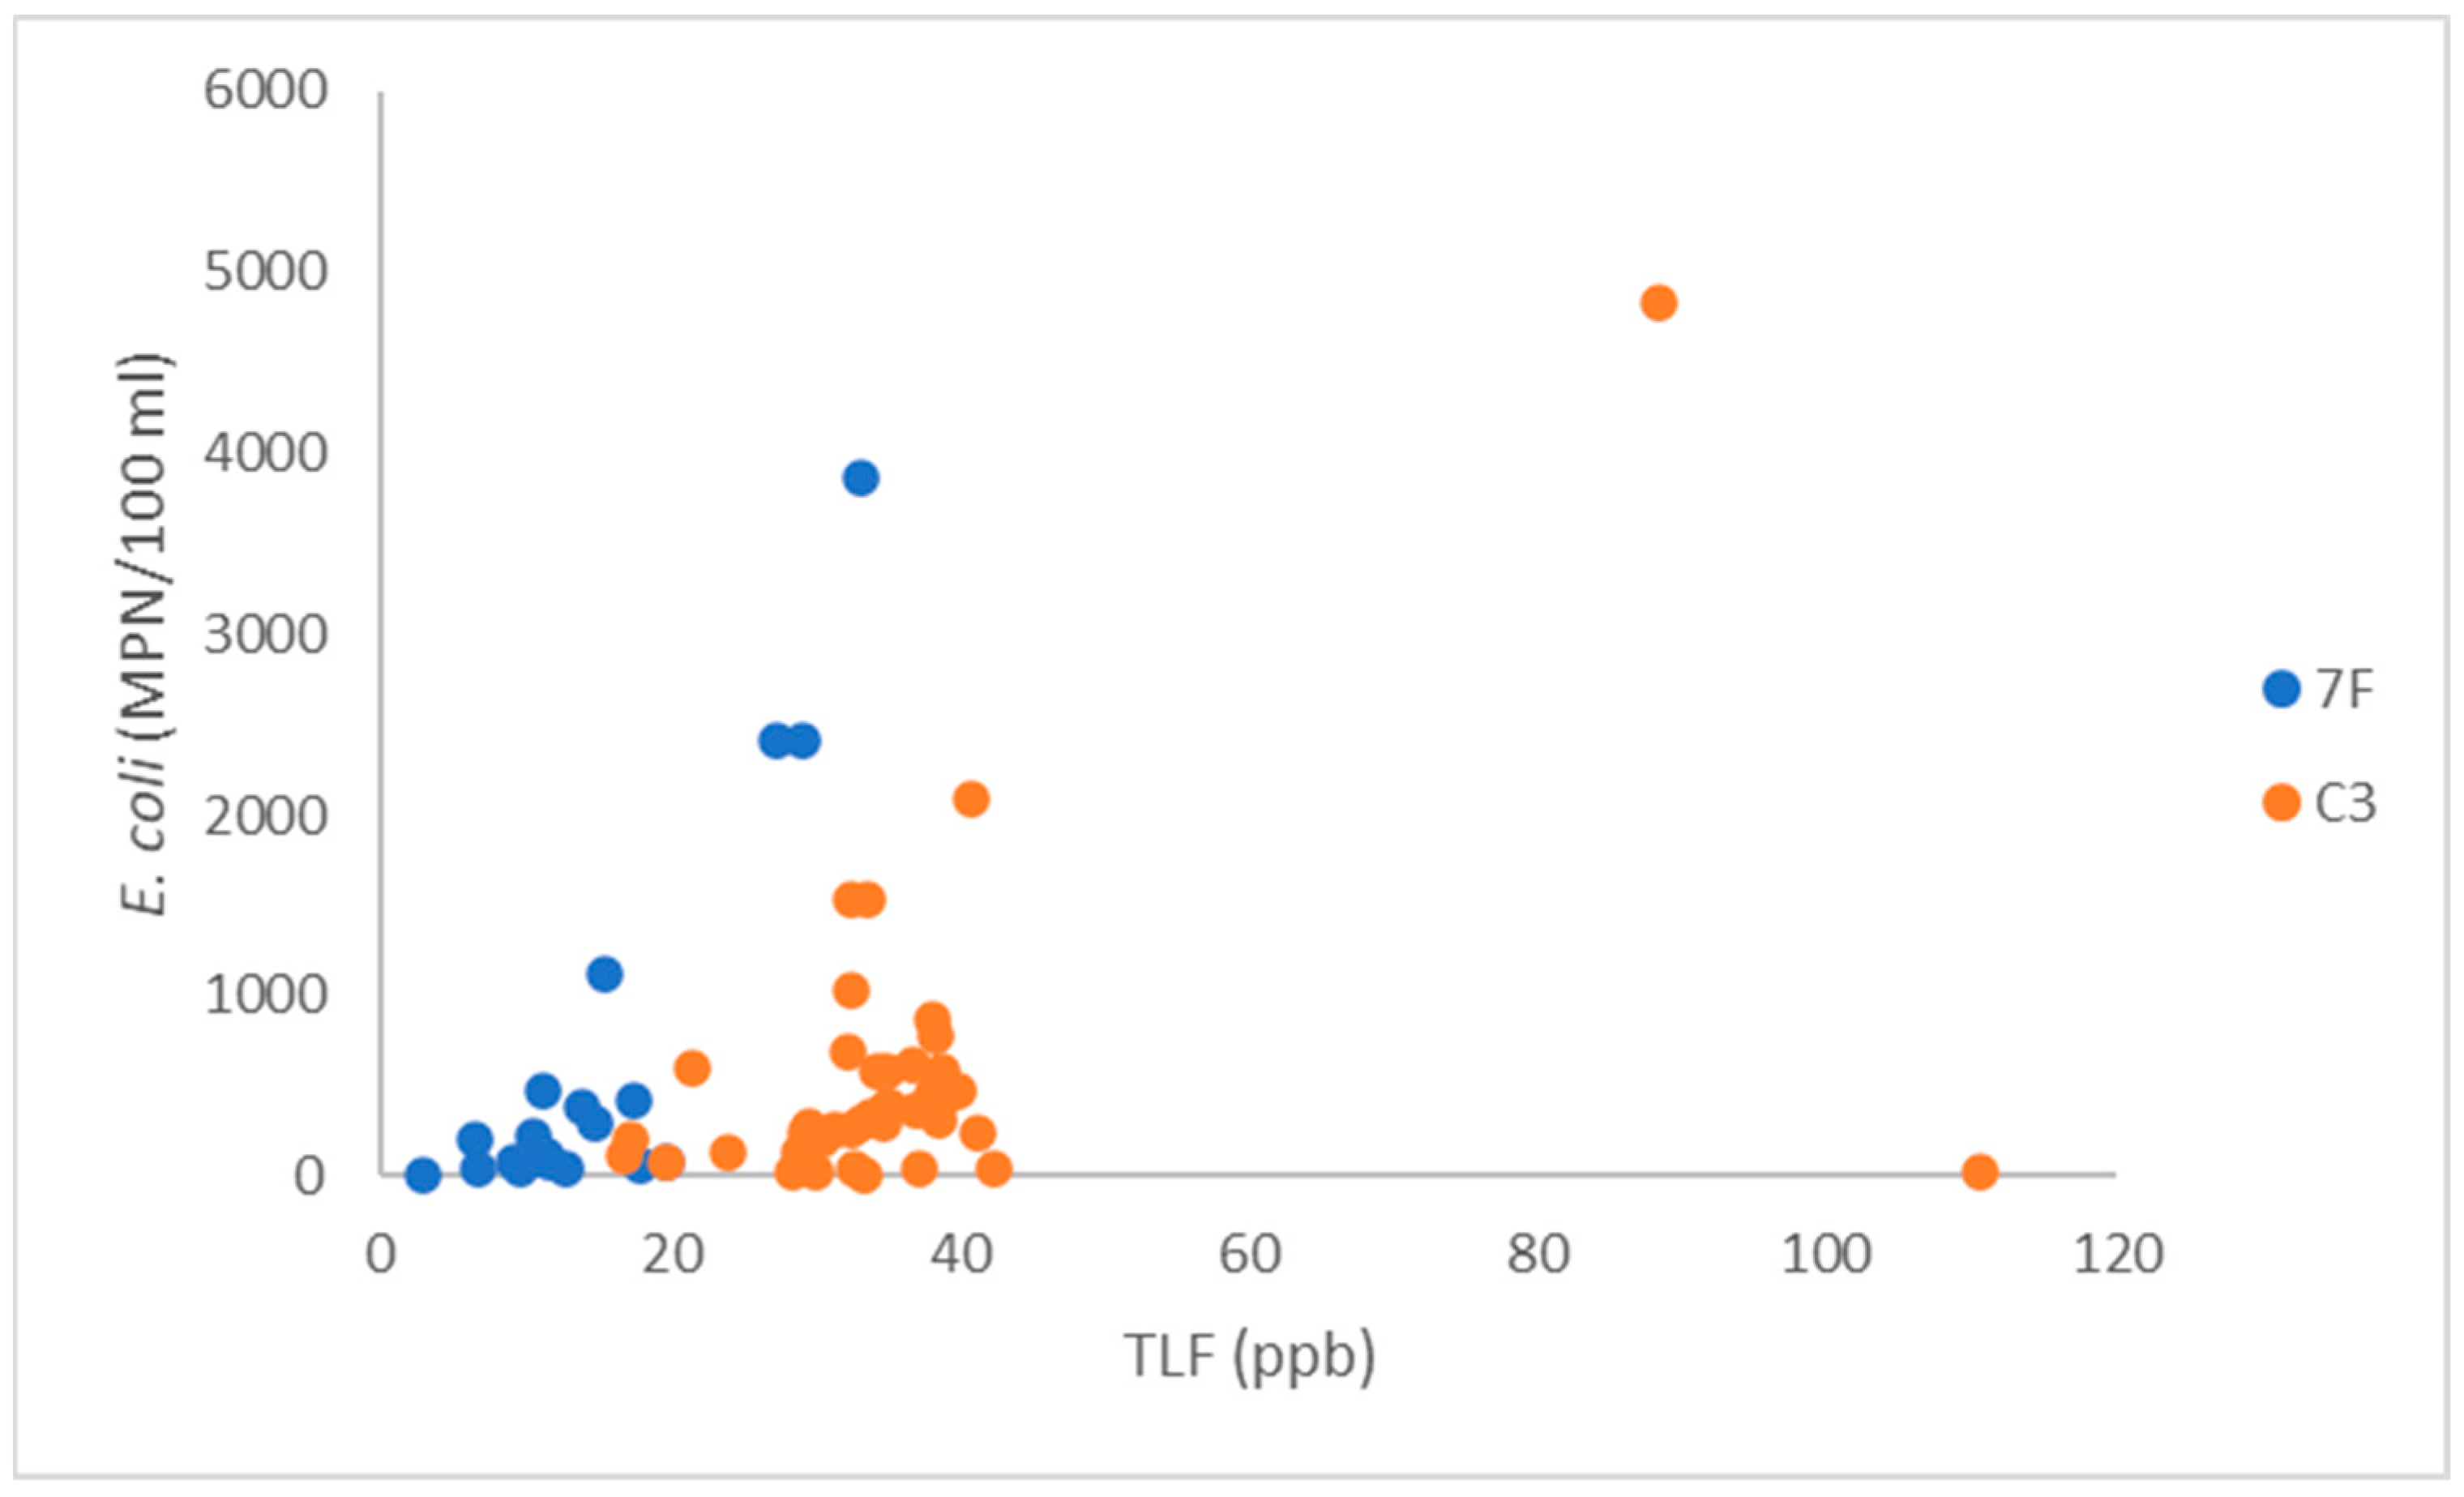
3.2. Relationships of TLF and Turbidity to E. coli

In total, 54 weekly measurements and 27 storm-event measurements were made for E. coli. Concentrations ranged from <1 to 4839.2 MPN/100 mL for weekly samples (mean = 493.4 MPN/100 mL, and median = 123.4 MPN/100 mL) and from 138.2 to 2092.4 MPN/100 mL (mean = 592.9 MPN/100 mL, and median = 419.6 MPN/100 mL) for storm-event samples. A total of 5 values > 2000 MPN/100 mL were recorded during the sampling period. Corresponding turbidity values ranged from 0.227 to 21.2 NTU (mean = 3.40 NTU, and median = 2.08 NTU) for weekly samples and from 2.04 to 4.90 NTU (mean = 2.73 NTU, and median = 2.52 NTU) for storm-event samples. Corresponding TLF values ranged from 3 to 33.1 ppb for the 7F (mean = 14.4 ppb, and median = 11.6 ppb, n = 21) and from 16.8 to 111 ppb for weekly measurements for the C3 (mean = 38.9 ppb, and median = 31.4 ppb, n = 14). Storm-event measurements for the C3 ranged from 28.9 to 40.9 ppb (mean = 34.8 ppb, and median = 34.9 ppb, n = 27). Complete data are available in Figure 5A of [56].
Figure 2 indicates that TLF concentrations measured by both fluorometers broadly increased with E. coli. For TLF values measured using the 7F, a moderate positive correlation with E. coli was observed (ρ = 0.867, p = 3.8 × 10⁻⁷, and n = 21); 4 E. coli measurements > 1000 MPN/100 mL heightened the strength of the correlation. For TLF values recorded with the C3, including storm-event monitoring, a weaker positive correlation was recorded (ρ = 0.439, p = 0.004, and n = 41). The slopes of the relationships between TLF and E. coli for each instrument were notably different as well. The linear regression equations obtained are E. coli = 116.6 TLF—1080.2 for data collected by the 7F and E. coli = 22.5 TLF—266.8 for data collected by the C3. This difference in slopes between the two fluorometers was addressed by using the instrument as an interaction variable in the AIC model selection.
Another positive but weaker correlation was observed between E. coli and turbidity during 7F deployment from 4 August to 22 December 2021 (ρ = 0.642, p = 0.002, and n = 21). During C3 deployment, there was no significant correlation between E. coli and turbidity.

3.3. Linear Regression Modeling and AIC

The models used for the AIC model selection are listed in Table 1, and the subsequent results are shown in Table 2 and Table 3. AICc refers to AIC units of the respective model, and a lower value indicates a better model. Delta AIC refers to the AICc value of the model in question minus the lowest AICc value. The results of the AIC indicate that Model 2 (E. coli depending on TLF–instrument interaction and 48 h antecedent rainfall) was the best-fit model, with Models 8 and 7 as competing models (delta AIC < 2) (Table 1). All 3 models were significant (p < 0.001), with r2 values of 0.52 for Model 2, 0.53 for Model 8, and 0.48 for Model 7 (Table 2).

3.4. TLF and Discharge Peak Timing

Visual inspection indicated 16 discharge peaks while the 7F was deployed and 6 discharge peaks while the C3 was deployed (Figure 3). An associated TLF peak was identified for all but 3 discharge peaks, all of which occurred in December. For 15 of 19 events, the discharge peak preceded the TLF peak by ~6 to ~53.5 h, with a mean lag of ~22 h and a median lag of ~18.5 h (approximated by rounding each lag time to the nearest half-hour). In the other 4 events, the TLF peak preceded the discharge peak by ~1 to ~24 h.

4. Discussion

This study indicates a broadly positive relationship between TLF and E. coli in the Royal Spring basin, as reported for karst terrains in Austria [23], England [22], and Ireland [19]. The mixed/agricultural land use in this study is similar to the studies reported in [19] and [23], but the duration of this study was longer. Frank et al. [23] monitored 3 different springs for 6–10 days, and Vucinic et al. [19] monitored 2 different springs for 24 h; each of those studies focused on responses to rainfall. Mean and median E. coli concentrations at Royal Spring for both weekly and event monitoring exceeded maximum values reported in [23] (14.8–53.0 MPN/100 mL) and [19] (78–99 MPN/100 mL). As in our study, both studies [22] and [19] (in one instance) found a weaker correlation between turbidity and E. coli than between TLF and E. coli.
Baseline TLF values in this study (typically ~10–20 ppb for the 7F, and ~20–30 ppb for the C3; Figure 3) were higher than the baseline of ~4–8 ppb reported in [22]. Similarly, the TLF values corresponding to an E. coli risk threshold of 10 MPN/100 mL (9.35 ppb TLF for the 7F, and 12.3 ppb TLF for the C3), which we calculated using the linear regressions reported above, are higher than reported in other studies (1 ppb [27] to 1.7 ppb [24]). As in [22], we observed sensor drift, particularly for the 7F (Figure 3), but the magnitude of the drift reported in [22] (0.3–0.8 ppb) was less than in our study.
TLF values measured by portable fluorometers have been shown to vary systematically with temperature and turbidity [30]. Given the ranges of measured TLF concentrations (<50 ppb for 62 of 64 samples), water temperature (8.1–19.5 °C; mean = 14.6 °C, and median = 14.8 °C), and turbidity (≤13 NTU for 79 of 80 samples) during E. coli sampling, the effects of temperature and turbidity on our TLF values are generally likely to have been minimal. However, the highest TLF value shown in Figure 2 (111 ppb on 23 March 2022) coincided with a relatively low E. coli concentration (31.6 MPN/100 mL) but the second highest turbidity value (13.0 NTU). Elevated TLF values could result from the fine particulate matter at turbidity values < 50 NTU [27,30].
The linear regression model including TLF, instrument interaction, and 48 h antecedent precipitation (Model 2) gave the best fit to observed E. coli concentrations. The full model (Model 8), which also included turbidity and air temperature, and the model containing just air temperature and 48 h antecedent rainfall (Model 7) were competing models. The fact that Model 7 performed similarly well in terms of predicting E. coli raises questions about the usefulness of monitoring TLF since air temperature and rainfall are more easily and affordably monitored. As noted by [20], the present generation of field fluorometers costs USD 5000–6000, excluding accessories. An additional challenge was the relatively noisy TLF response (Figure 3), including occasional spikes when TLF increased by over an order of magnitude within several hours, which did not seem to correlate with any sort of monitored environmental phenomena. These spikes occurred twice between 4 August and 22 December 2021 (for the 7F), and 8 times between 11 March and 21 June 2022 (for the C3).
Results of continuous monitoring indicate that TLF typically peaked after discharge at Royal Spring during storm flow. Similarly, Bettel et al. [57] observed that sediment concentrations often peaked after discharge at Royal Spring, depending on the extent of pre-event water storage prior to the beginning of a hydrologic event. This suggests that TLF transport in the phreatic conduit is related to sediment transport in some capacity. However, the lag time between discharge and TLF peaks, which had a median of ~18.5 h when peak discharge preceded peak TLF, was greater than the lag time between discharge and sediment peaks at Royal Spring, with a reported mode of ~5 h [57]. This could be a result of differences between the sources of TLF (e.g., surficially derived) and turbidity. Most turbidity fluxes at Royal Spring are a result of both resuspended subsurface sediment and surficially derived sediments [57]. Similarly, differences in turbidity and E. coli responses to precipitation at Royal Spring could be an artifact of the lower sampling frequency of E. coli, but they could also be due to differences in the sources of sediments and bacteria or seasonal differences. E. coli was highest during the late summer and early fall, which could reflect greater precipitation, higher temperatures, or greater grazing by livestock.

5. Conclusions

This study examined the utility of real-time TLF measurements as a proxy for E. coli in a mixed land-use karst drainage basin in central Kentucky (USA) during a relatively wet year. Different statistically significant correlations were seen between TLF and E. coli for two different fluorometers deployed at the outlet spring during different periods. A linear regression model including TLF, instrument interaction, and 48 h antecedent precipitation gave the best fit to observed E. coli concentrations. However, a model based on air temperature and 48 h antecedent precipitation also effectively predicted E. coli concentrations, which suggests that the expense of instrumentation to monitor TLF may not be justifiable. During storm flow, TLF typically peaked after discharge, which suggests that TLF transport is likely related to sediment transport in the phreatic conduit.
Because of the complex chemistry of FDOM and the variability of TLF with turbidity and temperature, empirical correlations between TLF and E. coli are likely to be site-specific [25,30]. For future studies of TLF, protocols for the calibration of fluorometers should be standardized to obtain consistent measurements. It would be beneficial to perform bench-top tests to create rating curves for instruments prior to deployment, as well as deploy multiple fluorometers calibrated using the same methods at a single sampling point to identify potential differences between fluorometers. In addition, deployed fluorometers should be regularly cleaned to limit optical fouling and recalibrated to account for drift.

Author Contributions

Conceptualization, A.E.F. and D.M.B.; methodology, A.E.F., D.M.B., B.W.T. and J.F.F.; software, R.T.D. and B.W.T.; validation, R.T.D., D.M.B., B.W.T., L.B. and J.F.F.; formal analysis, R.T.D., B.W.T., D.M.B. and L.B.; investigation, R.T.D., S.K.S. and L.B.; data curation, R.T.D., L.B. and J.F.F.; writing—original draft preparation, R.T.D.; writing—review and editing, A.E.F., R.T.D., B.W.T., S.K.S. and L.B.; visualization, R.T.D. and S.K.S.; supervision, A.E.F., D.M.B., B.W.T. and J.F.F.; project administration, A.E.F. and J.F.F. All authors have read and agreed to the published version of the manuscript.

Funding

This material is based upon work supported, in part, by the U.S. Geological Survey under Grant/Cooperative Agreement No. G21AP10631 through an award to A.E.F., D.M.B. and R.T.D. The views and conclusions contained in this document are those of the authors and should not be interpreted as representing the opinions or policies of the U.S. Geological Survey. Mention of trade names or commercial products does not constitute their endorsement by the U.S. Geological Survey. This work was funded in part by the Kentucky Senate Bill 271B Water Quality program and National Science Foundation awards #1632888 and #1933779 to J.F.F.; by the Kentucky Geological Survey through a Commonwealth Research Assistantship to R.T.D.; by the University of Kentucky College of Agriculture, Food and Environment through a Kerri Casner Fellowship to R.T.D.; and by the Karst Waters Institute through a William Wilson Scholarship to R.T.D.

Data Availability Statement

Meteorological and discharge data are available from sources [35,50], and weekly monitoring data are available from source [56]. Other data and results of analyses presented herein are available upon request from the corresponding author.

Acknowledgments

We thank the Georgetown Municipal Water and Sewer Service for continued access to Royal Spring.

Conflicts of Interest

The authors declare no conflict of interest.

References

  1. Macler, B.A.; Merkle, J.C. Current knowledge on groundwater microbial pathogens and their control. Hydrogeol. J. 2000, 8, 29–40. [Google Scholar] [CrossRef]
  2. Ford, D.; Williams, P. Karst Hydrogeology and Geomorphology; John Wiley & Sons: New York, NY, USA, 2007. [Google Scholar]
  3. Green, R.T.; Painter, S.L.; Sun, A.; Worthington, S.R. Groundwater contamination in karst terranes. Water Air Soil Poll. Focus 2006, 6, 157–170. [Google Scholar] [CrossRef]
  4. Gunn, J.; Tranter, J.; Perkins, J.; Hunter, C. Sanitary bacterial dynamics in a mixed karst aquifer. In Karst Hydrology; Leibundgut, C., Gunn, J., Dassargues, A., Eds.; International Association of Hydrological Sciences Publication 247, IAHS Press: Wallingford, UK, 1997; pp. 61–70. [Google Scholar]
  5. Marshall, D.; Brahana, J.V.; Davis, R.K. Resuspension of viable sediment-bound enteric pathogens in shallow karst aquifers. In Gambling with Groundwater—Physical, Chemical and Biological Aspects of Aquifer-Stream Relations; Brahana, J.V., Eckstein, Y., Ongley, L.K., Schneider, R., Moore, J.E., Eds.; American Institute of Hydrology: St. Paul, MN, USA, 1998; pp. 179–186. [Google Scholar]
  6. Sherer, B.M.; Miner, J.R.; Moore, J.A.; Buckhouse, J.C. Resuspending organisms from a rangeland stream bottom. T. ASAE 1988, 31, 1217–1222. [Google Scholar] [CrossRef]
  7. Sherer, B.M.; Miner, J.R.; Moore, J.A.; Buckhouse, J.C. Indicator bacterial survival in stream sediments. J. Environ. Qual. 1992, 21, 591–595. [Google Scholar] [CrossRef] [Green Version]
  8. World Health Organization. Guidelines for Drinking-Water Quality: Fourth Edition Incorporating the First and Second Addenda; World Health Organization: Geneva, Switzerland, 2022. [Google Scholar]
  9. Feng, P.; Weagant, S.D.; Grant, M.A.; Burkhardt, W. BAM Chapter 4: Enumeration of Escherichia coli and the coliform bacteria. In Bacteriological Analytical Manual; U.S. Food and Drug Administration: Washington, DC, USA, 2020. [Google Scholar]
  10. Colilert 18—IDEXX US. Available online: https://www.idexx.com/en/water/water-products-services/colilert-18/ (accessed on 22 February 2023).
  11. Dorner, S.M.; Anderson, W.B.; Gaulin, T.; Candon, H.L.; Slawson, R.M.; Payment, P.; Huck, P.M. Pathogen and indicator variability in a heavily impacted watershed. J. Water Health 2007, 5, 241–257. [Google Scholar] [CrossRef]
  12. Vidon, P.; Tedesco, L.P.; Wilson, J.; Campbell, M.A.; Casey, L.R.; Gray, M. Direct and indirect hydrological controls on E. coli concentration and loading in midwestern streams. J. Environ. Qual. 2008, 37, 1761–1768. [Google Scholar] [CrossRef]
  13. Sorensen, J.P.; Carr, A.F.; Nayebare, J.; Diongue, D.M.; Pouye, A.; Roffo, R.; Gwengweya, G.; Ward, J.S.; Kanoti, J.; Okotto-Okotto, J.; et al. Tryptophan-like and humic-like fluorophores are extracellular in groundwater: Implications as real-time faecal indicators. Sci. Rep. 2020, 10, 15379. [Google Scholar] [CrossRef]
  14. Sorensen, J.P.; Nayebare, J.; Carr, A.F.; Lyness, R.; Campos, L.C.; Ciric, L.; Goodall, T.; Kulabako, R.; Curran, C.M.; MacDonald, A.M.; et al. In-situ fluorescence spectroscopy is a more rapid and resilient indicator of faecal contamination risk in drinking water than faecal indicator organisms. Water Res. 2021, 206, 117734. [Google Scholar] [CrossRef]
  15. Cammack, W.K.; Kalff, J.; Prairie, Y.T.; Smith, E.M. Fluorescent dissolved organic matter in lakes: Relationships with heterotrophic metabolism. Limnol. Oceanogr. 2004, 49, 2034–2045. [Google Scholar] [CrossRef]
  16. Lapworth, D.J.; Gooddy, D.C.; Morris, B.L.; Butcher, A. Investigating groundwater movement and pathogen transport in sandstone aquifers using intrinsic fluorescence spectroscopy. In Proceedings of the Poster Session, Geological Society of London Bicentennial Conference, London, UK, 10–12 September 2007; Available online: https://nora.nerc.ac.uk/id/eprint/13995/1/GS2007.pdf (accessed on 22 February 2023).
  17. Hudson, N.; Baker, A.; Reynolds, D. Fluorescence analysis of dissolved organic matter in natural, waste and polluted waters—A review. River Res. Appl. 2007, 23, 631–649. [Google Scholar] [CrossRef]
  18. Hudson, N.; Baker, A.; Ward, D.; Reynolds, D.M.; Brunsdon, C.; Carliell-Marquet, C.; Browning, S. Can fluorescence spectrometry be used as a surrogate for the biochemical oxygen demand (BOD) test in water quality assessment? An example from southwest England. Sci. Total Environ. 2008, 391, 149–158. [Google Scholar] [CrossRef]
  19. Vucinic, L.; O’Connell, D.; Dubber, D.; Coxon, C.; Gill, L. Multiple fluorescence approaches to identify rapid changes in microbial indicators at karst springs. J. Contam. Hydrol. 2023, 254, 104129. [Google Scholar] [CrossRef]
  20. Sorensen, J.P.; Baker, A.; Cumberland, S.A.; Lapworth, D.J.; MacDonald, A.M.; Pedley, S.; Taylor, R.G.; Ward, J.S. Real-time detection of faecally contaminated drinking water with tryptophan-like fluorescence: Defining threshold values. Sci. Total Environ. 2018, 622–623, 1250–1257. [Google Scholar] [CrossRef]
  21. Sorensen, J.; Lapworth, D.; Marchant, B.; Nkhuwa, D.; Pedley, S.; Stuart, M.; Bell, R.; Chirwa, M.; Kabika, J.; Liemisa, M.; et al. In-situ tryptophan-like fluorescence: A real-time indicator of faecal contamination in drinking water supplies. Water Res. 2015, 81, 38–46. [Google Scholar] [CrossRef] [Green Version]
  22. Sorensen, J.; Vivanco, A.; Ascott, M.; Gooddy, D.; Lapworth, D.; Read, D.; Rushworth, C.; Bucknall, J.; Herbert, K.; Karapanos, I.; et al. Online fluorescence spectroscopy for the real-time evaluation of the microbial quality of drinking water. Water Res. 2018, 137, 301–309. [Google Scholar] [CrossRef]
  23. Frank, S.; Goeppert, N.; Goldscheider, N. Fluorescence-based multi-parameter approach to characterize dynamics of organic carbon, faecal bacteria and particles at alpine karst springs. Sci. Total Environ. 2018, 615, 1446–1459. [Google Scholar] [CrossRef]
  24. Ward, J.S.; Lapworth, D.J.; Read, D.S.; Pedley, S.; Banda, S.T.; Monjerezi, M.; Gwengweya, G.; MacDonald, A.M. Tryptophan-like fluorescence as a high-level screening tool for detecting microbial contamination in drinking water. Sci. Total Environ. 2021, 750, 141284. [Google Scholar] [CrossRef]
  25. Baker, A.; Cumberland, S.A.; Bradley, C.; Buckley, C.; Bridgeman, J. To what extent can portable fluorescence spectroscopy be used in the real-time assessment of microbial water quality? Sci. Total Environ. 2015, 532, 14–19. [Google Scholar] [CrossRef] [Green Version]
  26. Mendoza, L.M.; Mladenov, N.; Kinoshita, A.M.; Pinongcos, F.; Verbyla, M.E.; Gersberg, R. Fluorescence-based monitoring of anthropogenic pollutant inputs to an urban stream in southern California, USA. Sci. Total Environ. 2020, 718, 137206. [Google Scholar] [CrossRef]
  27. Nowicki, S.; Lapworth, D.J.; Ward, J.S.; Thomson, P.; Charles, K. Tryptophan-like fluorescence as a measure of microbial contamination risk in groundwater. Sci. Total Environ. 2019, 646, 782–791. [Google Scholar] [CrossRef] [Green Version]
  28. Ward, J.S.; Lapworth, D.J.; Read, D.S.; Pedley, S.; Banda, S.T.; Monjerezi, M.; Gwengweya, G.; MacDonald, A.M. Large-scale survey of seasonal drinking water quality in Malawi using in situ tryptophan-like fluorescence and conventional water quality indicators. Sci. Total Environ. 2020, 744, 140674. [Google Scholar] [CrossRef] [PubMed]
  29. Frank, S.; Fahrmeier, N.; Goeppert, N.; Goldscheider, N. High-resolution multi-parameter monitoring of microbial water quality and particles at two alpine karst springs as a basis for an early-warning system. Hydrogeol. J. 2022, 30, 2285–2298. [Google Scholar] [CrossRef]
  30. Khamis, K.; Sorensen, J.; Bradley, C.; Hannah, D.; Lapworth, D.J.; Stevens, R. In situ tryptophan-like fluorometers: Assessing turbidity and temperature effects for freshwater applications. Environ. Sci. Process. Impacts 2015, 17, 740–752. [Google Scholar] [CrossRef] [PubMed] [Green Version]
  31. Husic, A.; Fox, J.; Adams, E.; Backus, J.; Pollock, E.; Ford, W.; Agouridis, C. Inland impacts of atmospheric river and tropical cyclone extremes on nitrate transport and stable isotope measurements. Environ. Earth Sci. 2019, 78, 36. [Google Scholar] [CrossRef]
  32. McFarlan, A.C. Geology of Kentucky; University of Kentucky: Lexington, KY, USA, 1943. [Google Scholar]
  33. Clepper, M.L. Lithostratigraphic and Paleoenvironmental Framework of the Upper Ordovician Lexington Limestone, Bluegrass Region, Central Kentucky. Doctoral Dissertation, University of Kentucky, Lexington, KY, USA, 2011. [Google Scholar]
  34. Barton, A.M.; Black Eagle, C.W.; Fryar, A.E. Bourbon and springs in the Inner Bluegrass region of Kentucky. In On and around the Cincinnati Arch and Niagara Escarpment: Geological Field Trips in Ohio and Kentucky for the GSA North-Central Section Meeting, Dayton, Ohio, 2012; Sandy, M.R., Goldman, D., Eds.; Field Guide 27; Geological Society of America: Boulder, CO, USA, 2012; pp. 19–31. [Google Scholar]
  35. cli-MATE: MRCC Application Tools Environment. Available online: https://mrcc.purdue.edu/CLIMATE/ (accessed on 22 February 2023).
  36. Source Water Protection. Available online: https://eec.ky.gov/Environmental-Protection/Water/Protection/Pages/SWP.aspx (accessed on 22 February 2023).
  37. Currens, B.J.; Hall, A.; Brion, G.M.; Fryar, A.E. Use of acetaminophen and sucralose as co-analytes to differentiate sources of human excreta in surface waters. Water Res. 2019, 157, 1–7. [Google Scholar] [CrossRef] [Green Version]
  38. Bandy, A.M.; Cook, K.; Fryar, A.E.; Zhu, J. Differential transport of Escherichia coli isolates compared to abiotic tracers in a karst aquifer. Groundwater 2020, 58, 70–78. [Google Scholar] [CrossRef]
  39. Class V Wells for Injection of Non-Hazardous Fluids into or Above Underground Sources of Drinking Water. Available online: https://www.epa.gov/uic/class-v-wells-injection-non-hazardous-fluids-or-above-underground-sources-drinking-water (accessed on 22 February 2023).
  40. University of Kentucky Department of Biosystems and Agricultural Engineering. Cane Run and Royal Spring Watershed-Based Plan. In Report Prepared for U.S. Environmental Protection Agency under Project Number C9994861-06; University of Kentucky: Lexington, KY, USA, 2016. [Google Scholar]
  41. Paylor, R.L.; Currens, J.C. Final report: Royal Spring Karst Groundwater Travel Time Investigation. In Report submitted to Georgetown Municipal Water and Sewer Service; Kentucky Geological Survey; University of Kentucky: Lexington, KY, USA, 2004. [Google Scholar]
  42. Zhu, J.; Currens, J.C.; Dinger, J.S. Challenges of using electrical resistivity method to locate karst conduits—A field case in the Inner Bluegrass region, Kentucky. J. Appl. Geophys. 2011, 75, 523–530. [Google Scholar] [CrossRef]
  43. Sawyer, A.H.; Zhu, J.; Currens, J.C.; Atcher, C.; Binley, A. Time-lapse electrical resistivity imaging of solute transport in a karst conduit. Hydrol. Process. 2015, 29, 4968–4976. [Google Scholar] [CrossRef]
  44. Tripathi, G.N.; Fryar, A.E. Integrated surface geophysical approach to locate a karst conduit: A case study from Royal Spring basin, Kentucky, USA. J. Nepal Geol. Soc. 2016, 51, 27–37. [Google Scholar] [CrossRef]
  45. Husic, A.; Fox, J.; Agouridis, C.; Currens, J.; Ford, W.; Taylor, C. Sediment carbon fate in phreatic karst (Part 1): Conceptual model development. J. Hydrol. 2017, 549, 179–193. [Google Scholar] [CrossRef]
  46. Younan, L.; Turner Designs, Sunnyvale, CA, USA. Personal communication, 2021.
  47. Younan, L.; Turner Designs, Sunnyvale, CA, USA. Personal communication, 2022.
  48. Gentry, R.W.; McCarthy, J.; Layton, A.; McKay, L.D.; Williams, D.; Koirala, S.R.; Sayler, G.S. Escherichia coli loading at or near base flow in a mixed-use watershed. J. Environ. Qual. 2006, 35, 2244–2249. [Google Scholar] [CrossRef]
  49. Buckerfield, S.J.; Quilliam, R.S.; Waldron, S.; Naylor, L.A.; Li, S.; Oliver, D.M. Rainfall-driven E. coli transfer to the stream-conduit network observed through increasing spatial scales in mixed land-use paddy farming karst terrain. Water Res. X 2019, 5, 100038. [Google Scholar] [CrossRef]
  50. Royal Springs at Georgetown, KY. Available online: https://waterdata.usgs.gov/monitoring-location/03288110/ (accessed on 22 February 2023).
  51. Behrouj-Peely, A.; Mohammadi, Z.; Scheiber, L.; Vázquez-Suñé, E. An integrated approach to estimate the mixing ratios in a karst system under different hydrogeological conditions. J. Hydrol. Reg. Stud. 2020, 30, 100693. [Google Scholar] [CrossRef]
  52. Tobin, B.W.; Polk, J.S.; Arpin, S.M.; Shelley, A.; Taylor, C. A conceptual model of epikarst processes across sites, seasons, and storm events. J. Hydrol. 2021, 596, 125692. [Google Scholar] [CrossRef]
  53. Anderson, D.R.; Burnham, K.P. Avoiding pitfalls when using information-theoretic methods. J. Wildlife Manage. 2002, 66, 912–918. [Google Scholar] [CrossRef]
  54. Brion, G.M.; Department of Civil Engineering, University of Kentucky, Lexington, KY, USA. Personal communication, 2022.
  55. R Core Team. R: A Language and Environment for Statistical Computing, Version 4.1.2; R Foundation for Statistical Computing: Vienna, Austria, 2021.
  56. Dapkus, R. Tryptophan-Like Fluorescence and Non-Point Source Pollution in Karst Basins, Inner Bluegrass Region, Kentucky. Master’s Thesis, University of Kentucky, Lexington, KY, USA, 2022. [Google Scholar]
  57. Bettel, L.; Fox, J.; Husic, A.; Zhu, J.; Al Aamery, N.; Mahoney, T.; Gold-McCoy, A. Sediment transport investigation in a karst aquifer hypothesizes controls on internal versus external sediment origin and saturation impact on hysteresis. J. Hydrol. 2022, 613, 128391. [Google Scholar] [CrossRef]
Figure 2. E. coli concentrations plotted vs. TLF concentrations measured by the 7F and C3 fluorometers.
Hydrology 10 00074 g002
Figure 3. TLF concentrations and discharge during fluorometer deployment at Royal Spring (1.00 cfs = 28.3 L/s). Discharge peaks are indicated by numbers (1–22) corresponding to order of occurrence.
Hydrology 10 00074 g003
Table 1. Sources of data used in linear regression models.
VariableData Source
E. coliIDEXX analyses
TLF7F and C3 fluorometers
TurbidityYSI multiparameter sonde and smart sensor
Instrument effect7F or C3 fluorometer
Air temperatureBlue Grass Airport [35]
48 h antecedent precipitationBlue Grass Airport [35]
Table 2. List of linear models used for each AIC model selection in R and AIC results; f( ) indicates that a model is a function of the listed parameters. “Ecoli” = E. coli concentration; “TLF * Inst” = interaction variable between TLF and the instrument used to record it; “rain_48 h” = 48 h antecedent rainfall; “turb” = turbidity; “TLF” = TLF concentration; and “airT” = air temperature.
ModelModel ParametersAICcDelta AICWeight
1Ecoli = f(TLF * Instrument)991.811.540.002
2Ecoli = f(TLF * Inst + rain_48 h)980.300.481
3Ecoli = f(turbidity)1011.831.450
4Ecoli = f(rain_48 h)983.43.130.101
5Ecoli = f(turb + rain_48 h)985.65.280.034
6Ecoli = f(TLF)1013.633.260
7Ecoli = f(airT + rain_48 h)982.21.860.190
8Ecoli = f(TLF * Inst + rain_48 h + turb + airT)982.11.840.192
Table 3. Model coefficients, model fit, and F-statistics for competing models (“TLF” = tryptophan-like fluorescence, “rain_48 h” = 48 h antecedent rainfall, “turb” = turbidity, “airT” = air temperature, and “TLF * Inst” = interaction variable between TLF and the instrument used to record it; N/A = not applicable).
ModelInterceptTLFInstrumentrain_48 hturbairTTLF * InstF-Statisticr2
2−194.7614.44−350.44888.09N/AN/A47.6217.610.52
8−971.3817.49−120.3936.78−28.2111.3641.3912.460.53
7−713.19N/AN/A1258.92N/A14.95N/A29.710.48
Disclaimer/Publisher’s Note: The statements, opinions and data contained in all publications are solely those of the individual author(s) and contributor(s) and not of MDPI and/or the editor(s). MDPI and/or the editor(s) disclaim responsibility for any injury to people or property resulting from any ideas, methods, instructions or products referred to in the content.

