Generation of Spatially Heterogeneous Flood Events in an Alpine Region—Adaptation and Application of a Multivariate Modelling Procedure


Abstract
:1. Introduction
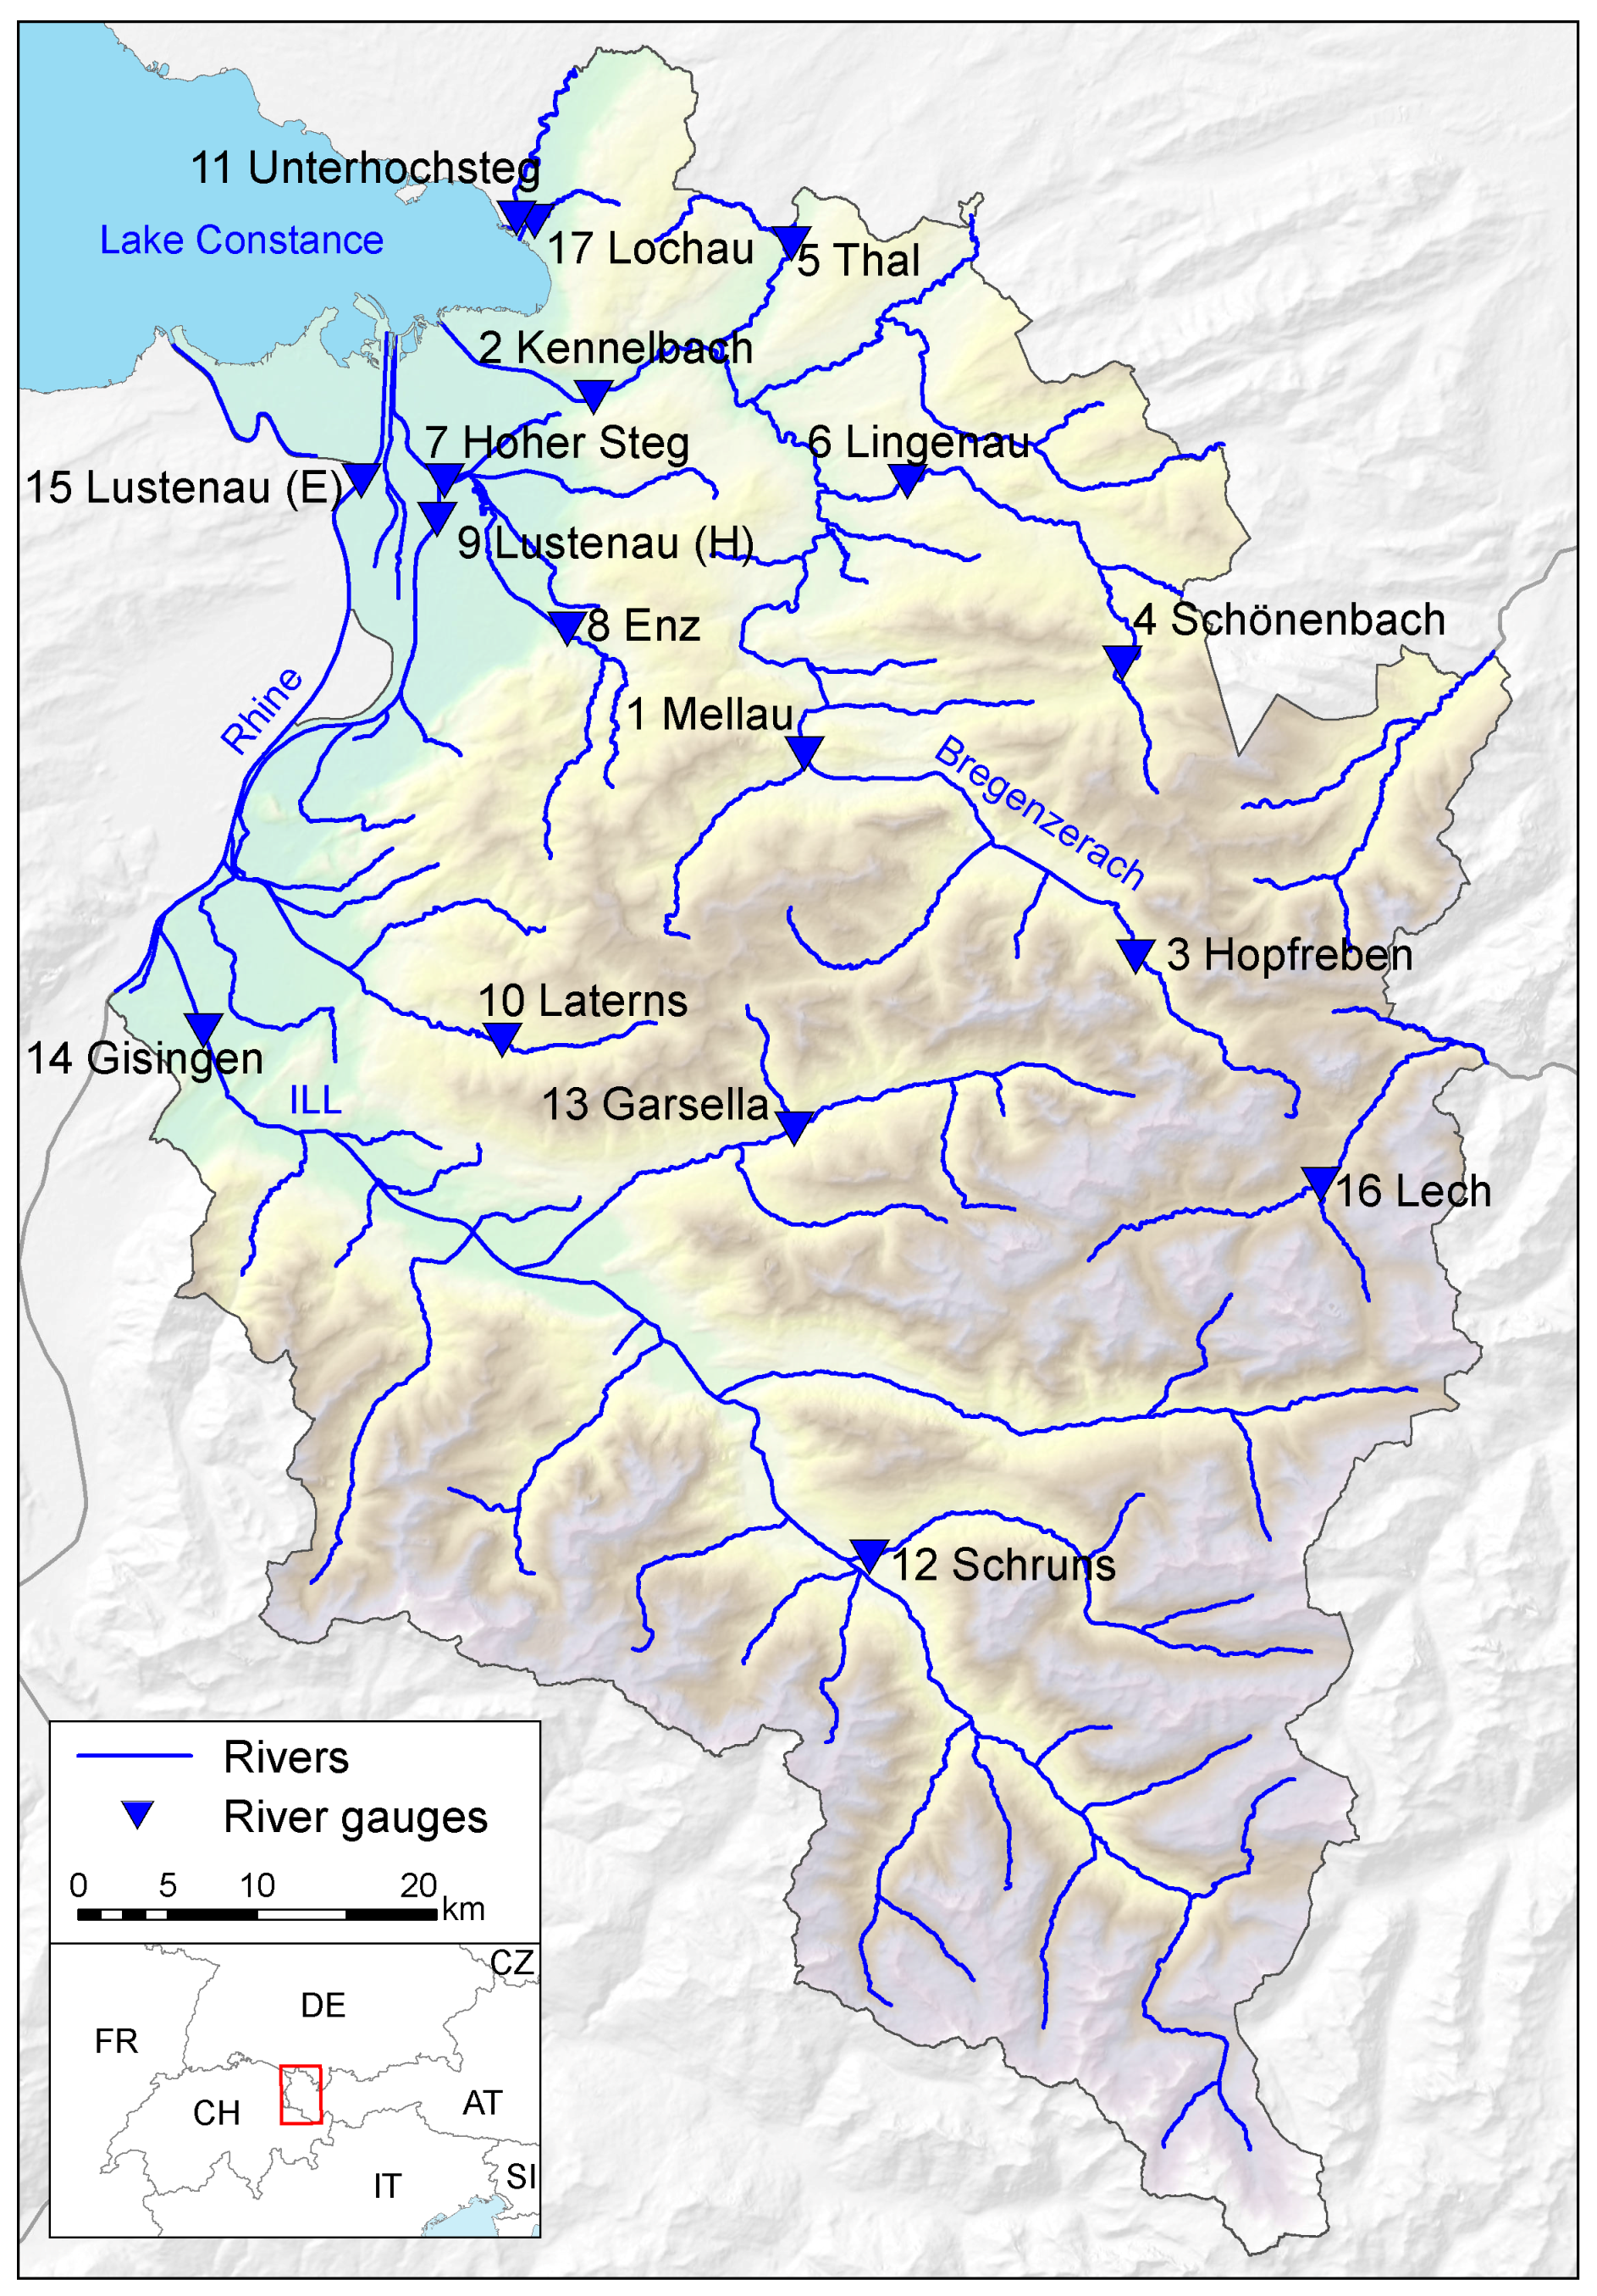
2. Study Area and Data Used
3. Data Review and Preparation
3.1. Event Definition
- An analysis of runoff time series, where the consecutive days exceeding a specific threshold (defined by the pth quantile ) are counted, provides a first estimation of . Denote the daily maximum runoff at gauge and time t by , and then the probability of peaks of length L is defined as
- The travel- or concentration time provides additional information about the hydrological response of a watershed and therefore contribute to a thorough event definition. In this context, the concentration time (in hours) is a possible measure to indicate the time interval in which a receptor (e.g., flood-prone area) can be affected by simultaneous flooding from two or multiple tributaries. Grimaldi et al. [38] summarized and presented selected formulas for estimating the concentration time, such as, the formulas of (a) ‘Department of Public Works’, (b) ‘Giandotti’, (c) ‘Kirpich’, and (d) ‘Viparelli’, where only few input parameters are necessary. Full details concerning these formulas of the concentration time and their specified restrictions (e.g., regarding the catchment size) can be found in Grimaldi et al. [38]. Although the empirical formulas to estimate the concentration time are associated with large uncertainties [38], they still provide a valuable instrument to calculate the travel time in investigated watersheds.
- The event definition (i.e., selection of ) may also depend on the intended application of the model, such as reconstruction of flood situations in the past lasting a certain number of days or application in a distinct (re)insurance context [21].
3.2. Event Categorization
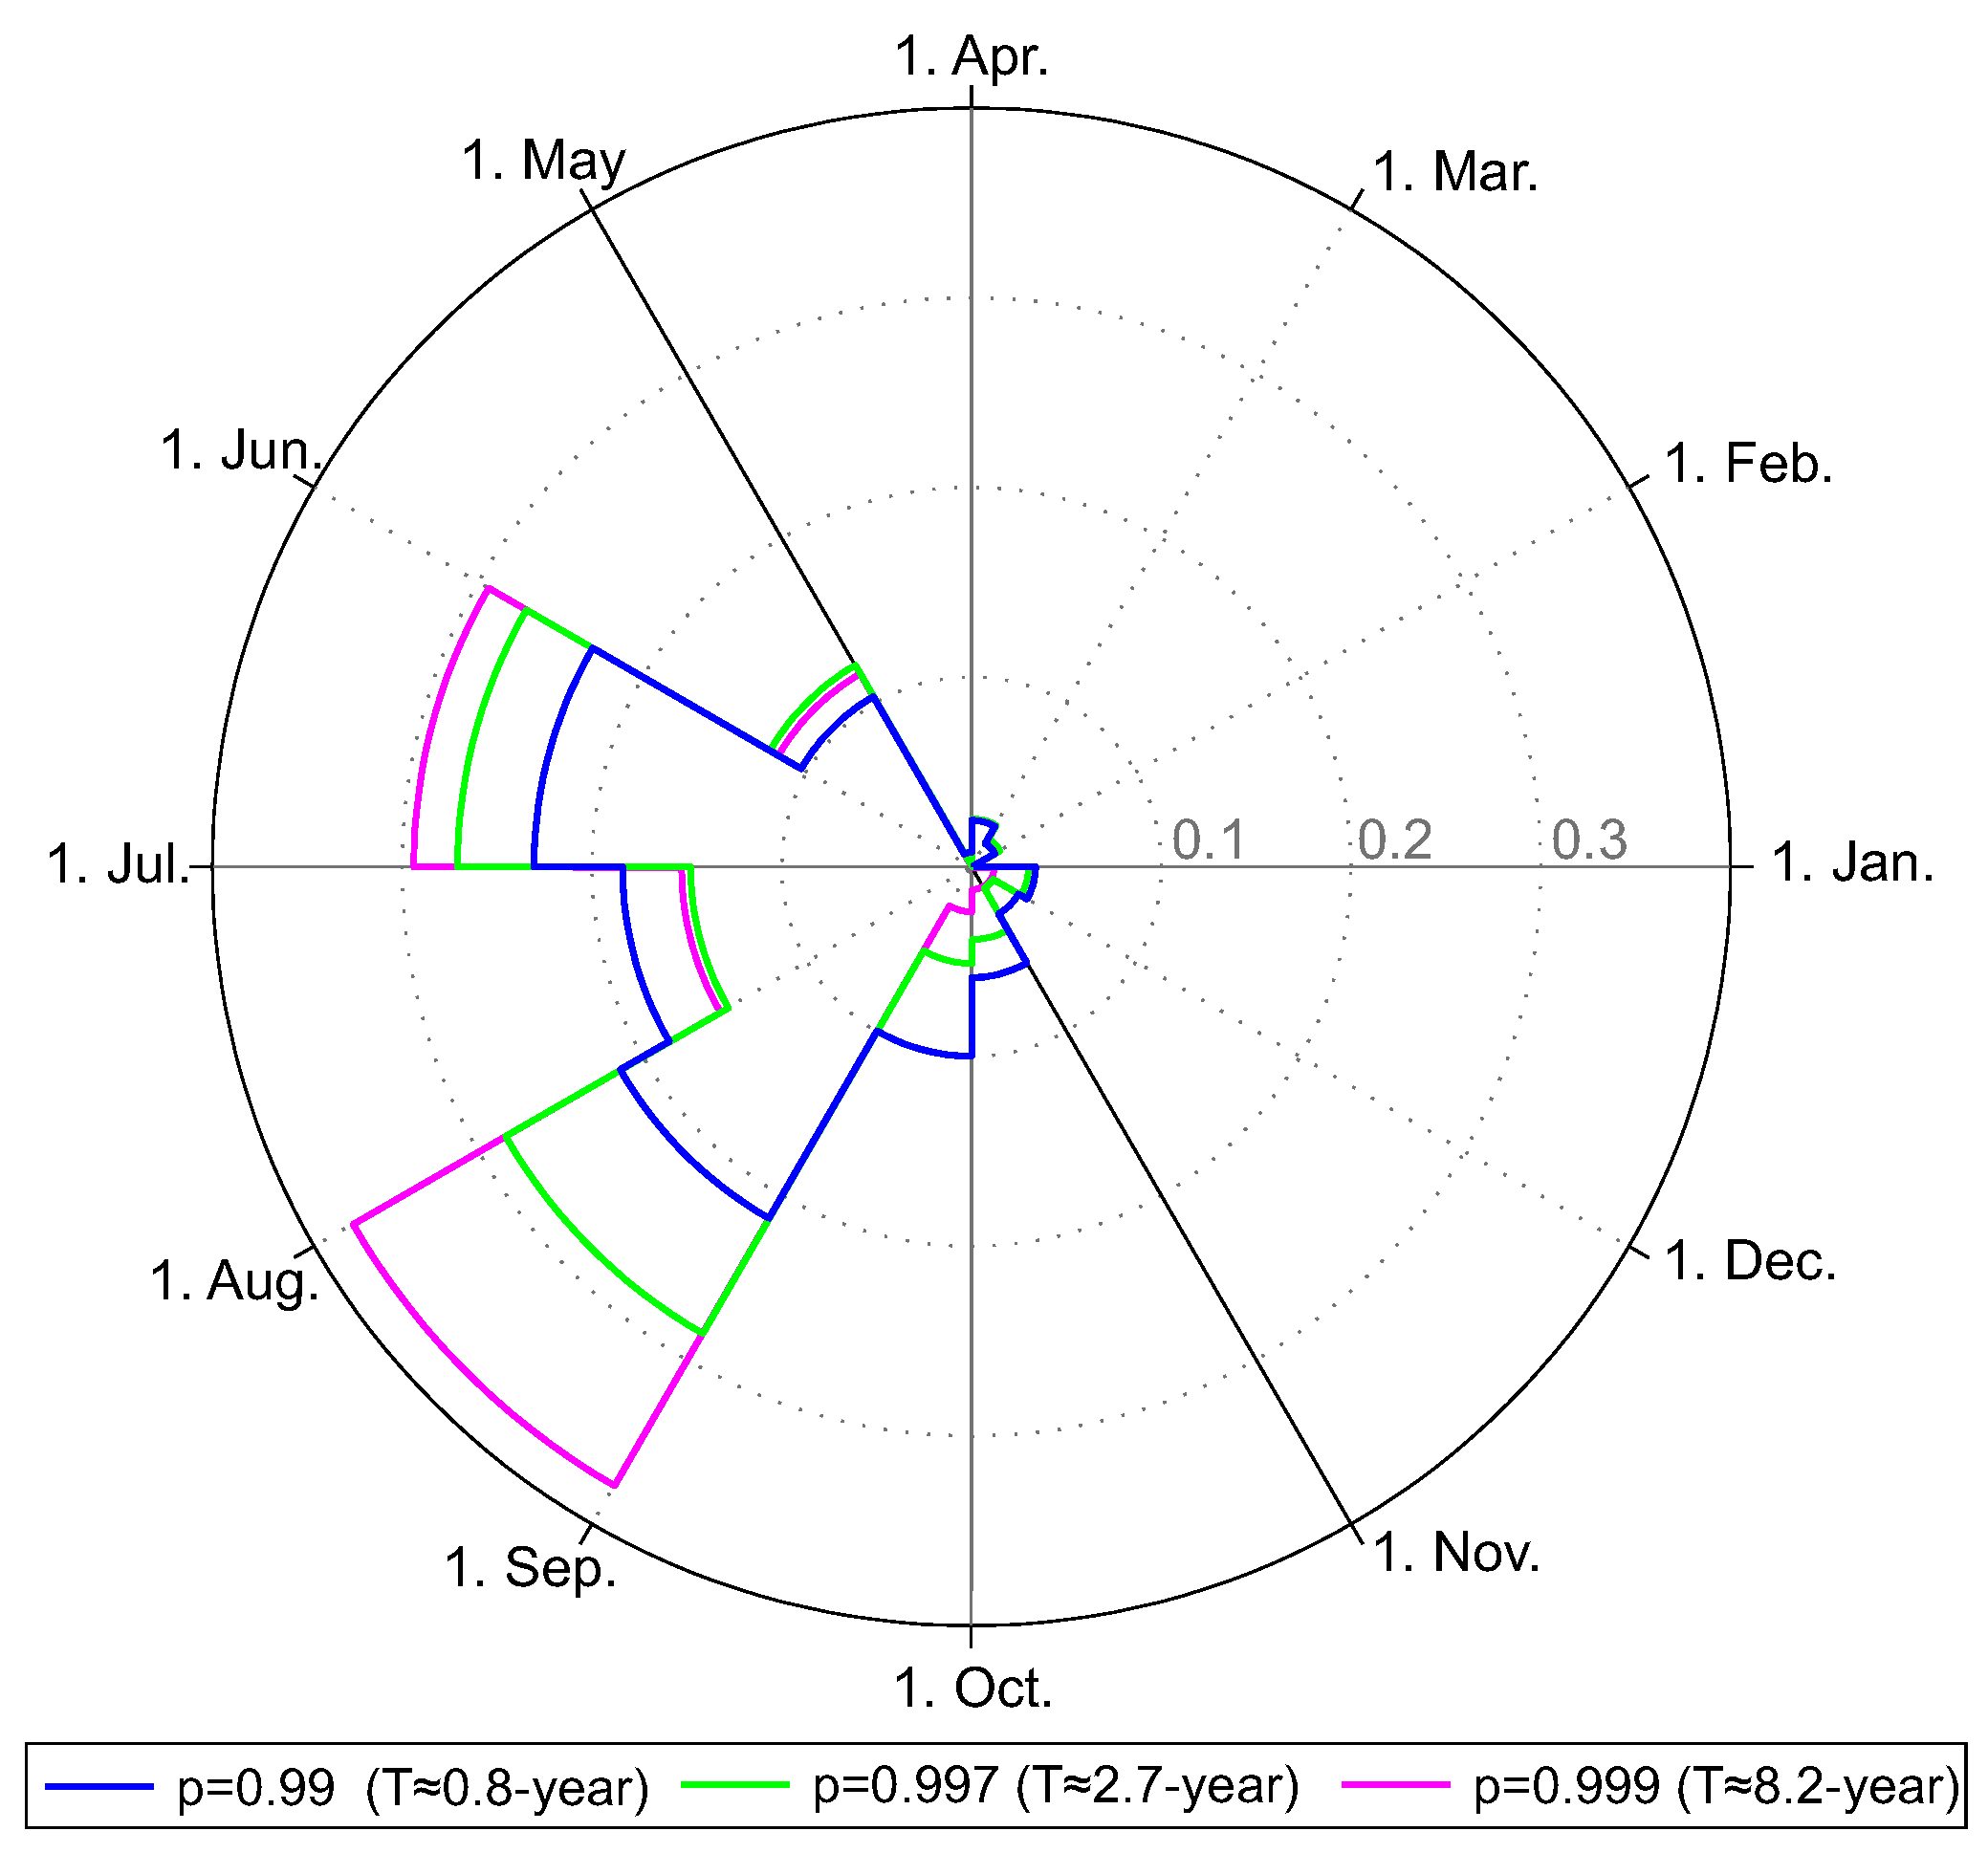
3.3. Seasonality of Runoff
3.4. Interpretation of Extremes
4. Heffernan and Tawn Model
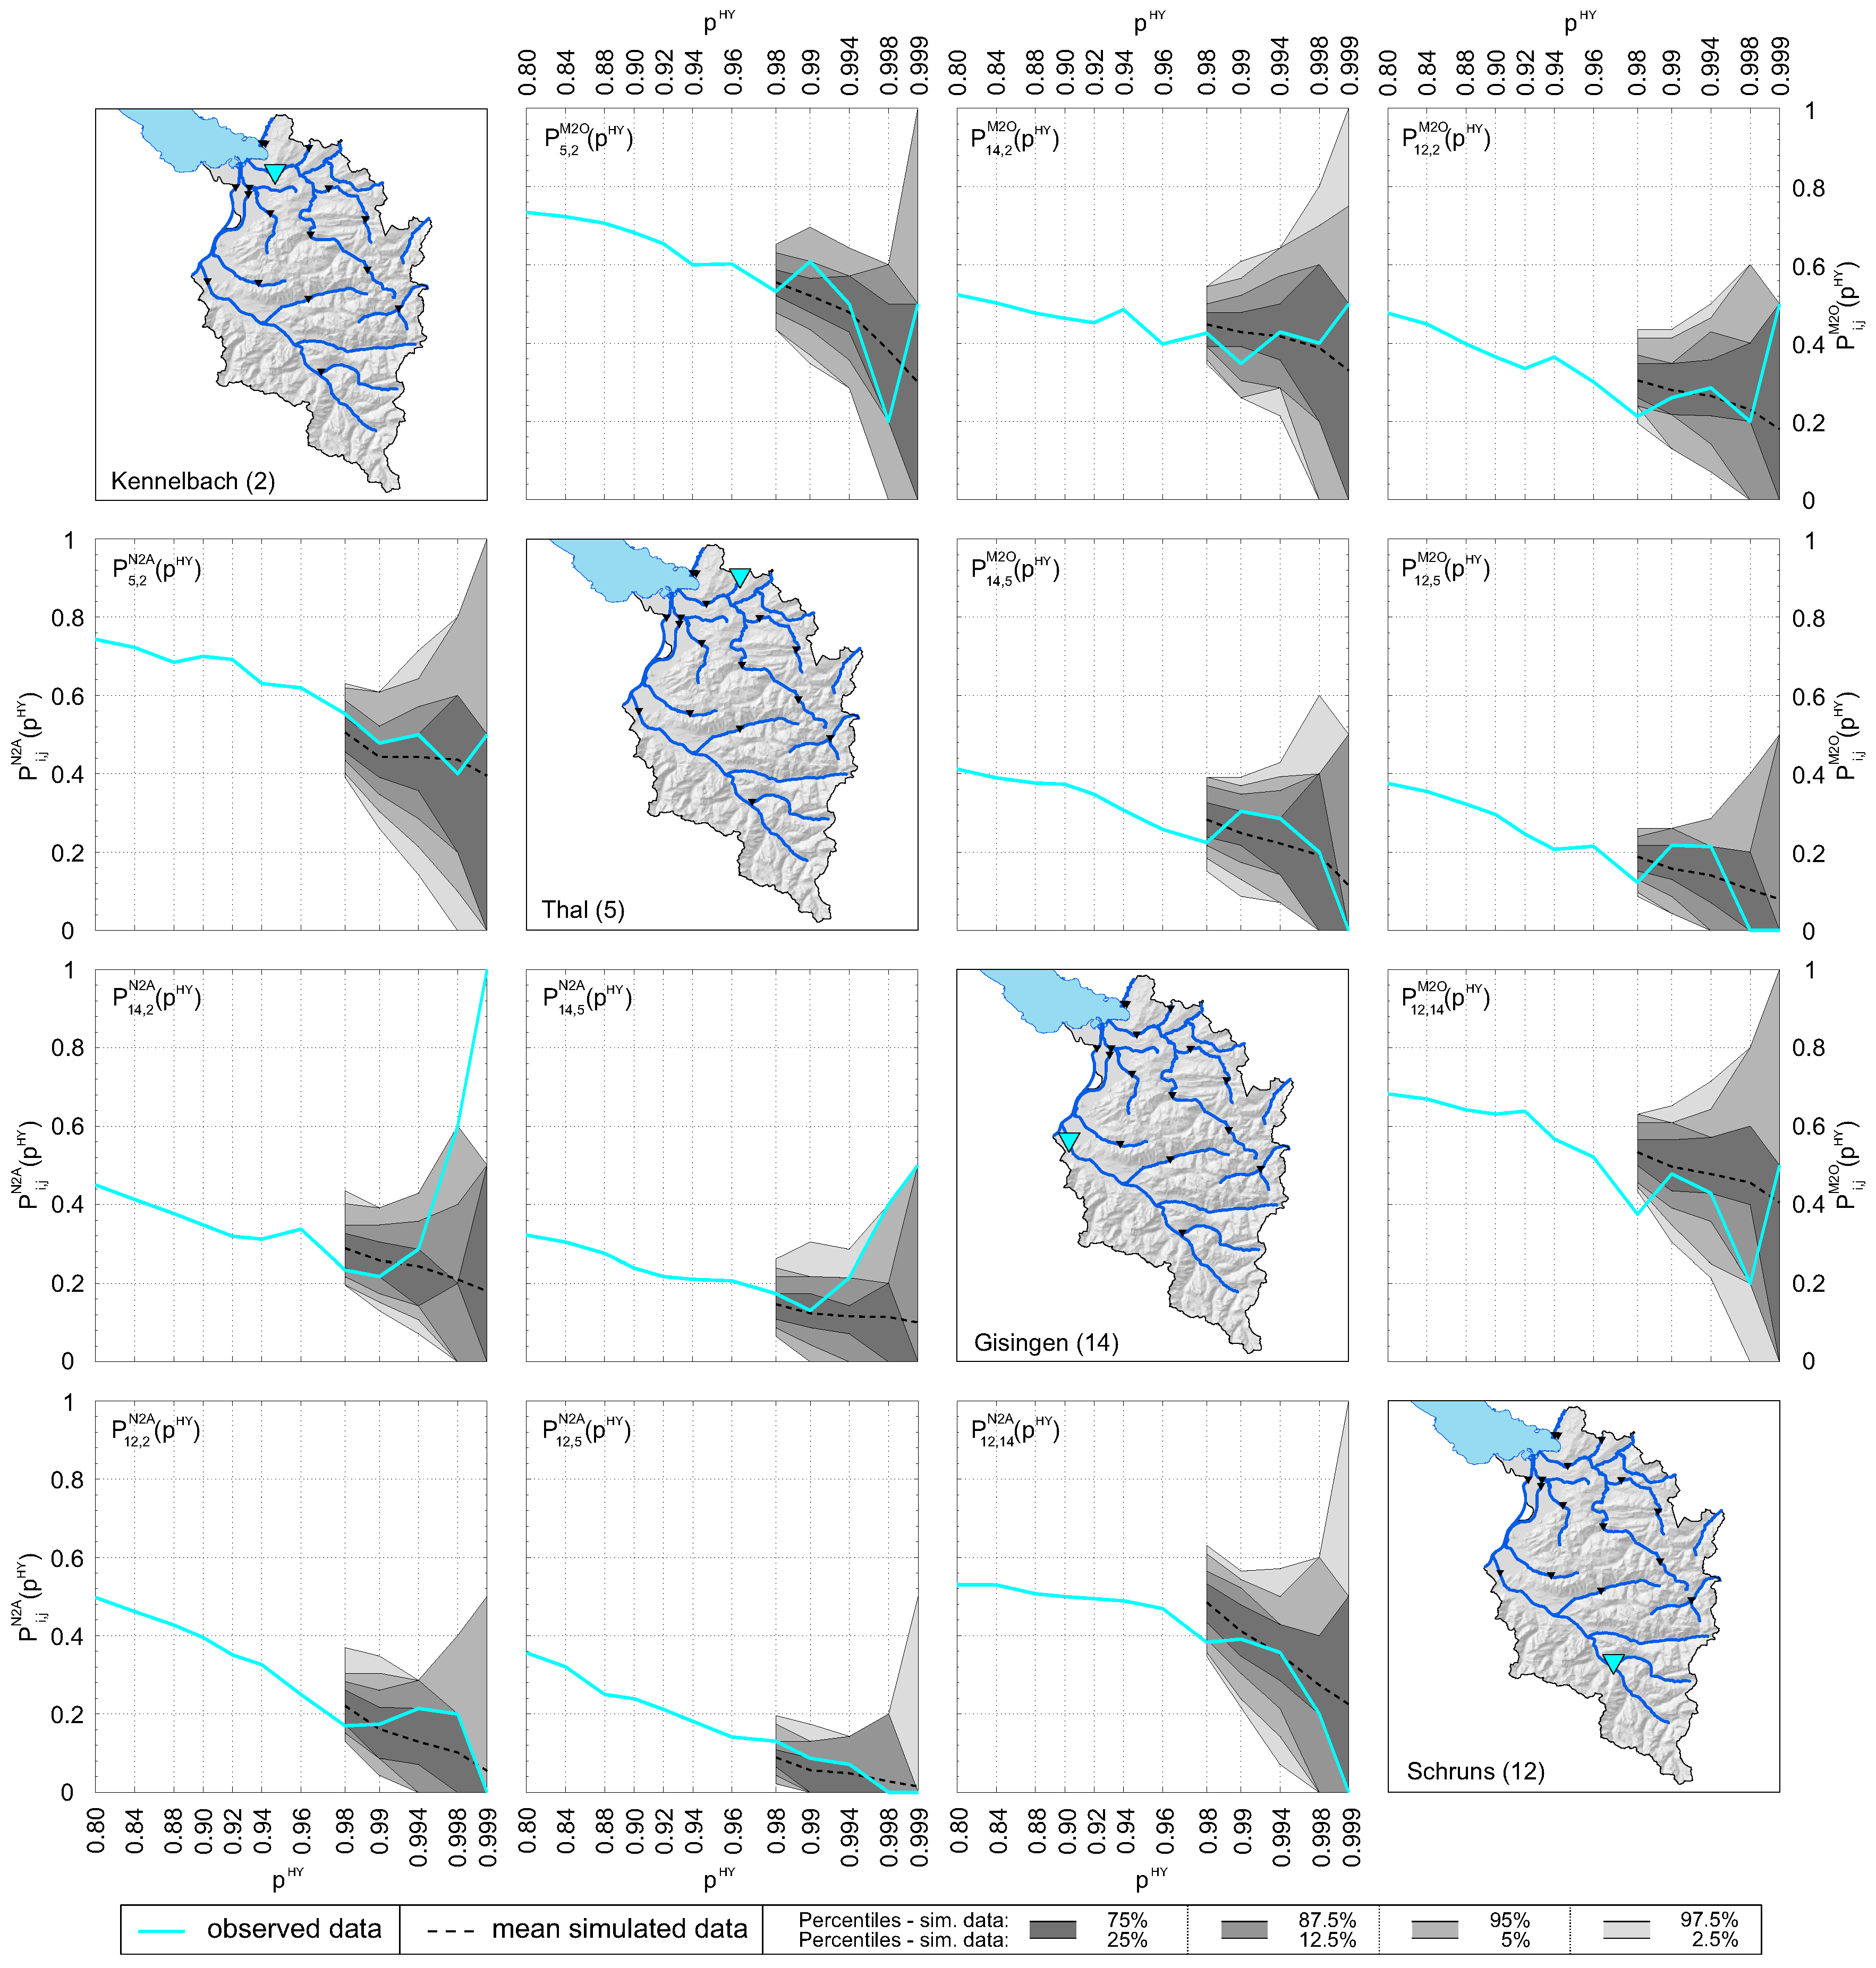
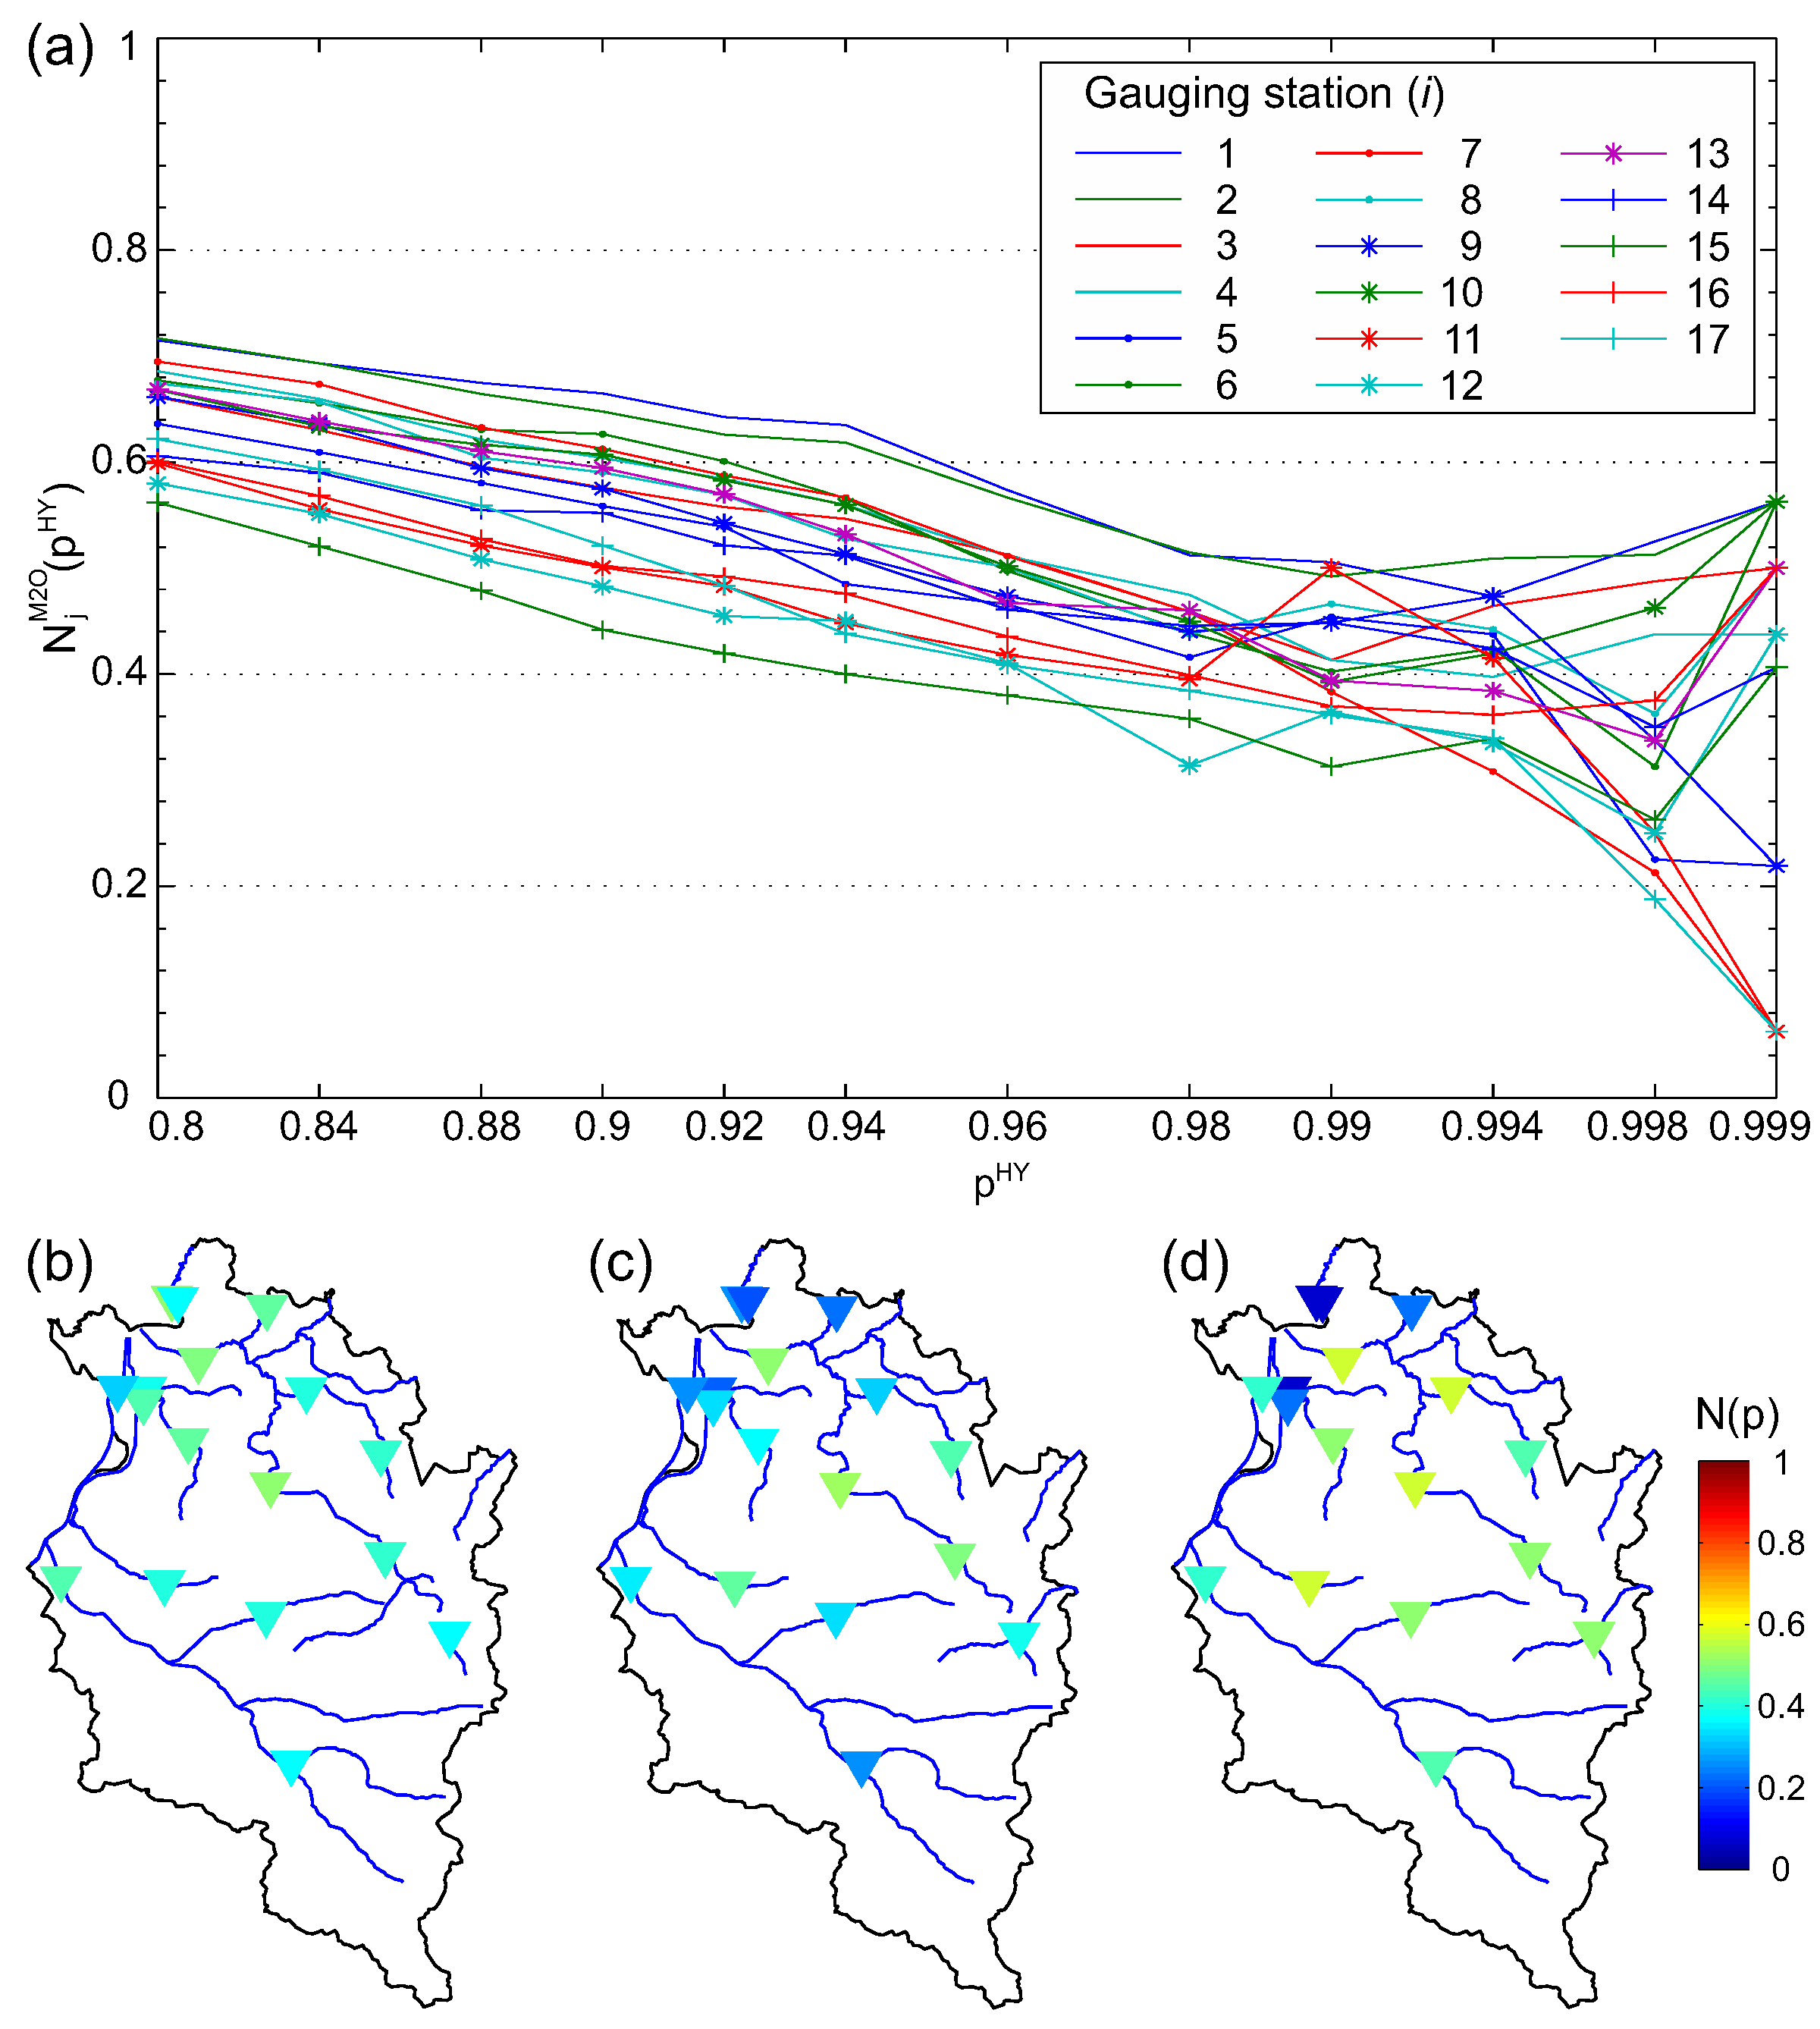
4.1. Spatial Dependence Measures
4.2. Statistical Model
4.2.1. Marginal Model
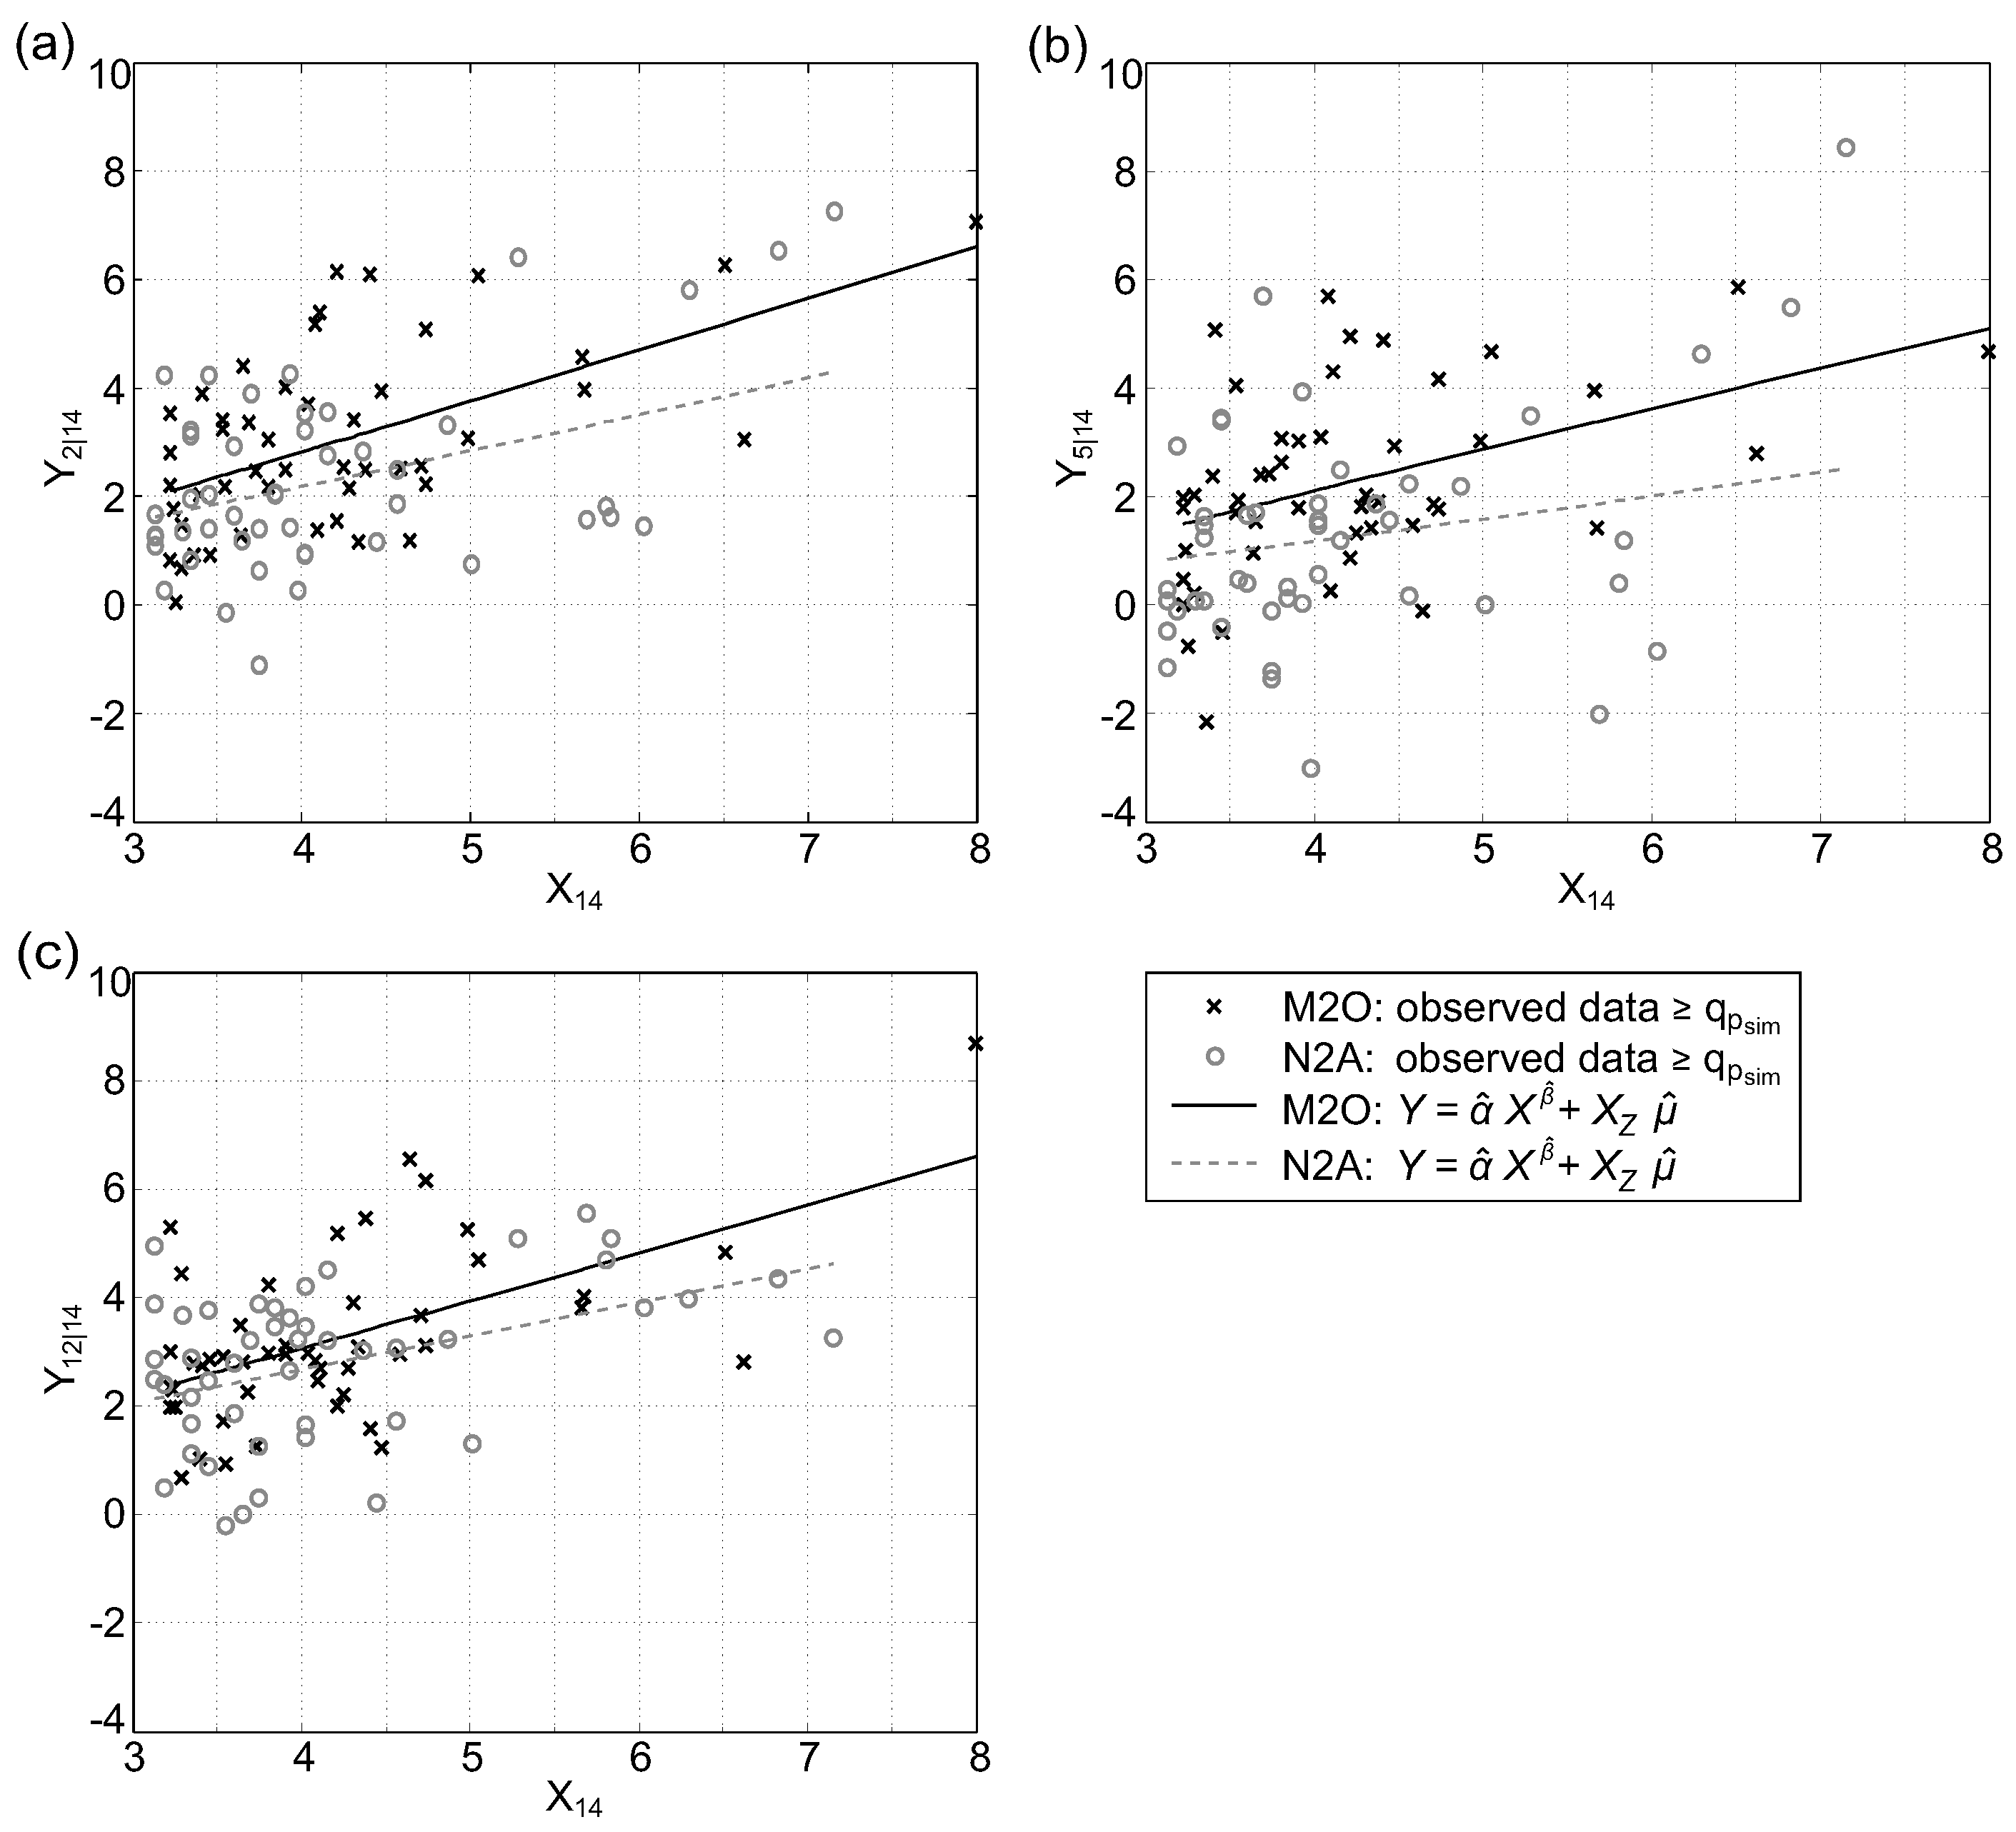
4.2.2. Dependence Model
4.3. Estimation and Simulation
4.3.1. Estimation of Marginal Distribution
4.3.2. Marginal Transformation
4.3.3. Parameter Estimation
4.3.4. Simulation of the Conditioning River Flow X
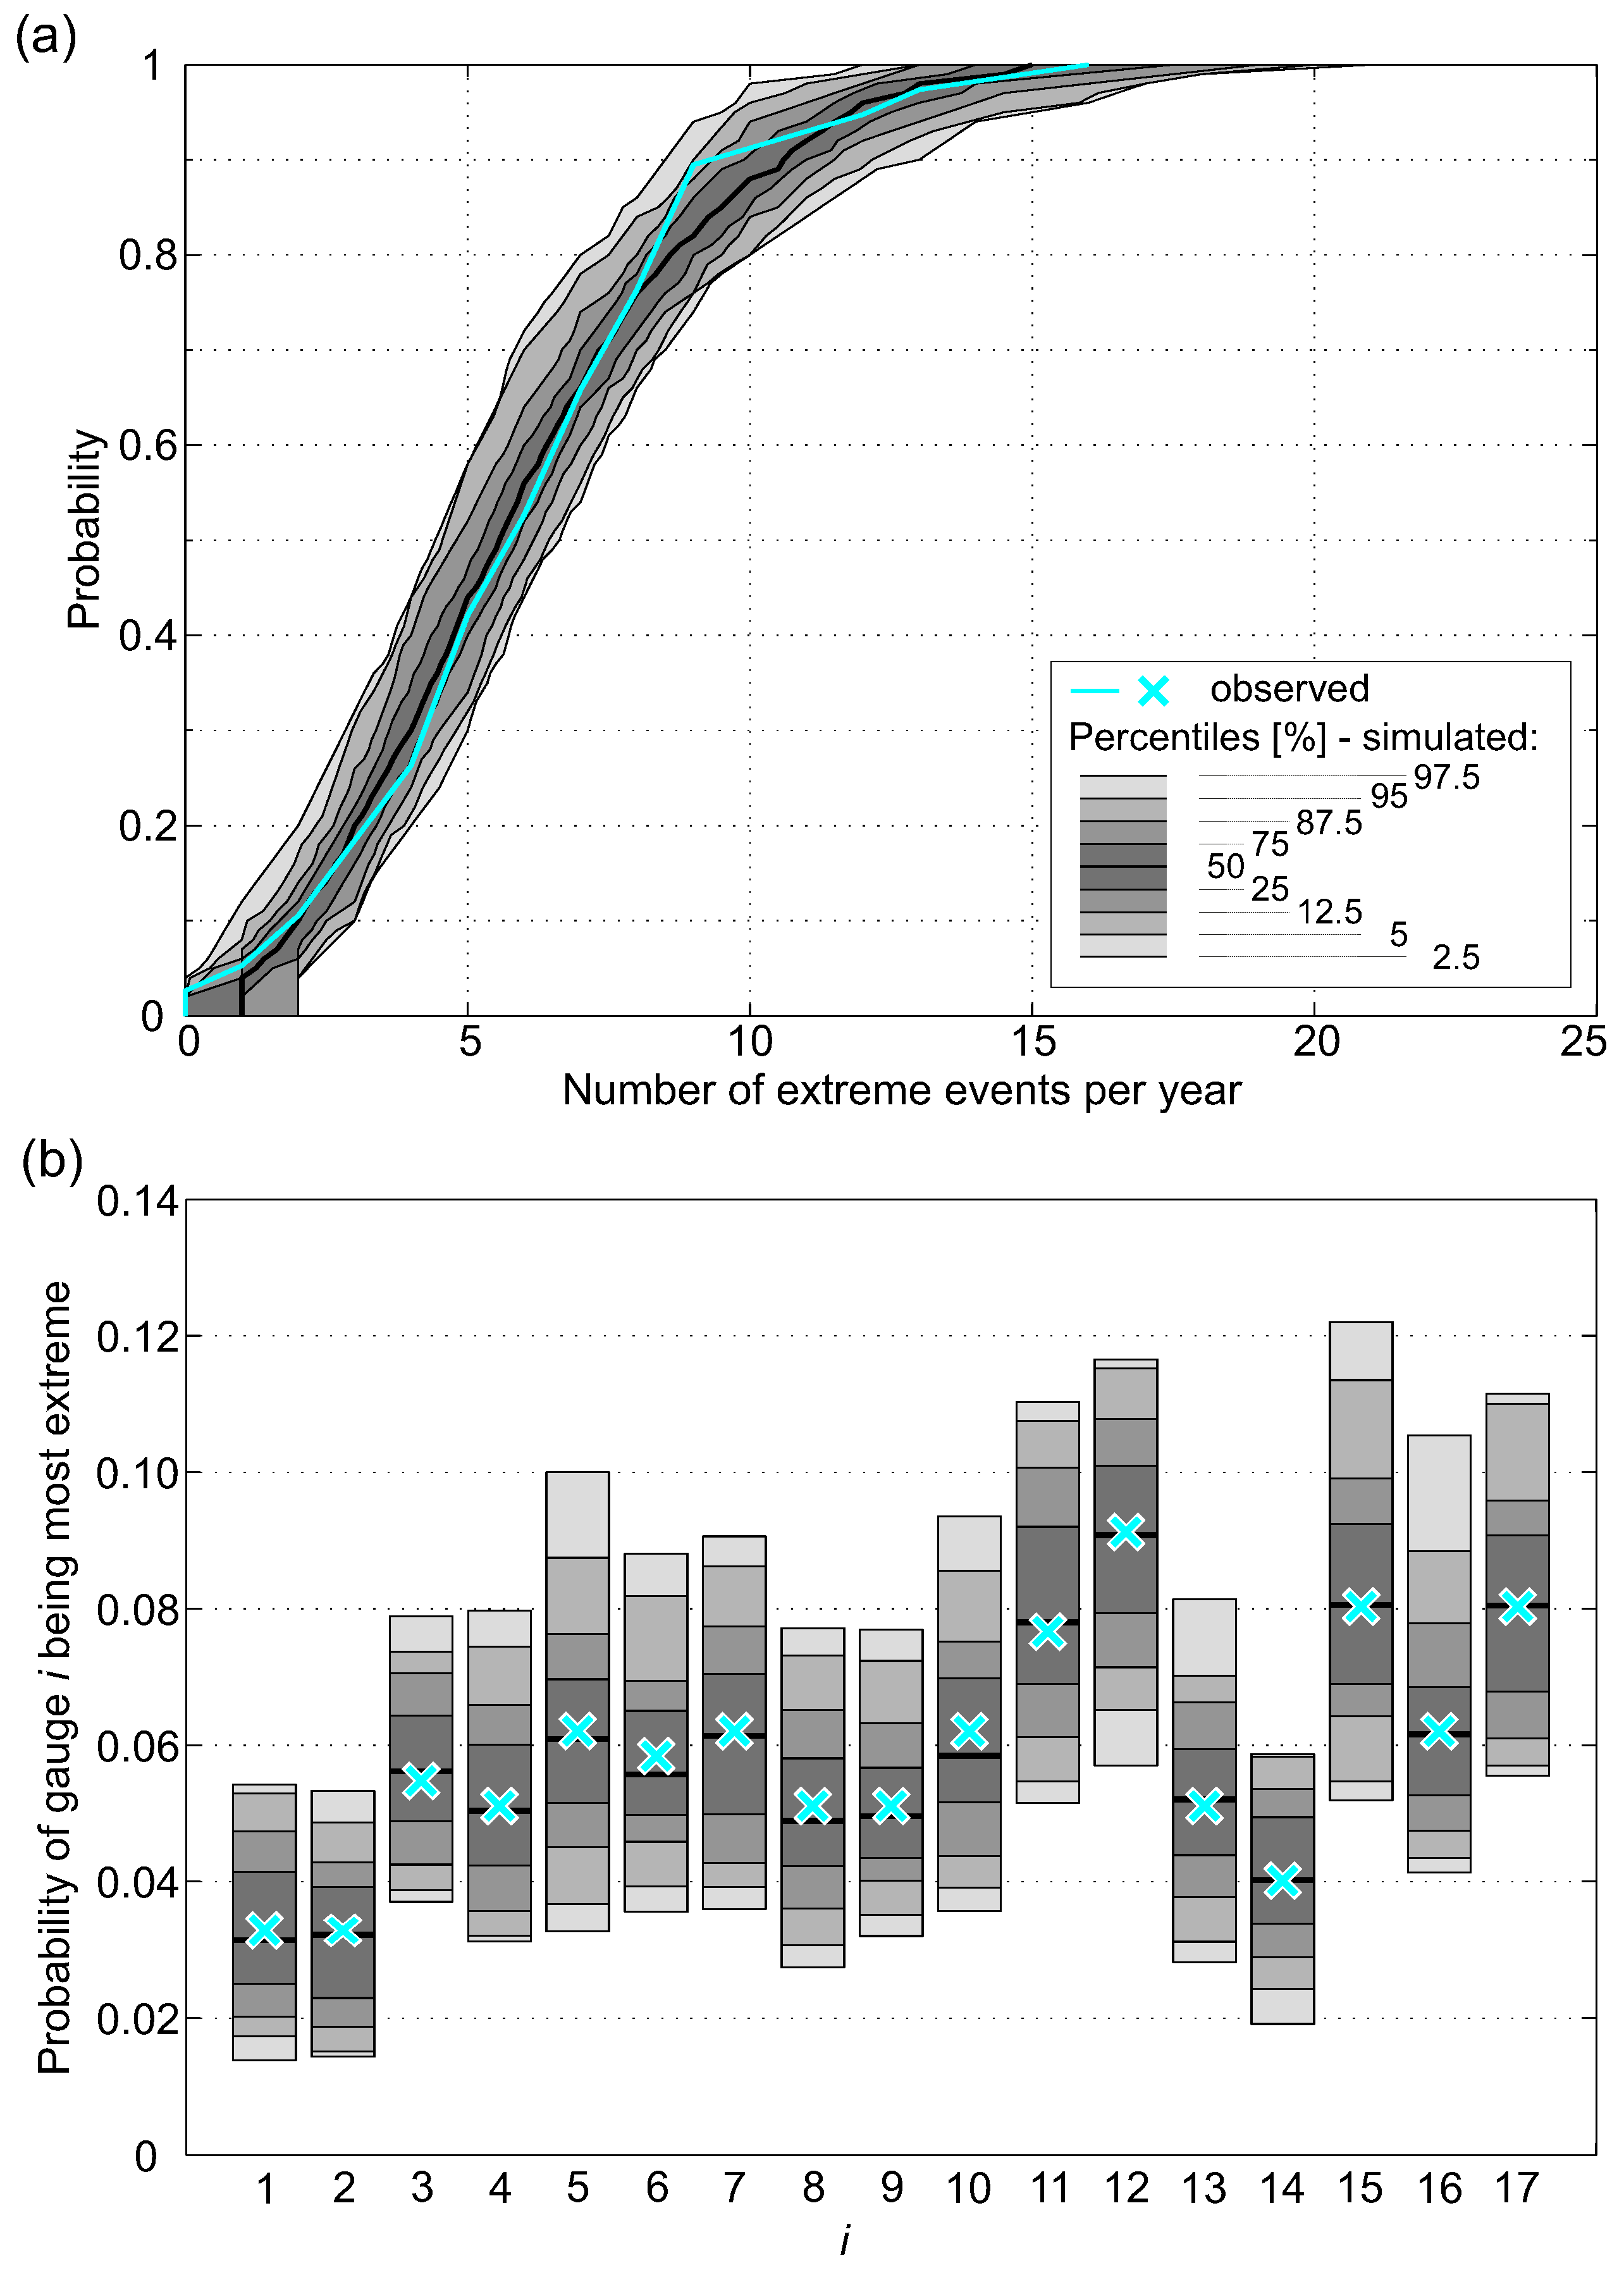
- Number of simulated extreme events per simulation period: The number of extreme events i.e., where at least one site exceeds ) per simulation period (e.g., all-year-, half-year series) is approximated by a negative binominal distribution.
- Selection of conditioning gauge: The set of extreme events S is partitioned to , where is the set of extreme events where gauge i has the highest non-exceedance probability i.e., is the most extreme one). Then, for an event the probability that gauge i is the most extreme if at least one gauge is extreme has to be estimated using given data. The gauge that is selected as conditioning variable X is drawn from a multinomial distribution with these probabilities. Denote the index of the selected gauge by .
- Drawing the conditioning : According to the transformation to standard Laplace margins and since is close to one and hence set , where e is drawn from an exponential distribution with mean one.
4.3.5. Simulation of
- Randomly choose one from .
- Find the m nearest neighbours of denoted by and compute the vector of componentwise means of .
- Draw a random sample from a uniform distribution with lower bound and upper bound .
- Deliver .
4.3.6. Simulation of the Dependent Event
4.4. HT Model and Seasonal Characteristics of Runoff
5. Results and Discussion
5.1. Event Definition and Seasonality of Runoff
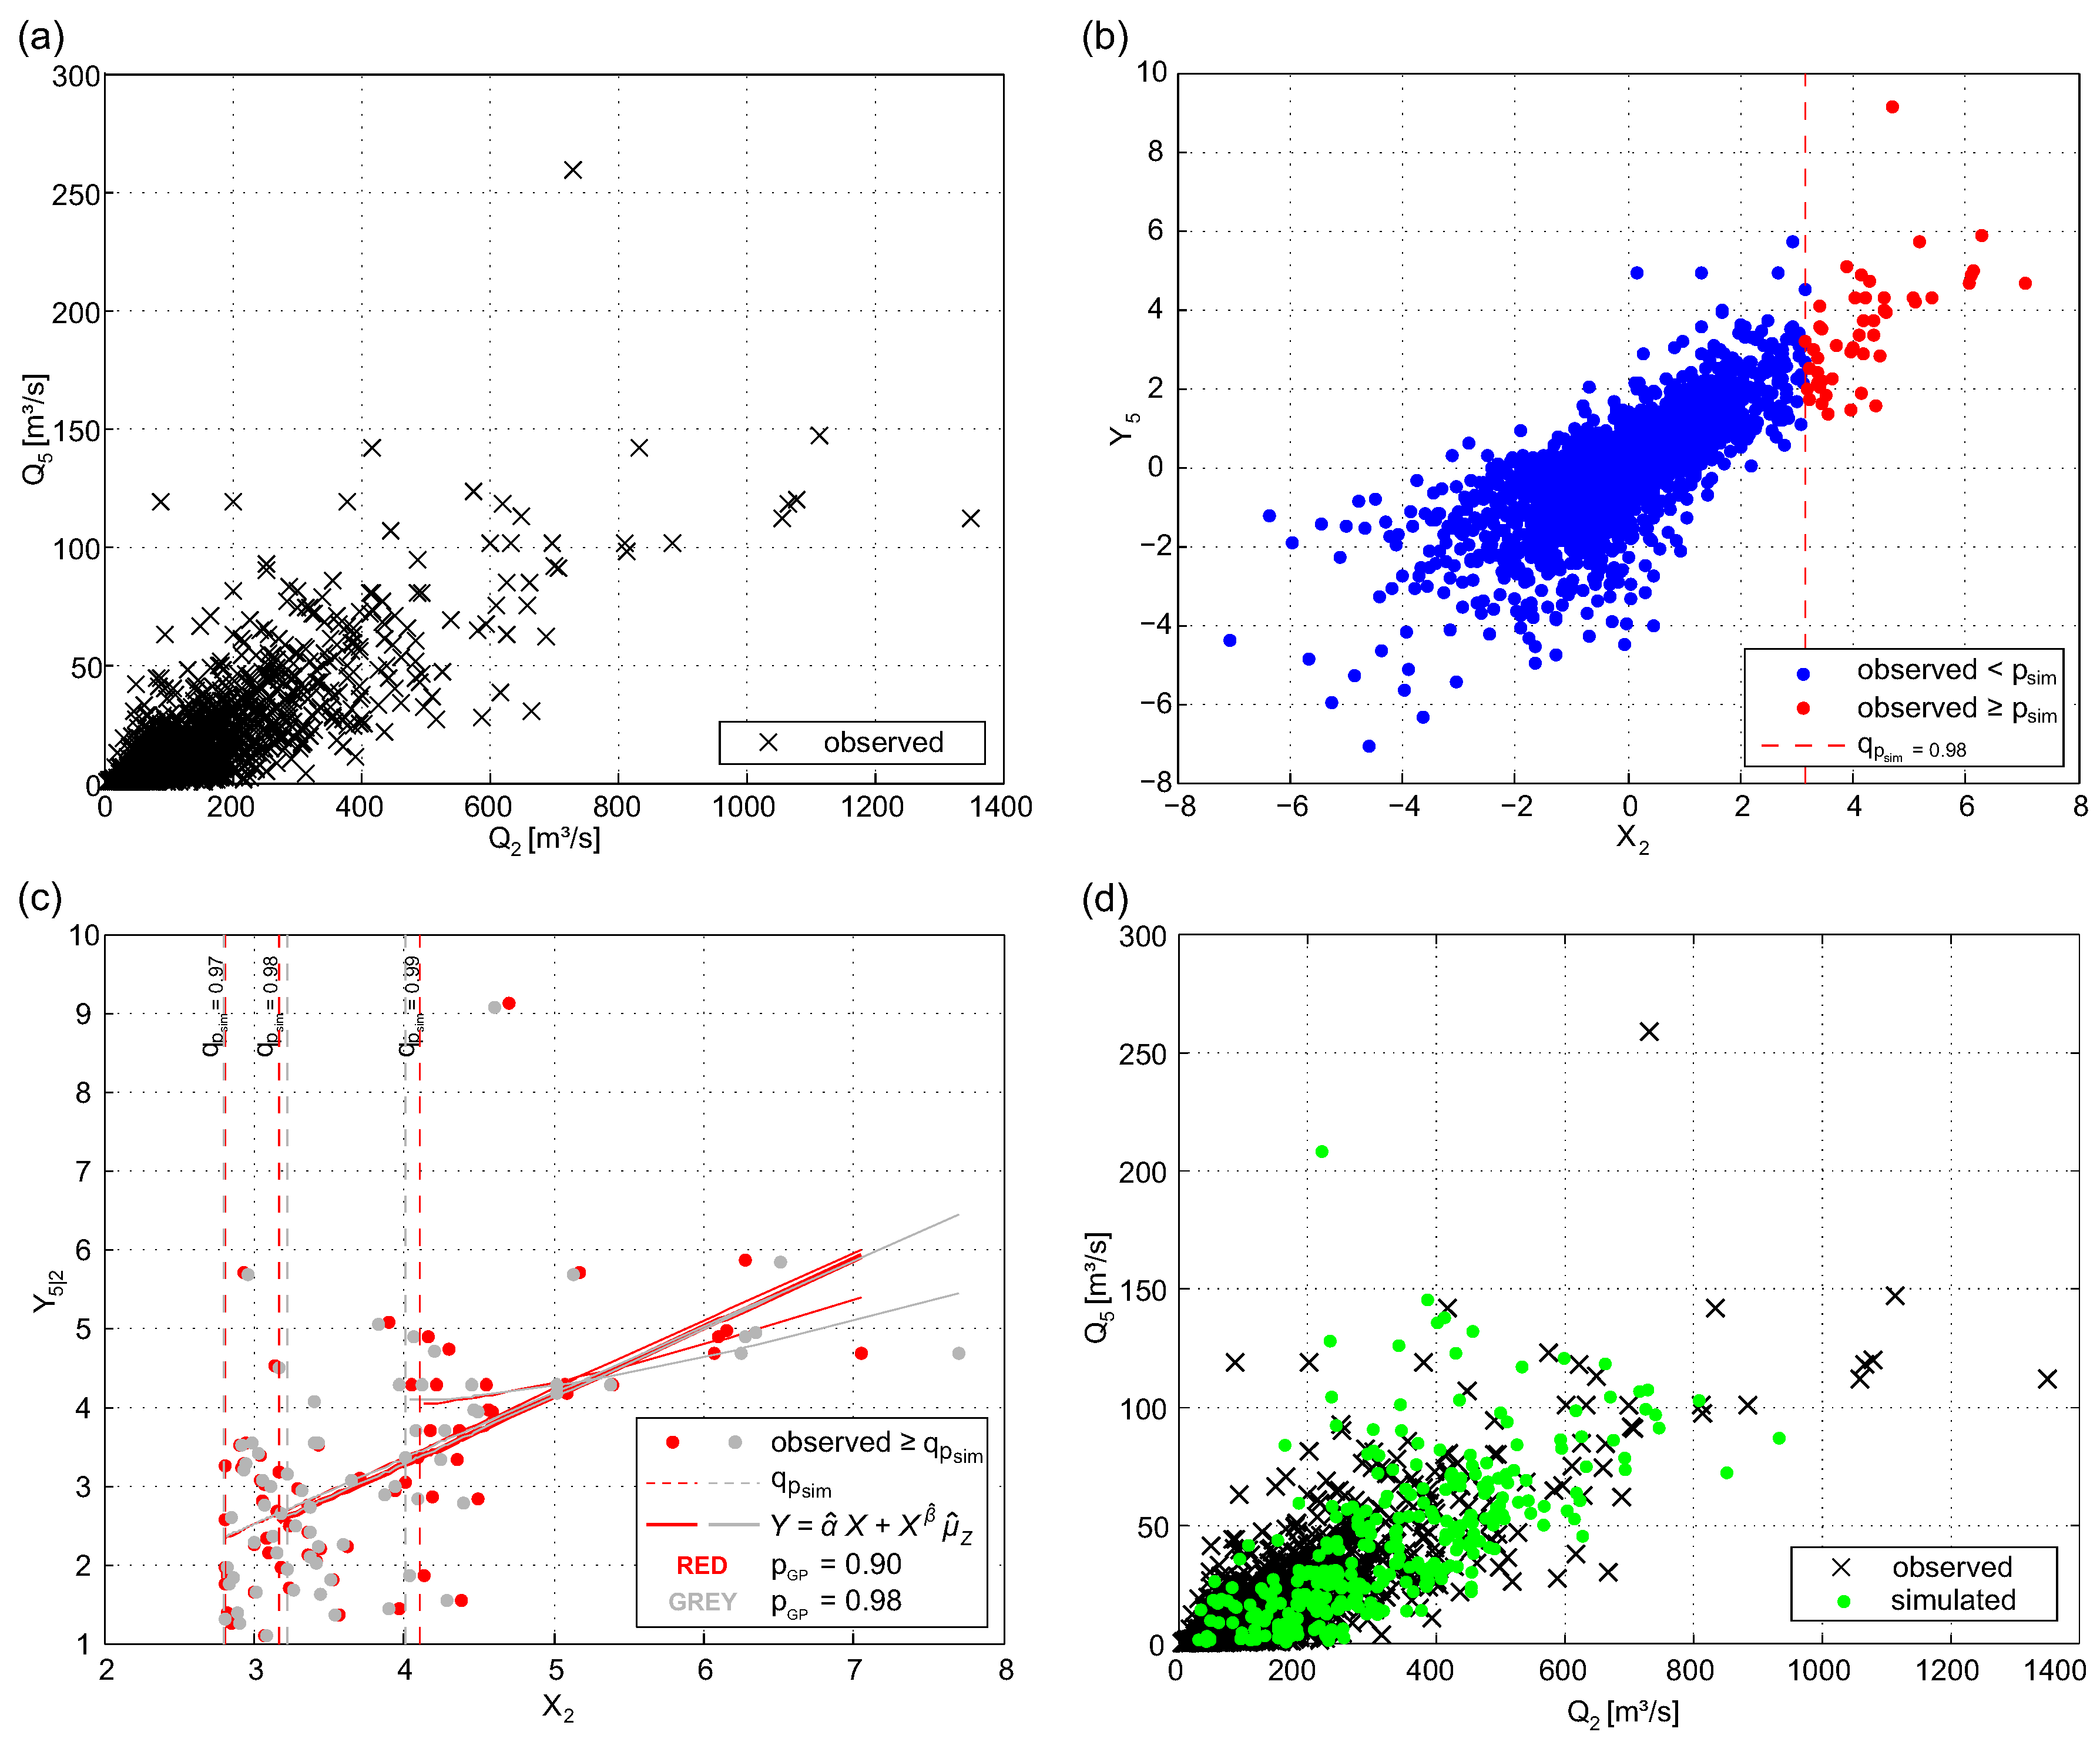
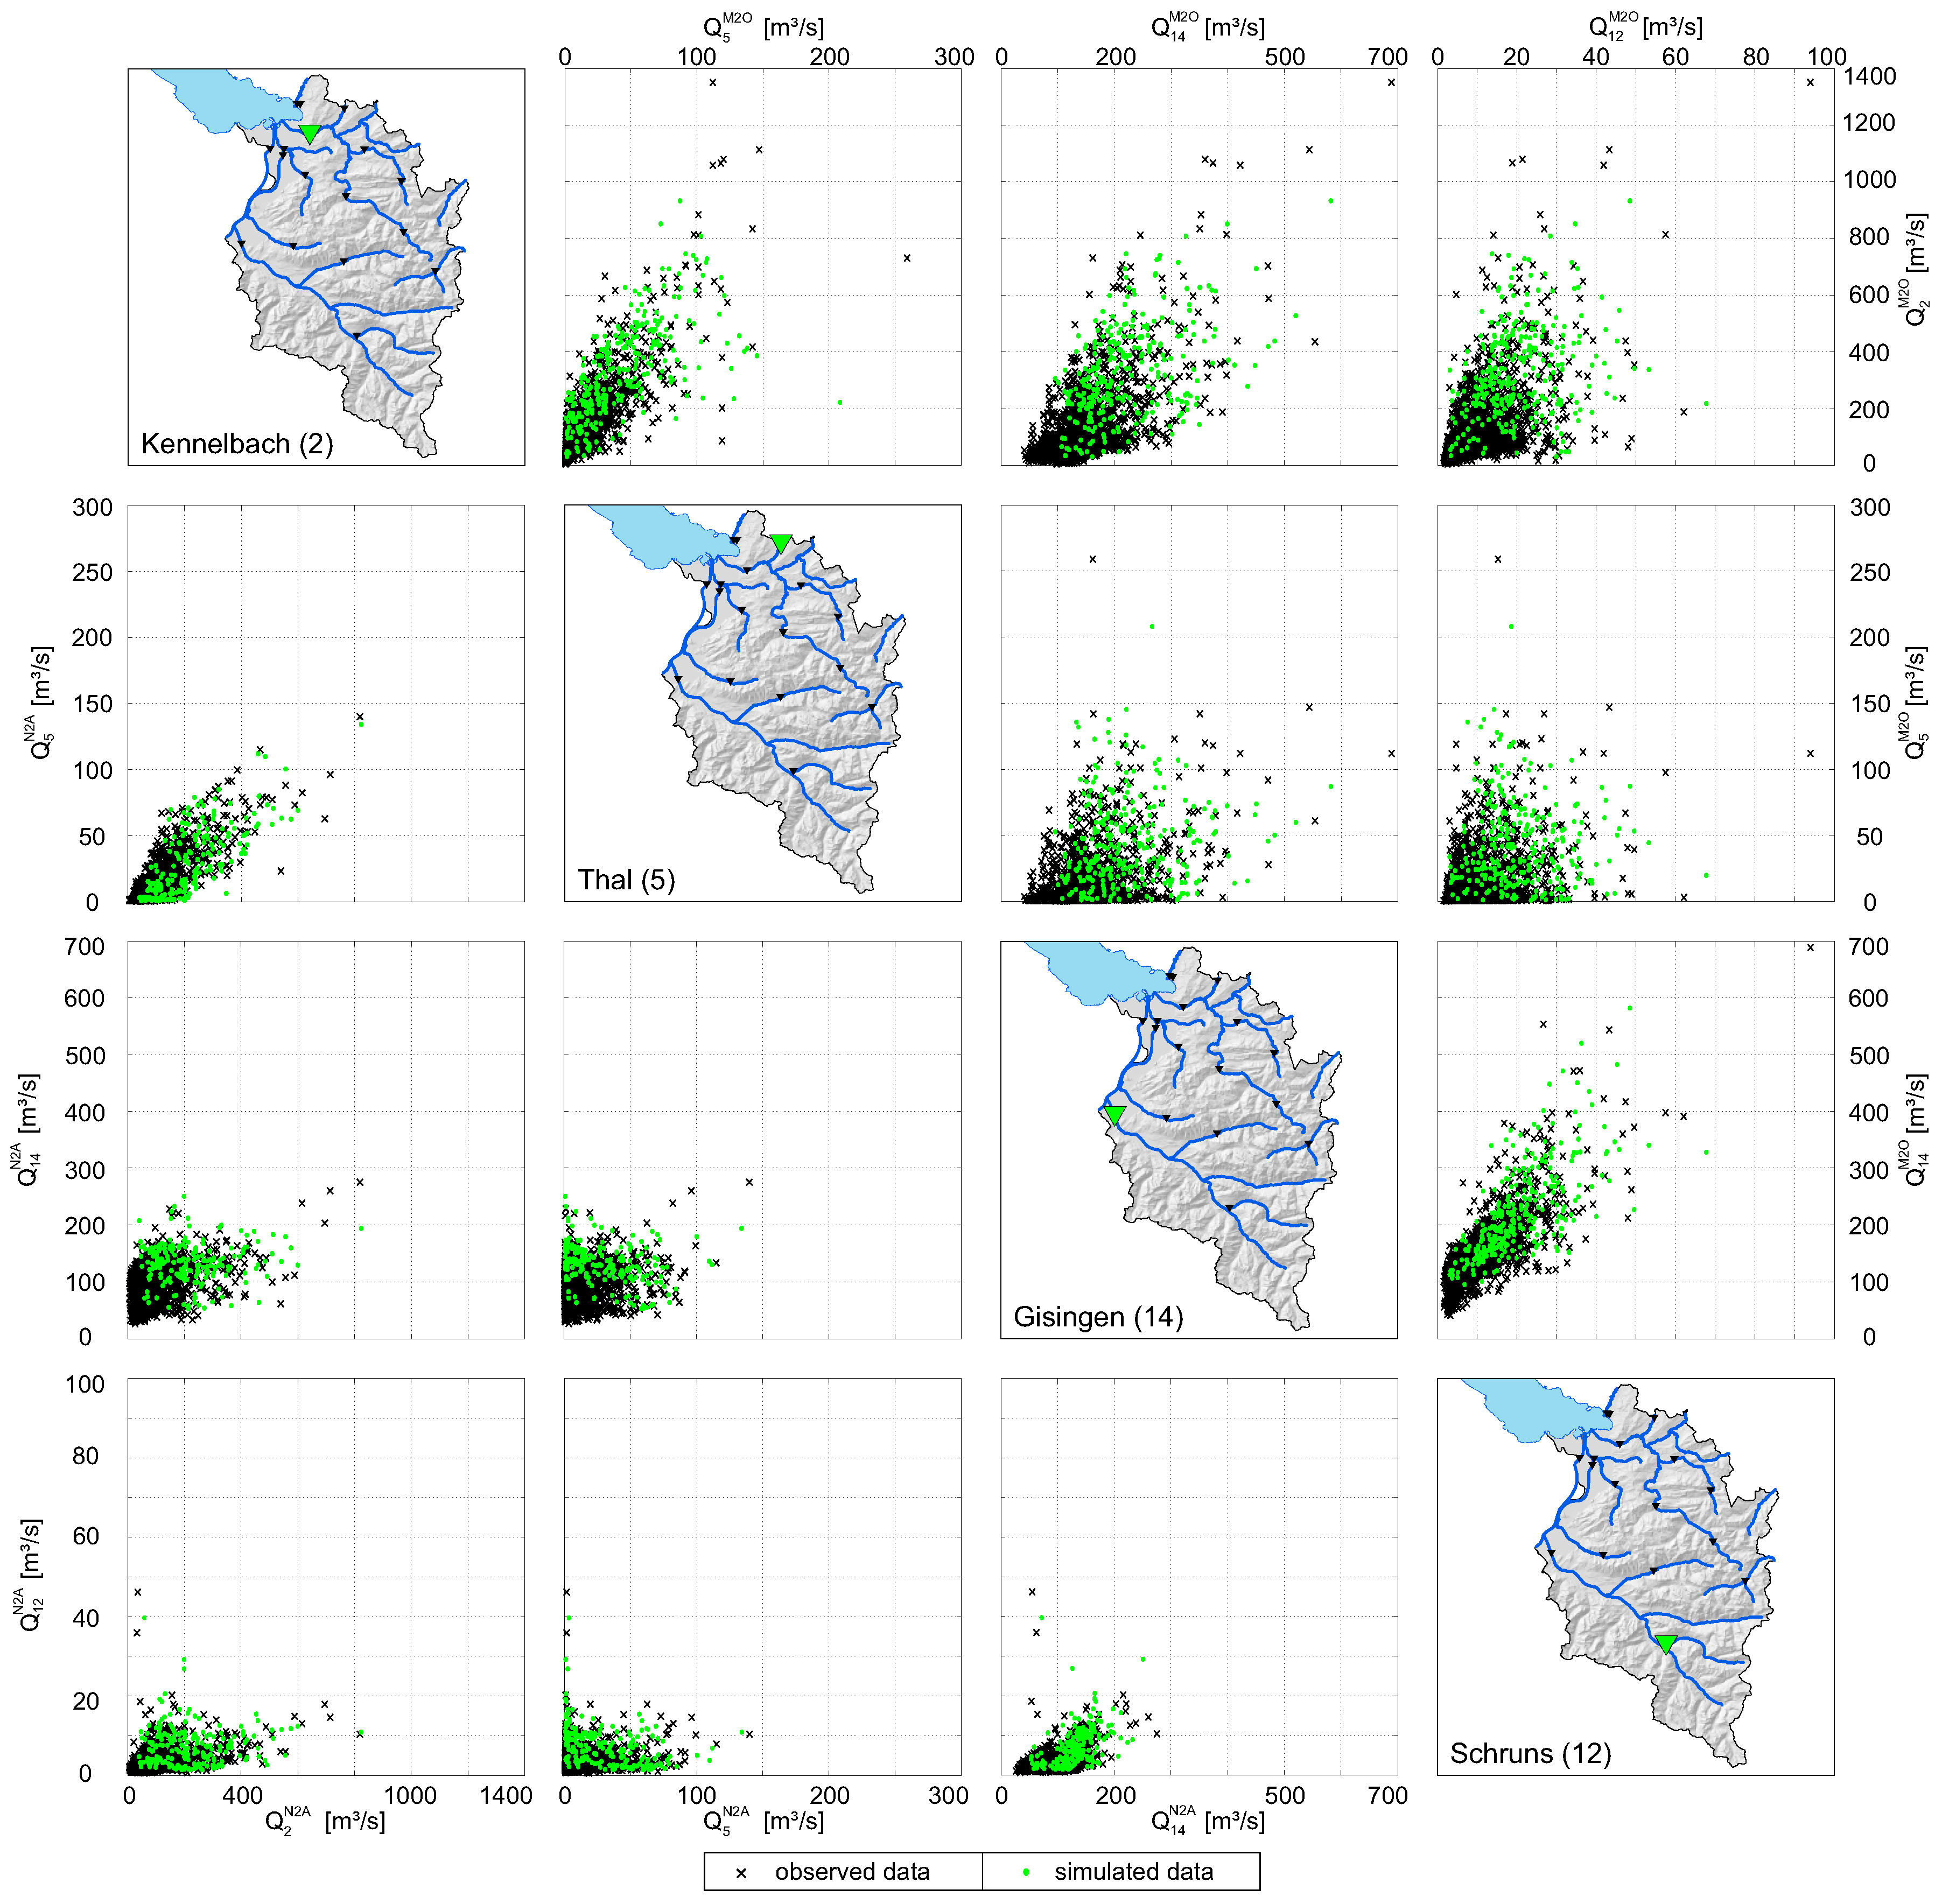
5.2. Spatial Dependence in River Flows
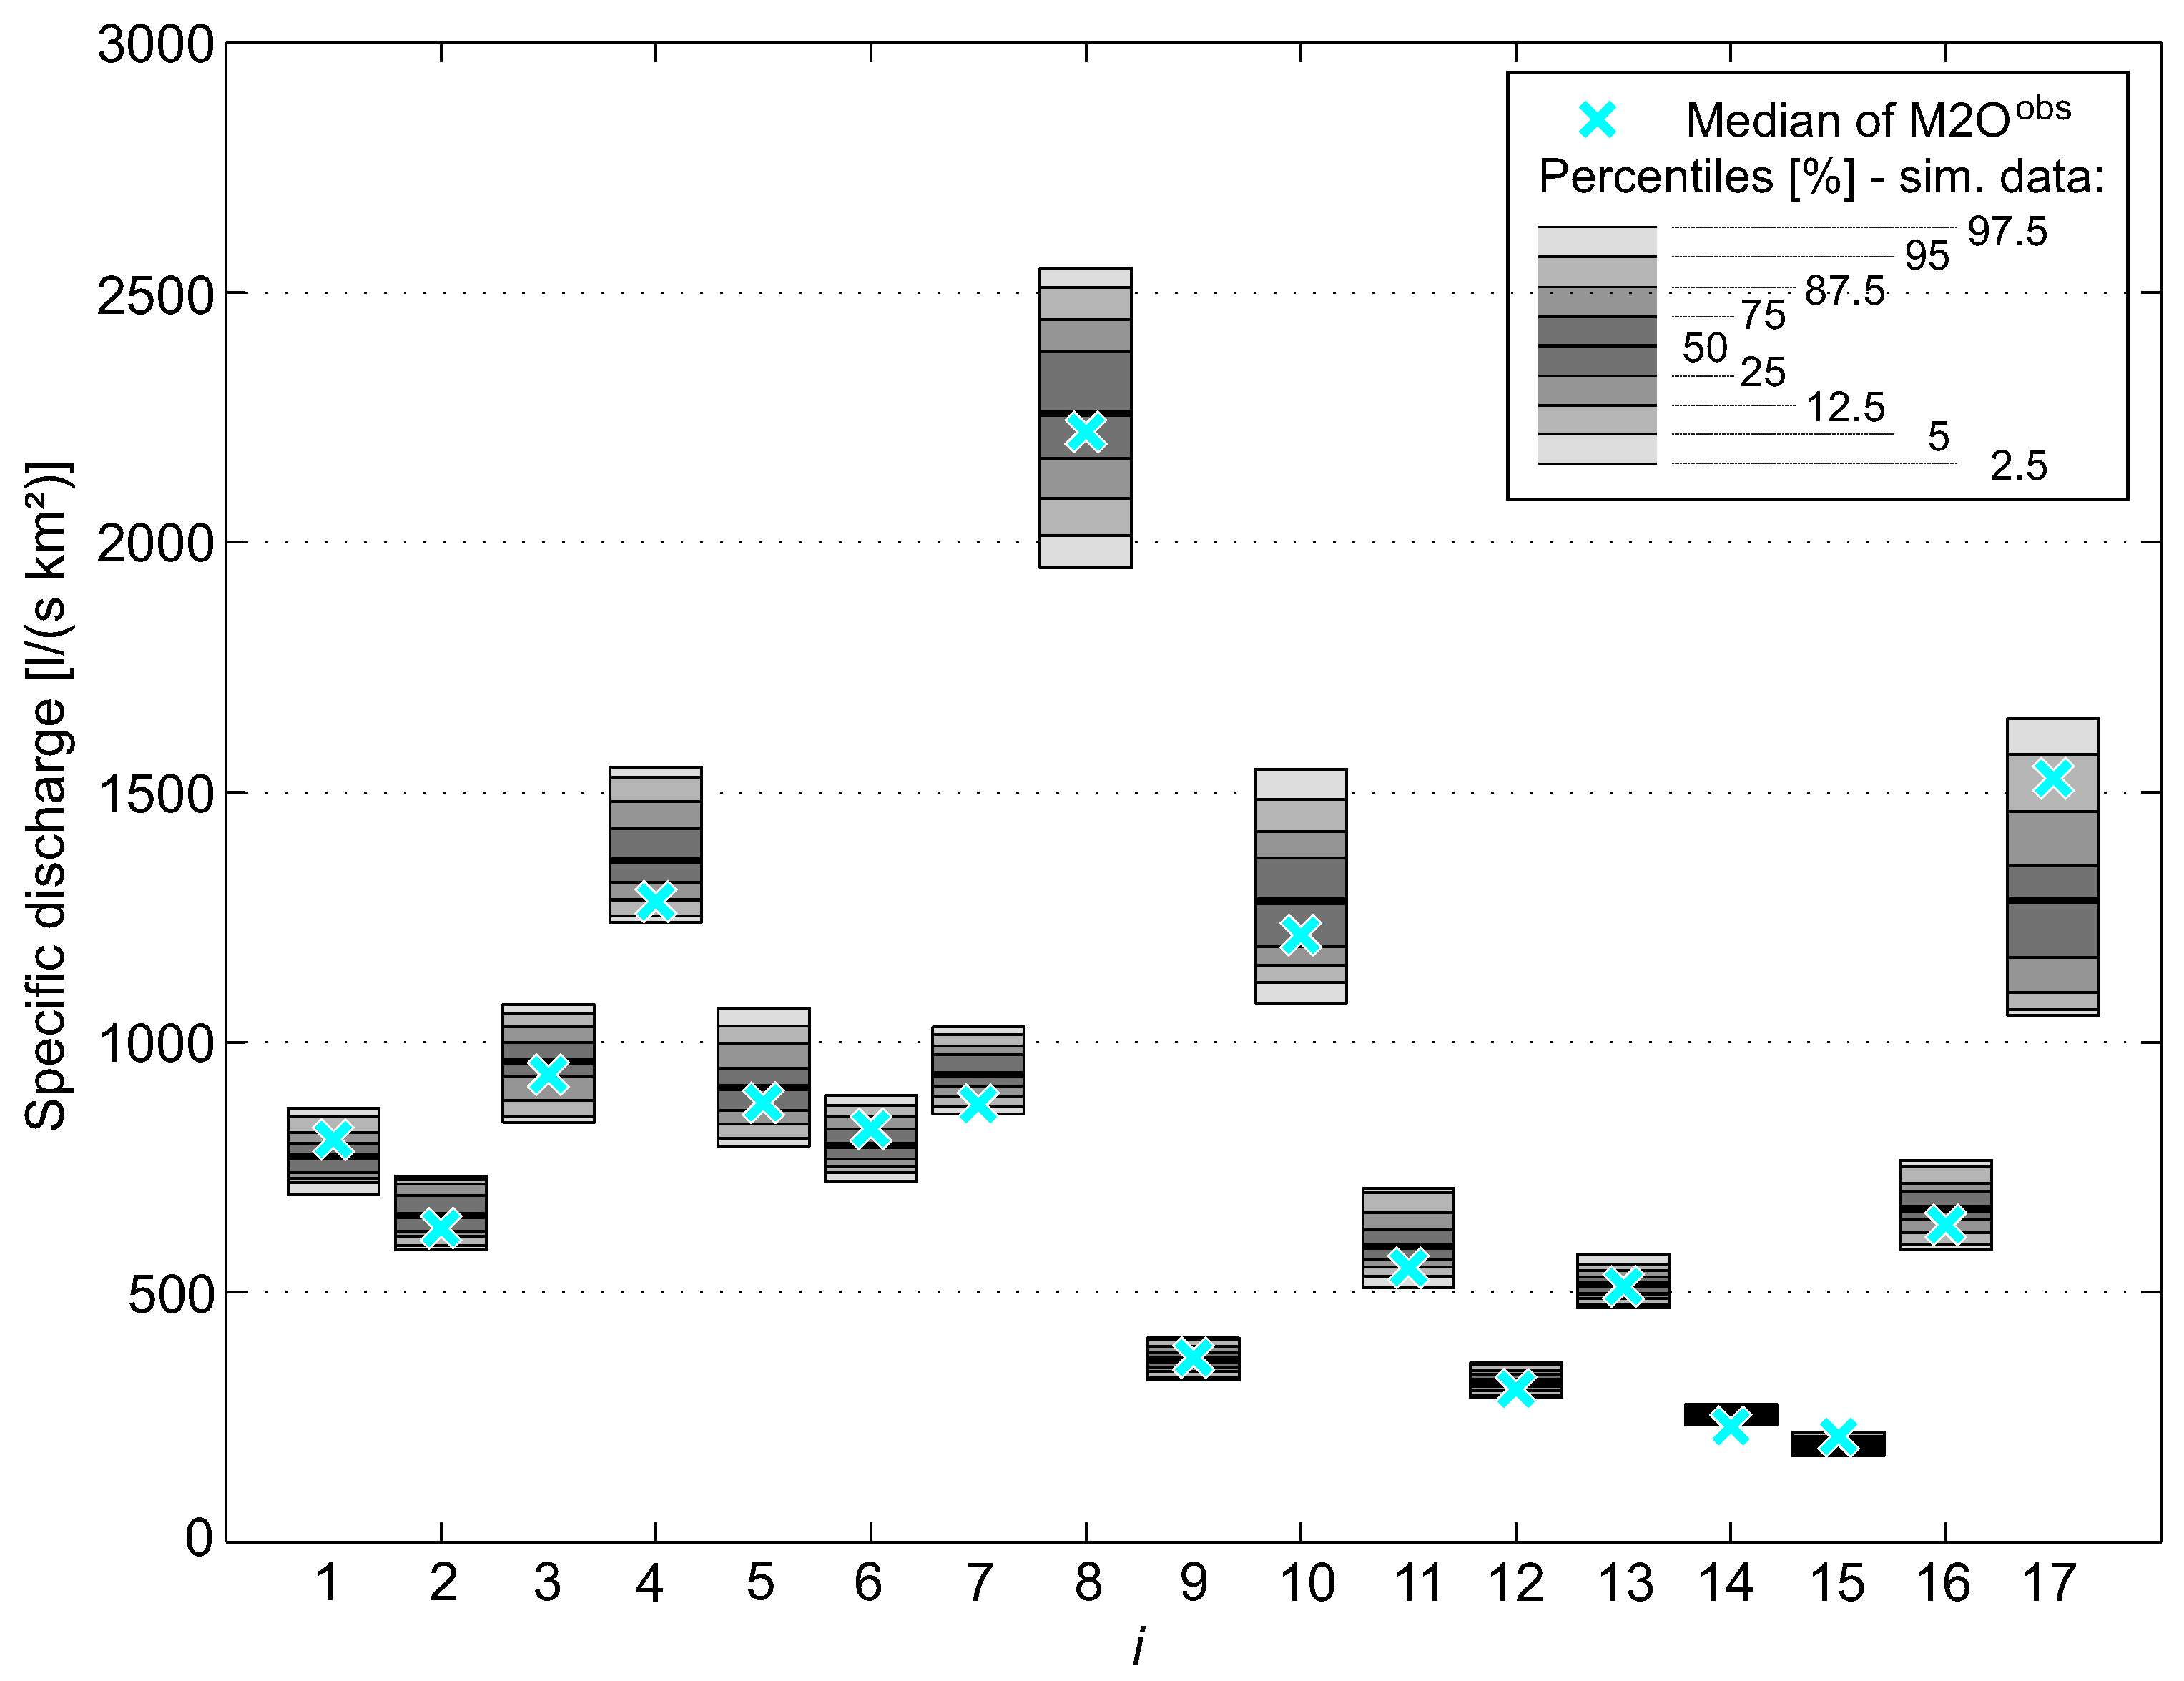
5.3. Estimation Results and Model Checks
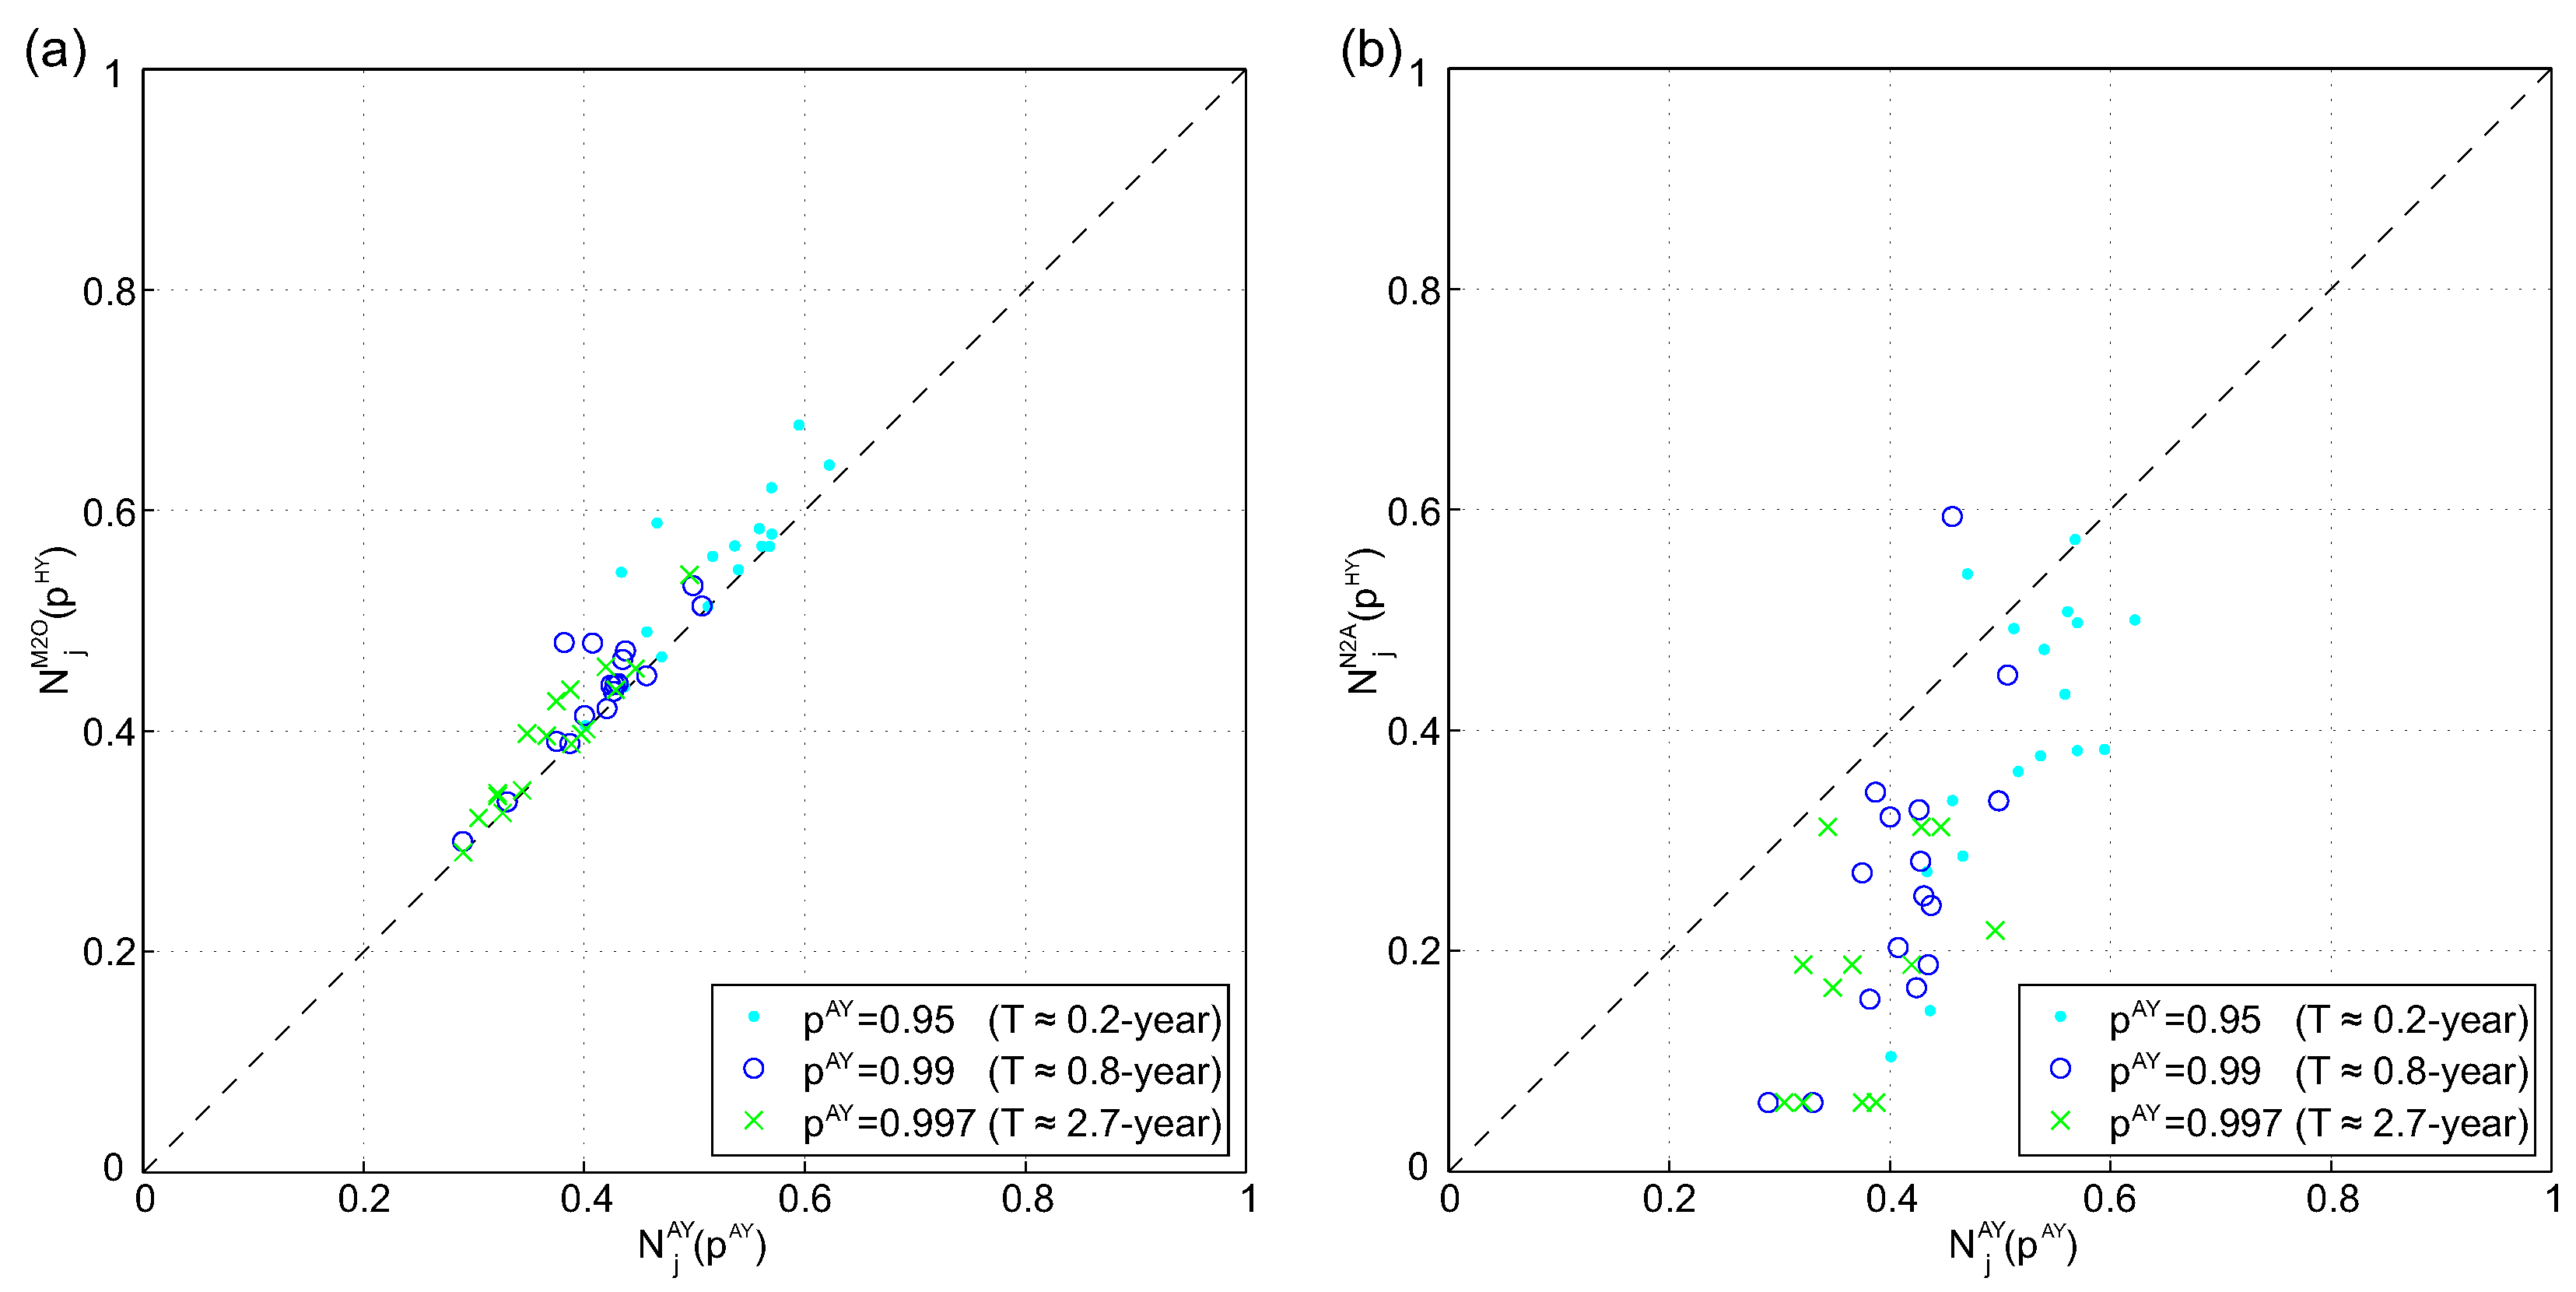
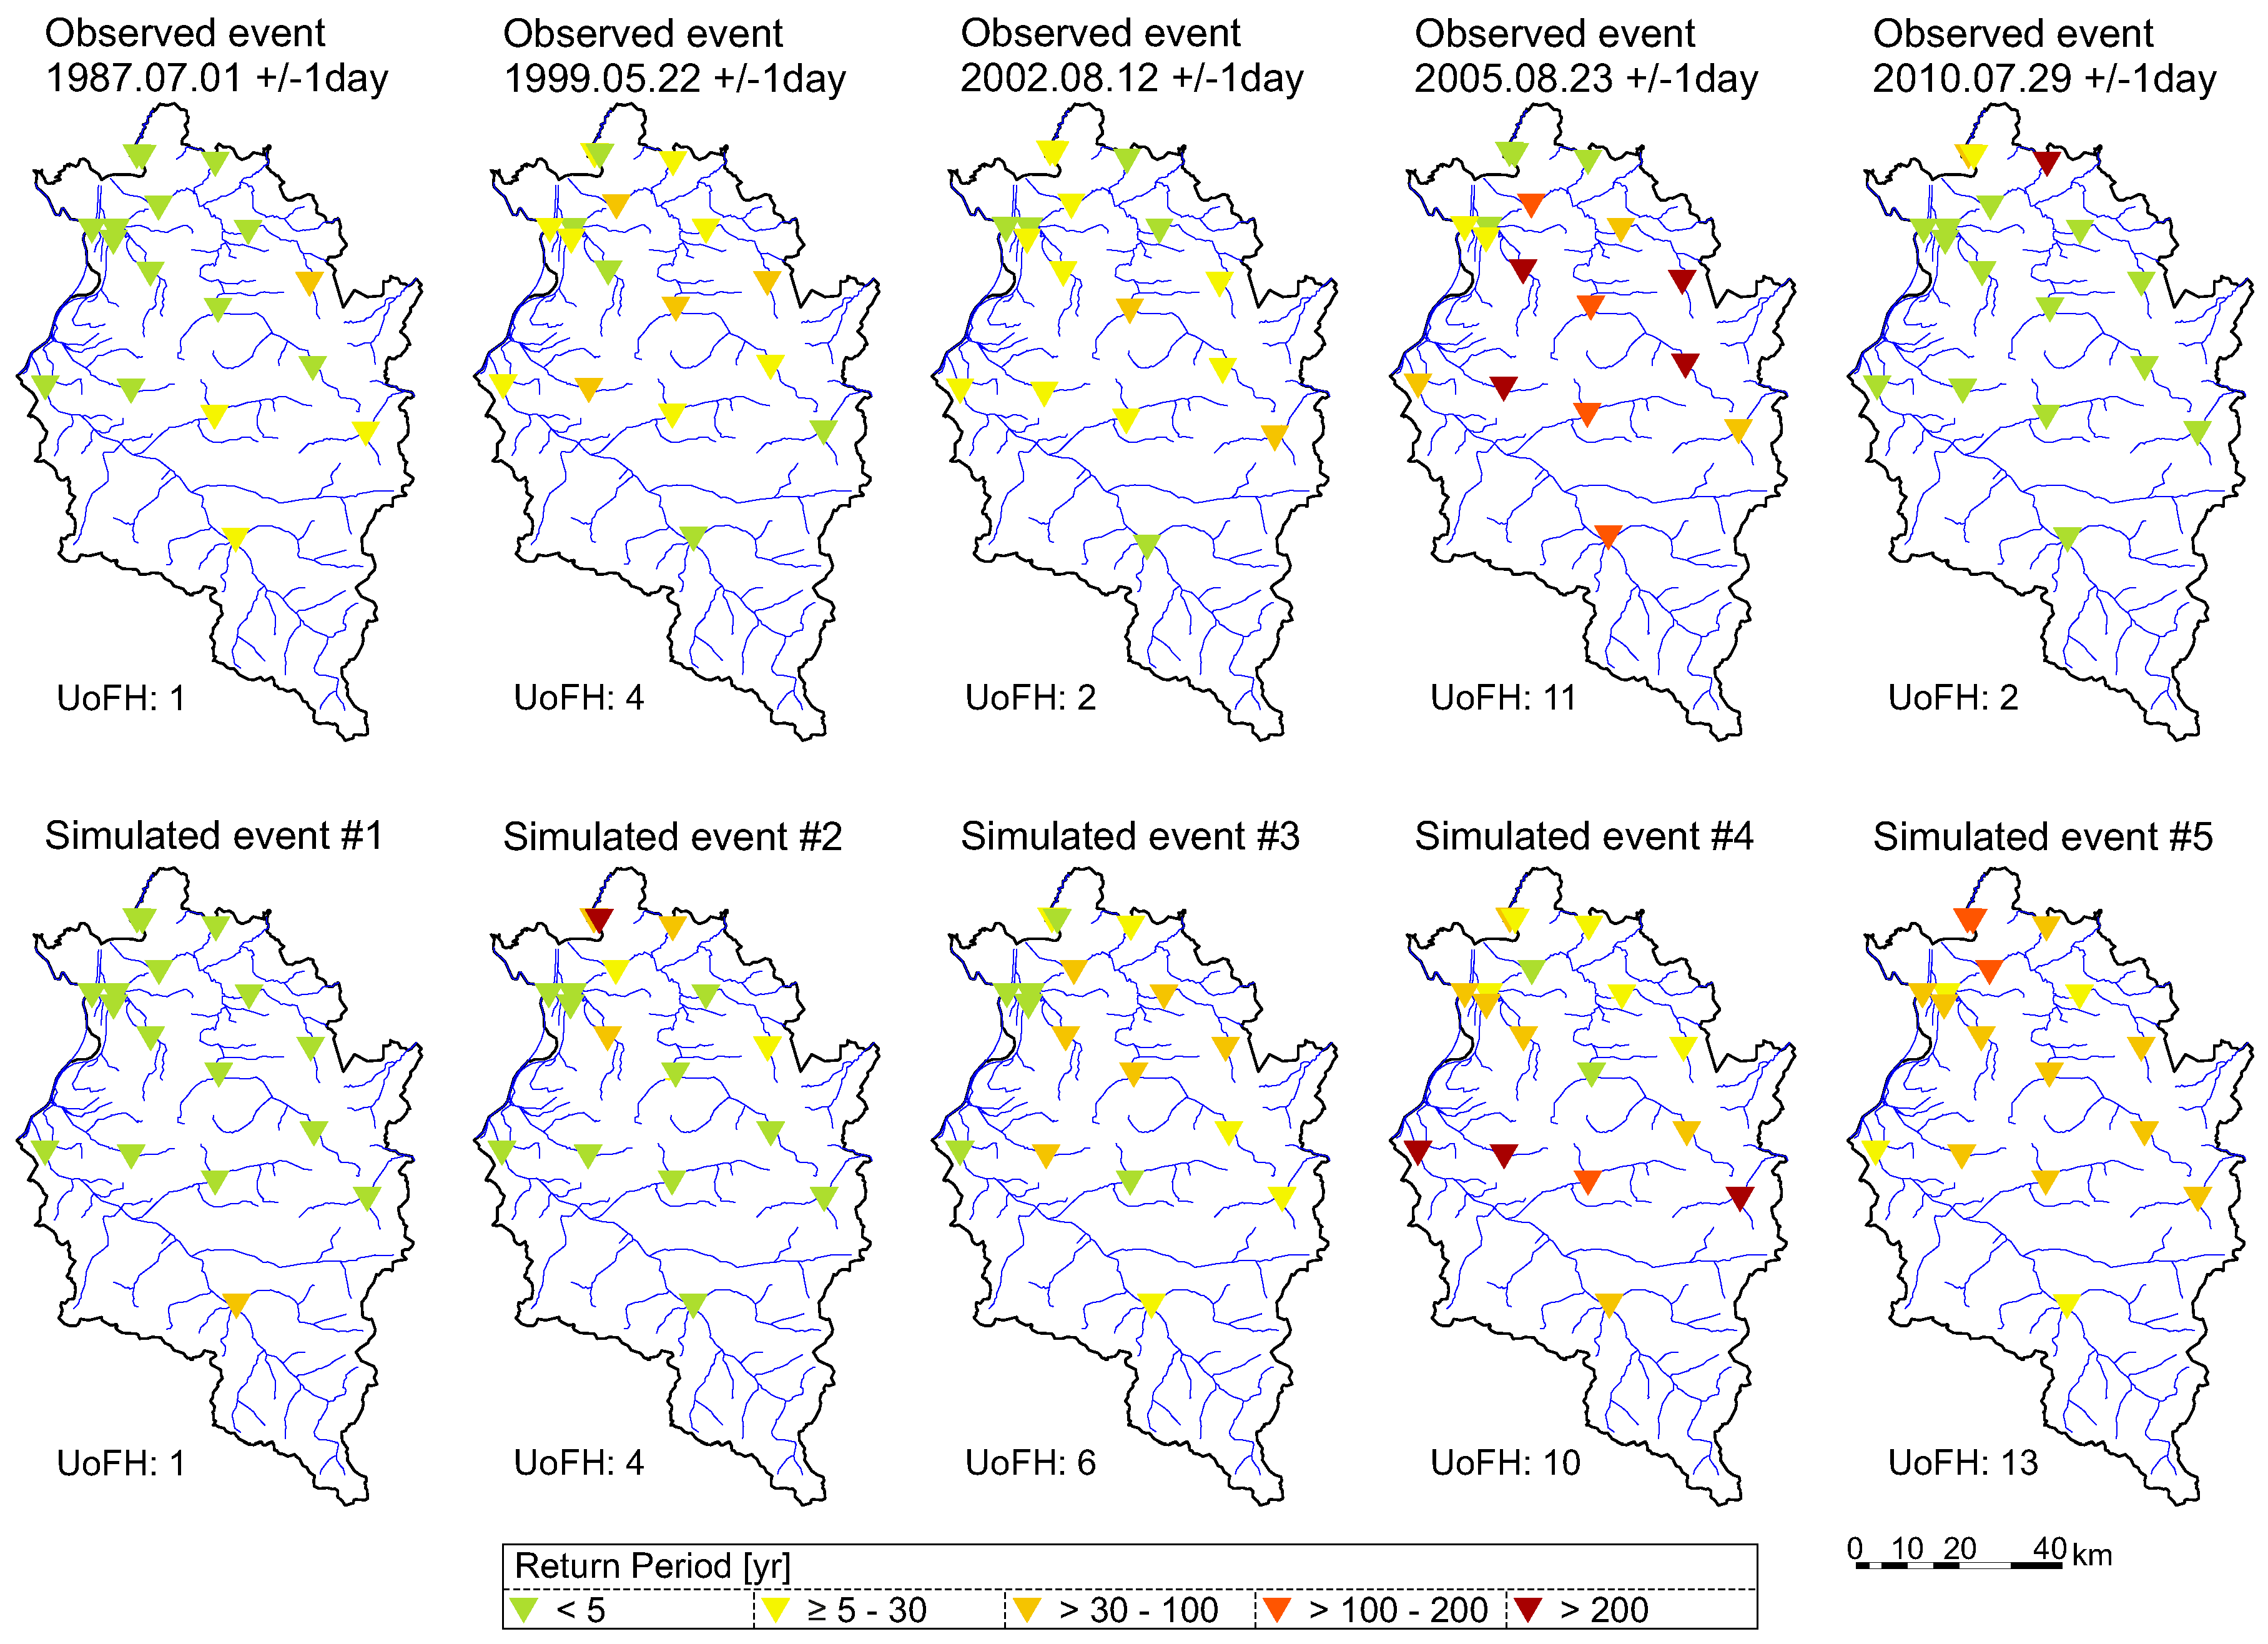
5.4. Simulated Extreme Events
6. Conclusions
Acknowledgments
Author Contributions
Conflicts of Interest
Abbreviations
| HT model | Multivariate semi-parametric conditional model introduced by Heffernan and Tawn (2004) [20] |
| T | Return period in year |
| Annual maximum series | |
| AMS derived from daily mean data | |
| AMS derived from daily maximum data | |
| UoFH | Unit of flood hazard |
| All-year (series) | |
| General extreme value (distribution) | |
| Yearly maximum runoff (of half-year series) | |
| May to October (series) | |
| November to April (series) |
References
- National Research Council (NRC). Flood Risk Management and the American River Basin: An Evaluation; National Academies Press: Washington, DC, USA, 1995. [Google Scholar]
- European Union. On the assessment and management of flood risks: Directive 2007/60/EC of the European Parliament and the Council. Off. J. Eur. Community 2007, 288, 27–34. [Google Scholar]
- FLOODsite. Lanugauge of Risk: Project Definitions, 2nd ed.; HR Wallingford: Wallingford, UK, 2009. [Google Scholar]
- Uhlemann, S.; Thieken, A.H.; Merz, B. A consistent set of trans-basin floods in Germany between 1952–2002. Hydrol. Earth Syst. Sci. 2010, 14, 1277–1295. [Google Scholar] [CrossRef]
- Leonard, M.; Westra, S.; Phatak, A.; Lambert, M.; van den Hurk, B.; McInnes, K.; Risbey, J.; Schuster, S.; Jakob, D.; Stafford-Smith, M. A compound event framework for understanding extreme impacts. Wiley Interdiscip. Rev. Clim. Chang. 2014, 5, 113–128. [Google Scholar] [CrossRef]
- Thieken, A.H.; Apel, H.; Merz, B. Assessing the probability of large-scale flood loss events: A case study for the river Rhine, Germany. J. Flood Risk Manag. 2015, 8, 247–262. [Google Scholar] [CrossRef]
- Falter, D.; Dung, N.V.; Vorogushyn, S.; Schröter, K.; Hundecha, Y.; Kreibich, H.; Apel, H.; Theisselmann, F.; Merz, B. Continuous, large-scale simulation model for flood risk assessments: Proof-of-concept. J. Flood Risk Manag. 2016, 9, 9–21. [Google Scholar] [CrossRef]
- Jongman, B.; Hochrainer-Stigler, S.; Feyen, L.; Aerts, J.C.J.H.; Mechler, R.; Botzen, W.J.W.; Bouwer, L.M.; Pflug, G.; Rojas, R.; Ward, P.J. Increasing stress on disaster-risk finance due to large floods. Nat. Clim. Chang. 2014, 4, 264–268. [Google Scholar] [CrossRef]
- Falter, D.; Schröter, K.; Nguyen, V.D.; Vorogushyn, S.; Kreibich, H.; Hundecha, Y.; Apel, H.; Merz, B. Spatially coherent flood risk assessment based on long-term continuous simulation with a coupled model chain. J. Hydrol. 2015, 524, 182–193. [Google Scholar] [CrossRef]
- Renard, B.; Lang, M. Use of a Gaussian copula for multivariate extreme value analysis: Some case studies in hydrology. Adv. Water Res. 2007, 30, 897–912. [Google Scholar] [CrossRef]
- Genest, C.; Favre, A.C.; Béliveau, J.; Jacques, C. Metaelliptical copulas and their use in frequency analysis of multivariate hydrological data. Water Resour. Res. 2007, 43, 1–12. [Google Scholar] [CrossRef]
- Schölzel, C.; Friederichs, P. Multivariate non-normally distributed random variables in climate research— Introduction to the copula approach. Nonlinear Process. Geophys. 2008, 15, 761–772. [Google Scholar] [CrossRef]
- Klein, B.; Pahlow, M.; Hundecha, Y.; Schumann, A. Probability Analysis of Hydrological Loads for the Design of Flood Control Systems Using Copulas. J. Hydrol. Eng. 2010, 15, 360–369. [Google Scholar] [CrossRef]
- Kilgore, R.; Thompson, D.B.; Ford, D.T. Estimating the Joint Probability of Coincident Flows at Stream Confluences. In World Environmental and Water Resources Congress 2011; Beighley, R.E., Killgore, M.W., Eds.; American Society of Civil Engineers: Reston, VA, USA, 2011. [Google Scholar]
- Chen, L.; Singh, V.P.; Shenglian, G.; Hao, Z.; Li, T. Flood Coincidence Risk Analysis Using Multivariate Copula Functions. J. Hydrol. Eng. 2012, 17, 742–755. [Google Scholar] [CrossRef]
- Requena, A.I.; Mediero, L.; Garrote, L. A bivariate return period based on copulas for hydrologic dam design: accounting for reservoir routing in risk estimation. Hydrol. Earth Syst. Sci. 2013, 17, 3023–3038. [Google Scholar] [CrossRef]
- Sraj, M.; Bezak, N.; Brilly, M. Bivariate flood frequency analysis using the copula function: A case study of the Litija station on the Sava River. Hydrol. Process. 2015, 29, 225–238. [Google Scholar] [CrossRef]
- Durocher, M.; Chebana, F.; Ouarda, T.B. On the prediction of extreme flood quantiles at ungauged locations with spatial copula. J. Hydrol. 2016, 533, 523–532. [Google Scholar] [CrossRef]
- Requena, A.I.; Chebana, F.; Mediero, L. A complete procedure for multivariate index-flood model application. J. Hydrol. 2016, 535, 559–580. [Google Scholar] [CrossRef]
- Heffernan, J.E.; Tawn, J.A. A conditional approach for multivariate extreme values (with discussion). J. R. Stat. Soc. B 2004, 66, 497–546. [Google Scholar] [CrossRef]
- Lamb, R.; Keef, C.; Tawn, J.A.; Laeger, S.; Meadowcroft, I.; Surendran, S.; Dunning, P.; Batstone, C. A new method to assess the risk of local and widespread flooding on rivers and coasts. J. Flood Risk Manag. 2010, 3, 323–336. [Google Scholar] [CrossRef]
- Keef, C.; Svensson, C.; Tawn, J.A. Spatial dependence in extreme river flows and precipitation for Great Britain. J. Hydrol. 2009, 378, 240–252. [Google Scholar] [Green Version]
- Jonathan, P.; Flynn, J.; Ewans, K. Joint modelling of wave spectral parameters for extreme sea states. Ocean Eng. 2010, 37, 1070–1080. [Google Scholar] [CrossRef]
- Ewans, K.; Jonathan, P. Evaluating environmental joint extremes for the offshore industry using the conditional extremes model. J. Mar. Syst. 2014, 130, 124–130. [Google Scholar] [CrossRef]
- Gouldby, B.; Mendez, F.; Guanche, Y.; Rueda, A.; Minguez, R. A methodology for deriving extreme nearshore sea conditions for structural design and flood risk analysis. Coast. Eng. 2014, 88, 15–26. [Google Scholar] [CrossRef]
- Keef, C.; Tawn, J.A.; Svensson, C. Spatial risk assessment for extreme river flows. Appl. Stat. 2009, 58, 601–618. [Google Scholar] [CrossRef]
- Mendes, B.V.D.M.; Pericchi, L.R. Assessing conditional extremal risk of flooding in Puerto Rico. Stoch. Environ. Res. Risk Assess. 2009, 23, 399–410. [Google Scholar] [CrossRef]
- Keef, C.; Tawn, J.A.; Lamb, R. Estimating the probability of widespread flood events. Environmetrics 2013, 24, 13–21. [Google Scholar] [CrossRef]
- Neal, J.; Keef, C.; Bates, P.D.; Beven, K.; Leedal, D. Probabilistic flood risk mapping including spatial dependence. Hydrol. Process. 2013, 27, 1349–1363. [Google Scholar] [CrossRef]
- Wyncoll, D.; Gouldby, B. Integrating a multivariate extreme value method within a system flood risk analysis model. J. Flood Risk Manag. 2015, 8, 145–160. [Google Scholar] [CrossRef]
- Speight, L.; Hall, J.; Kilsby, C. A multi-scale framework for flood risk analysis at spatially distributed locations. J. Flood Risk Manag. 2017, 10, 124–137. [Google Scholar] [CrossRef]
- Habersack, H.; Krapesch, G. Hochwasser 2005—Ereignisdokumentation: Der Bundeswasserbauverwaltung, des Forsttechnischen Dienstes für Wildbach- und Lawinenverbauung und des Hydrographischen Dienstes; Bundesministerium für Land- und Forstwirtschaft, Umwelt- und Wasserwirtschaft: Vienna, Austria, 2006. [Google Scholar]
- Schneeberger, K.; Huttenlau, M.; Winter, B.; Steinberger, T.; Achleitner, S.; Stötter, J. A probabilistic framework for risk analysis of widespread flood events: A proof-of-concept study. Risk Anal. 2017. [Google Scholar] [CrossRef] [PubMed]
- Gaál, L.; Szolgay, J.; Kohnová, S.; Parajka, J.; Merz, R.; Viglione, A.; Blöschl, G. Flood timescales: Understanding the interplay of climate and catchment processes through comparative hydrology. Water Resour. Res. 2012, 48. [Google Scholar] [CrossRef]
- Schneeberger, K.; Huttenlau, M.; Stötter, J. A Seasonality Analysis of Flood Peaks as Basis for Flood Risk Analyses in two Alpine Regions. In Proceedings of the 3rd STAHY International Workshop on Statistical Methods for Hydrology and Water Resources Management, Tunis, Tunisia, 1–2 October 2012. [Google Scholar]
- Merz, R.; Blöschl, G. A process typology of regional floods. Water Resour. Res. 2003, 39, 1340–1359. [Google Scholar] [CrossRef]
- Hawkes, P.J.; Gonzalez-Marco, D.; Sánchez-Arcilla, A.; Prinos, P. Best practice for the estimation of extremes: A review. J. Hydraul. Res. 2008, 46, 324–332. [Google Scholar] [CrossRef]
- Grimaldi, S.; Petroselli, A.; Tauro, F.; Porfiri, M. Time of concentration: a paradox in modern hydrology. Hydrol. Sci. J. 2012, 57, 217–228. [Google Scholar] [CrossRef]
- Keef, C.; Lamb, R.; Tawn, J.A.; Laeger, S. A multivariate model for the broad scale spatial assessment of flood risk. In Proceedings of the BHS Third International Symposium, Managing Consequences of a Changing Global Environment, Newcastle, UK, 19–23 July 2010. [Google Scholar]
- Mardia, K.V.; Jupp, P.E. Statistics of Directional Data, 2nd ed.; Wiley Series in Probability and Statistics; Wiley: New York, NY, USA, 1999. [Google Scholar]
- Schneeberger, K.; Dobler, C.; Huttenlau, M.; Stötter, J. Assessing potential climate change impacts on the seasonality of runoff in an Alpine watershed. J. Water Clim. Chang. 2015. [Google Scholar] [CrossRef]
- Burn, D.H. Catchment similarity for regional flood frequency analysis using seasonality measures. J. Hydrol. 1997, 202, 212–230. [Google Scholar] [CrossRef]
- De Michele, C.; Rosso, R. A multi-level approach to flood frequency regionalisation. Hydrol. Earth Syst. Sci. 2002, 6, 185–194. [Google Scholar] [CrossRef]
- Keef, C.; Papastathopoulos, I.; Tawn, J.A. Estimation of the conditional distribution of a multivariate variable given that one of its components is large: Additional constraints for the Heffernan and Tawn model. J. Multivar. Anal. 2013, 115, 396–404. [Google Scholar] [CrossRef]
- Embrechts, P.; Klüppelberg, C.; Mikosch, T. Modelling Extremal Events: For Insurance and Finance; Stochastic Modelling and Applied Probability; Springer: Berlin/Heidelberg, Germany, 1997; Volume 33. [Google Scholar]
- Taylor, M.S.; Thompson, J.R. A data based algorithm for the generation of random vectors. Comput. Stat. Data Anal. 1986, 4, 93–101. [Google Scholar] [CrossRef]
- Holub, M.; Gruber, H.; Fuchs, S. Risks from natural hazards in the insurance business. In Studienreise 2010—Risiko im Bereich Schutz vor Naturgefahren; Skolaut, C., Ed.; Wildbach- und Lawinenverbau; Verein der Diplomingenieure der Wildbach-und Lawinenverbauung Österreichs: Villach, Austria, 2011; Volume 167. [Google Scholar]
- Serinaldi, F.; Kilsby, C.G. A Blueprint for Full Collective Flood Risk Estimation: Demonstration for European River Flooding. Risk Anal. 2017, 37, 1958–1976. [Google Scholar] [CrossRef] [PubMed]
- Bortz, J.; Schuster, C. Statistik für Human- und Sozialwissenschaftler, 7th ed.; Springer-Lehrbuch; Springer: Berlin, Germany, 2010. [Google Scholar]
- Choulakian, V.; Stephens, M.A. Goodness-of-Fit Tests for the Generalized Pareto Distribution. Technometrics 2001, 43, 478–484. [Google Scholar] [CrossRef]
- Coles, S. An Introduction to Statistical Modeling of Extreme Values; Springer Series in Statistics; Springer: London, UK; New York, NY, USA, 2001. [Google Scholar]
- Law, A.; Kelton, W. Simulation Modelling and Analysis; McGraw-Hill Series in Industrial Engineering and Management Science; McGraw-Hill: New York, NY, USA, 2000. [Google Scholar]
- Hosking, J.R.M.; Wallis, J.R. Regional Frequency Analysis: An Approach Based on L-Moments; Cambridge University Press: Cambridge, UK; New York, NY, USA, 1997. [Google Scholar]
- Merz, R.; Blöschl, G. Flood frequency regionalisation—Spatial proximity vs. catchment attributes. J. Hydrol. 2005, 302, 283–306. [Google Scholar] [CrossRef]
- Petrow, T.; Merz, B.; Lindenschmidt, K.E.; Thieken, A.H. Aspects of seasonality and flood generating circulation patterns in a mountainous catchment in south-eastern Germany. Hydrol. Earth Syst. Sci. 2007, 11, 1455–1468. [Google Scholar] [CrossRef]


| i | Name of Gauges | River | ID | Area |
|---|---|---|---|---|
| 1 | Mellau | Bregenzerach | 200261 | 228.6 |
| 2 | Kennelbach | Bregenzerach | 200329 | 826.3 |
| 3 | Hopfreben | Bregenzerach | 200246 | 41.7 |
| 4 | Schönenbach | Subersach | 200287 | 31.1 |
| 5 | Thal | Rotach | 200311 | 90.1 |
| 6 | Lingenau | Subersach | 200295 | 111.6 |
| 7 | Hoher Steg | Dornbirnerach | 200212 | 112.9 |
| 8 | Enz | Dornbirnerach | 200204 | 51.1 |
| 9 | Lustenau (H) | Rheintalbinne | 200220 | 77.5 |
| 10 | Laterns | Frutz | 200154 | 33.4 |
| 11 | Unterhochsteg | Leiblach | 200394 | 102.4 |
| 12 | Schruns | Litz | 200048 | 102 |
| 13 | Garsella | Lutz | 200105 | 95.5 |
| 14 | Gisingen | Ill | 200147 | 1281 |
| 15 | Lustenau (E) | Rhein | 200196 | 6110 |
| 16 | Lech | Lech | 200378 | 84.3 |
| 17 | Lochau | Ruggbach | 200345 | 7.2 |
| p | T (Year) | L (Days) | |||||
|---|---|---|---|---|---|---|---|
| 0 | 1 | 2 | 3 | 4 | |||
| R (p,L) | 0.99 | 0.3 | 1 | 0.32 | 0.21 | 0.03 | 0 |
| 0.997 | 0.9 | 1 | 0.39 | 0.25 | 0.02 | 0 | |
| 0.999 | 2.7 | 1 | 0.34 | 0.32 | 0.01 | 0 | |
| 0.9997 | 9.1 | 1 | 0.44 | 0.28 | 0 | 0 | |
| i | Name of Gauges | (h) | (°) | |
|---|---|---|---|---|
| 1 | Mellau | 1.9–4.8 | 204 | 0.56 |
| 2 | Kennelbach | 3.3–8.8 | 216 | 0.40 |
| 3 | Hopfreben | 0.7–2.3 | 205 | 0.52 |
| 4 | Schönenbach | 0.5–2.0 | 208 | 0.61 |
| 5 | Thal | 1.3–4.6 | 224 | 0.29 |
| 6 | Lingenau | 1.4–3.8 | 207 | 0.57 |
| 7 | Hoher Steg | 1.4–4.3 | 196 | 0.70 |
| 8 | Enz | 0.8–2.8 | 209 | 0.64 |
| 9 | Lustenau (H) | 1.4–8.7 | 190 | 0.73 |
| 10 | Laterns | 0.7–2.1 | 208 | 0.68 |
| 11 | Unterhochsteg | 1.0–6.3 | 188 | 0.45 |
| 12 | Schruns | 1.5–3.5 | 188 | 0.80 |
| 13 | Garsella | 1.2–3.0 | 200 | 0.69 |
| 14 | Gisingen | 5.3–12 | 192 | 0.76 |
| 15 | Lustenau (E) | 10–30 | 199 | 0.77 |
| 16 | Lech | 1.2–3.4 | 191 | 0.63 |
| 17 | Lochau | 0.4–1.3 | 205 | 0.58 |
| Test Criteria | Percentiles (%) | ||
|---|---|---|---|
| 12.5–87.5 | 5–95 | 2.5–97.5 | |
| 0.87 | 0.95 | 0.98 | |
| 0.91 | 0.97 | 0.99 | |
| 0.83 | 0.96 | 0.98 | |
| 0.87 | 0.98 | 0.99 | |
| median () | 0.71 | 0.94 | 0.94 |
| median () | 0.65 | 0.82 | 0.94 |
© 2018 by the authors. Licensee MDPI, Basel, Switzerland. This article is an open access article distributed under the terms and conditions of the Creative Commons Attribution (CC BY) license (http://creativecommons.org/licenses/by/4.0/).
Share and Cite
Schneeberger, K.; Steinberger, T. Generation of Spatially Heterogeneous Flood Events in an Alpine Region—Adaptation and Application of a Multivariate Modelling Procedure. Hydrology 2018, 5, 5. https://0-doi-org.brum.beds.ac.uk/10.3390/hydrology5010005
Schneeberger K, Steinberger T. Generation of Spatially Heterogeneous Flood Events in an Alpine Region—Adaptation and Application of a Multivariate Modelling Procedure. Hydrology. 2018; 5(1):5. https://0-doi-org.brum.beds.ac.uk/10.3390/hydrology5010005
Chicago/Turabian StyleSchneeberger, Klaus, and Thomas Steinberger. 2018. "Generation of Spatially Heterogeneous Flood Events in an Alpine Region—Adaptation and Application of a Multivariate Modelling Procedure" Hydrology 5, no. 1: 5. https://0-doi-org.brum.beds.ac.uk/10.3390/hydrology5010005