
Integrating Remote and In-Situ Data to Assess the Hydrological Response of a Post-Fire Watershed


1
Department of Agriculture and Environmental Sciences, University of Milan, Via Celoria 2, 20133 Milano, Italy
2
Centre of Applied Studies for the Sustainable Management and Protection of Mountain Areas (Ge.S.Di.Mont), University of Milan, Via Morino 8, Edolo, 25048 Brescia, Italy
*
Author to whom correspondence should be addressed.
Hydrology 2021, 8(4), 169; https://0-doi-org.brum.beds.ac.uk/10.3390/hydrology8040169
Submission received: 12 October 2021
/
Revised: 2 November 2021
/
Accepted: 10 November 2021
/
Published: 12 November 2021
(This article belongs to the Special Issue Advances in Flow Modeling for Water Resources and Hydrological Engineering)
Abstract
:Forest fire is a common concern in Mediterranean watersheds. Fire-induced canopy mortality may cause the degradation of chemical–physical properties in the soil and influence hydrological processes within and across watersheds. However, the prediction of the pedological and hydrological effect of forest fires with heterogenous severities across entire watersheds remains a difficult task. A large forest fire occurred in 2017 in northern Italy providing the opportunity to test an integrated approach that exploits remote and in-situ data for assessing the impact of forest fires on the hydrological response of semi-natural watersheds. The approach is based on a combination of remotely-sensed information on burned areas and in-situ measurements of soil infiltration in burned areas. Such collected data were used to adapt a rainfall–runoff model over an experimental watershed to produce a comparative evaluation of flood peak and volume of runoff in pre- and post-fire conditions. The model is based on a semi-distributed approach that exploits the Soil Conservation Service Curve Number (SCS-CN) and lag-time methods for the estimation of hydrological losses and runoff propagation, respectively, across the watershed. The effects of fire on hydrological losses were modeled by adjusting the CN values for different fire severities. Direct infiltration measurements were carried out to better understand the effect of fire on soil infiltration capacity. We simulated the hydrological response of the burned watershed following one of the most severe storm events that had hit the area in the last few years. Fire had serious repercussions in regard to the hydrological response, increasing the flood peak and the runoff volume up to 125% and 75%, respectively. Soil infiltration capacity was seriously compromised by fire as well, reducing unsaturated hydraulic conductivity up to 75% compared with pre-fire conditions. These findings can provide insights into the impact of forest fires on the hydrological response of a whole watershed and improve the assessment of surface runoff alterations suffered by a watershed in post-fire conditions.
1. Introduction
Fires severely alter the hydrological response of watersheds to rainfall [1,2]. Fire-induced loss of canopy cover, litter consumption, and the formation of water repellent layers on the soil surface reduce canopy interception and soil infiltration, increasing flood peak and volume runoff [3,4,5,6].
Fire acts as a generalist herbivore that removes plant material above the ground surface. Depending on fire behavior and species-specific resistance, trees can suffer death or defoliation, survive, or re-sprout following fire. The ability to survive and re-sprout depends on tree height, scorch and char heights, tree species, age, stem and bark thickness, and fire intensity and residence time. In the hydrological cycle, this natural process leads to a reduction in evapotranspiration fluxes, leaf rainfall interception and tree suction capacity [7]. High temperatures can vaporize soil organic matter and generate a thin hydrophobic layer (from 1 to 7 cm), which strongly reduces soil infiltration capacity [8]. In addition, the burning process degrades soil structure and porosity, causing considerable nutrient loss through volatilization, leaching and erosion, and alters the quantity and specific composition of microbial and soil-dwelling invertebrate communities [9].
Such effects induce strong responses in watershed hydrology and flood hazard. In-situ measurements carried out in European and North American natural watersheds showed that the annual flood peak in post-fire conditions can increase between 1.2 and 10 times [10,11,12,13,14,15,16,17]. Such variability depends on watershed size, with stronger effects in smaller watersheds [18]. After individual flood events, post-fire hydrological responses are often sharper and quicker than in unburned sites, due to the simultaneous reduction in hydrological retention and time of concentration [19]. Flood magnitude may also increase after fire, e.g., from a 10-year to a 1-year return interval for the same discharge [20]. Youberg et al. [21] estimated that a 2-year return period rainfall in a burned watershed can produce a runoff similar to a 100-year event in pre-fire conditions. Such an exceptional increase in hazard has a catastrophic impact on the economy of a region, although assessing the costs of post-fire flooding is very difficult. The Emergency Events Database (EM-DAT), an international disaster database (http://www.emdat.be/, accessed on 8 October 2021), lists, for instance, damages of Euros 200 billion related to various disasters since 1900 in the Mediterranean countries, of which 85 billion are related to flooding.
Despite the knowledge accumulated on the effects of fire on soils, quantifying the impact of different burn severities on the soil’s hydrological response and especially on infiltration losses across whole watersheds remains a difficult task [22]. In many cases, studies on post-fire hydrology have focused only on short time scales (from 1 to 3 years), thus limiting the assessment of the longevity of fire impacts [23]. The first years after fire are often considered the most critical in terms of hydrological instability [24,25]; however, in some cases a significant increase in runoff discharge has been observed up to a decade after burning [4,26]. Another reason for concern is the effect of climate change on both fire frequency and severity, and on rainfall frequency and intensity. Mediterranean watershed flood risk is expected to increase over time, with increasingly dangerous impacts on infrastructures, human and economic activities in the watersheds affected by fire [27].
In light of these concerns, the main purpose of this study is to develop a robust and rational methodology to assess the change in hydrological response of a post-fire watershed, especially where the scarcity or absence of hydrometric data does not allow the calibration of a more complex rainfall–runoff model. Thus, this study proposes an integrated approach that combines spatial information on burned areas and levels of fire severity, direct soil infiltration measurements, and rainfall–runoff modelling. Then it was developed, implemented, and tested on a burned forest catchment in order to better understand the repercussions of fire on the hydrological response of a natural watershed. Flood peak and volume were computed through the application of the Soil Conservation Service-Curve Number method (SCS-CN), whereas the flow propagation was simulated through a lag-time approach based on the time–area curve of the catchment. The curve number (CN) was adjusted according to the severity of burned areas, whereas direct soil infiltration measurements were carried out to corroborate information about the effect of fire on soil infiltration capacity. Finally, the proposed procedure could be a useful example for hydrologists and foresters engaged in designing post-disaster interventions and in planning silvicultural practices.
2. Study Area
The study domain is the Tinella watershed, a forested 2.6 km2 area located in the province of Varese (Figure 1). It is an integral part of the Campo dei Fiori Regional Park, a natural protected area of about 6 km2 where environment educational, cultural and sports activities are promoted for tourists and local communities. Inside the Tinella watershed, the elevation ranges between 470 m and 1200 m asl, while the average slope is about 46%. It is mostly south-facing, which increases the risk of forest fire [25,28]. The climate is mild, and generally warm and temperate, and is classified as humid subtropical climate (Cfa) according to the Köppen–Geiger classification. The average temperature is 12.0 °C with a total annual precipitation of ~1500 mm.
The Tinella watershed incorporates two nested sub-basins (WS10 and WS11 as shown in Figure 1) that are of similar size, ~1.3 km2, and steepness ~45%, but they were affected differently by the fire. Table 1 summarizes several geomorphological features calculated by hydrological tools, implemented in QGis 3.10 and applied over the 5 m-resolution DEM, which is freely downloadable from the regional database at the link (https://www.geoportale.regione.lombardia.it/web/geoportale/download-dati, accessed on 8 October 2021).
The Tinella watershed is mainly covered by mesophilous broad-leaved forests (about 47% of the sub-basin area in WS10 and 35% in WS11) dominated by chestnut (Castanea sativa Mill.) and maple-ash (Acer psudoplatanus L. and Fraxinus excelsior L.) on south-facing slopes (about 28% of the sub-basin area in WS10 and 30% in WS11), whereas the dominant species in the northern part is beech (Fagus sylvatica L.) (about 2% in WS10 of the sub-basin area and 24% in WS11). Concerning the soil, a 1:250.000 regional soil map shows that the watershed is mainly characterized by thin clay-loamy soil (about 80% of the sub-basin area, both in WS10 and WS11), with a minor presence of deep silty-loamy spoils in the southern part (10% of the sub-basin area).
The study area is located in the Lombardy region, one of the most forested regions in Italy (about 650,000 ha) with a high exposure to forest fire risk [29]. In October 2017, after a dry summer with little rain, a large fire burned 374 ha of the southern side of Campo dei Fiori, destroying 318 ha of forest. In-situ post-fire surveys revealed that the soil and the understory and overstory were severely compromised. The northern part of the Tinella watershed lost approximately 10 ha of forest and underwent significant hydrological changes (reduction in infiltration and water retention capacity). In fact, at each following severe rainfall event, some damage was registered at the watershed outlet in the municipality of Luvinate (in province of Varese), which was caused by a high-level of flow and sediment, mobilized by slope (soil instabilities) and along the channel network, bed and streambank erosion. The impacts of fire on post-rainfall runoff are still poorly understood since the watershed is not instrumented. However, it appears that hydraulic infrastructures are no longer able to channel the post-fire flood peaks and runoff volumes. To alleviate such threats, Lombardy region has invested about Euro 2 million for the restoration of burned areas and the building of new hydraulic infrastructures to reduce channel gradient, solid transport, and downstream runoff.
3. Materials and Methods
3.1. Storm Severity Analysis
Storm severity analysis was conducted on the rainfall data obtained by 13 rain gauges (Table 2). Twelve of them belong to the official network of meteorological stations managed by the Regional Environmental Protection Agency (ARPA) (https://www.arpalombardia.it, accessed on 8 October 2021), whereas the last one, very close to the outlet of the basin, belongs to the Centro Meteo Lombardo (CML) (http://www.centrometeolombardo.com, accessed on 8 October 2021). CML is a citizen’s association with an interest in meteorology that manages a dense recreational network of rain gauges uniformly distributed over the regional territory. The distance between rain gauge positions and the outlet of the watershed varies from 1 to 16 km, whereas data acquisition at each station is every 10 min. Data from all rain gauges were weighted as a function of the inverse square distance from the center of the watershed to obtain a single vector of rainfall data to use as input for the rainfall–runoff model. In particular, the storm severity analysis was focused on an extreme rainfall event that occurred on the 24 September, 2020, which was the last day after a series of moderate rainfall events that occurred in 2018 and in 2019. Concerning the methodology, storm severity was represented through a graph showing the return periods of the storm for the different rainfall durations [30]. A moving-window procedure for rainfall accumulation was adopted to detect the maximum rainfall depth observed for each duration. Thus, the Depth–Duration–Frequency curve (DDF) was used to estimate the return period for each maximum rainfall depth. DDFs are described through the Generalized Extreme Value (GEV) probability distribution over the entire regional territory [31] and their parameters (for rainfalls 1–24 h) were available on a raster map with a spatial resolution of 2 km (http://ita.arpalombardia.it/ITA/servizi/richiesta_dati/idro_pluvio_termo.asp, accessed on 8 October 2021). The Bell [32] formula was applied for adjusting DDF curve parameters in case of rainfall duration of less than 1 h.
3.2. Framework of the Integrated Approach
The integrated approach is characterized by a combination of (i) analysis of satellite images for detecting burned areas and level of fire severity, (ii) measurements of the soil infiltration capacity under different fire severities, and (iii) modelling rainfall–runoff processes of the watershed (Figure 2).
3.2.1. Detecting Burned Areas and Fire Severity
The spatial assessment of burned areas and fire severity was conducted by combining field-based measures of the Geometrically structured Composite Burn Index (GeoCBI) [33] and spectral signatures extracted from Sentinel-2 imagery. GeoCBI is a modification of the original CBI [34] that consists of a score based on a subjective assessment of fire impacts on five different vegetation layers. Canopy loss at the watershed scale was then assessed by the derivative differenced Normalized Difference Vegetation Index (NDVI), a traditional vegetation index commonly used to identify the photosynthetic activity [35].
3.2.2. Measurements of Soil Infiltration Capacity
Unsaturated hydraulic conductivity of soil (K) was considered as a proxy for soil infiltration capacity of the areas affected by different burn severity. K was measured directly in situ using a Mini-Disk Infiltrometer (MDI) (METER Group Inc., Pullman, WA, USA, 2020), a highly portable and inexpensive tension infiltrometer. These measurements were conducted following the standard protocols described in the MDI user manual [36]. In detail, MDI was used to measure cumulative infiltration with a pressure head (suction) of −2 cm, which is adequate for most soils—as reported in the MDI manual. Before placing the MDI, the soil surface must be cleaned and delicately levelled using a trowel and scissors to avoid the overturning of the device during measurements, as well as to allow perfect adherence between the sintered filter of the instrument and the soil surface. To ensure the contact between the sintered disk and soil surface, a thin layer of sand (about 0.5 cm thick) must be added. The water level inside the minidisk water reservoir is recorded at 30 s regular time intervals for no less than ~5 min for each test.
The unsaturated hydraulic conductivity is then derived by combining the obtained cumulative infiltration measures with knowledge of van Genuchten’s soil parameters [37] using Zhang’s method [38].
The cumulated infiltration rate measured with each test is expressed as a function of the square root of time and interpolated through the function proposed by Zhang (Equation (1)). C2 is determined as the slope of the curve obtained with this method:
where I is the cumulated infiltration rate (mm), t is time (s), C1 (m s−1/2) and C2 (m s−1) are two parameters related to soil sorptivity and unsaturated hydraulic conductivity.
The value of K (cm s−1) was then calculated as shown in Equation (2):
where A2 (−) is a parameter dependent on soil texture and suction and defined by Equation (3):
where r0 is the infiltrometer’s radius (equal to 2.25 cm), n (−) and α (−) are retention parameters depending on soil texture and r0, according to the values reported in the MDI manual, and h0 is the pressure head of the infiltrometer (set to −2 cm).
3.2.3. Rainfall-Runoff Simulation Strategy
The assessment of hydrological losses and runoff propagation was performed through a simple approach widely described in the scientific literature and also easy to implement for ungauged basins or where details on physiographic characteristics of the watershed are scarce. The computation of hydrological losses was conducted using the SCS-CN method [39,40,41], a semi-spatial-distributed approach, implemented for providing direct runoff after the separation of initial abstraction and infiltration losses from total rainfall. This method is one of the commonly used heuristic approaches for estimating the surface runoff from watersheds. Direct runoff (Pn) (mm) is calculated through Equations (4) and (5):
where P (mm) is the gross rainfall depth, Ia (mm) the initial abstraction and S (mm) the maximum potential retention of the basin, which depends by CN. The CN value theoretically varies between 0 and 100. However, the practical values are typically in the range of 40 to 98 [42] and are usually determined by combining land use and hydrological group data through tables reported in technical manuals [43]. Ia includes surface storage, interception and infiltration aptitude before runoff begins and it is calculated as follows (Equation (6)):
where α (−) is a constant, which in original formulation was set equal to 0.2, but recent works demonstrate that its value can range from 0.05 to 0.2 [42,44,45,46] as a function of the physiographic characteristics of the watershed, type of vegetation cover and severity of potential alterations suffered by the watershed such deforestation and fire [47,48].
Then, the propagation of direct runoff was simulated through a simple translation of water flow over the drainage watershed excluding natural storage. The runoff volumes originating from different parts of the watershed were cumulated assuming no interaction between them. The runoff travel time distribution was described by a time–area curve, obtained by the combination of a constant flow transfer velocity and the area–distance curve, which can be easily derived from the Digital Elevation Model (DEM) of the watershed using the ‘Overland Flow Distance’ tool of QGis. The corresponding time–area curves were then derived by scaling the x-axis with the average runoff propagation velocity obtained as the ratio of the length of the longest flow path and the time of concentration (tc). In particular, tc is another key parameter for estimating the hydrological response of a watershed. Despite the fact that the scientific literature describes a wide spectrum of empirical formulations [49,50,51], in this integrated approach, the Natural Resources Conservation Service-Soil Conservation Service (NRCS-SCS) method [41,52] was used. This method, described by Equation (7), directly depends on the length of the main water stream L (km), while it is inversely proportional to the average slope of the watershed (m m−1) and CN:
where tc in hours. It was considered suitable because it was tested on several natural watersheds. Moreover, the presence of the CN value as an input parameter allows us to include the potential shift in the flood peak before and after fire conditions.
3.2.4. Setup of the Integrated Approach in the Study Area
For determining fire severity, the GeoCBI was assessed in 73 georeferenced, 30 m-diameter plots randomly placed within the burned perimeter. The assessment of fire impacts was caried out on a scale of zero (unburned) to three (maximum severity) on five different vegetation layers (herbs, low shrubs <1 m tall, tall shrubs and trees 1–5 m tall, intermediate trees, and dominant or co-dominant trees), and scores were weighted on the fraction cover of each stratum [34]. Differenced NDVI (dNDVI) was calculated from pre-treated, cloud-free 10-m Sentinel-2 (level 2A) images taken in July one year before and one year after the fire, and bias-corrected using the average NDVI change across the whole Sentinel-2 image outside the fire perimeter, to account for phenological differences between years. Finally, dNDVI was then classified into three severity classes (low, moderate, and high) and unburned, based on GeoCBI measures in the field.
Concerning the determination of the soil infiltration capacity, 39 infiltration measurements at 13 points in the Tinella watershed were carried out over areas affected by different fire severity. The measurement points were selected randomly within the burned area as a function of the level of the fire severity. The van Genuchten’s parameters (n and α) derived from soil texture were assessed by collecting ad hoc soil samples at each measurement point at a depth ranging from ~0 to 10 cm. This depth adequately represents both the soil layer that is mainly involved in the surface runoff [53] and that is mainly affected by burning. For each measurement point at least 3 repetitions were conducted.
Parametrizing the rainfall–runoff model is a fundamental step for assessing watershed runoff, especially determining the spatial distribution of CN and Ia values. Concerning CN, in the Tinella watershed, deciduous forests, evergreen coniferous and mix forests were considered as three macro-types of land use, whereas the hydrological groups were derived from soil characteristics, grouping sand, loamy sand, sandy loam in group A, silt loam in group B, silt, loam and sandy clay loam in group C, and lastly, silt clay loam, clay loam, sandy clay and clay in group D, according to the classification of USDA NRCS [54]. The results of these classifications are reported in Table 3.
CN was assessed for each sub-area described by the area–distance curve and then adjusted according to the Antecedent Moisture Condition (AMC) first condition, since in the 5 days before 24 September, and more, no rainfall events occurred over the basin. Although there is consensus on the increase in flood peak after a fire, there is still no consistent methodology to estimate post-fire CN values [55]. In fact, the analysis of the hydrologic response of watersheds to fire is still a topic under investigation and only a few studies have been undertaken [56]. Most of them are mainly based on practical rules and/or experience and propose a modification of the CN value as a function of burn severity. In this study, two different approaches were adopted and implemented following two practical manuals provided by the U.S. National Forest Services: Uinta National Forest-Research Station [57] (hereafter called the HSR method) and Rocky Mountain-Research Station [58] (hereafter called the DS method). Table 4 summarizes the guidelines to choosing the post-fire CN. Concerning Ia, the α parameter was considered proportional to the level of fire severity, varying its value from 0.05 to 0.2 as a function of the soil infiltration capacity recorded in the different fire severity areas.
4. Results
4.1. Storm Severity
According to the rainfall data from the meteorological network, the storm event that occurred on 24 September hit the study area and the Tinella watershed at different times, intensity, and severity (Figure 3).
Rain gauges located in the northwestern part of the study area were the first to record the beginning of the storm event (at 5 p.m.). The storm was characterized by two rainfall peaks separated by ~1.5 h. Considering the rain gauges located in the north-western part of the study area, the first rainfall peak occurred between 5 and 6.15 p.m. and the intensity was between 80 and 100 mm h−1 (Figure 4a). The second peak was generally less intense (on average 55 mm h−1) and occurred between 8 and 9 p.m. Considering data from the rain gauge close to the Tinella watershed (i.e., the rain gauge number 1111) the storm appeared to shift temporally, and the first rainfall peak occurred at about 7 p.m., with the second one at past 9 p.m. The rainfall intensity exceeded the 100 mm h−1 in the first peak, whereas in the second one it was close to 60 mm h−1.
Severity graphs show that the storm was characterized by a return period of less than 10 years in large parts of the study area. However, in the northeastern part of the study area, the storm was characterized by a return period exceeding 20 years. In particular, severity calculated on data from rain gauge 10,666 and 14,131 showed a peak return period of 30 and 21 years, respectively, obtained for a critical rainfall duration of 150 and 180 min. Close to the Tinella watershed, however, the storm was extremely severe with two peak return periods exceeding 40 years. Specifically, the first one was about 120 years with a critical rainfall duration of about 40 min, whereas the second one was about 45 years with a critical rainfall duration of about 160 min. This contributed to the stress on the Tinella watershed during the storm event with significant repercussions on flood peak.
Concerning the spatial distribution of the return periods, the results of a linear interpolation of the maximum storm’s return periods obtained from data from each rain gauge in the study area, show that the front direction of the storm was oriented from the north-east to the south-west of the study area, reaching the center of the Tinella watershed with its maximum severity (i.e., 120 years) as shown in Figure 4b.
4.2. Burned Area
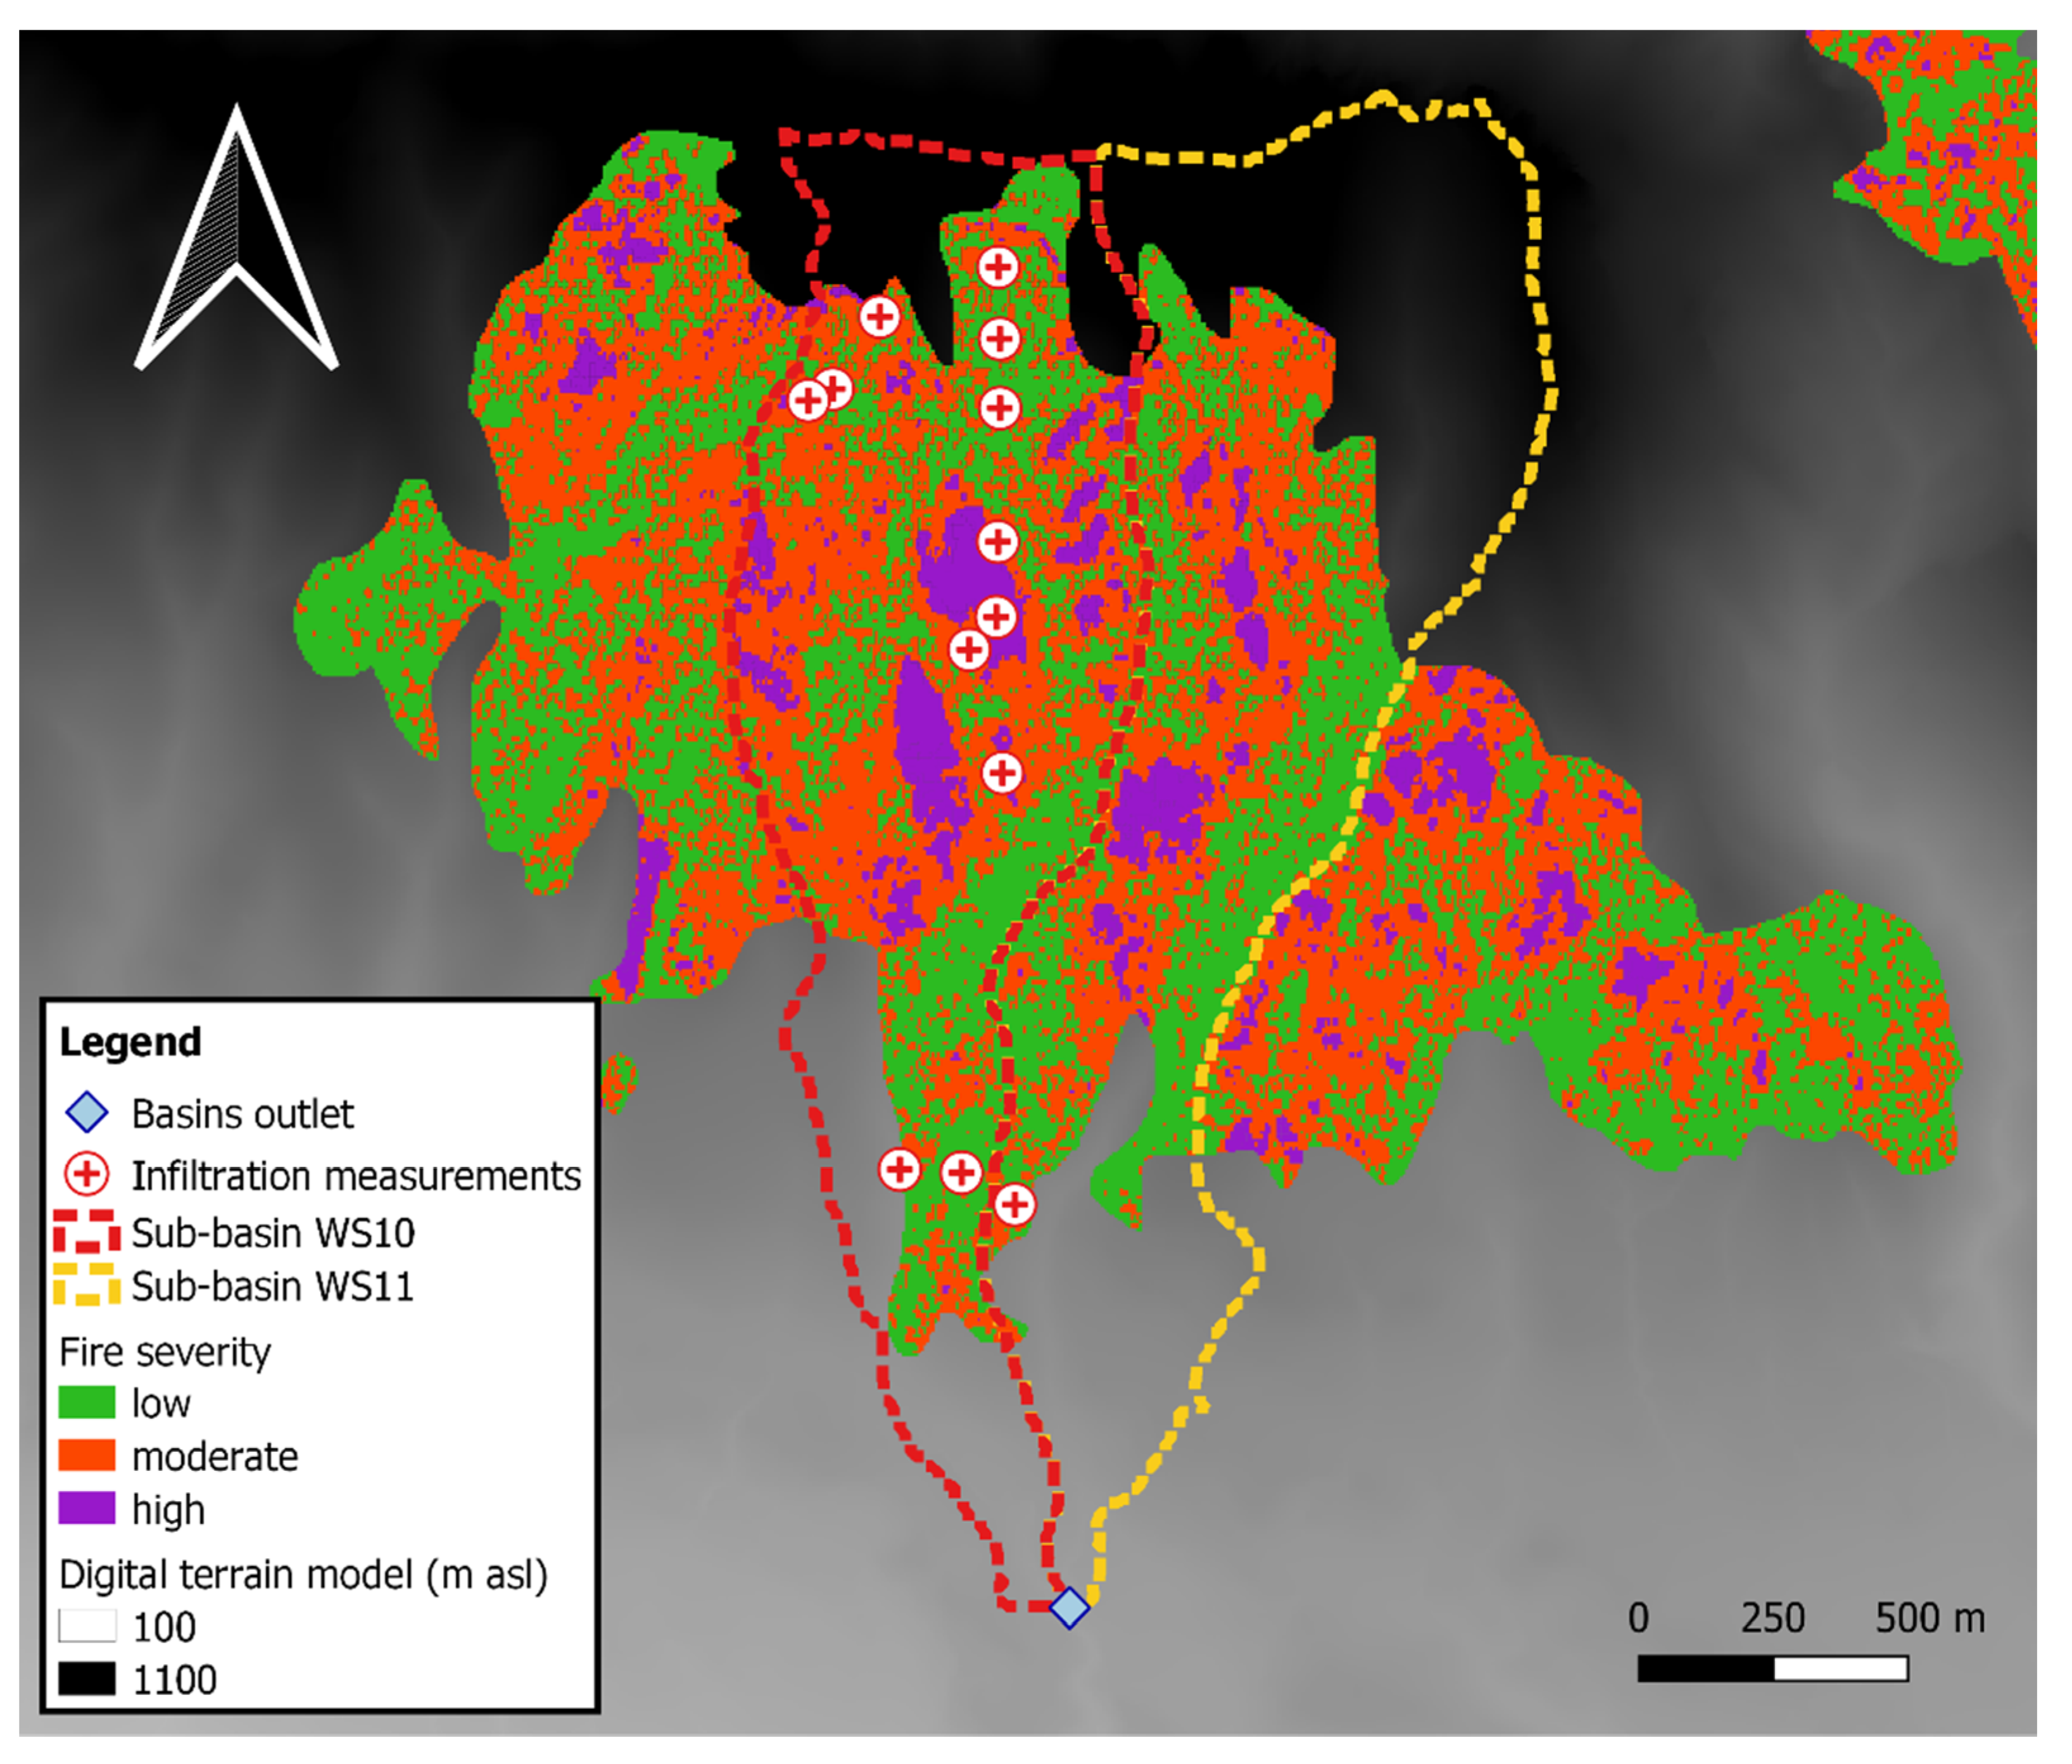
The fire event of October 2017 damaged about 62% of the Tinella watershed area (Figure 5). Analyzing the WS10 and WS11 sub-basins separately showed they were affected by different levels of burn severity. In the WS10, 29% of the sub-basin area (i.e., 0.37 km2) had a high level of burn severity, 42% (i.e., 0.53 km2) had a moderate level of burn severity, and 4% (i.e., 0.05 km2) had a low burn severity. Instead, in the WS11, 24% of the sub-basin area (i.e., 0.32 km2) showed a high burn severity, 25% (i.e., 0.34 km2) had a moderate level of burn severity, and 1% (i.e., 0.02 km2) had a low burn severity.
4.3. Soil Infiltration Response to Burn Severity
Soil sample analysis showed that the texture of the first layer of the soil is homogenous across the entire study domain, with no significant spatial pattern or differences in areas affected by different burn severity levels (see Figure 5). Overall, the soils were sandy loam (for about 62% of samples), followed by loam (23%) and loam-sandy (15). A good level of skeleton ranging from 13 to 50% of sample weight was found in all detected points, whereas from a visual inspection, soil samples presented a clear component of ash that was observed in the soil–water mixture during the deposition step of the texture lab analysis.
Results of soil infiltration measurements performed over May–June 2021, revealed that unsaturated hydraulic conductivity was smaller in highly burned sites than in low and moderate burned areas (Figure 6). Specifically, K was on average 7.9, 17.7 and 32.7 mm h−1 in high, moderate and low burned areas, respectively. The reduction in infiltration capacity from low burned areas to moderate and high burned sites was on average of 45% and 75%, respectively. A slight increase in standard deviation was observed in measurements carried out in low burned areas (about 10 mm h−1), whereas in moderate and high burned sites it was about 5 and 4 mm h−1, respectively. No significant spatial pattern was observed across the watershed.
4.4. Hydrological Impact of Storm on Watershed Runoff in Pre- and Post-Fire Condition
One of the impacts of fire on watershed runoff is the timing of hydrological response. The presence of burned areas inside the Tinella watershed alters the time of concentration value. In particular, tc was estimated as ~50 min both in WS10 and WS11 sub-basins in pre-fire conditions, whereas its value decreases to ~40 min in post-fire condition using both the HSR and DS method. The reduction of 20% in time of concentration led to speeding up the hydrological response of both the watershed to the precipitation causing a shift of the flood peak in post-fire conditions close to the rainfall peak (Figure 7a,b).
In pre-fire conditions, the hydrological response of WS10 and WS11 sub-basins to the two consecutive rainfall events (the first characterized by rainfall peak of about 60 mm h−1 and the second characterized by rainfall peak of about 40 mm h−1) was assessed to be very similar. This is also confirmed by the CN value found on average for the two portions of the Tinella watershed, which in pre-fire conditions was assessed to be about 66 in both WS10 and WS11.
In pre-fire conditions, the simulations produced flood peaks ranging between 3.5 and 4 m3 s−1 for both sub-basins (Figure 7a,b). The hydrological losses (considered through the CN value) in post-fire conditions were found to be 10% lower on average than in the pre-fire conditions. In post-fire conditions, the CN value was assessed to be 76 and 73 on average by applying the HSR method for the WS10 and WS11 sub-basin, respectively, whereas it was assessed to be 72 and 71 by applying the DS method. This led to a substantial increase in the flood peak in post-fire conditions in both the WS10 and WS11 sub-basins, however several differences were revealed. Concerning the WS10, the increase in the maximum flood peak from pre- to post-fire conditions was assessed to be 125%, more than doubling from about 4 to 9 m3 s−1 using the HSR method, and 75% using the DS method (from 4 to 7 m3 s−1). Slight differences in flood peaks were found during the second rainfall event using DS and HSR, with values ranging from 5.5 to 6.5 m3 s−1, respectively. In the WS11 sub-basin, the increase in the maximum flood peak from pre- to post-fire conditions was assessed to be 86% using the HSR method (i.e., from about 3.5 to 6.5 m3 s−1) and 57% using the DS method (i.e., from 3.5 to 5.5 m3 s−1). The flood peak difference between the WS10 and WS11 sub-basins in post-fire conditions was 2 m3 s−1 on average, whereas the maximum flood peak at the outlet of Tinella watershed was about 15 m3 s−1 (i.e., about two times the maximum flood peak in the pre-fire condition). The overall flood volume was estimated to be 39,700 m3 in the pre-fire condition, whereas in post-fire conditions it was about 69,400 m3 using the HSR method (i.e., 75% higher than the pre-fire condition) and 57,300 m3 using the DS method (i.e., about 45% higher than the pre-fire condition).
5. Discussion
Forest fire removed the canopy cover, and reduced soil infiltration capacity, all of which then increased flood peaks after subsequent rainfall events. The reduction in the soil infiltration capacity (−45% and −75% after moderate and high severity fires relative to low severity areas) is consistent with those reported in previous studies [59,60]. Fire-induced water repellency contributes to reduced soil infiltration rates, with stronger effects in higher fire severities [59]. In particular, the clogging of soil pores, caused by small particles of ash, reduces infiltration across the top layer of the soil, thus facilitating the development of surface runoff [60]. Robichaud [61] found that hydraulic conductivity in natural watersheds after high severity fire was 50% lower than in low severity fire, as a consequence of soil surface crusting and sealing. Plaza-Álvarez et al. [62] found that soil hydraulic conductivity in burned Mediterranean pine (Pinus pinaster Aiton) forests ranged from 20 to 50 mm h−1 with a constant decrease over all seasons of about 10 mm h−1 relative to unburned sites.
Flood peaks calculated under pre-fire conditions showed small variations (below 0.2 m3 s−1) between the first and second flood peaks occurring during the storm event (as shown in Figure 7a,b). This can be explained considering the characteristics of the SCS-CN approach applied for calculating the hydrological losses in the watershed. In particular, the method allocated most of the hydrological losses in the first stage of precipitation, which produced a stronger abatement of the flood peak resulting from the first rainfall relative to the second one, although the intensity of the first rainfall event was about 50% higher. Flood peaks increased in both watersheds as a result of forest fire, especially after the first rainfall event (+75–125% and +57–86% in WS10 and WS11, respectively, according to the methods used). Fire effects on flood peaks were less evident in WS11, where fire affected only half of the watershed area. This evidence confirms that the difference in hydrological response in WS11 compared to the WS10 sub-basin can be mainly ascribed to the different size of the burned areas and local differences in fire severity.
The enhanced hydrological response clearly highlights the increased sensitivity of the burned basin to rainstorms. Additional reinforcing effects, although not analyzed in this study, could be attributed to the reduction in water losses by evapotranspiration after fire-induced tree mortality, and to the lower surface roughness produced by the consumption of ground vegetation and litter [63]. Besides the impact on peak discharge, forest fire can also strongly increase sediment yields, with repercussions on soil erosion rates, water quality, and debris flow hazard [64].
The workflow illustrated in this study may contribute to the analysis of fire effects in ungauged watersheds, integrating analysis of canopy mortality, soil hydrological properties, and hydraulic responses in catchments with spatially heterogenous disturbance severities. These findings provide additional information that may help to improve the understanding of the effect of forest fires on hydrological response, which is especially relevant in the context of human-induced climate change. Global warming may in fact exacerbate hydrological hazards as a consequence of forest fire, as a consequence of increased fire frequency and severity [65], altered rainfall patterns [66], and loss of forest resilience due to disturbances [67]. In this context, more research is required to improve the model parametrization and calibration, while explicitly accounting for the spatial and temporal variability of hydrological responses. Lastly, an integrated approach for the analysis of hydrological consequences of forest fire in ungauged catchments could also support fire prevention and recovery activities by highlighting spatial priorities for silvicultural actions aimed at improving forest resistance to fire and accelerating post-fire recovery by afforestation measures, especially where natural vegetation response is not fast enough to ensure hydrogeologic protection against future extreme rainfall [68].
6. Conclusions
In this study, an integrated approach that exploits a combination of remote and in-situ data for a comprehensive evaluation of the impact of forest fire on hydrological response of natural watersheds was tested on a real case study located in northern Italy. Specifically, the NDVI obtained by Sentinel-2 images was used to identify burned areas in the watershed and their level of fire severity, whereas direct infiltration measurements performed in those areas through a Mini Disk Infiltrometer were used to better understand the infiltration capacity of the soils in post-fire conditions. These data were included in a semi-distributed rainfall–runoff model based on the SCS-CN method and lag-time for the calculation of hydrological losses and flow propagation over the watershed, respectively. Specifically, the impact of forest fire on the hydrological response was investigated through a modelling experiment on the Tinella watershed, which was affected by a forest fire about four years ago. On 24 September 2020, the Tinella watershed was hit by a storm event with a maximum recorded return period of 120 years, which resulted in several damaged sites within the watershed and downstream to the outlet. The characteristics of this storm event were used as meteorological input to the modelling approach. The CN value was adjusted as a function of the level of fire severity, whereas direct infiltration measurements carried out in watershed areas affected by different burn severity were adopted to obtain the proportional behavior of the initial abstraction as a function of burn severity level.
The results of this study show that the infiltration capacity of burned soil was deeply affected by the forest fire with an unsaturated hydraulic conductivity that decreased by 45% and 75% from low to moderate, and from low to high burned sites, respectively. The reduction in soil hydraulic conductivity and tree canopy cover actively altered the surface runoff. Runoff hydrographs were found to be much sharper with considerably higher flood peaks and runoff volumes. In particular, the flood peak and runoff volume in post-fire conditions increased by up to 2.2 and 1.7 times compared to the pre-fire conditions.
Author Contributions
Conceptualization, D.M. and G.V.; methodology, A.C. and D.M.; software, L.F. and D.M., field campaign: L.F.; investigation, L.F., A.C., G.V. and D.M.; resources, D.M.; data curation, L.F. and A.C.; writing—original draft preparation, L.F.; writing—review and editing, A.C., G.V. and D.M. All authors have read and agreed to the published version of the manuscript.
Funding
This research was conducted in the context of the traineeship at the Campo dei Fiori Regional Park and of the bachelor’s degree Thesis in Agrotechnology for the Environment and the Territory by Luca Folador at the University of Milan, and was part of the project TREE:HERO, acronym of “TREE distribution patterns: HillslopE failuRe prevention through forest management”, entirely funded by Fondazione Cariplo (Italy; Ref. 2017-0714) in the framework of “Research dedicated to hydrogeological instability: a contribution to the prevision, prevention and risk mitigation”.
Institutional Review Board Statement
Not applicable.
Informed Consent Statement
Not applicable.
Acknowledgments
The authors would like to thank Antonia Moreno Carrera for her support in the soil laboratory analysis, Marco Pistocchini and Alessandro Nicoloso for their support during the field campaign.
Conflicts of Interest
The authors declare no conflict of interest.
References
- Stoof, C.R.; Vervoort, R.W.; Iwema, J.; van den Elsen, E.; Ferreira, A.J.D.; Ritsema, C.J. Hydrological Response of a Small Catchment Burned by Experimental Fire. Hydrol. Earth Syst. Sci. 2012, 16, 267–285. [Google Scholar] [CrossRef] [Green Version]
- Lavabre, J.; Torres, D.S.; Cernesson, F. Changes in the Hydrological Response of a Small Mediterranean Basin a Year after a Wildfire. J. Hydrol. 1993, 142, 273–299. [Google Scholar] [CrossRef]
- DeBano, L.F.; Neary, D.G.; Ffolliott, P.F. Fire Effects on Ecosystems; John Wiley & Sons: Hoboken, NJ, USA, 1998; ISBN 0-471-16356-2. [Google Scholar]
- Inbar, M.; Tamir, M.; Wittenberg, L. Runoff and Erosion Processes After a Forest Fire in Mount Carmel, a Mediterranean Area. Geomorphology 1998, 24, 17–33. [Google Scholar] [CrossRef]
- Shakesby, R.; Doerr, S. Wildfire as a Hydrological and Geomorphological Agent. Earth-Sci. Rev. 2006, 74, 269–307. [Google Scholar] [CrossRef]
- Moody, J.A.; Shakesby, R.A.; Robichaud, P.R.; Cannon, S.H.; Martin, D.A. Current Research Issues Related to Post-Wildfire Runoff and Erosion Processes. Earth-Sci. Rev. 2013, 122, 10–37. [Google Scholar] [CrossRef]
- Soulis, K.X.; Generali, K.A.; Papadaki, C.; Theodoropoulos, C.; Psomiadis, E. Hydrological Response of Natural Mediterranean Watersheds to Forest Fires. Hydrology 2021, 8, 15. [Google Scholar] [CrossRef]
- DeBano, L.F. Water Repellency in Soils: A Historical Overview. J. Hydrol. 2000, 231–232, 4–32. [Google Scholar] [CrossRef]
- Certini, G. Effects of Fire on Properties of Forest Soils: A Review. Oecologia 2005, 143, 1–10. [Google Scholar] [CrossRef] [PubMed]
- Hoyt, W.G.; Troxell, H.C. Forests and Stream Flow. Trans. Am. Soc. Civ. Eng. 1934, 99, 1–30. [Google Scholar] [CrossRef]
- Anderson, H.W. Fire Effects on Water Supply, Floods, and Sedimentation. Proc. Tall Timbers Fire Ecol. Conf. 1976, 15, 249–260. [Google Scholar]
- Hessling, M. Hydrological Modelling and a Pair Basin Study of Mediterranean Catchments. Phys. Chem. Earth Part B Hydrol. Ocean. Atmos. 1999, 24, 59–63. [Google Scholar] [CrossRef]
- Loáiciga, H.A.; Pedreros, D.; Roberts, D. Wildfire-Streamflow Interactions in a Chaparral Watershed. Adv. Environ. Res. 2001, 5, 295–305. [Google Scholar] [CrossRef]
- Conedera, M.; Peter, L.; Marxer, P.; Forster, F.; Rickenmann, D.; Re, L. Consequences of Forest Fires on the Hydrogeological Response of Mountain Catchments: A Case Study of the Riale Buffaga, Ticino, Switzerland. Earth Surf. Process. Landf. 2003, 28, 117–129. [Google Scholar] [CrossRef]
- Rulli, M.C.; Rosso, R. Hydrologic Response of Upland Catchments to Wildfires. Adv. Water Resour. 2007, 30, 2072–2086. [Google Scholar] [CrossRef]
- Pierson, F.B.; Robichaud, P.R.; Moffet, C.A.; Spaeth, K.E.; Hardegree, S.P.; Clark, P.E.; Williams, C.J. Fire Effects on Rangeland Hydrology and Erosion in a Steep Sagebrush-dominated Landscape. Hydrol. Process. 2008, 22, 2916–2929. [Google Scholar] [CrossRef]
- Seibert, J.; McDonnell, J.J.; Woodsmith, R.D. Effects of Wildfire on Catchment Runoff Response: A Modelling Approach to Detect Changes in Snow-Dominated Forested Catchments. Hydrol. Res. 2010, 41, 378–390. [Google Scholar] [CrossRef] [Green Version]
- Versini, P.A.; Velasco, M.; Cabello, A.; Sempere-Torres, D. Hydrological Impact of Forest Fires and Climate Change in a Mediterranean Basin. Nat. Hazards 2013, 66, 609–628. [Google Scholar] [CrossRef]
- Rulli, M.C.; Bozzi, S.; Spada, M.; Bocchiola, D.; Rosso, R. Rainfall Simulations on a Fire Disturbed Mediterranean Area. J. Hydrol. 2006, 327, 323–338. [Google Scholar] [CrossRef]
- Rosso, R.; Rulli, M.C.; Bocchiola, D. Transient Catchment Hydrology after Wildfires in a Mediterranean Basin: Runoff, Sediment and Woody Debris. Hydrol. Earth Syst. Sci. Discuss. 2007, 11, 125–140. [Google Scholar] [CrossRef] [Green Version]
- Youberg, A.M.; Loverich, J.B.; Kellogg, M.J.; Fuller, J.E. Before the Fire: Assessing Post-Wildfire Flooding and Debris-Flowhazards for Pre-Disaster Mitigation. Nat. Hazards Earth Syst. Sci. Discuss. 2019. [Google Scholar] [CrossRef] [Green Version]
- Wieting, C.; Ebel, B.A.; Singha, K. Quantifying the Effects of Wildfire on Changes in Soil Properties by Surface Burning of Soils from the Boulder Creek Critical Zone Observatory. J. Hydrol. Reg. Stud. 2017, 13, 43–57. [Google Scholar] [CrossRef]
- Moody, J.A.; Martin, D.A. Post-Fire, Rainfall Intensity-Peak Discharge Relations for Three Mountainous Watersheds in the Western USA. Hydrol. Process. 2001, 15, 2981–2993. [Google Scholar] [CrossRef]
- Marqués, M.A.; Mora, E. The Influence of Aspect on Runoff and Soil Loss in a Mediterranean Burnt Forest (Spain). Catena 1992, 19, 333–344. [Google Scholar] [CrossRef]
- Cerda, A.; Imeson, A.C.; Calvo, A. Fire and Aspect Induced Differences on the Erodibility and Hydrology of Soils at La Costera, Valencia, Southeast Spain. Catena 1995, 24, 289–304. [Google Scholar] [CrossRef] [Green Version]
- Mayor, A.G.; Bautista, S.; Llovet, J.; Bellot, J. Post-Fire Hydrological and Erosional Responses of a Mediterranean Landscpe: Seven Years of Catchment-Scale Dynamics. Catena 2007, 71, 68–75. [Google Scholar] [CrossRef]
- Fowler, H.J.; Ali, H.; Allan, R.P.; Ban, N.; Barbero, R.; Berg, P.; Blenkinsop, S.; Cabi, N.S.; Chan, S.; Dale, M.; et al. Towards Advancing Scientific Knowledge of Climate Change Impacts on Short-Duration Rainfall Extremes. Philos. Trans. R. Soc. A 2021, 379, 20190542. [Google Scholar] [CrossRef]
- Konstantinidis, P.; Tsiourlis, G.; Xofis, P. Effect of Fire Season, Aspect and Pre-Fire Plant Size on the Growth of Arbutus Unedo L. (Strawberry Tree) Resprouts. For. Ecol. Manag. 2006, 225, 359–367. [Google Scholar] [CrossRef]
- Lari, S.; Frattini, P.; Crosta, G.B. Integration of Natural and Technological Risks in Lombardy, Italy. Nat. Hazards Earth Syst. Sci. 2009, 9, 2085–2106. [Google Scholar] [CrossRef]
- Norbiato, D.; Borga, M.; Sangati, M.; Zanon, F. Regional Frequency Analysis of Extreme Precipitation in the Eastern Italian Alps and the August 29, 2003 Flash Flood. J. Hydrol. 2007, 345, 149–166. [Google Scholar] [CrossRef]
- Braca, G.; Bussettini, M.; Lastoria, B.; Mariani, S. Linee Guida Per L’analisi e L’elaborazione Statistica Di Base Delle Serie Storiche Di Dati Idrologici; Istituto Superiore per la Protezione e la Ricerca Ambientale: Roma, Italy, 2013; p. 166. [Google Scholar]
- Bell, F.C. Generalized Rainfall-Duration-Frequency Relationships. J. Hydraul. Div. 1969, 95, 311–328. [Google Scholar] [CrossRef]
- De Santis, A.; Chuvieco, E. GeoCBI: A Modified Version of the Composite Burn Index for the Initial Assessment of the Short-Term Burn Severity from Remotely Sensed Data. Remote Sens. Environ. 2009, 113, 554–562. [Google Scholar] [CrossRef]
- Key, C.H.; Benson, N.C. Landscape Assessment: Ground Measure of Severity, the Composite Burn Index, and Remote Sensing of Severity, the Normalized Burn Index. In FIREMON: Fire Effects Monitoring and Inventory System; Lutes, D.C., Keane, R.E., Caratti, J.F., Key, C.H., Benson, N.C., Sutherland, S., Gangi, L.J., Eds.; General Technical Report RMRS GTR-164-CD; USDA Forest Service, Rocky Mountain Research Station: Ogden, UT, USA, 2006; pp. 1–51. [Google Scholar]
- Veraverbeke, S.; Gitas, I.; Katagis, T.; Polychronaki, A.; Somers, B.; Goossens, R. Assessing Post-Fire Vegetation Recovery Using Red–near Infrared Vegetation Indices: Accounting for Background and Vegetation Variability. ISPRS J. Photogramm. Remote Sens. 2012, 68, 28–39. [Google Scholar] [CrossRef] [Green Version]
- METER Group, Inc. Mini Disk Infiltrometer; METER Group, Inc.: Pullman, WA, USA, 2020. [Google Scholar]
- van Genuchten, M.T. A Closed-Form Equation for Predicting the Hydraulic Conductivity of Unsaturated Soils. Soil Sci. Soc. Am. J. 1980, 44, 892–898. [Google Scholar] [CrossRef] [Green Version]
- Zhang, R. Determination of Soil Sorptivity and Hydraulic Conductivity from the Disk Infiltrometer. Soil Sci. Soc. Am. J. 1997, 61, 1024–1030. [Google Scholar] [CrossRef]
- McCuen, R.H. Hydrologic Analysis and Design, 2nd ed.; Pearson Education/Prentice Hall: Upper Saddle River, NJ, USA, 1998; ISBN 978-0-13-134958-2. [Google Scholar]
- Mishra, S.K.; Singh, V.P. Validity and Extension of the SCS-CN Method for Computing Infiltration and Rainfall-Excess Rates. Hydrol. Process. 2004, 18, 3323–3345. [Google Scholar] [CrossRef]
- Mockus, V. Estimation of Direct Runoff from Storm Rainfall. In National Engineering Handbook; U.S. Department of Agriculture, Soil Conservation Service: Washington, DC, USA, 1964; Volume 4, p. 28. [Google Scholar]
- Ponce, V.M.; Hawkins, R.H. Runoff Curve Number: Has It Reached Maturity? J. Hydrol. Eng. 1996, 1, 11–19. [Google Scholar] [CrossRef]
- USDA National Resources Conservation Service. National Engineering Handbook: Part 630-Hydrology; U.S. Department of Agriculture: Washington, DC, USA, 2004. [Google Scholar]
- Yuan, Y.; Mitchell, J.K.; Hirschi, M.C.; Cooke, R.A.C. Modified SCS Curve Number Method for Predicting Subsurface Drainage Flow. Trans. ASAE 2001, 44, 1673–1682. [Google Scholar] [CrossRef]
- Jain, M.K.; Mishra, S.K.; Suresh Babu, P.; Venugopal, K.; Singh, V.P. Enhanced Runoff Curve Number Model Incorporating Storm Duration and a Nonlinear Ia-S Relation. J. Hydrol. Eng. 2006, 11, 631–635. [Google Scholar] [CrossRef]
- Jain, M.K.; Mishra, S.K.; Suresh Babu, P.; Venugopal, K. On the Ia–S Relation of the SCS-CN Method. Hydrol. Res. 2006, 37, 261–275. [Google Scholar] [CrossRef]
- Caletka, M.; Šulc Michalková, M.; Karásek, P.; Fučík, P. Improvement of SCS-CN Initial Abstraction Coefficient in the Czech Republic: A Study of Five Catchments. Water 2020, 12, 1964. [Google Scholar] [CrossRef]
- Krajewski, A.; Sikorska-Senoner, A.E.; Hejduk, A.; Hejduk, L. Variability of the Initial Abstraction Ratio in an Urban and an Agroforested Catchment. Water 2020, 12, 415. [Google Scholar] [CrossRef] [Green Version]
- Gericke, O.J.; Smithers, J.C. Review of Methods Used to Estimate Catchment Response Time for the Purpose of Peak Discharge Estimation. Hydrol. Sci. J. 2014, 59, 1935–1971. [Google Scholar] [CrossRef]
- Ravazzani, G.; Boscarello, L.; Cislaghi, A.; Mancini, M. Review of Time-of-Concentration Equations and a New Proposal in Italy. J. Hydrol. Eng. 2019, 24, 04019039. [Google Scholar] [CrossRef]
- de Almeida, I.K.; Almeida, A.K.; Anache, J.A.A.; Steffen, J.L.; Alves Sobrinho, T.A. Estimation on Time of Concentration of Overland Flow in Watersheds: A Review. Geociências 2014, 33, 661–671. [Google Scholar]
- Woodward, D.E. Chapter 15. Time of Concentration. In Hydrology National Engineering Handbook; Hoeft, C.C., Humpal, A., Cerrelli, G., Eds.; USDA: Washington, DC, USA, 2010; p. 29. [Google Scholar]
- Galli, A.; Peruzzi, C.; Beltrame, L.; Cislaghi, A.; Masseroni, D. Evaluating the Infiltration Capacity of Degraded vs. Rehabilitated Urban Greenspaces: Lessons Learnt from a Real-World Italian Case Study. Sci. Total Environ. 2021, 787, 147612. [Google Scholar] [CrossRef]
- USDA National Resources Conservation Service. Urban Hydrology for Small Watersheds TR55; U.S. Department of Agriculture: Washington, DC, USA, 1986; p. 164. [Google Scholar]
- Leopardi, M.; Scorzini, A.R. Effects of Wildfires on Peak Discharges in Watersheds. iForest 2015, 8, 302–307. [Google Scholar] [CrossRef] [Green Version]
- Lucas-Borja, M.E.; Bombino, G.; Carrà, B.G.; D’Agostino, D.; Denisi, P.; Labate, A.; Plaza-Alvarez, P.A.; Zema, D.A. Modeling the Soil Response to Rainstorms after Wildfire and Prescribed Fire in Mediterranean Forests. Climate 2020, 8, 150. [Google Scholar] [CrossRef]
- Higginson, B.; Jarnecke, J. Salt Creek BAER-2007 Burned Area Emergency Response; Hydrology Specialist Report; Uinta National Forest: Provo, UT, USA, 2007; p. 11. [Google Scholar]
- Foltz, R.B.; Robichaud, P.R.; Rhee, H. A Synthesis of Postfire Road Treatments for BAER Teams: Methods, Treatment Effectiveness, and Decisionmaking Tools for Rehabilitation; U.S. Department of Agriculture, Forest Service, Rocky Mountain Research Station: Fort Collins, CO, USA, 2008; p. RMRS-GTR-228. [Google Scholar]
- Doerr, S.H.; Shakesby, R.A.; Walsh, R.P.D. Soil Hydrophobicity Variations with Depth and Particle Size Fraction in Burned and Unburned Eucalyptus Globulus and Pinus Pinaster Forest Terrain in the Águeda Basin, Portugal. Catena 1996, 27, 25–47. [Google Scholar] [CrossRef]
- Hendrayanto; Kosugi, K.; Takahisa, M. Scaling Hydraulic Properties of Forest Soils. Hydrol. Process. 2000, 14, 521–538. [Google Scholar] [CrossRef]
- Robichaud, P.R. Fire Effects on Infiltration Rates after Prescribed Fire in Northern Rocky Mountain Forests, USA. J. Hydrol. 2000, 231–232, 220–229. [Google Scholar] [CrossRef]
- Plaza-Álvarez, P.A.; Lucas-Borja, M.E.; Sagra, J.; Zema, D.A.; González-Romero, J.; Moya, D.; De las Heras, J. Changes in Soil Hydraulic Conductivity after Prescribed Fires in Mediterranean Pine Forests. J. Environ. Manag. 2019, 232, 1021–1027. [Google Scholar] [CrossRef] [PubMed]
- Stoof, C.R.; Ferreira, A.J.D.; Mol, W.; Van den Berg, J.; De Kort, A.; Drooger, S.; Slingerland, E.C.; Mansholt, A.U.; Ferreira, C.S.S.; Ritsema, C.J. Soil Surface Changes Increase Runoff and Erosion Risk after a Low–Moderate Severity Fire. Geoderma 2015, 239–240, 58–67. [Google Scholar] [CrossRef]
- Grangeon, T.; Vandromme, R.; Cerdan, O.; Girolamo, A.M.D.; Lo Porto, A. Modelling Forest Fire and Firebreak Scenarios in a Mediterranean Mountainous Catchment: Impacts on Sediment Loads. J. Environ. Manag. 2021, 289, 112497. [Google Scholar] [CrossRef]
- Turco, M.; Rosa-Cánovas, J.J.; Bedia, J.; Jerez, S.; Montávez, J.P.; Llasat, M.C.; Provenzale, A. Exacerbated Fires in Mediterranean Europe Due to Anthropogenic Warming Projected with Non-Stationary Climate-Fire Models. Nat. Commun. 2018, 9, 3821. [Google Scholar] [CrossRef]
- Rajczak, J.; Schär, C. Projections of Future Precipitation Extremes over Europe: A Multimodel Assessment of Climate Simulations. J. Geophys. Res. Atmos. 2017, 122, 10–773. [Google Scholar] [CrossRef]
- Stevens-Rumann, C.S.; Kemp, K.B.; Higuera, P.E.; Harvey, B.J.; Rother, M.T.; Donato, D.C.; Morgan, P.; Veblen, T.T. Evidence for Declining Forest Resilience to Wildfires under Climate Change. Ecol. Lett. 2018, 21, 243–252. [Google Scholar] [CrossRef] [PubMed]
- Soulis, K.X. Estimation of SCS Curve Number Variation Following Forest Fires. Hydrol. Sci. J. 2018, 63, 1332–1346. [Google Scholar] [CrossRef]
Figure 1.
Position of the Tinella watershed, its two sub-basins (WS10 and WS11) and the rain gauge network present in the study area.
Figure 1.
Position of the Tinella watershed, its two sub-basins (WS10 and WS11) and the rain gauge network present in the study area.

Figure 2.
Steps of the integrated approach.

Figure 3.
Spatial distribution of storm severity: the coloured contour lines and the labels written in in black describe the return period of storm (year), whereas the labels in blue describe the rain-gauge stations.
Figure 3.
Spatial distribution of storm severity: the coloured contour lines and the labels written in in black describe the return period of storm (year), whereas the labels in blue describe the rain-gauge stations.

Figure 4.
(a) Temporal distribution of rainfall intensity, and (b) severity graph obtained from each rain gauge located in the study area.
Figure 4.
(a) Temporal distribution of rainfall intensity, and (b) severity graph obtained from each rain gauge located in the study area.

Figure 5.
Areas affected by fire, burn severity and position of infiltration measurements.

Figure 6.
Unsaturated hydraulic conductivity measured in different forest areas affected by different burn severity levels.
Figure 6.
Unsaturated hydraulic conductivity measured in different forest areas affected by different burn severity levels.

Figure 7.
Tinella watershed runoff (Q) before and after the forest fire calculated with the HSR and DS methods. (a) Runoff formation from the WS10 sub-basin. (b) Runoff formation from the WS11 sub-basin. Rainfall intensity calculated as weighted average of the rainfall data recorded by the rain gauge network in the study area is also shown, indicating strikingly similar pluviographs.


Table 1.
Morphometric features of the Tinella sub-basins WS10 and WS11.
| Parameter | WS10 Western Sub-Basin | WS11 Eastern Sub-Basin |
|---|---|---|
| Area (km2) | 1.26 | 1.34 |
| Perimeter (m) | 8051 | 8751 |
| Length of the main water stream (m) | 2752.58 | 3426.99 |
| Mean slope of the watershed (%) | 45.07 ± 13.68 | 46.67 ± 15.84 |
| Mean slope of the main water stream (%) | 22.87 | 20.74 |
| Minimum elevation (m) | 475.72 | 475.00 |
| Mean elevation (m) | 841.56 ± 197.84 | 854.85 ± 198.77 |
| Maximum elevation (m) | 1221.02 | 1226.03 |
Table 2.
Coordinates of the rain-gauge stations and their distance from the watershed outlet.
| Sensor Code | Site | East * | North * | Distance from the Watershed Outlet (m) | Elevation (m asl) |
|---|---|---|---|---|---|
| 8152 | Arcisate | 491,501 | 5,076,955 | 9451 | 334.66 |
| 9091 | Castronno | 486,058 | 5,066,146 | 12,658 | 365.76 |
| 8150 | Cuveglio | 480,047 | 5,083,338 | 5564 | 276.71 |
| 14,131 | Lavena Ponte Tresa | 488,398 | 5,090,913 | 14,193 | 273.53 |
| 8583 | Laveno Mombello | 471,939 | 5,084,222 | 11,848 | 950.00 |
| 8587 | Laveno Mombello | 470,425 | 5,084,109 | 13,121 | 194.37 |
| 8163 | Luino | 480,079 | 5,094,539 | 16,488 | 194.38 |
| 19,356 | Porto Ceresio | 491,668 | 5,082,687 | 10,550 | 279.99 |
| 22,022 | Porto Valtravaglia | 477,812 | 5,087,930 | 10,664 | 872.17 |
| 10,666 | Valganna | 485,317 | 5,084,612 | 7179 | 657.55 |
| 14,527 | Varano Borghi | 477,631 | 5,068,133 | 11,007 | 239.47 |
| 8228 | Varese | 486,300 | 5,075,452 | 4983 | 407.17 |
| 1111 | Luvinate | 481,511 | 5,076,293 | 1985 | 408.97 |
* WGS 84/UTM zone 32N—EPSG:32632.
Table 3.
CN values (-) applied over Tinella watershed as a function of forest type (deciduous broadleaf, evergreen coniferous and mixed forests) and hydrological group (A, B, C and D).
Table 3.
CN values (-) applied over Tinella watershed as a function of forest type (deciduous broadleaf, evergreen coniferous and mixed forests) and hydrological group (A, B, C and D).
| Land Use | A | B | C | D |
|---|---|---|---|---|
| Deciduous broadleaf | 42 | 66 | 79 | 85 |
| Evergreen coniferous | 34 | 60 | 73 | 79 |
| Mixed forest | 38 | 62 | 75 | 81 |
Table 4.
Post-fire CN as a function of burn severity.
| HSR Method | |
| High burn severity | CNpost = CNpre + 15 |
| Moderate burn severity | CNpost = CNpre + 10 |
| Low burn severity | CNpost = CNpre + 5 |
| DS Method | |
| High burn severity with water repellent soils | CNpost = 95 |
| High burn severity without water repellent soils | CNpost = 90 to 91 |
| Moderate burn severity with water repellent soils | CNpost = 90 |
| Moderate burn severity without water repellent soils | CNpost = 85 |
| Low burn severity | CNpost = CNpre + 5 |
Publisher’s Note: MDPI stays neutral with regard to jurisdictional claims in published maps and institutional affiliations. |
© 2021 by the authors. Licensee MDPI, Basel, Switzerland. This article is an open access article distributed under the terms and conditions of the Creative Commons Attribution (CC BY) license (https://creativecommons.org/licenses/by/4.0/).
Share and Cite
MDPI and ACS Style
Folador, L.; Cislaghi, A.; Vacchiano, G.; Masseroni, D. Integrating Remote and In-Situ Data to Assess the Hydrological Response of a Post-Fire Watershed. Hydrology 2021, 8, 169. https://0-doi-org.brum.beds.ac.uk/10.3390/hydrology8040169
AMA Style
Folador L, Cislaghi A, Vacchiano G, Masseroni D. Integrating Remote and In-Situ Data to Assess the Hydrological Response of a Post-Fire Watershed. Hydrology. 2021; 8(4):169. https://0-doi-org.brum.beds.ac.uk/10.3390/hydrology8040169
Chicago/Turabian StyleFolador, Luca, Alessio Cislaghi, Giorgio Vacchiano, and Daniele Masseroni. 2021. "Integrating Remote and In-Situ Data to Assess the Hydrological Response of a Post-Fire Watershed" Hydrology 8, no. 4: 169. https://0-doi-org.brum.beds.ac.uk/10.3390/hydrology8040169
Note that from the first issue of 2016, this journal uses article numbers instead of page numbers. See further details here.