
nZVI Mobility and Transport: Laboratory Test and Numerical Model


1
Department of Civil, Constructional and Environmental Engineering (DICEA), Sapienza University of Rome, 00184 Rome, Italy
2
Italian Institute for Environmental Protection and Research (ISPRA), 00144 Rome, Italy
*
Author to whom correspondence should be addressed.
Hydrology 2022, 9(11), 196; https://0-doi-org.brum.beds.ac.uk/10.3390/hydrology9110196
Submission received: 16 September 2022
/
Revised: 21 October 2022
/
Accepted: 1 November 2022
/
Published: 3 November 2022
Abstract
:Zerovalent iron nanoparticles (nZVI) are becoming one of the most widely recommended nanomaterials for soil and groundwater remediation. However, when nZVI are injected in the groundwater flow, the behavior (mobility, dispersion, distribution) is practically unknown. This fact generally results in the use of enormous quantities of them at the field scale. The uncertainties are on the effective volumes reached from the plume of nZVI because their tendency to aggregate and their weight can cause their settling and deposition. So, the mobility of nanoparticles is a real issue, which can often lead to inefficient or expensive soil remediation. Furthermore, there is another aspect that must be considered: the fate of these nZVI in the groundwater and their possible impact on the subsoil environment. All these considerations have led us to propose an application of nZVI simulating the permeation technique through a laboratory experience, finalized to have a better, or even simpler description of their real behavior when injected in a flow in the subsoil. A two-dimensional laboratory-scale tank was used to study the dispersion and transport of nZVI. A nZVI solution, with a concentration equal to 4.54 g/L, was injected into glass beads, utilized as porous medium. The laboratory experiment included a digital camera to acquire the images. The images were then used for calibrating a numerical model. The results of the mass balance confirm the validity of the proposed numerical model, obtaining values of velocity (5.41 × 10⁻³ m/s) and mass (1.9 g) of the nZVI of the same order of those from the experimental tests. Several information were inferred from both experimental and numerical tests. Both demonstrate that nZVI plume does not behave as a solute dissolved in water, but as a mass showing its own mobility ruled mainly from the buoyancy force. A simple simulation of a tracer input and a nZVI plume are compared to evidence the large differences between their evolution in time and space. This means that commercial numerical models, if not corrected, cannot furnish a real forecast of the volume of influence of the injected nZVI. Further deductions can be found from the images and confirmed by means the numerical model where the detachment effect is much smaller than the attachment one (ratio kd/ka = 0.001). From what is reported, it is worthwhile to pay attention on the localization of the contaminants source/plume to reach an effective treatment and it is important to go further in the improvement of solution for the limiting the nanoparticles aggregation phenomenon.
1. Introduction
Pollutant release is a worldwide issue that has been known for decades. This phenomenon may occur accidentally or due to anthropogenic activities, which ultimately result in soil and water pollution, leading to many health hazards [1,2,3]. Heavy metals (arsenic, chromium, lead, cadmium, mercury, zinc) and polycyclic aromatic hydrocarbons (PAHs) are two of the major environmental pollutants [3,4,5]. In recent years, in situ remediation techniques have been increasingly used as they avoid costs associated with the excavation and transport of the contaminated soil for off-site treatments [2]. Generally, in situ remediation techniques exploit phenomena such as biological, chemical, physical and/or thermal stabilization processes directly inside the subsoil [2,6,7,8,9]. However, it is necessary to consider carefully specific field conditions, such as weather, soil permeability, contamination depth, and potential deep chemical leaching [2]. Recently, nanotechnology has been successfully applied to environmental remediation, reaching inaccessible areas such as crevices and aquifers and thus eliminating the necessity for costly traditional operations [10]. Nanoremediation is a remediation technique through which reactive nanomaterials (i.e., nanoparticles) are injected in situ for the transformation and detoxification of pollutants, without the need for excavations and removal of polluting materials [11,12]. Zerovalent Iron Nanoparticles (nZVI) have been used for in situ remediation of a wide range of contaminants, both organic and inorganic [13]. In fact, laboratory tests and also pilot applications have demonstrated that nZVI application is effective to immobilize some harmful metals and metalloids, such as silver (Ag), aluminum (Al), arsenic (As), beryllium (Be), cadmium (Cd), chromium (Cr), copper (Cu), mercury (Hg), nickel (Ni), lead (Pb), uranium (U), vanadium (V), and zinc (Zn) [6,14,15]. ZeroValent Iron (ZVI) nanoparticles are characterized by a typical core–shell structure, with a diameter generally below 100 nm [16]. The core mainly consists of zerovalent iron (Fe0) and provides the reducing power for reactions with environmental contaminants. Instead, the shell consists of iron oxides/hydroxides (i.e., Fe2+ and Fe3+), because iron typically exists in the environment as iron(II)- and iron(III)-oxides, formed from the oxidation of zerovalent iron [17,18,19]. The presence of two layers in the core–shell structure generates useful properties for contaminant removal. The transport of nZVI to the pollutant source zone is fundamental for the success of in situ remediation [20]. Due to their small size, while nZVI particles are traveling through porous media, they can rapidly aggregate, leading to the development of larger-sized particles and increasing the possibility of settling and deposition [21,22]. Studies [18,23,24], based on laboratory and field activities, report that nanoparticles, when dispersed in water, tend to behave like colloids. The mechanical behavior of colloids, and nanoparticles as well, is strongly influenced by electrostatic repulsion deriving from the electrical double layer (EDL), and by the Van der Waals attraction, developed between the particles dispersed in water, according to Derjaudin–Landau-Verwey–Overbeek (DLVO) theory [23,24,25]. These forces can cause the aggregation of the nanoparticles with the formation of particles with a larger size, and therefore it is possible that the specific surface area is reduced [26,27]. By maximizing repulsive electrostatic forces between colloids, the formation of nZVI aggregates is controlled and each nZVI is kept free. When the nZVI are injected in porous medium, the main issue is the high tendency to aggregation, with the formation of large-size particles, and therefore to sedimentation phenomena [28,29]. These phenomena can alter the mobility of the nanoparticles in porous media, sometimes making remediation interventions ineffective. Moreover, a further limitation about nZVI mobility is also due to the possible affinity between nZVI and minerals of the soil grains, thus resulting in nZVI deposition onto the porous matrix. In fact, physical-chemical phenomena, based on the interaction between colloids and porous matrix, can influence the transport and mobility of nanoparticles [24]:
- -
- Physical mechanisms: the filtration and straining phenomena. The first one is a generally irreversible phenomenon, according to which the particles are greater than the pores, so the colloids remain trapped [30,31]. On the contrary, the latter is a reversible process in which particles, being smaller than pores, are filtered by the intergranular contact points [30,31];
- -
- Chemical mechanisms. These mechanisms typically result in dynamic deposition and release phenomena, with different behaviors in the early and advanced stages of deposition. During the initial phase, no particle is attached on the surface of the solid grains, and therefore the attached colloids do not influence the total interaction energy between particles and solid grains. During the advanced stages of deposition, a significant number of particles is already deposed on the porous matrix, and thus influences deposition kinetics. In this way, the collector includes both the porous medium and the deposed particles [30]. The main processes are: (i) irreversible attachment, if attractive Van der Waals forces are predominant and the nZVI attachment in primary minimum is generally considered to be irreversible; (ii) linear reversible attachment (known as attachment—detachment), if attractive Van der Waals forces and EDL repulsive forces are similar and the deposition is not limited or affected by the amount of deposed particles [24,32,33]; (iii) blocking phenomenon, if repulsive energies are predominant and the deposed particles exclude the suspended colloids that are close to the soil grain, reaching a maximum concentration of colloids on the surface grain [30,32] and (iv) ripening phenomenon, if attractive energies are predominant and the deposed particles tend to attract the suspended ones, leading to higher concentrations of attached colloids until the porous medium is completely clogged [24,30].
Therefore, considering these mechanisms, the nZVI transport in porous media can be represented by a modified advection-dispersion partial differential equation, including a term to define the interaction between particles (nZVI) in the liquid (water) and solid phase. Therefore, the paper presents an experimental laboratory test for the nZVI injection in a saturated porous medium, with a reconstructed groundwater flow in a two-dimensional tank. The results obtained by laboratory tests were used to calibrate a numerical model in order to study the nZVI transport in a saturated porous medium. The aim of this paper is to enhance the knowledge of the behavior of the nZVI once they are injected into the saturated soil. The main task is to verify if the usual hypothesis employed when a classic numerical model is applied in the simulation of the influence volume of nZVI injections can be used. In fact, the understanding of the nZVI transport mechanisms during the injection phase in the field and the development of numerical models are fundamental for the correct planning of the remediation intervention. The proposed model has evidenced that if the injection system is articulated on different points, the result is always a limited dispersion accompanied by a strong influence of the buoyancy force that does not allow to consider the particles completely subjected to the flow motion. In particular, this last evidence leads to specific difficulties in the application of standard models for the analysis of the influence areas of the nZVI in the groundwater remediation technology.
2. Materials and Methods
The injection of nZVI suspensions through direct push technology or via various types of wells (e.g., temporary or permanent injection wells) looks to be a promising remediation technique for contaminated aquifers [6,14,34,35,36]. The direct push system involves the injection of nanoparticles in suspensions with high pressure and high flow rate. However, this technique can lead to the formation of preferential flow paths, therefore to an irregular distribution in the soil, and in some case also to the fracturing of the porous medium structure [11,30,35]. On the contrary, in the case of permeation injection with piezometers or simple gravity wells, the pressures and rates are low [30]. This should also ensure a more homogeneous distribution of the nZVI suspension around the injection point and generally avoid the formation of preferential flow paths. However, the permeation injection is not compatible with low permeability aquifers. Due to low injection pressures, nanoparticles can settle at the point of injection, causing the clogging of the porous medium [11,35]. In fact, permeation injection is generally used in case of medium-coarse formations. This paper investigates at the lab scale the behavior of nanoparticles once introduced in groundwater by means of percolation systems. The results of laboratory experience were used to calibrate a numerical model.
2.1. Laboratory Investigation: Experimental Set-Up
The laboratory experiment used the flush of a volume of tap water for a total time of 10 min inside a saturated porous medium, reproduced through a plexiglass tank, partially filled with micro glass beads. During the first 2 min and 11 s of the experiment, a nZVI + water solution, at a known concentration, has been introduced into the saturated porous medium using a peristaltic pomp. During the experiment, digital images have been acquired for the calibration of the numerical model by a digital camera.
The experimental set-up is presented in detail in a previous paper [37]. However, here, a short description is reported. The tank, used in the lab tests, has a width of 52 cm, a height of 39 cm, a thickness of 7 cm and is made of plexiglass. The tank was partially filled with micro glass beads (400–800 μm- produced by Sigmund Lindner) for a total height of 29 cm. It is assumed that micro glass beads can be considered a homogeneous porous medium. Table 1 shows the main features of the micro glass beads used in the experiment.
The test was carried out under conditions that allowed us to consider the motion of the fluid characterized by means of a 2D approach. In fact, the width of the tank proved to be much smaller than its length and height. Figure 1 shows the layout of the experimental apparatus.
In the test, the flush of a volume of tap water equal to 28,000 mL for a total time of 10 min was used. Water motion was assured by means of a peristaltic pump, as shown in Figure 1. A water flow velocity (5.70 × 10⁻³ m/s) was calculated.
During the first 2 min and 11 s of the experiment, a nZVI + water solution, with a concentration equal to 4.54 g/L, has been introduced into the saturated porous medium using a peristaltic pomp (Figure 1) simulating a permeation injection. Nanofer25S were selected and purchased from NANO IRON s.r.o. (Rajhrad, Czech Republic) [11,14,36,38,39,40]. Nanofer25S solution can be characterized as follows (Table 2):
The sample of Nanofer25S is equipped with a stabilizing solution in polyacrylic acid—PAA (3%) (Table 2), which can reduce surface forces between the nanoparticles. Some studies [41,42,43] have examined the behavior of nZVI when stabilized by polyacrylic acid (PAA), and then verified its efficiency to stabilize nanoparticles and improve their transport. As shown in Figure 1, the experiment involved the use of a solution of water and nZVI, injected in the porous medium, whose features are shown in Table 3.
The nZVI + water (Table 3) solution was introduced into the tank using a low-pressure pump for a total time of 2 min and 11 s, simulating then the dispersion on the water table of the nZVI and their percolation in the subsoil. Figure 1 shows the two injection points of nZVI, placed on the surface of the saturated porous medium:
- -
- Point 1 (P1): x = 21 cm and y = 5 cm
- -
- Point 2 (P2): x = 30 cm and y = 5 cm
Figure 1 shows that the tank has been illuminated by two halogen lamps, located behind the tank at a distance of 200 cm with respect to the camera. The experiment set also included the use of a Nikon (D80) digital camera with 10 megapixels as image resolution, fixed on a tripod for the acquisition of the images located before the tank. The camera was placed in a fixed position 150 cm away from the tank (Figure 1). The camera was remotely controlled by means of a software (Camera Control Pro 2.0) in order to set the frequency of image acquisition (Figure 1).
2.2. Numerical Model
The numerical model has the aim to develop a tool for simulating the mobility and transport of nanoparticles in a saturated porous medium using a 2D approach; furthermore, it can be useful in this phase for a better understanding of the processes involved. The model can in fact give, thanks to its calibration by means of images of the involved processes, an idea of the behavior of the nanoparticles once they are injected in a saturated porous medium and subject to a velocity flow. The simulation presented in this paper concerns the calibration of the model based on lab tests, the application for evidencing the efficiency of nZVI and the comparison of nZVI compared to a dissolved tracer substance. From the results, the different behavior of the nZVI compared to a substance completely subject to the fluid motion and the importance of the location of the injection wells or leakage area are evident.
The model provides before the calculation of the hydraulic head following the well-known approach Equation (1).
As the initial condition, static distribution of the piezometric level was adopted and the flow was assured with Dirichlet and Neumann conditions at boundaries (point of inlet and point of outlet). Defining the velocity field, it is possible to study the nZVI motion.
The nZVI transport in porous media can be represented by a modified advection-dispersion partial differential equation, including a term to define the interaction between particles (nZVI) in the liquid (water) and solid phase and the interaction with the eventual contamination present. Several studies [24,31,35,37,44] have shown that for a generic domain, the nZVI transport equation can be expressed as follows (Equations (2) and (3)):
where ε is the porosity of the medium [−], vi is the Darcy velocity along the ith direction [m/s], C is the nZVI concentration in the mobile phase [g/m3], Si is the nZVI concentration in the solid phase [mg/g], estimated as the mass of deposited particles by the unit of the porous medium mass, Dij is the dispersion coefficient tensor [m2/s] and ρb is the bulk density of the solid matrix [g/m3]. The first term on the left-hand side of the Equation (2) shows the variation over time of the nZVI concentration in the liquid phase and the second term represents the mass transfer from the liquid phase to the solid phase. On the right-hand side of the Equation (2), we find the classical terms representing the advection and the diffusion. The velocity, on the right-hand side of the Equation (2), was obtained using the well-known Darcy law. However, according to previous results [37,45], the nZVI plume does not behave as a solute dissolved in water, but as a whole. Their mobility does not appear only subject to the fluid motion but also characterized by its own mobility due to the aggregation phenomena. So, in order to consider the further velocity contribution, in addition to the water velocity, a modification for the y-velocity (vy(ij)) in the advection term of the nZVI transport equation was introduced, considering a corrective factor (α). The velocity is then calculated according to Equation (4):
The corrective factor (α) is used to take into account the contribution in the vertical direction of the sedimentation velocity of nanoparticles, using Stokes law (vs), according to Equation (5):
The Equation (3) represents the exchange between liquid and solid phase, according to particle-particle or particle-porous matrix interaction mechanisms. The variable f in the Equation (3) is a generic function expressing the deposition and release of particles. Studies in the literature [24,35,37,46] show that several mechanisms, chemical phenomena, influence the particle-particle or particle-porous matrix interactions: (i) irreversible attachment, (ii) linear reversible attachment (known as attachment—detachment), (iii) blocking phenomenon and (iv) ripening phenomenon. The particular behavior of the nZVI plume, according to preliminary research [37], in the case of direct push injection, has evidenced that the use of the classical dispersion equation cannot provide a reliable result because of the importance of phenomena such as aggregation and buoyancy force that allows for a partial independence of the plume motion with respect to the water one. The interaction equation can be represented in an explicit way by means of the following discretized Formula (6):
where Ci,j is the nZVI concentration in the liquid phase and Si,j is the nZVI concentration in the in the solid phase, developed according to linear reversible attachment. The linear reversible attachment process [24,30,35,37,44,46] were considered in the numerical model (3) for the interaction between nanoparticles and solid phase. The attachment (kATT) and detachment (kDET) coefficients (Table 4) used for the numerical simulations were assessed during the calibration phase, stemming from the available literature data [31,47,48,49] and the mass balance, matching the nZVI mass injected during the experimental test and the one calculated by the numerical simulation.
The calibration phase for the velocity field has been carried out by modifying the values of the hydraulic conductivities (kx and ky) of the porous medium. Table 5 reports the input data used in the model. The hydrodynamic dispersion (D), shown in Table 5, has been defined according to the results obtained from previous studies [37].
In the simulation reported in this paper, the presence of a contaminant, adsorbed to the grains of the porous media, was also considered. Once the nZVI interact with the contaminant, it is adsorbed on their surface, assuming a first-order kinetic according to Equation (7):
where Pi is the contaminant concentration [g/m3]; Ci is the nZVI concentration in the liquid phase and kobs is the observed reaction rate constant [min−1]. In this paper, the kobs value was selected stemming from the available literature data in the range 0.07–1.3 min−1 [50].
3. Results and Discussion
Calibration was carried out based on the knowledge of (i) the injection points of the nZVI + water solution, (ii) the nZVI concentration, (iii) the hydraulic and (iv) the geometric properties of the saturated porous medium. Figure 2 shows the simulation of the flow field inside the tank.
The hydraulic conductivity coefficient, kx (Table 5) was chosen according to a calibration procedure, comparing the velocities for x-axis defined by simulations of the numerical model and the water flow velocity value measured during the experimental test, calculated according to the volume at the outlet (Q = Volin/Time = 4.66 × 10⁻⁵ m3/s = 168 L/h), the (measured, ε = 0.4) porosity, and the transversal area occupied by the micro glass beads in the tank (AGlassBeads = 0.020 m2) and the same procedure for the conductivity coefficient along the y-axis. The mean velocity value provided by the simulation of the numerical model (5.41 × 10⁻³ m/s) is strictly close to the water flow velocity of the experimental test (5.70 × 10⁻³ m/s).
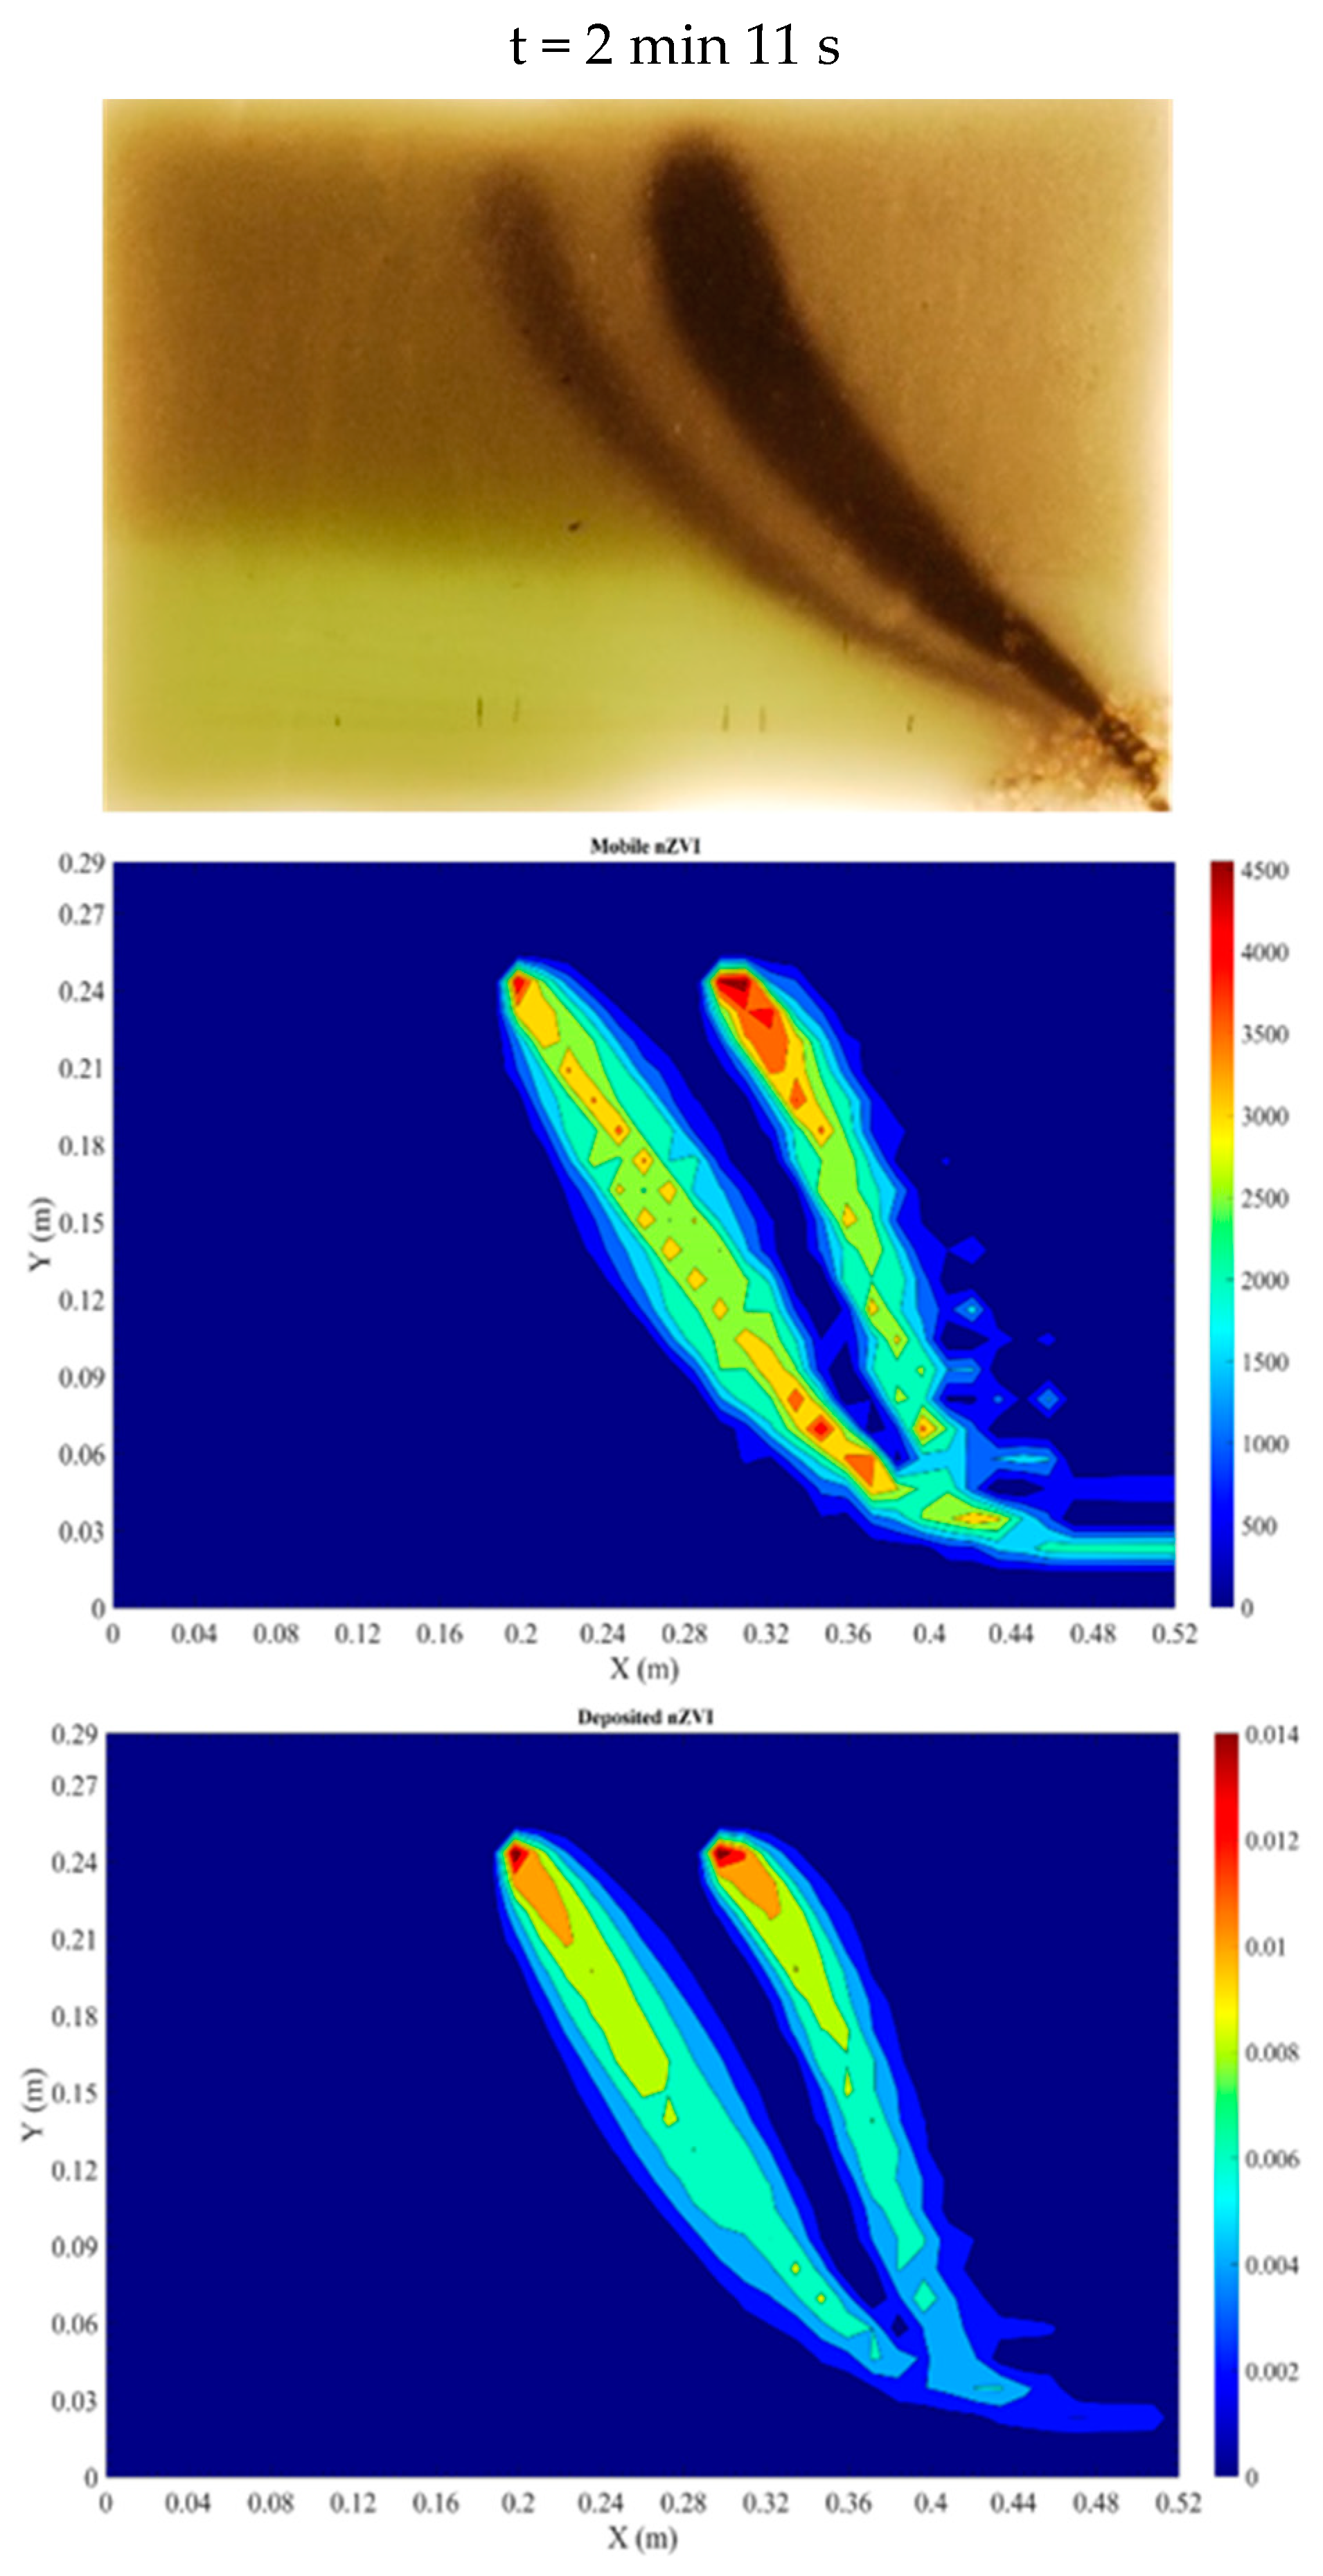
The nZVI transport was reproduced using a modified advection-dispersion Equations (2) and (3). Equation (3) describes the dual-phase interactions between particles in the liquid (water) and solid phase (grains). The results obtained with the numerical model (Figure 3, Figure 4 and Figure 5) show the mobile part of tfhe nZVI through the porous medium and the attached ones. It was assumed that, with mobile nZVI, part of the nanoparticles was still able to react with the present contaminants. The results also show the inactive part of nZVI lost due to their interaction with the solid medium. Figure 3 shows the results of the numerical model during injection time.
Figure 3 shows the attached nZVI. On the contrary, Figure 4 shows the results of the numerical model for both mobile and attached nanoparticles at the final instant of injection time of nZVI, after 2 min and 11 s since the beginning of the experimental test.
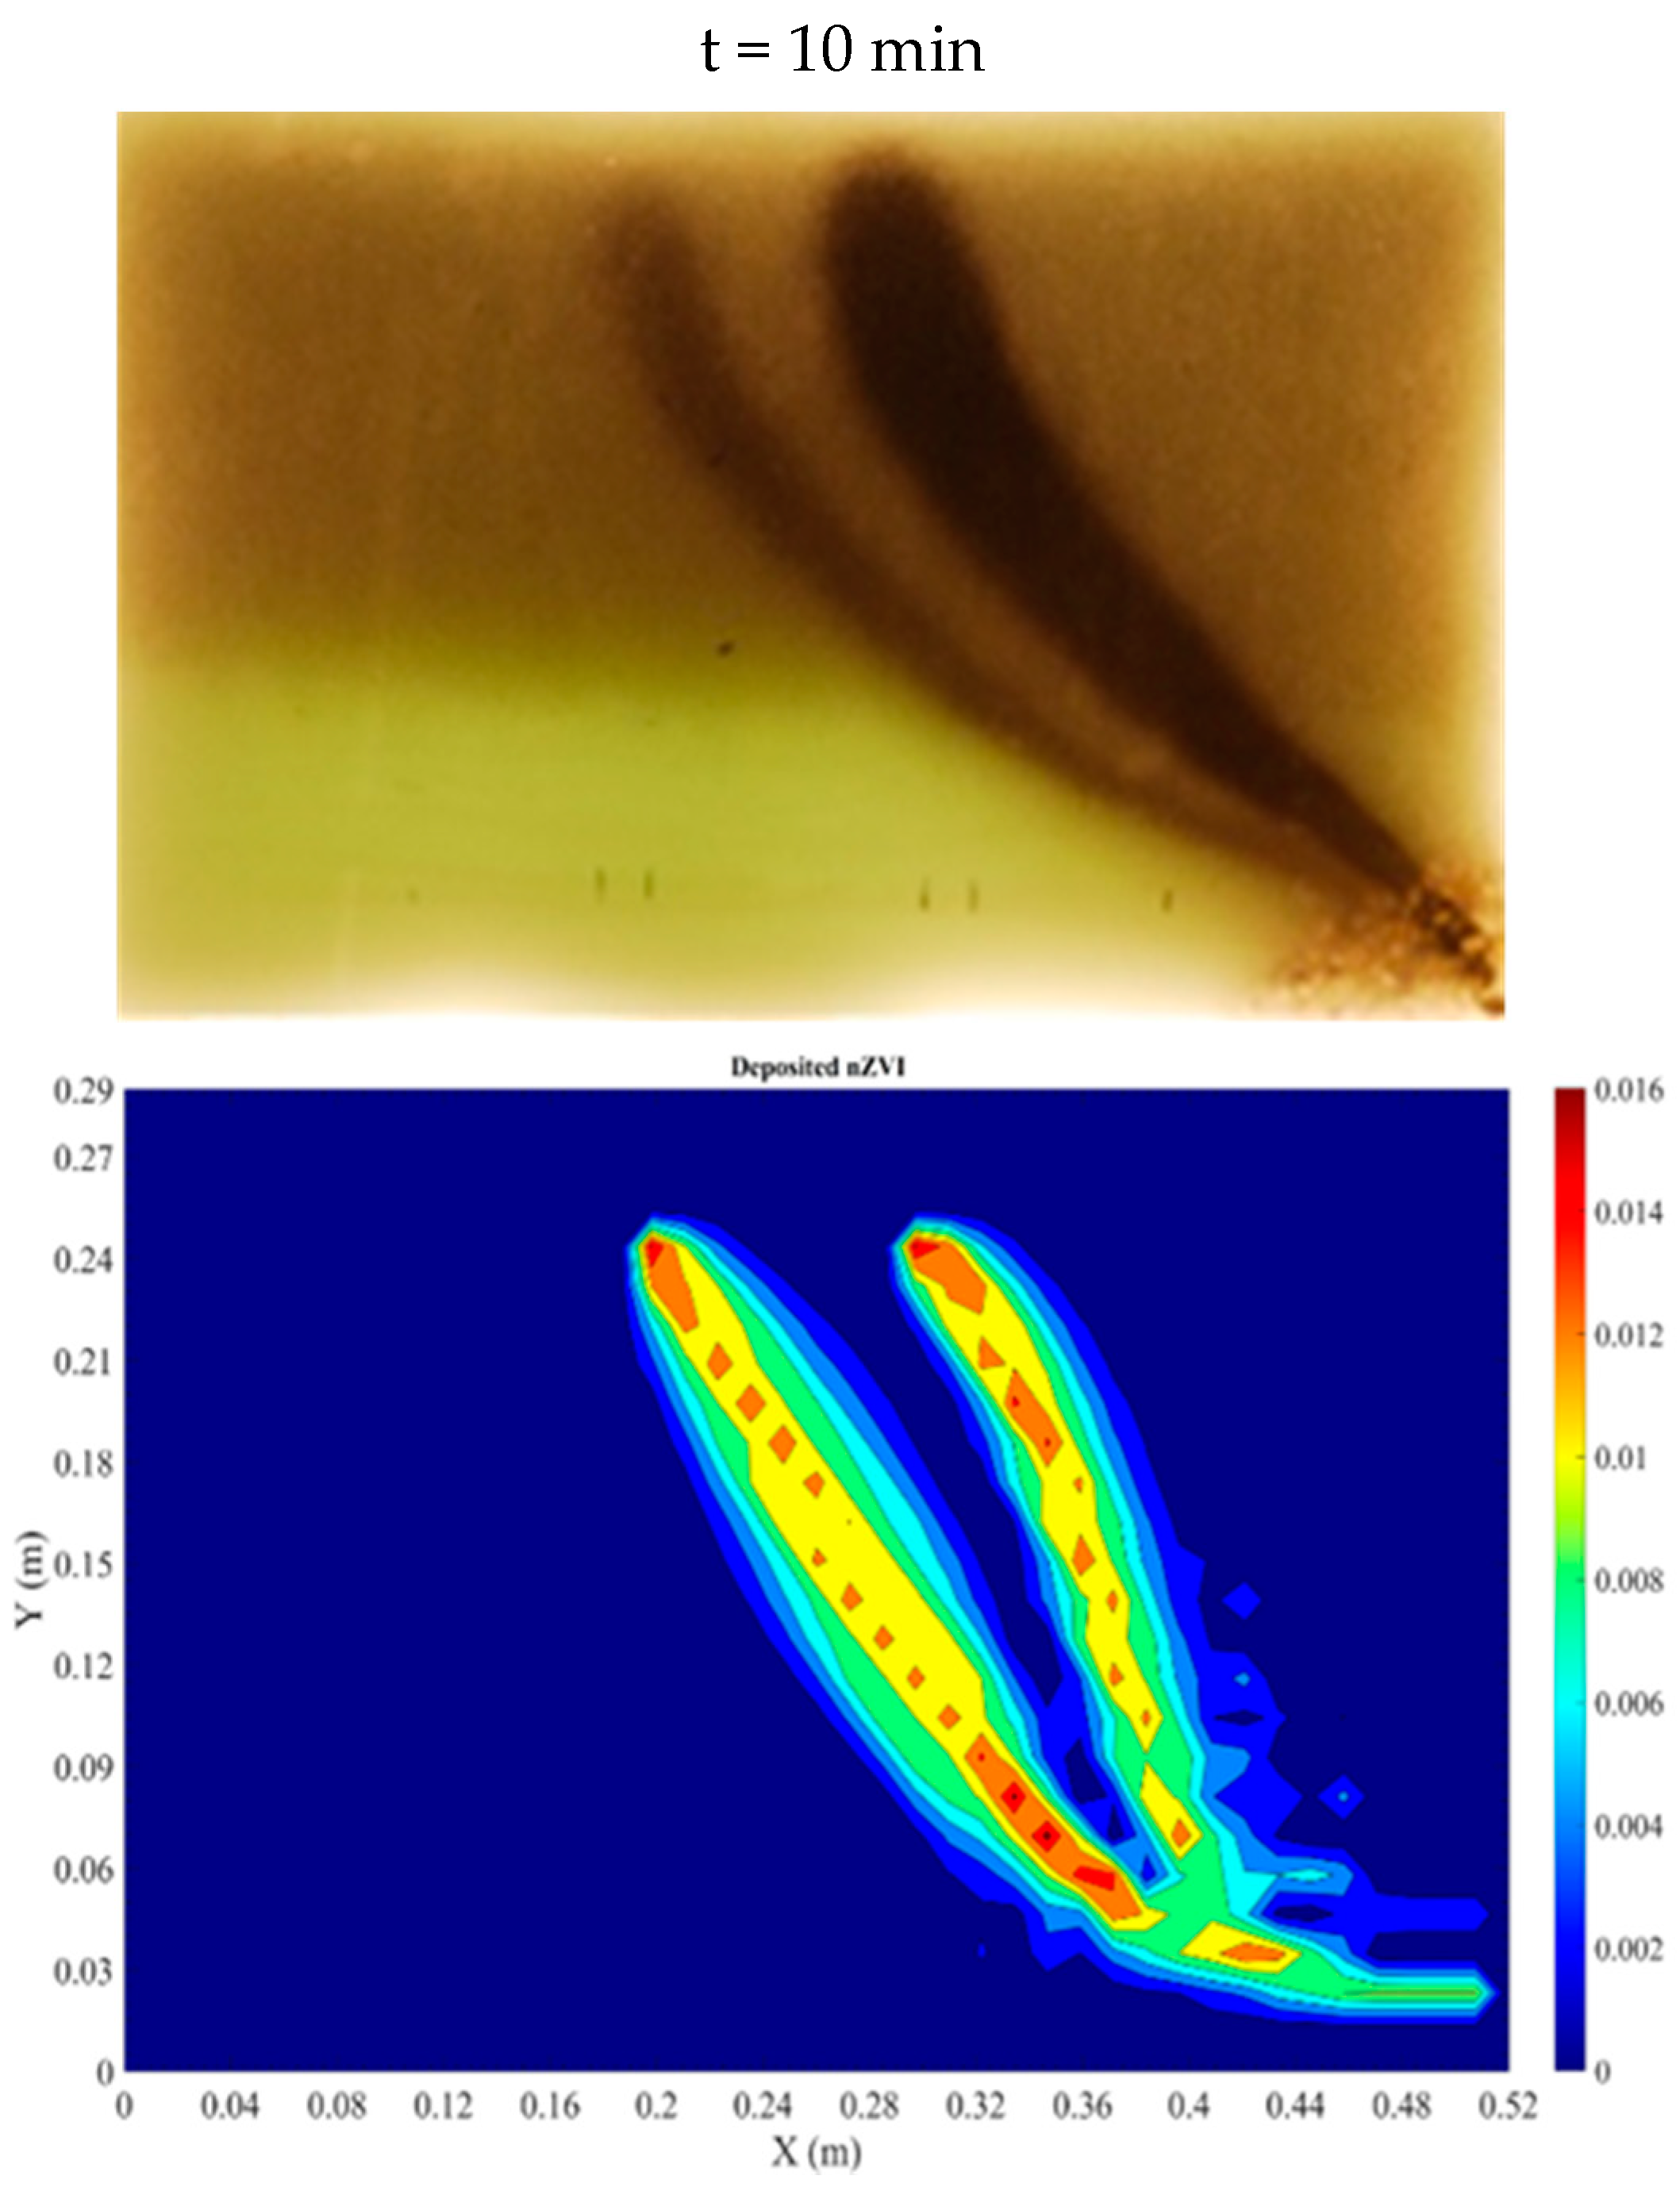
As it is possible to notice, at the instant 2 min 11 s, there is the maximum expansion of the plume of the mobile nZVI and then they begin to exit from the tank. Finally, Figure 5 shows the trend of attached nanoparticles at the end of the test, i.e., at 10 min.
Figure 5 shows only the distribution of the attached nanoparticles at the end of the experiment, while the mobile nanoparticles are outside the tank at that time.
The numerical model results (Figure 3, Figure 4 and Figure 5) show light instabilities due to the finite difference approximation used. Regarding the attachment and detachment coefficients (Table 4), they have been chosen following a calibration procedure, considering the literature data [47,48,49] and comparing the nZVI mass injected during the experimental test and the nZVI mass obtained with the numerical simulation, calculated according to the following relationship, Equation (8):
where the nZVI concentration (ci), cell by cell (m n), has been multiplied by the influence volume (Viinfl) around the cell node, both for mobile and attached nZVI. The value of mass obtained by simulations of numerical model is equal to 1.9 g, and it is comparable to the injected mass of nanoparticles (2.5 g) during the experimental test. As mentioned before, a significant aspect must be underlined from the results: the detachment effect is much smaller than the attachment one (ratio kd/ka = 0.001).
The validated model was then applied for simulating the redistribution of a passive dissolved tracer in the saturated porous medium characterized by random heterogeneous permeability (Figure 6a–c). The numerical investigation was carried out using the input model data reported in Table 5 and a permeability field ranged from 1.4 × 10⁻⁴ m/s to 6.8 × 10⁻³ m/s. The concentration of the injected tracer was considered equal to the concentration of nanoparticles injected inside the tank during the laboratory experiment. The results reported (Figure 6a–c) show a different redistribution of the tracer if compared to the nanoparticles one (Figure 3, Figure 4 and Figure 5). The plume of the dissolved tracer is characterized by a major velocity and dispersion along the x-axis than the plume of nanoparticles. The different behavior of the tracer is mainly caused by the absence of the influence of the buoyancy force. The obtained results demonstrate the uncertainties of the traditional numerical models, used for dissolved contaminants, to simulate the redistribution of nanoparticles in saturated porous media.
The main factors affecting the capacity of nanoparticles to remove contaminants are the concentration of nanoparticles and the proximity of injection wells of nanoparticles to contamination sources. Therefore, it is important to know the location of the source of contamination to optimize the effectiveness of the removal process. The proposed numerical model was applied to simulate two different scenarios characterized by the same source of contamination, but at different injections points of nanoparticles. Both reproduced porous media were characterized by the values of parameters shown in Table 5 and the heterogeneous permeability field reported above. The contaminant was considered adsorbed to the grains of the porous media with a concentration equal to 1 g/m3 of bulk soil. The concentration of the injected nanoparticles was set equal to 4.545 × 10³ g/m3, the same concentration of nanoparticles used for the laboratory experiment (Table 3). The injection of nanoparticles was simulated at P1 in the first scenario, near the border of the computing domain in the second one. The two simulations show different results in terms of removal of the contamination source. In the case of injection of nanoparticles in P1, the source of contamination is almost completely removed because nanoparticles are injected near the polluted area, and they enter in contact with the contaminant (Figure 7). In the second scenario in Figure 8, the injection point of nanoparticles is farer from the source of contamination and the limited dispersion, together with the strong influence of the buoyancy force, do not allow the nanoparticles to reach the portion of the aquifer containing the source of contaminant.
The results confirm the importance of investigating and characterizing the position of the contamination source to better define the location of injections wells of nanoparticles and increase their effectiveness in contaminants removal.
4. Conclusions
The aim of the paper was to present experimental results which can furnish information on the mobility and dispersion of nZVI in saturated porous media. The mobility of nanoparticles is a real issue, which can often result in inefficient soil remediation application at the field scale [37]. The numerical model, helped by laboratory experience, has the aim to enhance the knowledge on the nZVI behavior and provide information on the design of the application technology of nZVI. The exam, both by means of lab tests and numerical analysis of two largely used methodologies for the distribution of nanoparticles in soil and subsoil, has provided valuable information on the characteristics of the generated plumes. The first methodology, direct push injection, was focused on in a previous paper [37,45] and from the obtained results, it was evidenced that the direct push does not guarantee the proper dispersion of the particles. In the present study, a different method for injection was adopted and the response of the system has shown a behavior practically very close to the other one. In both cases, the distribution of the nZVI results in narrow plumes with a strong characterization of its shape towards the vertical axes, the influence of the flow motion (horizontal) is relatively low, and it can be considered relevant in our tests simply due to the presence of the closed boundary (tank bottom). The nZVI transport in the porous media test was then represented by means of a numerical model based on a modified advection-dispersion partial differential equation, including a term to define the interaction between particles (nZVI) in the liquid and solid phase. From the experimental results, it was clear that the simple use of the mass balance equation does not satisfy the conditions for the good interpretation of the nZVI plume behavior. The introduction of a corrective term (α) which takes into account the buoyancy effects due to different weight of the nZVI can be a first aid to a better forecast of their distribution. The results of the numerical model simulation (Figure 3, Figure 4 and Figure 5) show clearly that the nZVI plume does not behave like the one of a solute input, which is only influenced by the fluid motion and its characteristics in terms of transport and dispersion. Therefore, the nZVI transport cannot be defined using the classical mass balance equation, but it must be modified to take into account the interactions between the nZVI and the saturated porous medium that can influence the nZVI transport. To enforce this statement, a simulation of a dissolved tracer in the same domain of the tests with a random generated heterogeneous permeability (Figure 6) was added. As it is possible to evidence in this case, the plume of the dissolved tracer is characterized by higher velocity and larger dispersion, in particular along the x-axis and, more important, the barycenter of the plume shows a completely different trajectory if compared with those of the nanoparticle plumes. Therefore, these results demonstrate the unsuitability of the simple application of traditional numerical models, generally used for dissolved contaminants, to simulate the redistribution of nanoparticles in saturated porous media. At the end, the simulation of nZVI dispersion with the presence of a contaminant source (Figure 7 and Figure 8) confirms the importance of investigating and characterizing the source of contamination to better define the location of injections wells of nanoparticles and increase the effectiveness of the nanoparticles to remove contamination. The elaborations carried out by the numerical model have demonstrated to be fully comparable to ones obtained from the experimental activities. The velocities intensity is absolutely close to those measured in the experimental tests (5.41 × 10⁻³ m/s, vs. 5.70 ×10⁻³ m/s) and same considerations can be applied to the mass of nZVI injected during the laboratory tests (2.5 g vs. 1.9 g).
Therefore, the results obtained by the combination of experimental and numerical tests have allowed us to derive useful considerations that can provide valid aid for the application of numerical models in the design of remediation activities based upon the nZVI approach.
Author Contributions
Conceptualization, P.V. and F.T.; methodology, P.V. and F.A.; software, P.V and F.T..; validation, P.V. and F.T.; investigation, F.A.; data curation, F.A.; writing—original draft preparation, F.A.; writing—review and editing, P.V. and F.T.; visualization, P.V. and G.S.; supervision, P.V. and G.S.; project administration, P.V. and G.S. All authors have read and agreed to the published version of the manuscript.
Funding
This research received no external funding.
Data Availability Statement
Not applicable.
Conflicts of Interest
The authors declare no conflict of interest.
References
- Barbieri, M.; Nigro, A.; Sappa, G. Soil contamination evaluation by Enrichment Factor (EF) and Geoaccumulation Index (Igeo). Senses Sci. 2015, 2, 94–97. [Google Scholar] [CrossRef]
- Liu, L.; Li, W.; Song, W.; Guo, M. Remediation techniques for heavy metal-contaminated soils: Principles and applicability. Sci. Total Environ. 2018, 633, 206–219. [Google Scholar] [CrossRef] [PubMed]
- Alazaiza, M.Y.D.; Ramli, M.H.; Copty, N.K.; Sheng, T.J.; Aburas, M.M. LNAPL saturation distribution under the influence of water table fluctuations using simplified image analysis method. Bull. Eng. Geol. Environ. 2020, 79, 1543–1554. [Google Scholar] [CrossRef]
- Rabbani, M.M.; Ahmed, I.; Park, S.-J. Application of Nanotechnology to Remediate Contaminated Soils. In Environmental Remediation Technologies for Metal-Contaminated Soils; Springer: Tokyo, Japan, 2016; pp. 1–254. ISBN 9784431557593. [Google Scholar]
- Viotti, P.; Di Palma, P.R.; Aulenta, F.; Luciano, A.; Mancini, G.; Papini, M.P. Use of a reactive transport model to describe reductive dechlorination (RD) as a remediation design tool: Application at a CAH-contaminated site. Environ. Sci. Pollut. Res. 2014, 21, 1514–1527. [Google Scholar] [CrossRef] [PubMed] [Green Version]
- Bardos, P.; Merly, C.; Kvapil, P.; Koschitzky, H.P. Status of nanoremediation and its potential for future deployment: Risk-benefit and benchmarking appraisals. Remediation 2018, 28, 43–56. [Google Scholar] [CrossRef]
- Tatti, F.; Petrangeli Papini, M.; Torretta, V.; Mancini, G.; Boni, M.R.; Viotti, P. Experimental and numerical evaluation of Groundwater Circulation Wells as a remediation technology for persistent, low permeability contaminant source zones. J. Contam. Hydrol. 2019, 222, 89–100. [Google Scholar] [CrossRef]
- Silvani, L.; Di Palma, P.R.; Riccardi, C.; Eek, E.; Hale, S.E.; Viotti, P.; Petrangeli Papini, M. Use of biochar as alternative sorbent for the active capping of oil contaminated sediments. J. Environ. Chem. Eng. 2017, 5, 5241–5249. [Google Scholar] [CrossRef]
- Tatti, F.; Papini, M.P.; Raboni, M.; Viotti, P. Image analysis procedure for studying Back-Diffusion phenomena from low-permeability layers in laboratory tests. Sci. Rep. 2016, 6, 30400. [Google Scholar] [CrossRef] [Green Version]
- Guerra, F.D.; Attia, M.F.; Whitehead, D.C.; Alexis, F. Nanotechnology for environmental remediation: Materials and applications. Molecules 2018, 23, 1760. [Google Scholar] [CrossRef] [Green Version]
- Gallo, A.; Bianco, C.; Tosco, T.; Sethi, R. Ferro zerovalente nanoscopico per la bonifica di acquiferi contaminari. Geoing. Ambient. E Min. 2018, 155, 5–16. [Google Scholar]
- Gamallo, M.; Fernández, L.; Feijoo, G.; Moreira, M.T. Nano-based technologies for environmental soil remediation. In Nanomaterials for Sustainable Energy and Environmental Remediation; Elsevier: Amsterdam, The Netherlands, 2020; pp. 307–331. [Google Scholar] [CrossRef]
- Ribas, D.; Černík, M.; Benito, J.A.; Filip, J.; Marti, V. Activation process of air stable nanoscale zero-valent iron particles. Chem. Eng. J. 2017, 320, 290–299. [Google Scholar] [CrossRef] [Green Version]
- Gil-Díaz, M.; Rodríguez-Valdés, E.; Alonso, J.; Baragaño, D.; Gallego, J.R.; Lobo, M.C. Nanoremediation and long-term monitoring of brownfield soil highly polluted with As and Hg. Sci. Total Environ. 2019, 675, 165–175. [Google Scholar] [CrossRef] [PubMed]
- Sappa, G.; Barbieri, M.; Viotti, P.; Tatti, F.; Andrei, F. Assessment of Zerovalent Iron Nanoparticle (nZVI) Efficiency for Remediation of Arsenic-Contaminated Groundwater: Two Laboratory Experiments. Water 2022, 14, 3261. [Google Scholar] [CrossRef]
- US.EPA. Nanotechnology: Applications for Environmental Remediation. Available online: https://clu-in.org/techfocus/default.focus/sec/nanotechnology%3A_applications_for_environmental_remediation/cat/Application/ (accessed on 10 September 2022).
- Li, X.Q.; Elliott, D.W.; Zhang, W.X. Zero-valent iron nanoparticles for abatement of environmental pollutants: Materials and engineering aspects. Crit. Rev. Solid State Mater. Sci. 2006, 31, 111–122. [Google Scholar] [CrossRef]
- Ji, Y. Ions removal by iron nanoparticles: A study on solid-water interface with zeta potential. Colloids Surfaces A Physicochem. Eng. Asp. 2014, 444, 1–8. [Google Scholar] [CrossRef]
- Galdames, A.; Ruiz-Rubio, L.; Orueta, M.; Sánchez-Arzalluz, M.; Vilas-Vilela, J.L. Zero-valent iron nanoparticles for soil and groundwater remediation. Int. J. Environ. Res. Public Health 2020, 17, 5817. [Google Scholar] [CrossRef]
- Lin, Y.H.; Tseng, H.H.; Wey, M.Y.; Lin, M. Der Characteristics of two types of stabilized nano zero-valent iron and transport in porous media. Sci. Total Environ. 2010, 408, 2260–2267. [Google Scholar] [CrossRef]
- Phenrat, T.; Saleh, N.; Sirk, K.; Tilton, R.D.; Lowry, G.V. Aggregation and sedimentation of aqueous nanoscale zerovalent iron dispersions. Environ. Sci. Technol. 2007, 41, 284–290. [Google Scholar] [CrossRef]
- Saleh, N.; Sirk, K.; Liu, Y.; Phenrat, T.; Dufour, B.; Matyjaszewski, K.; Tilton, R.D.; Lowry, G.V. Surface modifications enhance nanoiron transport and NAPL targeting in saturated porous media. Environ. Eng. Sci. 2007, 24, 45–57. [Google Scholar] [CrossRef] [Green Version]
- Shrestha, S.; Wang, B.; Dutta, P. Nanoparticle processing: Understanding and controlling aggregation. Adv. Colloid Interface Sci. 2020, 279, 102162. [Google Scholar] [CrossRef]
- Mondal, A.; Dubey, B.K.; Arora, M.; Mumford, K. Porous media transport of iron nanoparticles for site remediation application: A review of lab scale column study, transport modelling and field-scale application. J. Hazard. Mater. 2021, 403, 123443. [Google Scholar] [CrossRef] [PubMed]
- Ryan, J.N.; Elimelech, M. Colloid mobilization and transport in groundwater. Colloids Surfaces A Physicochem. Eng. Asp. 1996, 107, 1–56. [Google Scholar] [CrossRef]
- He, F.; Zhao, D. Preparation and characterization of a new class of starch-stabilized bimetallic nanoparticles for degradation of chlorinated hydrocarbons in water. Environ. Sci. Technol. 2005, 39, 3314–3320. [Google Scholar] [CrossRef] [PubMed]
- He, F.; Zhao, D. Response to comment on manipulating the size and dispersibility of zerovalent iron nanoparticles by use of carboxymethyl cellulose stabilizers. Environ. Sci. Technol. 2008, 42, 3480. [Google Scholar] [CrossRef]
- Reddy, K.R.; Darnault, C.J.G.; Darko-Kagya, K. Transport of lactate-modified nanoscale iron particles in porous media. J. Geotech. Geoenvironmental Eng. 2014, 140, 04013013. [Google Scholar] [CrossRef] [Green Version]
- Liang, Q.; Zhao, D. Immobilization of arsenate in a sandy loam soil using starch-stabilized magnetite nanoparticles. J. Hazard. Mater. 2014, 271, 16–23. [Google Scholar] [CrossRef]
- Tosco, T.; Petrangeli Papini, M.; Cruz Viggi, C.; Sethi, R. Nanoscale zerovalent iron particles for groundwater remediation: A review. J. Clean. Prod. 2014, 77, 10–21. [Google Scholar] [CrossRef]
- Bianco, C.; Tosco, T.; Sethi, R. A 3-dimensional micro- and nanoparticle transport and filtration model (MNM3D) applied to the migration of carbon-based nanomaterials in porous media. J. Contam. Hydrol. 2016, 193, 10–20. [Google Scholar] [CrossRef] [Green Version]
- Ma, C.; Huangfu, X.; He, Q.; Ma, J.; Huang, R. Deposition of engineered nanoparticles (ENPs) on surfaces in aquatic systems: A review of interaction forces, experimental approaches, and influencing factors. Environ. Sci. Pollut. Res. 2018, 25, 33056–33081. [Google Scholar] [CrossRef]
- Elimelech, M.; O’Melia, C.R. Effect of Particle Size on Collision Efficiency in the Deposition of Brownian Particles with Electrostatic Energy Barriers. Langmuir 1990, 6, 1153–1163. [Google Scholar] [CrossRef]
- Mueller, N.C.; Braun, J.; Bruns, J.; Černík, M.; Rissing, P.; Rickerby, D.; Nowack, B. Application of nanoscale zero valent iron (NZVI) for groundwater remediation in Europe. Environ. Sci. Pollut. Res. 2012, 19, 550–558. [Google Scholar] [CrossRef] [PubMed] [Green Version]
- Tosco, T.; Gastone, F.; Luna, M.; Sethi, R.; Torino, P. Micro e nanoparticelle di ferro per la bonifica di acquiferi contaminati: Dal laboratorio all’applicazione in campo. Ing. Dell’ambiente 2015, 2, 59–68. [Google Scholar]
- Gil-Díaz, M.; Alonso, J.; Rodríguez-Valdés, E.; Gallego, J.R.; Lobo, M.C. Comparing different commercial zero valent iron nanoparticles to immobilize As and Hg in brownfield soil. Sci. Total Environ. 2017, 584–585, 1324–1332. [Google Scholar] [CrossRef] [PubMed]
- Andrei, F.; Sappa, G.; Boni, M.R.; Mancini, G.; Viotti, P. Mobility of nZVI in a Reconstructed Porous Media Monitored by an Image Analysis Procedure. Water 2021, 13, 2797. [Google Scholar] [CrossRef]
- Eglal, M.M.; Ramamurthy, A.S. Nanofer ZVI: Morphology, particle characteristics, kinetics, and applications. J. Nanomater. 2014, 2014, 29. [Google Scholar] [CrossRef] [Green Version]
- Chekli, L.; Brunetti, G.; Marzouk, E.R.; Maoz-Shen, A.; Smith, E.; Naidu, R.; Shon, H.K.; Lombi, E.; Donner, E. Evaluating the mobility of polymer-stabilised zero-valent iron nanoparticles and their potential to co-transport contaminants in intact soil cores. Environ. Pollut. 2016, 216, 636–645. [Google Scholar] [CrossRef]
- Galdames, A.; Mendoza, A.; Orueta, M.; de Soto García, I.S.; Sánchez, M.; Virto, I.; Vilas, J.L. Development of new remediation technologies for contaminated soils based on the application of zero-valent iron nanoparticles and bioremediation with compost. Resour. Technol. 2017, 3, 166–176. [Google Scholar] [CrossRef]
- Schrick, B.; Hydutsky, B.W.; Bishop, E.J.; Schrick, B.; Blough, J.L.; Mallouk, T.E. Zero-valent metal nanoparticles for soil and groundwater remediation. ACS Natl. Meet. B Abstr. 2004, 228, 2187–2193. [Google Scholar] [CrossRef]
- Kanel, S.R.; Nepal, D.; Manning, B.; Choi, H. Transport of surface-modified iron nanoparticle in porous media and application to arsenic(III) remediation. J. Nanoparticle Res. 2007, 9, 725–735. [Google Scholar] [CrossRef]
- Lin, Y.H.; Tseng, H.H.; Wey, M.Y.; Lin, M. Der Characteristics, morphology, and stabilization mechanism of PAA250K-stabilized bimetal nanoparticles. Colloids Surfaces A Physicochem. Eng. Asp. 2009, 349, 137–144. [Google Scholar] [CrossRef]
- Babakhani, P.; Bridge, J.; Doong, R.A. Phenrat, T. Continuum-based models and concepts for the transport of nanoparticles in saturated porous media: A state-of-the-science review. Adv. Colloid Interface Sci. 2017, 246, 75–104. [Google Scholar] [CrossRef] [PubMed]
- Sappa, G.; Andrei, F.; Viotti, P. Nanoparticles in Envinronmental Applications: First Laboratory Assesments of Nanoparticles Mobility in Porous Media. In Proceedings of the International Multidisciplinary Scientific GeoConference SGEM 2020, Vienna, Austria, 8–11 December 2020; p. 5593. [Google Scholar]
- Babakhani, P.; Fagerlund, F.; Shamsai, A.; Lowry, G.V.; Phenrat, T. Modified MODFLOW-based model for simulating the agglomeration and transport of polymer-modified Fe0 nanoparticles in saturated porous media. Environ. Sci. Pollut. Res. 2018, 25, 7180–7199. [Google Scholar] [CrossRef] [PubMed]
- Tosco, T.; Sethi, R. MNM1D: A numerical code for colloid transport in porous media: Implementation and validation. Am. J. Environ. Sci. 2009, 5, 516–524. [Google Scholar] [CrossRef] [Green Version]
- Tiraferri, A.; Sethi, R. Enhanced transport of zerovalent iron nanoparticles in saturated porous media by guar gum. J. Nanoparticle Res. 2009, 11, 635–645. [Google Scholar] [CrossRef]
- Tosco, T.; Tiraferri, A.; Rajandrea, S. Ionic Strength Dependent Transport of Microparticles in Saturated Porous Media: Modeling Mobilization and Immobilization Phenomena under Transient Chemical Conditions. Environ. Sci. Technol. 2009, 43, 4425–4431. [Google Scholar] [CrossRef]
- Kanel, S.R.; Manning, B.; Charlet, L.; Choi, H. Removal of arsenic(III) from groundwater by nanoscale zero-valent iron. Environ. Sci. Technol. 2005, 39, 1291–1298. [Google Scholar] [CrossRef]
Figure 1.
Experimental apparatus.

Figure 2.
Numerical simulation of the flow field inside the tank.

Figure 3.
Results of numerical model simulations (during the injection time).


Figure 4.
Results by numerical model simulations at 2 min 11 s (at the end of the injection time).

Figure 5.
Results by numerical model simulations at 10 min (at the end of the permeation test).

Figure 6.
Numerical simulation of flow filed in a heterogeneous aquifer (a). The redistribution of a dissolved tracer simulated numerically at time = 2 min 11 s (b) and time = 10 min (c).
Figure 6.
Numerical simulation of flow filed in a heterogeneous aquifer (a). The redistribution of a dissolved tracer simulated numerically at time = 2 min 11 s (b) and time = 10 min (c).

Figure 7.
Numerical simulation of nanoparticles redistribution and contaminant removal in a heterogeneous aquifer at time = 46 s (a), time = 2 min 11 s (b) and time = 2 min 50 s (c). The injection of nanoparticles was simulated at P1.
Figure 7.
Numerical simulation of nanoparticles redistribution and contaminant removal in a heterogeneous aquifer at time = 46 s (a), time = 2 min 11 s (b) and time = 2 min 50 s (c). The injection of nanoparticles was simulated at P1.

Figure 8.
Numerical simulation of nanoparticles redistribution and contaminant removal in a heterogeneous aquifer at time = 46 s (a), time = 2 min 11 s (b) and time = 2 min 50 s (c). The injection of nanoparticles was simulated near the border of the domain.
Figure 8.
Numerical simulation of nanoparticles redistribution and contaminant removal in a heterogeneous aquifer at time = 46 s (a), time = 2 min 11 s (b) and time = 2 min 50 s (c). The injection of nanoparticles was simulated near the border of the domain.


Table 1.
Main features of the micro glass beads.
| Micro Glass Beads | |
|---|---|
| Diameter | 400–800 μm |
| Refractive index | 1.52 |
| Porosity ε (measured) | 0.4 |
| Bulk density | 1.49 kg/L |
| Hardness (according to Mohs) | ≥6 |
Table 2.
Main features of the Nanofer25S solution.
| Nanofer25S | |
|---|---|
| Composition mixture (weight % content) | 77% Water 14–18% Iron (Fe) 3% Polyacrylic acid (PAA). 2–6% Magnetite (Fe3O4) 0–1% Carbon © |
| Granulometry | d50 < 50 nm |
| pH | 11–12 |
| Specific surface | >25 m2/g |
| Specific gravity | 1.15–1.25 g/cm3 (20 °C) |
Table 3.
Features of nZVI + water solution used during permeation injection test.
| nZVI + Water Solution for Permeation Injection Test | ||
|---|---|---|
| nZVI stock solution concentration | 250 | g/L |
| nZVI volume | 10 | mL |
| nZVI mass | 2.5 | g |
| nZVI + water solution volume | 550 | mL |
| nZVI + water solution concentration | 4.54 | g/L |
Table 4.
Attachment and detachment coefficients for numerical model.
| Attachment and Detachment Coefficients | ||
|---|---|---|
| kATT | 0.1 | 1/s |
| kDET | 0.0001 | 1/s |
Table 5.
Model Input Data.
| Parameter | Values | Units | |
|---|---|---|---|
| Physical width | 0.52 | m | |
| Physical height | 0.29 | m | |
| Rows (m) | 26 | - | |
| Columns (n) | 43 | - | |
| Injection/Extraction flow rate (Q) | 168 | L/h | |
| Porosity (ε) | 0.4 | - | |
| Micro glass beads hydraulic conductivity | kx | 2.5 × 10⁻³ | m/s |
| ky | 4.3 × 10⁻³ | m/s | |
| Micro glass beads dispersion 1 (D) | 2.6 × 10⁻⁵ | m2/s | |
| Bulk Density (ρb) | 1.49 × 10⁶ | g/m3 | |
| Injection Point 1 (P1) | xP1 | 0.21 | m |
| yP1 | 0.05 | m | |
| Injection Point 2 (P2) | xP2 | 0.30 | m |
| yP2 | 0.05 | m | |
| nZVI + water solution concentration | 4.545 × 10³ | g/m3 | |
| nZVI volume | 10 | mL | |
| nZVI mass | 2.5 | g | |
1 Mean value.
Publisher’s Note: MDPI stays neutral with regard to jurisdictional claims in published maps and institutional affiliations. |
© 2022 by the authors. Licensee MDPI, Basel, Switzerland. This article is an open access article distributed under the terms and conditions of the Creative Commons Attribution (CC BY) license (https://creativecommons.org/licenses/by/4.0/).
Share and Cite
MDPI and ACS Style
Viotti, P.; Sappa, G.; Tatti, F.; Andrei, F. nZVI Mobility and Transport: Laboratory Test and Numerical Model. Hydrology 2022, 9, 196. https://0-doi-org.brum.beds.ac.uk/10.3390/hydrology9110196
AMA Style
Viotti P, Sappa G, Tatti F, Andrei F. nZVI Mobility and Transport: Laboratory Test and Numerical Model. Hydrology. 2022; 9(11):196. https://0-doi-org.brum.beds.ac.uk/10.3390/hydrology9110196
Chicago/Turabian StyleViotti, Paolo, Giuseppe Sappa, Fabio Tatti, and Francesca Andrei. 2022. "nZVI Mobility and Transport: Laboratory Test and Numerical Model" Hydrology 9, no. 11: 196. https://0-doi-org.brum.beds.ac.uk/10.3390/hydrology9110196
Note that from the first issue of 2016, this journal uses article numbers instead of page numbers. See further details here.