

Water Quality in a Small Lowland River in Different Land Use
by
 ,
,
Beata Rutkowska
1,
Wieslaw Szulc
1,
Wiktor Wyżyński
1,
Katarzyna Gościnna
2,
Stanislav Torma
3,
Jozef Vilček
3,4,* and
Štefan Koco
3,4 1
Independent Department of Agricultural and Environmental Chemistry, Institute of Agriculture, Warsaw University of Life Sciences, Nowoursynowska 166, 02-787 Warsaw, Poland
2
Institute of Agri-Foodstuff Commodity, University of Science and Technology, st. Kaliskiego 7, 85-796 Bydgoszcz, Poland
3
National Agricultural and Food Centre, Soil Science and Conservation Research Institute, Regional Workplace, Raymannova 1, 080 01 Prešov, Slovakia
4
Department of Geography and Applied Geoinformatics, Faculty of Humanities and Natural Sciences, University of Prešov, 17th November Str. 1, 081 16 Prešov, Slovakia
*
Author to whom correspondence should be addressed.
Hydrology 2022, 9(11), 200; https://0-doi-org.brum.beds.ac.uk/10.3390/hydrology9110200
Submission received: 9 October 2022
/
Revised: 28 October 2022
/
Accepted: 3 November 2022
/
Published: 8 November 2022
(This article belongs to the Special Issue Advances in Land Surface Hydrological Processes)
Abstract
:The paper describes water quality in the Raszynka River based on selected chemical parameters dependent on different land use. The research was carried out in the Raszynka River catchment, characterized by a small surface area (75.9 km2) and length (17.14 km). The river is a right tributary of the Utrata River. It is located in the Piaseczno and Pruszkow districts in the Mazowieckie voivodship. The dominant type of land use in the basin is agricultural land. Water samples were collected from 2017 to 2019 from previously designated research points at similar distances along the river. Selected physicochemical indicators examined in the samples include total alkalinity, electrolytic conductivity (EC), pH, and chemical oxygen demand (COD). Moreover, the concentration of selected substances was determined, including nitrogen compounds: NO3− (nitrates) and NH4+ (ammonium), TP (total phosphorus), and Cl− (chlorides). The results showed that the values of some of the examined indicators do not meet the standards set for first-class surface water quality. Indicators significantly exceeding the limit included ammonium, chlorides, and pH. The highest concentration of chlorides, ammonium, and nitrate was found in urbanized areas. The highest concentrations of total phosphorus and COD were determined in agricultural areas and total alkalinity in meadows.
1. Introduction
Water quality in small lowland rivers should have a considerable impact on the condition of the entire Polish fluvial system, as well as all lakes and water reservoirs those rivers flow through. Research shows that the state of large Polish rivers (such as Vistula, Oder, or Warta) is, to a lesser extent, affected by sources of pollution in their direct vicinity, and to a greater extent by pollutants supplied with small tributaries [1,2,3,4]. It is, therefore, necessary to conduct a comprehensive investigation of entire river catchments. Rivers flowing out of Poland constitute the main source of phosphorus and nitrogen in the Baltic Sea, leading to its degradation, development of the eutrophication process, more frequent cyanobacterial blooms, development of oxygen deserts, etc. [5,6,7,8,9].
Sources of river pollution can be divided into point sources (e.g., discharge of municipal waste) and diffuse sources (e.g., agriculture). A decrease in the effect of point sources on water quality in rivers has been observed in recent years [5,6,7]. It is related to the modernization of obsolete wastewater treatment plants, introduction of the third degree of wastewater treatment—intensified nutrient removal, and construction of a substantial number of wastewater treatment plants (also resulting in a decrease in illegal sewage discharges directly to rivers) [10,11,12,13]. An increasing effect of agriculture as a source of river pollution has also been observed due to the application of a greater quantity of natural and mineral fertilizers, application of pesticides, clearing of field tree stands, and removal of buffer zones at river banks, leading to intensified leaching of pollutants from the soil into rivers [14,15,16,17,18,19,20].
Lowland rivers flow through ponds, lakes, and retention reservoirs, considerably affecting their quality. River waters flowing through such a reservoir slow down their flow rate, allowing for the deposition of sediments on the bottom, and reducing the concentration of pollutants behind the reservoir. Retention reservoirs are a very important element of water management, as well as a source of drinking water. They contribute to the improvement of water relations during drought and reduce flood flows by retaining water. The construction of many new small retention objects is currently observed. Their basic task is to increase the amount of retained water available during droughts, as well as to reduce the pollution of water flowing through them [21,22,23,24].
The water environment is closely related to human activities. The quality of water in rivers, lakes, and catchments changes depending on catchment use. Research shows that the strongest impact on the quality of water is agricultural and industrial activities, including cities. Human activities can have a beneficial effect on water quality, e.g., through the afforestation of land and maintenance of forest communities [25]. The quality of water in the river depends on the way of using the catchment area [25,26,27,28]. Understanding how land use can affect surface water quality is an extremely important issue. This is especially important in small catchments that supply large rivers where the pollution load from a given area accumulates [29]. Agricultural land management with intensive agricultural production creates a risk of nitrogen and phosphorus compounds entering the waters. These compounds usually enter rivers as a result of surface runoff or flooding [26,30,31]. These are large-scale pollutants that usually affect the entire catchment area. Surface runoff, as well as the development of vegetation, usually increases the content of soluble carbon compounds in the river [32]. All these pollutants contribute to the increase in the eutrophication of water reservoirs and, in extreme conditions, even to the disappearance of biological life [33]. Therefore, it is extremely important to know the size of the pollutant load that we find in small catchments, which can be used in policy to improve the quality of water in rivers. The aim of the study was to examine both the influence of the use of the catchment area and the variability of the concentration of individual water quality parameters over the research period.
2. Materials and Methods
2.1. Characteristics of the Raszynka River Catchment
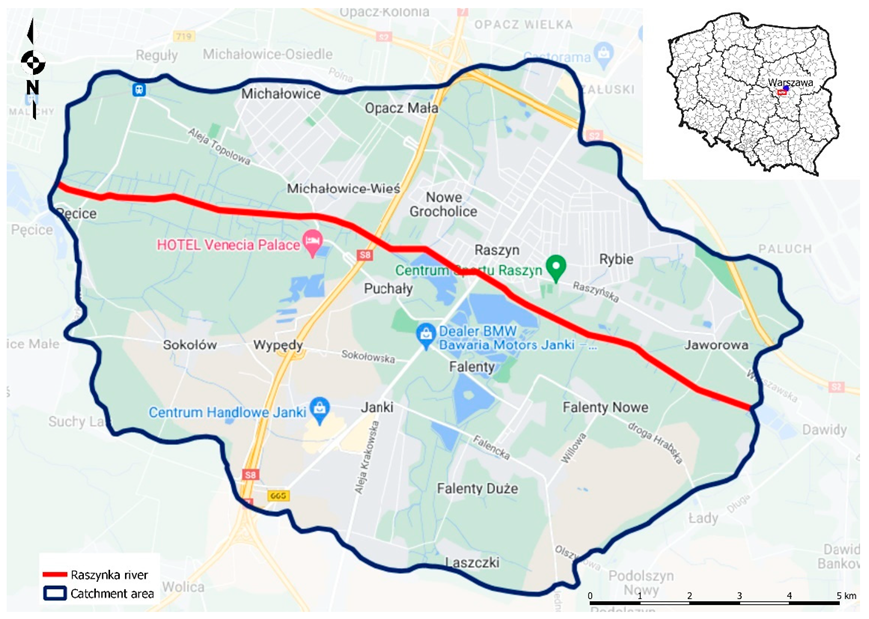
The Raszynka River is a right tributary of the Utrata River. Its total length is 16.84 km. The river begins its course in the Lesznowola commune and flows into the Utrata River at 48.92 km of its course in Pęcice.
The surface area of the Raszynka catchment is 75.9 km2. It can be therefore classified as a small catchment. Pursuant to the system of physic geographic regionalization adopted by Kondracki [21], the area of the designated catchment is located at the boundary of two mesoregions: the Łowicko-Błońska Plain (western part of the catchment) and the Warsaw Plain (eastern part of the catchment).
The Raszynka catchment is located in the region of the Mazovian-Podlasie climate [34]. The number of days in a year with a temperature above 5 °C ranges from 107 to 117. The mean annual temperature reaches 6.5 °C. Precipitation is at the following levels: in the winter half-year (X–III)—209 mm, in the summer half-year (IV–IX)—380 mm. The mean annual precipitation is 589 mm. The driest month in the year is January, with mean precipitation of 24 mm. The highest precipitation is recorded in July, averaging 75 mm [35].
The catchment area is characterized by snow and rain type supply. The highest water stages occur in the Spring months. In winter, the river sometimes periodically freezes. Moreover, the waters of the Raszynka River are supplied with treated wastewater from the Commune Wastewater Treatment Plant in Raszyn and periodically with water from the fish ponds of the Experimental Facility in Falenty. The land use structure of the Raszynka catchment is dominated by arable land (63%), urbanized land (23%), and forests 11%. The river’s catchment is therefore classified as an agricultural catchment [36].
2.2. Sampling
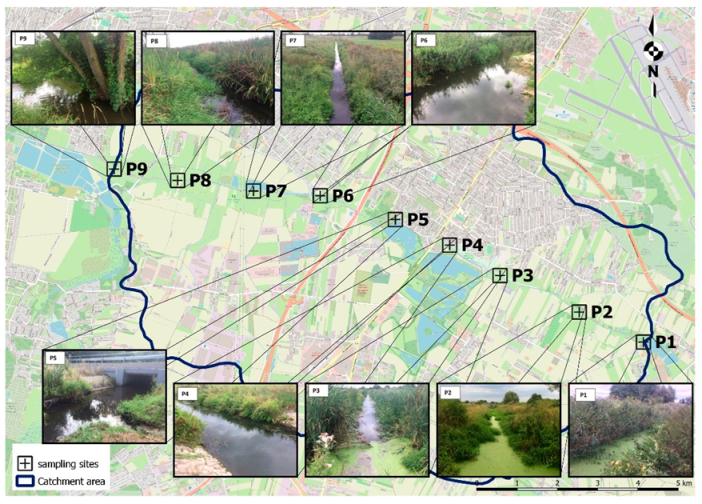
Basic physicochemical water properties were measured in the years from 2017 to 2019. The study covered nine measurement sites representative of the entire length of the river (Table 1, Figure 1 and Figure 2).
Characteristics landscape of sampling sites are shown in Figure 2. Water samples for analysis were collected from nine sampling locations located along the entire river course. The sampling points were located in areas of different land use. Samples 3, 8, and 9 came from grasslands, 4, 5, and 6 from urbanized areas, and 1, 2, and 7 from agricultural areas. In each year, samples were taken from each measuring point four times (once per quarter—in February, May, August, and November). At each date, four partial samples were collected, which constituted a collective sample. A total of 108 water samples were tested. The measurement results were compared with the Polish Regulation of the Minister of Maritime Economy and Inland Navigation on 11 October 2019 on the classification of ecological condition, ecological potential, chemical condition, and the method of classification of the state of surface water bodies, as well as environmental quality standards for priority substances.
2.3. Methodology of Determination of Selected Physicochemical Indices
The research was limited to those indicators of the physicochemical assessment of water quality, which are obligatorily required by the Minister of Maritime Economy and Inland Navigation [37]. The following was determined in the water samples:
- Ammonium (NH4+) was determined by means of the flow injection analysis method (FIA) with spectrophotometric detection [38].
- Nitrates (NO3−) were determined by means of the flow injection analysis (FIA) with spectrophotometric detection [39].
- Total phosphorus (TP) was determined by means of the method with the application of ascorbic acid [40].
- Chlorides (Cl−) were determined by means of the titration method with the application of silver nitrate (Mohr method) [41].
- Chemical oxygen demand (COD) was determined by means of the titration method with the application of potassium permanganate [42].
- EC was determined conductometrically [43].
- pH was determined by means of the potentiometric method [44].
- Total alkalinity was determined by means of the titration method against phenolphthalein and methyl orange [45].
2.4. Statistical Analysis of Results
In this research, we examine the influence of the use of the catchment area and the variability of the concentration of individual water quality parameters over the research period.
3. Results
The examined parameters were more diversified depending on the measuring point than for a year (Table 2). The concentration of NH4+ in different sections of the river showed high variability (Table 3). In the upper (P1, P2, P3) and lower courses (P7, P8, P9), NH4+ concentration was considerably lower than in the middle course of the river (P4, P5, P6). Pursuant to norms binding in Poland, the concentration of NH4+ always exceeded the acceptable value for class I of water quality at ≤0.170 mg NH4+ dm−3. In P4, P5, and P6, the concentration of ammonium ions exceeded the limit value for quality class II (0.553 mg NH4+ dm−3).
The analysis of spatial management showed that the increased presence of ammonium in the middle course of the river is a result of the direct vicinity of fish ponds. The “Stawy Raszyńskie” reserve is the main emitter of ammonium due to the fish farming function of the ponds. The results show that the chemical oxygen, ammonia, phosphate requirements, and microbiological parameters of the river water increase significantly with discharges from fish farming [47,48].
Like in the case of NH4+, NO3− was the significantly highest for measurement site P6 (Table 2 and Table 3). In this section of the river, the level of the ion varied depending on the month from 1.13 to 2.13 mg NO3− dm−3. Both the threshold value of ≤1.6 mg NO3− dm−3 for class I and ≤2.5 mg NO3- dm−3 for class II of water quality were considerably exceeded, classifying the waters to class II and below class II of water quality. Probably the causes of high NO3− concentration in the middle course of the river are also associated with the presence of the Commune Wastewater Treatment Plant in Raszyn municipality. At the remaining sites, NO3− concentration was at a similar level and did not exceed the acceptable norms. In the lower and upper course of the river, pollution was even several times lower. This was caused by limited extensive agricultural use. Sites P7, P8, and P9 were characterized by the significantly lowest concentrations of NO3−. A factor determining this situation is the direct vicinity of meadows and bushy areas not subject to agricultural use.
Depending on the years of study, total phosphorus concentration in the Raszynka River varied from 0.06 to 0.26 mg P dm−3 (Table 3). In points P8 and P9 in 2018 and 2019, the limit value for class 1 water quality (0.2 mg P dm−3) was exceeded. In any of the tested points, the permissible standards for class II (0.3 mg P dm−3) were not exceeded. An increase in phosphorus concentration in the river waters with its course is evident. The significantly highest phosphorus concentration was observed at sampling sites P8 and P9. The dominant land use categories in the Raszynka River catchment in its lower course are meadows and arable land. Higher than average phosphorus values in the water suggest the supply of these compounds to water with surface runoff from arable fields.
Chemical oxygen demand in the waters of the Raszynka River pointed to variability between particular measurement sites (Table 3). The lowest chemical oxygen demand was recorded for a water sample collected in 2019 from site P6 (5.84 mg O2 dm−3). It is worth paying attention to sampling site P7, where the index value was considerably higher than at the remaining sites in all years. This could have been caused by the abundant occurrence of water vegetation in that place. 55% of samples met the criteria for classifying them as class I of water quality (≤8.4 mg O2 dm−3), and 37% of water samples were classified as class II of water quality (≤10.1 mg O2 dm−3). COD values for samples from sites P7 and P8 exceeded the acceptable norms.
Chloride concentration in the analyzed water samples ranged from 13.3 to 37.1 mg Cl− dm−3 (Table 3). The significantly lowest concentration of chlorides was observed in the lower course of the Raszynka River. A site particularly standing out among other sites is site P7, with the lowest concentration of chlorides. The site is located within the municipality of Falenty, and the area directly adjacent to the sampling site is under agricultural use.
The highest chloride concentration was determined for water samples collected from sites in the upper course of the river (P1, P2, P3). The threshold value for class I of water quality in the case of chlorides is ≤14.0 mg Cl− dm−3 and ≤34.5 mg Cl− dm−3 for the second class of water quality. This means that the analyzed water was excessively polluted with chlorides.
Electrical conductivity values of the analyzed water were within a range of 179–439 μS cm−1. The significantly lowest values were recorded for site P7. Water sampled for the study from sites P1, P2, P3, P4, P5, P6, P8, and P9 showed low variability of EC. Like in the case of analysis of other physicochemical indices, water samples collected from site P7 stand out among others. The value of EC at that site is lower by more than 50% in comparison to water sampled from the neighboring site P8. Probably this situation could have been determined by limited water flow between these sites. Measurement site P7 was characterized by the occurrence of a high abundance of water vegetation. Pursuant to norms binding in Poland, surface water of quality class I should contain no more than 411 μS cm−1, and class II, not more than 553 μS cm−1. More than half, i.e., 55% of the analyzed water samples, were classified as good quality (class I). The remaining water samples were within the norms of the regulation, classifying them as waters of class II.
The lowest pH was recorded at measurement site P1 at the source of the river and the highest at site P3. According to Polish law, the permissible pH values for class I are 7.4–8.0, and for the second class, 6.7–8.1.
Total water alkalinity analyzed in the waters of the Raszynka River showed considerable variability in particular sections of the river (Table 4). Threshold values throughout the river section varied from 139.2 to 220.4 mg CaCO3 dm−3. According to Polish law, the water alkalinity for class I are ≤185, and for the second class, ≤205. The lowest value was recorded for water sampled from site P7 and the highest for site P9 at the mouth of Raszynka to the Utrata River. Results presented in Table 4 suggest that total water alkalinity at sampling points in the upper and middle course of the river was maintained at an approximate level.
Table 5 shows the average measured values of monitored parameters for the years 2017–2019 according to land use.
As shown in Table 5, land use had an impact on the values of the studied indicators in the RaszynkIt is OKa River. The highest concentration of chlorides, ammonium, and nitrate was found in urbanized areas. The highest concentrations of total phosphorus and COD were determined in agricultural areas and total alkalinity in meadows. The pH of the water was not dependent on land use.
4. Discussion
The analysis of results of measurements of surface waters in the Raszynka River showed variability between particular sampling sites, as well as between years. Samples with quality exceeding threshold values of class I or II of water quality constituted 47% of all collected samples. The most frequently exceeded threshold values of physicochemical properties included pH and NH4+, and Cl− (Table 3 and Table 4).
Water quality in small Polish rivers directly translates into the state of cleanliness of large rivers and, eventually, marine waters—in the case of Poland in the Baltic Sea. Polluted rivers are responsible for 100% of phosphorus present in the Baltic and approximately 20–30% of nitrogen [49]. The majority of studies regarding the pollution and eutrophication of freshwaters primarily concern lakes and retention reservoirs. The quality of flowing waters should therefore become the subject of a greater number of studies. Rivers constitute the main resources of inland waters for household, industrial, and irrigation use. Rivers provide the habitat for many ecosystems and are necessary for hydrological and biochemical cycles [50,51]. Changes in the dynamics of pollution of surface waters resulting from global warming have also been observed in recent years. They result in frequent droughts and floods, leading to changes in the condition of river waters and in the concentration of pollutants [52]. The progressing urbanization, intensive agricultural activity, deforestation, and climate warming result in irreversible transformations of the natural environment and ecosystems. The primary pollutants include organic matter and nutrients related to the agricultural activity or presence of wastewater treatment plants, as well as toxic substances such as heavy metals and hydrocarbons related to the progressing urbanization and industrial development [53,54].
The highest concentration of ammonium and nitrate ions was found in the middle course of the river in urbanized areas. Probably the causes of high NO3− concentration in the middle course of the river are also associated with the presence of the Commune Wastewater Treatment Plant in Raszyn. Burzyńska [36] observed similar dependencies in her research. Waters on agricultural land show high concentrations of nutrients such as total phosphorus, NO3−, and NH4+ from organic and mineral fertilizers [55,56]. High local phosphorus concentrations can also result from municipal pollution [57]. Phosphorus concentration in rivers is also largely determined by spring snowmelt, intensive rainfall, and particularly storms washing phosphorus from agricultural land, municipal sewage, and surface runoff from urbanized areas [58]. These results correlate with our results. The increase in the concentration of biogenic elements was observed in urbanized areas. The negative relationships between water quality and urban land cover and in lowland catchments suggest that lowland river water-quality state is strongly influenced by agricultural and urban land use. This association between water-quality degradation and intensive agricultural and urban land use in lowland catchments has been reported in many other regions [59,60]. An increase in the concentration of nitrates can be caused by agriculture, particularly in areas under intensive use, where the nitrification process occurs, favoring the leaching of nitrates [61]. Urbanized lands dominate the structure of land use in the lower part of the river. The way land was used probably had an effect on the partial reduction of N-NO3 concentration in river waters. Similar changes in lower water pollution in the lower part of the Raszynka River were also observed by Pawłat-Zawrzykraj [62].
Higher than average COD values in flowing waters may be caused by both considerable pollution with organic substances subject to biodegradation and inorganic substances. Increased values of the indicator are often related to the occurrence of high concentrations of total phosphorus and NH4+. Such an effect is particularly evident in summer months when the intensified supply of agricultural pollutants occurs [63,64]. High concentration of chemical oxygen demand may also be related to the occurrence of a high abundance of microorganisms in the river [65,66]. Just like in our research, studies have shown that the small rivers contain high concentrations of nitrates and phosphates, which led to the quick growth as well as death of plants and algae. The result is accumulation and decomposition of organic wastes leading to high DOC and BOD values [67,68].
Own research found high variability of chloride concentrations. Chloride concentrations were higher in the upper course of the river than in the lower ones. In the upper course of the river, there are areas with intensive plant production. Points P1 and P2 are areas used for agriculture. Research by other authors clearly shows that land use affects the concentration of chlorides in the water. At the same time, land use change reduces the leaching of this ion from the soil [69].
The highest concentrations occurred at measurement sites on urbanized land. Research by [70] points to an increase in chloride concentrations in the waters of rivers neighboring agricultural and residential areas. Our research also corresponds to German research in which similar relationships were obtained [71].
High concentrations of total phosphorus, NH4+, NO3−, and chemical oxygen demand with simultaneous low dissolved oxygen concentration in rivers may lead to eutrophication. Human activity is often identified as the cause of eutrophication, particularly agriculture and improper waste management [72,73]. According to research by some authors, draughts have a considerable effect on temperature and dissolved oxygen concentration but do not affect the concentration of nutrients [74].
The conducted research showed considerable changes in EC (179 vs. 439 μS cm−1). More than 50% of the analyzed samples were qualified as class I water quality. The remaining samples were qualified as class II water quality. Water samples collected from site P7 stand out among others. The value of EC at that site is lower by more than 50% in comparison to water sampled from the neighboring site P8. Probably this situation could have been determined by limited water flow between these sites. Other research suggests that groundwater may be a large source of nutrients in the river [75]. According to research by Wysocka-Czubaszek and Wojno [76], an increase in EC suggests the low self-cleaning capacity of a river. In the case of the Raszynka River, an increase in EC occurred in water from sites with restricted water flow related to strong overgrowing of the areas with water vegetation. Other studies also indicate that in agricultural settings, the EC of surface waters was found to be significantly higher than that of surface waters with natural vegetation or urban land surrounding them [77]. The influence of land use disappears during prolonged rainfall and snowmelt-induced floods when the water circulation pattern in catchments is similar [78].
The quality of the water flowing out of the catchment area of a river depends primarily on the form of land development. Research conducted by Cavalcante et al. (2017) [53] and Rodrigues et al. (2018) [79] demonstrates that the link between the quality of water in rivers and the type of catchment used (urbanized and agricultural land) varies, depending on the terrain, region, weather, and climatic conditions. The waters in agricultural areas contain high concentrations of biogenic substances such as total phosphorus, nitrate nitrogen, and ammonium nitrogen, the sources of which are organic and mineral fertilizers [55]. High local concentrations of phosphorus may also be the result of municipal pollution [80]. The main sources of ammonium nitrogen in rivers are point sources, e.g., sewage treatment plants and surface sources—surface runoffs from farmlands [81].
5. Conclusions
The Raszynka River waters were of low quality due to the high concentration of nitrogen, chloride, and COD. The most polluted surface waters of the lower section of the river are located in the vicinity of the urbanized area, and the least polluted water is from agricultural land and natural meadows.
Regarding legal regulations in terms of quality, the Raszynka river water did not meet the standards in terms of concentration of NH4+ ions in urbanized areas and COD in agricultural areas. The concentration of ammonium in river water was four times higher in the urbanized area compared to agricultural land use (1.21 and 0.32 mg dm−3, respectively). On the other hand, the concentration of phosphorus was almost 30% higher in agricultural land use compared to urbanized area (0.18 and 0.14 mg dm−3 respectively). In terms of nitrate concentration in the water, the highest one was measured in the middle course of the river (sampling points P5 and P6). The nitrate concentration was up to twice to three times higher than in the other sampling points (1.91–2.13 and 0.65–1.22 mg dm−3, respectively). This was associated with the presence of the Commune Wastewater Treatment Plant in Raszyn municipality. Water pH in the Raszynka River varied from 7.1 to 7.4 and did not depend on land use. The highest chemical oxygen demand in the waters of the Raszynka River was measured on the sampling points P7 and P8, which could have been caused by the abundant occurrence of water vegetation in that location.
In order to limit the effects of the uncontrolled spreading of nutrients to the environment, periodic monitoring of the surface water in river valleys in agricultural areas should be carried out. It is also recommended to increase buffer zones between arable land and the river.
Author Contributions
Conceptualization, B.R., W.W., and W.S.; methodology, B.R.; software—NOT APPLICABLE validation, B.R. and W.S.; formal analysis, W.W., S.T., and J.V.; investigation, W.S.; resources, B.R.; data curation, B.R., W.W., and W.S.; writing—original draft preparation, B.R. and W.S.; writing—review and editing, B.R., W.S., and S.T.; visualization, K.G. and Š.K.; supervision, B.R. and W.S.; project administration, B.R.; funding acquisition, W.S. All authors have read and agreed to the published version of the manuscript.
Funding
This work was funded by the Operational Program Integrated Infrastructure within the project: Scientific support of climate change adaptation in agriculture and mitigation of soil degradation no. 313011W580, co-financed by the European Regional Development Fund; and also supported by the Slovak Research and Development Agency under grant number APVV-15-0406 and VEGA under grant number 1/0100/22.
Data Availability Statement
Not applicable.
Conflicts of Interest
The authors declare no conflict of interest.
References
- Mosiej, J.; Skrzypski, J.; Suchecka, T. Impact of the Łódź Agglomeration on water quality indicators and load of pollutants in Ner and Warta rivers, in the period 1995–2011. Acta Sci. Pol. Form. Circumiectus 2019, 18, 25–35. [Google Scholar] [CrossRef]
- Niemirycz, E.; Gozdek, J.; Koszka-Maroń, D. Variability of Organic Carbon in Water and Sediments of the Odra River and Its Tributaries. Pol. J. Environ. Stud. 2006, 15, 557–563. [Google Scholar]
- Strzebońska, M.; Kostka, A. Geochemical State of Wilga River Environment in Kraków (Poland)—Historical Aspects and Existing Issues. Minerals 2021, 11, 908. [Google Scholar] [CrossRef]
- Steinhoff-Wrześniewska, A.; Strzelczyk, M.; Helis, M.; Paszkiewicz-Jasińska, A.; Gruss, Ł.; Pulikowski, K.; Skorulski, W. Identification of catchment areas with nitrogen pollution risk for lowland river water quality. Arch. Environ. Prot. 2022, 48, 53–64. [Google Scholar] [CrossRef]
- Węsławski, J.M. Zdrowe rzeki, zdrowy Bałtyk. Acad.-Mag. Pol. Akad. Nauk. 2020, 62, 81–83. (In Polish) [Google Scholar]
- Deluga, W. Znaczenie marketingu ekologicznego w zachowaniu czystości wód Morza Bałtyckiego. Folia Pomeranae Univ. Technol. Stetin. Oeconomica 2018, 92. (In Polish) [Google Scholar] [CrossRef]
- Huang, C.; Zhao, D.; Fan, X.; Liu, C.; Zhao, G. Landscape dynamics facilitated non-point source pollution control and regional water security of the Three Gorges Reservoir area, China. Environ. Impact Assess. 2022, 92, 106696, ISSN 0195-9255. [Google Scholar] [CrossRef]
- Wojciechowska, E.; Matej-Łukowicz, K.; Nawrot, N.; Gajewska, M.; Obarska-Pempkowiak, H. Wstępna ocena wielkości stężeń związków azotu i fosforu odprowadzanych z wodami powierzchniowymi do Zatoki Puckiej z terenu gminy Puck. Technol. Wody 2019, 4, 14–21. (In Polish) [Google Scholar]
- Chen, Y.; Cvetkovic, V.; Destouni, G. Scenarios of Nutrient-Related Solute Loading and Transport Fate from Different Land Catchments and Coasts into the Baltic Sea. Water 2019, 11, 1407. [Google Scholar] [CrossRef] [Green Version]
- Meng, Y.; Zhang, J.; Fiedler, H.; Liu, W.; Pan, T.; Cao, Z.; Zhang, T. Influence of land use type and urbanization level on the distribution of pharmaceuticals and personal care products and risk assessment in Beiyun River, China. Chemosphere 2022, 287, 132075, ISSN 0045-6535. [Google Scholar] [CrossRef]
- Bol, R.; Gruau, G.; Mellander, P.-E.; Dupas, R.; Bechmann, M.; Skarbøvik, E.; Bieroza, M.; Djodjic, F.; Glendell, M.; Jordan, P.; et al. Challenges of Reducing Phosphorus Based Water Eutrophication in the Agricultural Landscapes of Northwest Europe. Front. Mar. Sci. 2018, 5, 276. [Google Scholar] [CrossRef] [Green Version]
- Gromiec, M. Nowe koncepcje gospodarki wodno-ściekowej-osadowej. Ocena Gospod. Ściekowo-Osadowej Polsce 2020, 7. (In Polish) [Google Scholar]
- Piekar, S.; Urbaś, M. Ocena skuteczności usuwania zanieczyszczeń w gminnej oczyszczalni ścieków w Chwałkowie. Współczesne Probl. Ochr. Sr. Energetyki 2020, 161. (In Polish) [Google Scholar]
- Gracia-Gracia, G.; Jagtap, S. Enhancement of a Spent Irrigation Water Recycling Process: A Case Study in a Food Business. Appl. Sci. 2021, 11, 10355. [Google Scholar] [CrossRef]
- Aristi, I.; von Schiller, D.; Arroita, M.; Barceló, D.; Ponsatí, L.; García-Galán, M.J.; Sabater, S.; Elosegi, A.; Acuña, V. Mixed effects of effluents from a wastewater treatment plant on river ecosystem metabolism: Subsidy or stress? Freshw. Biol. 2015, 60, 1398–1410. [Google Scholar] [CrossRef]
- Yang, S.; Büttner, O.; Kumar, R.; Jäger, C.; Jawitz, J.W.; Rao, P.S.C.; Borchardt, D. Spatial patterns of water quality impairments from point source nutrient loads in Germany’s largest national River Basin (Weser River). Sci. Total Environ. 2019, 697, 134145. [Google Scholar] [CrossRef]
- Yotova, G.; Lazarova, S.; Kudłak, B.; Zlateva, B.; Mihaylova, V.; Wieczerzak, M.; Venelinov, T.; Tsakovski, S. Assessment of the Bulgarian Wastewater Treatment Plants’ Impact on the Receiving Water Bodies. Molecules 2019, 24, 2274. [Google Scholar] [CrossRef] [Green Version]
- Lu, W.; Wu, J.; Li, Z.; Cui, N.; Cheng, S. Water quality assessment of an urban river receiving tail water using the single-factor index and principle component analysis. Water Supply 2019, 19, 603–609. [Google Scholar] [CrossRef]
- Salim Dantas, M.; Rodrigues Barroso, G.; Corrêa Oliveira, S. Performance of sewage treatment plants and impact of effluent discharge on receiving water quality within an urbanized area. Monit. Assess. 2021, 193, 289. [Google Scholar] [CrossRef]
- Mihaylova, V.; Yotova, G.; Kudłak, B.; Venelinov, T.; Tsakovski, S. Chemometric Evaluation of WWTPs’ Wastewaters and Receiving Surface Waters in Bulgaria. Water 2022, 14, 521. [Google Scholar] [CrossRef]
- Kubiak-Wójcicka, K. Assessment of Water Resources in Poland. In Quality of Water Resources in Poland; Springer: Cham, Switzerland, 2021; pp. 15–34. [Google Scholar] [CrossRef]
- Biggs, J.; von Fumetti, S.; Kelly-Quinn, M. The importance of small waterbodies for biodiversity and ecosystem services: Implications for policy makers. Hydrobiologia 2017, 793, 3–39. [Google Scholar] [CrossRef]
- Lorenz, S.; Rasmussen, J.J.; Süß, A. Specifics and challenges of assessing exposure and effects of pesticides in small water bodies. Hydrobiologia 2017, 793, 213–224. [Google Scholar] [CrossRef]
- Crnobrnja-Isailović, J.; Adrović, A.; Bego, F.; Čađenović, N.; Hadžiahmetović, J.; Jablonski, D.; Sterijovski, B.; Jovanović Glavaš, O. The Importance of Small Water Bodies’ Conservation for Maintaining Local Amphibian Diversity in the Western Balkans. In Small Water Bodies of the Western Balkans; Springer: Cham, Switzerland, 2022; pp. 351–387. [Google Scholar] [CrossRef]
- Manfrin, A.; Bombi, P.; Traversetti, L.; Larsen, S.; Scalici, M. A landscape-based predictive approach for running water quality assessment a Mediterranean case study. J. Nat. Conserv. 2016, 30, 27–31. [Google Scholar] [CrossRef]
- Camara, M.; Jamil, N.R.; Bin Abdullah, A.F. Impact of land uses on water quality in Malaysia a review. Ecol. Process. 2019, 8, 10. [Google Scholar] [CrossRef]
- Carey, R.O.; Hochmuth, G.J.; Martinez, C.J.; Boyer, T.H.; Dukes, M.D.; Toor, G.S.; Cisar, J.L. Evaluating nutrient impacts in urban water-sheds challenges and research opportunities. Environ. Pollut. 2013, 173, 138–149. [Google Scholar] [CrossRef] [PubMed]
- Zhang, Y.; Dudgeon, D.; Cheng, D.; Thoe, W.; Fok, L.; Wang, Z.; Lee, J.H.W. Impacts of land use and water quality on macroinvertebrate communities in the Pearl River drainage basin, China. Hydrobiologia 2010, 652, 71–88. [Google Scholar] [CrossRef]
- Guo, Y.; Li, S.; Liu, R.; Zhang, J. Relationship between landscape pattern and water quality of the multi-scale effects in the Yellow River Basin. J. Lake Sci. 2021, 33, 737–748. [Google Scholar]
- Gu, B.; Ju, X.; Chang, J.; Ge, Y.; Vitousek, P.M. Integrated reactive nitrogen budgets and future trends in China. Proc. Natl. Acad. Sci. USA 2015, 112, 8792–8797. [Google Scholar] [CrossRef] [Green Version]
- Jaworski, N.A.; Groffman, P.M.; Keller, A.A.; Prager, J.C. A watershed nitrogen and phosphorus balance the upper Potomac River basin. Estuaries 1992, 15, 83–95. [Google Scholar] [CrossRef]
- Guzha, A.C.; Rufino, M.C.; Okoth, S.; Jacobs, S.; Nobrega, R.L.B. Impacts of land use and land cover change on surface runoff, dis-charge and low flows evidence from East Africa. J. Hydrol. Reg. Stud. 2018, 15, 49–67. [Google Scholar] [CrossRef]
- Yang, C.; Yang, P.; Geng, J.; Yin, H.; Chen, K. Sediment internal nutrient loading in the most polluted area of a shallow eutrophic lake (Lake Chaohu, China) and its contribution to lake eutrophication. Environ. Pollut. 2020, 262, 114292. [Google Scholar] [CrossRef] [PubMed]
- PWN. Kondracki Geografia Regionalna Polski; PWN: Warszawa, Poland, 2002; p. 440. (In Polish) [Google Scholar]
- Woś, A. Klimat Polski; PWN: Warszawa, Poland, 1999; p. 301. (In Polish) [Google Scholar]
- Burzyńska, I. Evaluation of selected physical and chemical indicators in Raszynka River. Water-Environ.-Rural. Areas 2016, 16, 23–34. [Google Scholar]
- Regulation of the Minister of Maritime Economy and Inland Navigation. on 11 October 2019. On the classification of ecological condition, ecological potential, chemical condition, and the method of classification of the state of surface water bodies, as well as environmental quality standards for priority substances. Journal of Laws 2019, 21, 255. [Google Scholar]
- PN-EN ISO 11732; Water Quality—Determination of Ammonium Nitrogen by Flow Analysis (CFA and FIA) and Spectrometric Detection. Polish Committee for Standardization: Warszawa, Poland, 2007.
- PN-EN ISO 13395; Water Quality—Determination of Nitrite Nitrogen by and Nitrate Nitrogen and the sum by Flow Analysis (CFA and FIA) and Spectrometric Detection. Polish Committee for Standardization: Warszawa, Poland, 2001.
- PN-EN ISO 6878:2006; Total Phosphorus (P) Was Determined by the Ascorbic Acid Method. Polish Committee for Standardization: Warszawa, Poland, 2006.
- PN-ISO 9297:1994; Water Quality—Determination of Chloride—Silver Nitrate Titration with Chromate Indicator (Mohr’s Method). Polish Committee for Standardization: Warszawa, Poland, 1994.
- PN-ISO 6060:2006; Chemical Oxygen Demand (COD) Was Determined by Titration Using Potassium Permanganate. Polish Committee for Standardization: Warszawa, Poland, 2006.
- PN-EN 27888:1999; Water Quality—Determination of Electrical Conductivity. Polish Committee for Standardization: Warszawa, Poland, 1999.
- PN-EN ISO 10523:2012; Water Quality—Determination of pH. Polish Committee for Standardization: Warszawa, Poland, 2012.
- PN-EN ISO 9963-1:2001; Water Quality—Determination of Alkalinity—Part 1: Determination of Total and Composite Alkalinity. Polish Committee for Standardization: Warszawa, Poland, 2001.
- Nanda, A.; Mohapatra, B.B.; Mahapatra, A.P.K.; Mahapatra, A.P.K.; Mahapatra, A.P.K. Multiple comparison test by Tukey’s honestlysignificant difference (HSD): Do the confident levelcontrol type I error. Int. J. Stat. Appl. Math. 2021, 6, 59–65. [Google Scholar] [CrossRef]
- Ruiz-Zarzuela, I.; Halaihel, N.; Balcázar, J.L.; Ortega, C.; Vendrell, D.; Perez, T.; Alonso, J.L.; de Blas, I. Effect of fish farming on the water quality of rivers in northeast Spain. Water Sci. Technol. 2009, 60, 663–671. [Google Scholar] [CrossRef]
- Raczyńska, M.; Machula, S.; Choiński, A.; Sobkowiak, L. Influence of the fish pond aquaculture effluent discharge on abiotic environmental factors of selected rivers in Northwest Poland. Acta Ecol. Sin. 2012, 32, 160–164. [Google Scholar] [CrossRef]
- Bartnicki, J. Atmospheric Contribution to Eutrophication of the Baltic Sea. Air Pollut. Model. Its Appl. 2019, XXVI, 53–57. [Google Scholar] [CrossRef]
- Paule-Mercado, M.A.; Lee, B.Y.; Memon, S.A.; Umer, S.R.; Salim, I.; Lee, C.-H. Influence of land development on storm water runoff from a mixed land use and land cover catchment. Sci. Total Environ. 2017, 599, 2142–2155. [Google Scholar] [CrossRef]
- Abobakr Yahya, A.S.; Ahmed, A.N.; Binti Othman, F.; Ibrahim, R.K.; Afan, H.A.; El-Shafie, A.; Fai, C.M.; Hossain, M.S.; Ehteram, M.; Elshafie, A. Water Quality Prediction Model Based Support Vector Machine Model for Ungauged River Catchment under Dual Scenarios. Water 2019, 11, 1231. [Google Scholar] [CrossRef] [Green Version]
- Dzhamalov, R.G.; Kosolapov, A.E.; Vlasov, K.G.; Myagkova, K.G.; Reshetnyak, O.S.; Safronova, T.I. Pollution Degree of the Don River Water. Water Resour. Regime Water Bodies 2019, 46, S1–S10. [Google Scholar] [CrossRef]
- Cavalcante, H.; Cruz, P.S.; Viana, L.G.; de Lucena Silva, D.; de Lucena Barbosa, J.E. Influence of the use and the land cover of the catchment in the water quality of the semiarid tropical reservoirs. J. Hyperspectral Remote Sens. 2017, 7, 389–398. [Google Scholar] [CrossRef] [Green Version]
- Shi, P.; Zhang, Y.; Li, Z.; Li, P.; Xu, G. Influence of land use and land cover patterns on seasonal water quality at multi-spatial scales. Catena 2017, 151, 182–190. [Google Scholar] [CrossRef]
- Fierro, P.; Bertrán, C.; Tapia, J.; Hauenstein, E.; Peña-Cortés, F.; Vergara, C.; Cerna, C.; Vargas-Chacoff, L. Effects of local land-use on riparian vegetation, water quality, and the functional organization of macroinvertebrate assemblages. Sci. Total Environ. 2017, 609, 724–734. [Google Scholar] [CrossRef] [PubMed]
- Torma, S.; Koco, Š.; Vilček, J.; Čermák, P. Nitrogen and phosphorus transport in the soil from the point of view of water pollution. Folia Geogr. 2019, 61, 143–156, ISSN 1336-6157. [Google Scholar]
- Shen, L.Q.; Amatulli, G.; Sethi, T. Estimating nitrogen and phosphorus concentrations in streams and rivers, within a machine learning framework. Sci. Data 2020, 7, 161. [Google Scholar] [CrossRef]
- Rattan, K.J.; Corriveau, J.C.; Brua, R.B.; Clup, J.M.; Yates, A.G.; Chambers, P.A. Quantifying seasonal variation in total phosphorus and nitrogen from prairie streams in the Red River Basin, Manitoba Canada. Sci. Total Environ. 2016, 575, 649–659. [Google Scholar] [CrossRef]
- Neal, C.; Jarvie, H.P. Agriculture, Community, River Eutrophication and the Water Framework Directive. Hydrol. Process 2005, 19, 1895–1901. [Google Scholar] [CrossRef]
- Morgan, R.P.; Kline, K.M. Nutrient Concentrations in Maryland Non-Tidal Streams. Environ. Monit. Assess. 2011, 178, 221–235. [Google Scholar] [CrossRef]
- Mingming, H.; Yuchun, W.; Pengcheng, D.; Yong, S.; Aiminc, C.; Cong, L.; Yufei, B.; Yanhui, L.; Shanze, L.; Panwei, Z. Tracing the sources of nitrate in the rivers and lakes of the southern areas of the Tibetan Plateau using dual nitrate isotopes. Sci. Total Environ. 2019, 658, 132–140. [Google Scholar] [CrossRef]
- Pawłat-Zawrzykraj, A. Inwentaryzacja i waloryzacja przyrodniczo-krajobrazowa górnego biegu rzeki Raszynka [Ecological and landscape inventory and evaluation of the upper course of the Raszynka River]. Woda-Sr. Obsz. Wiejskie. 2003, 3, 97–110. (In Polish) [Google Scholar]
- Abed, A.A.; Ewaid, S.H.; Al-Ansari, N. Evaluation of Water quality in the Tigris River within Baghdad, Iraq using Multivariate Statistical Techniques. J. Phys. Conf. Ser. 2019, 1294, 072025. [Google Scholar] [CrossRef]
- Arif, M.; Kumar, R.; Parveen, S.; Verma, N. Reduction in water pollution in Yamuna River due to lockdown under COVID-19 Pandemic. Pharma Innov. J. 2020, 9, 84–89. [Google Scholar]
- Bai, S.; Wang, X.; Zhao, X.; Ren, N. Characterizing water pollution potential in life cycle impact assessment based on bacterial growth and water quality models. Water 2018, 10, 1621. [Google Scholar] [CrossRef] [Green Version]
- Kumar, B.; Singh, U.K.; Ojha, S.N. Evaluation of geochemical data of Yamuna River using WQI and multivariate statistical analyses: A case study. Int. J. River Basin Manag. 2019, 17, 143–155. [Google Scholar] [CrossRef]
- Waziri, M. Physicochemical and Bacteriological Investigation of Surface and Groundwater of Kumadugu-Yobe Basin. Ph.D. Thesis, University of Maiduguri, Maiduguri, Nigeria, 2006; pp. 88–89. [Google Scholar]
- Boyd, C.E. The Chemical Oxygen Demand of Waters and Biological Materials from Ponds. Trans. Am. Fish. Soc. 1973, 102, 606–611. [Google Scholar] [CrossRef]
- Meissner, R.; Seeger, J.; Rupp, H. Lysimeter studies in East Germany concerning the influence of set aside of intensively farmed land on the seepage water quality. Agric. Ecosyst. Environ. 1998, 67, 161–173. [Google Scholar] [CrossRef]
- Lax, S.M.; Peterson, E.W.; Van der Hoven, S.J. Stream chloride concentrations as a function of land use: A comparison of an agricultural watershed to an urban agricultural watershed. Environ. Earth Sci. 2017, 76, 708. [Google Scholar] [CrossRef]
- Lei, C.; Wagner, P.D.; Fohrer, N. Effects of land cover, topography, and soil on stream water quality at multiple spatial and seasonal scales in a German lowland catchment. Ecol. Indic. 2021, 120, 106940. [Google Scholar] [CrossRef]
- Moniewski, P. Sezonowe Zmiany Wybranych Cech Fizyczno-Chemicznych wód Małej Rzeki Podmiejskiej na Przykładzie Dzierżąznej; Monografie Komitetu Gospodarki Wodnej PAN: Warszawa, Poland, 2014; Volume 20, pp. 407–416. (In Polish) [Google Scholar]
- Jarvie, H.P.; Neal, C.; Withers, P.J.A. Sewage-effluent phosphorus: A greater risk to river eutrophication than agricultural phosphorus? Sci. Total Environ. 2006, 360, 246–253. [Google Scholar] [CrossRef]
- Hilton, J.; O’Hare, M.; Bowes, M.J.; Jones, I. How green is my river? A new paradigm of eutrophication in rivers. Sci. Total Environ. 2006, 365, 66–83. [Google Scholar] [CrossRef]
- Yu, L.; Rozemeijer, J.; van Breukelen, B.M.; Ouboter, M.; van der Vlugt, C.; Broers, H.P. Groundwater impacts on surface water quality and nutrient loads in lowland polder catchments: Monitoring the greater Amsterdam area. Hydrol. Earth Syst. Sci. 2018, 22, 487–508. [Google Scholar] [CrossRef] [Green Version]
- Wysocka-Czubaszek, A.; Wojno, W. Seasonal changes of water chemistry in a small river in an urban catchment. Sci. Rev. Eng. Environ. Sci. 2014, 23, 64–76. [Google Scholar]
- Tong, S.; Chen, W. Modeling the relationship between land use and surface water quality. J. Environ. Manag. 2002, 66, 377–393. [Google Scholar] [CrossRef] [PubMed]
- Siwek, J.P.; Żelazny, M.; Chełmicki, W. The influence of water circulation on stream water electrical conductivity in catchments with different land use during flood periods (the carpathian foothills, Poland). In Proceedings of the 12th Biennial International Conference of the Euromediter-Ranean Network of Experimental and Representative Basins (ERB), Kraków, Poland, 18–20 September 2008; pp. 75–80. [Google Scholar]
- Rodrigues, V.; Estrany, J.; Ranzini, M.; de Cicco, V.; Tarjuelo, M.-B.J.M.; Hedo, J.; Lucas-Borja, M.E. Effects of land use and seasonality on stream water quality in a small tropical catchment: The headwater of Córrego Água Limpa, São Paulo (Brazil). Sci. Total Environ. 2018, 622, 1553–1561. [Google Scholar] [CrossRef] [Green Version]
- Shen, Z.; Li, Z.; Miao, H. Budget and Control of Phosphorus in the Changjiang River Catchment and Its Mouth 2020. In Studies of the Biogeochemistry of Typical Estuaries and Bays in China; Springer: Berlin/Heidelberg, Germany, 2020; pp. 61–80. [Google Scholar] [CrossRef]
- Armstrong, B.M.; Lazorchak, J.M.; Murphy, C.A.; Haring, H.J.; Jensen, K.M.; Smith, M.E. Determining the effects of ammonia on fathead minnow (Pimephales promelas) reproduction. Sci. Total Environ. 2012, 420, 127–133. [Google Scholar] [CrossRef]
Figure 1.
Localization of Raszynka river and its catchment in the framework of Poland.

Figure 2.
Water sampling scheme (google.maps.com, accessed date on 8 October 2022) in Raszynka river catchment.
Figure 2.
Water sampling scheme (google.maps.com, accessed date on 8 October 2022) in Raszynka river catchment.


Table 1.
Description of the location of the sampling sites on the Raszynka River.
| Sampling Locality | |||
|---|---|---|---|
| Number of Samples | Geographical Coordinates | Km River | Land Use |
| P1 | 52.160563 N 20.845211 E | 2.20 | Agricultural land |
| P2 | 52.158987 N 20.859988 E | 3.50 | Agricultural land |
| P3 | 52.157642 N 20.876194 E | 4.50 | Meadow |
| P4 | 52.156924 N 20.891203 E | 6.00 | Urbanized areas |
| P5 | 52.153720 N 20.908024 E | 7.20 | Urbanized areas |
| P6 | 52.150380 N 20.919491 E | 8.50 | Urbanized areas |
| P7 | 52.145495 N 20.933610 E | 10.20 | Agricultural land |
| P8 | 52.141619 N 20.948051 E | 13.90 | Meadow |
| P9 | 52.137210 N 20.963244 E | 16.30 | Meadow |
Table 2.
Two-way analysis of variance.
| Effect | SS | df | MS | F | p |
|---|---|---|---|---|---|
| N-NH4+ | |||||
| Intercept | 51.51406 | 1 | 51.51406 | 1949.577 | 0.000000 |
| Year | 0.32950 | 2 | 0.16475 | 6.235 | 0.003030 |
| Point | 17.85419 | 8 | 2.23177 | 84.463 | 0.000000 |
| Yearxpoint | 2.46053 | 16 | 0.15378 | 5.820 | 0.000000 |
| Error | 2.14028 | 81 | 0.02642 | ||
| N-NO3− | |||||
| Intercept | 134.5807 | 1 | 134.5807 | 2890.525 | 0.000000 |
| Year | 4.1392 | 2 | 2.0696 | 44.451 | 0.000000 |
| Point | 8.1390 | 8 | 1.0174 | 21.851 | 0.000000 |
| Yearxpoint | 6.6174 | 16 | 0.4136 | 8.883 | 0.000000 |
| Error | 3.7713 | 81 | 0.0466 | ||
| P | |||||
| Intercept | 2.418015 | 1 | 2.418015 | 1106.549 | 0.000000 |
| Year | 0.014735 | 2 | 0.007368 | 3.372 | 0.039219 |
| Point | 0.128169 | 8 | 0.016021 | 7.332 | 0.000000 |
| Yearxpoint | 0.045881 | 16 | 0.002868 | 1.312 | 0.210273 |
| Error | 0.177000 | 81 | 0.002185 | ||
| Cl− | |||||
| Intercept | 75,176.67 | 1 | 75,176.67 | 12,318.19 | 0.000000 |
| Year | 357.12 | 2 | 178.56 | 29.26 | 0.000000 |
| Point | 2579.05 | 8 | 322.38 | 52.82 | 0.000000 |
| Yearxpoint | 347.54 | 16 | 21.72 | 3.56 | 0.000078 |
| Error | 494.33 | 81 | 6.10 | ||
| COD | |||||
| Intercept | 8916.746 | 1 | 8916.746 | 2235.176 | 0.000000 |
| Year | 84.848 | 2 | 42.424 | 10.634 | 0.000079 |
| Point | 642.888 | 8 | 80.361 | 20.144 | 0.000000 |
| Yearxpoint | 39.479 | 16 | 2.467 | 0.619 | 0.860166 |
| Error | 323.132 | 81 | 3.989 | ||
| EC | |||||
| Intercept | 15,931,393 | 1 | 15,931,393 | 65,094.98 | 0.000000 |
| Year | 52 | 2 | 26 | 0.11 | 0.899610 |
| Point | 524,679 | 8 | 65,585 | 267.98 | 0.000000 |
| Yearxpoint | 3412 | 16 | 213 | 0.87 | 0.603027 |
| Error | 19824 | 81 | 245 | ||
| pH | |||||
| Intercept | 5720.333 | 1 | 5720.333 | 373,666.9 | 0.000000 |
| Year | 0.107 | 2 | 0.054 | 3.5 | 0.034777 |
| Point | 0.318 | 8 | 0.040 | 2.6 | 0.013953 |
| Yearxpoint | 0.341 | 16 | 0.021 | 1.4 | 0.166464 |
| Error | 1.240 | 81 | 0.015 | ||
| alkalinity | |||||
| Intercept | 3,078,136 | 1 | 3,078,136 | 27,355.67 | 0.000000 |
| Year | 509 | 2 | 254 | 2.26 | 0.110897 |
| Point | 56,971 | 8 | 7121 | 63.29 | 0.000000 |
| Yearxpoint | 3412 | 16 | 213 | 1.90 | 0.032603 |
| Error | 9114 | 81 | 113 | ||
Table 3.
Changes in the concentration of nitrogen and phosphorus forms and COD average in 2017–2019.
Table 3.
Changes in the concentration of nitrogen and phosphorus forms and COD average in 2017–2019.
| Year | P1 | P2 | P3 | P4 | P5 | P6 | P7 | P8 | P9 |
|---|---|---|---|---|---|---|---|---|---|
| NH4+ (mg dm−3) | |||||||||
| 2017 | 0.24 a | 0.22 a | 0.27 a | 1.51 f | 0.92 e | 1.55 g | 0.28 a | 0.98 e | 0.60 c |
| 2018 | 0.47 b | 0.41 b | 0.48 c | 0.69 d | 0.97 e | 1.30 f | 0.21 a | 0.48 c | 0.50 c |
| 2019 | 0.41 b | 0.41 b | 0.48 c | 1.42 f | 0.96 e | 1.60 g | 0.21 a | 0.54 c | 0.55 c |
| NO3− (mg dm−3) | |||||||||
| 2017 | 0.97 d | 0.74 c | 0.22 a | 1.02 de | 0.84 cd | 1.38 f | 0.93 d | 0.76 c | 0.79 c |
| 2018 | 1.31 f | 1.04 e | 1.53 g | 1.41 f | 1.84 h | 1.13 e | 1.02 d | 0.85 d | 0.55 b |
| 2019 | 1.26 f | 1.22 e | 1.46 g | 1.13 e | 1.91 h | 2.13 i | 1.21 e | 0.85 d | 0.65 bc |
| TP (mg dm−3) | |||||||||
| 2017 | 0.12 b | 0.14 b | 0.13 b | 0.12 b | 0.16 bc | 0.16 bc | 0.11 a | 0.19 c | 0.19 c |
| 2018 | 0.14 b | 0.15 b | 0.18 c | 0.12 b | 0.18 c | 0.16 bc | 0.15 b | 0.21 c | 0.21 c |
| 2019 | 0.06 a | 0.11 a | 0.08 | 0.12 b | 0.13 b | 0.15 b | 0.14 b | 0.21 c | 0.26 d |
| COD (mg O2 dm−3) | |||||||||
| 2017 | 9.14 c | 9.41 c | 9.51 c | 9.43 c | 9.22 c | 9.50 c | 15.22 e | 10.51 d | 9.71 c |
| 2018 | 8.11 b | 9.49 c | 8.11 b | 7.85 b | 7.31 b | 7.66 b | 16.39 f | 8.35 b | 8.33 b |
| 2019 | 7.17 b | 6.45 a | 7.16 b | 7.67 b | 6.43 b | 5.84 a | 16.13 f | 7.38 b | 7.88 b |
Letters a–i—homogeneous groups—groups in which the mean values of the examined parameters do not differ significantly.
Table 4.
Changes in chloride concentration, EC, pH, and total alkalinity in the Raszynka River average 2017–2019.
Table 4.
Changes in chloride concentration, EC, pH, and total alkalinity in the Raszynka River average 2017–2019.
| Year | P1 | P2 | P3 | P4 | P5 | P6 | P7 | P8 | P9 |
|---|---|---|---|---|---|---|---|---|---|
| Cl− (mg dm−3) | |||||||||
| 2017 | 28.8 e | 30.1 e | 26.8 d | 27.2 d | 27.9 d | 29.5 e | 13.3 a | 22.9 c | 21.6 b |
| 2018 | 29.4 e | 26.3 d | 28.3 e | 26.2 d | 25.9 d | 29.9 e | 15.7 a | 21.7 b | 20.6 b |
| 2019 | 27.1 d | 36.7 g | 37.1 g | 32.6 f | 31.1 e | 30.8 e | 18.2 b | 23.6 c | 23.4 c |
| EC (µS cm−1) | |||||||||
| 2017 | 401 d | 401 d | 414 d | 432 e | 384 c | 389 c | 195 a | 427 e | 422 e |
| 2018 | 410 d | 400 d | 426 e | 430 e | 373 b | 392 c | 179 a | 439 e | 401 d |
| 2019 | 401 d | 401 d | 417 d | 425 e | 373 b | 393 c | 204 ab | 432 e | 409 d |
| pH | |||||||||
| 2017 | 7.1 | 7.4 | 7.3 | 7.3 | 7.3 | 7.2 | 7.1 | 7.2 | 7.3 |
| 2018 | 7.2 | 7.2 | 7.3 | 7.3 | 7.2 | 7.2 | 7.3 | 7.2 | 7.3 |
| 2019 | 7.4 | 7.4 | 7.4 | 7.3 | 7.3 | 7.2 | 7.2 | 7.2 | 7.3 |
| total alkalinity (mg CaCO3 dm−3) | |||||||||
| 2017 | 166.4 b | 153.6 a | 150.8 a | 147.2 a | 158.4 a | 194.6 c | 139.2 a | 215.2 e | 220.4 e |
| 2018 | 156.8 a | 149.2 a | 152.5 a | 160.4 a | 155.2 a | 174.4 b | 148.8 a | 197.6 d | 204.4 d |
| 2019 | 152.8 a | 154.4 a | 148.8 a | 150.8 a | 156.4 a | 190.8 c | 156.8 a | 195.6 d | 207.2 d |
Letters a–g—homogeneous groups—groups in which the mean values of the examined parameters do not differ significantly.
Table 5.
Relation between water quality and land use.
| Cl− | NH4+ | NO3− | P | COD | EC | pH | Total Alkalinity | |
|---|---|---|---|---|---|---|---|---|
| Agricultural land | 25.06 a | 0.32 a | 1.08 b | 0.18 b | 10.83 b | 332.4 b | 7.27 a | 153.1 a |
| Meadow | 25.08 a | 0.54 b | 0.85 a | 0.12 a | 8.55 a | 420.8 a | 7.29 a | 188.0 c |
| Urbanized areas | 29.00 b | 1.21 c | 1.42 c | 0.14 a | 7.88 a | 399.0 a | 7.28 a | 165.4 b |
Letters a–c—homogeneous groups—groups in which the mean values of the examined parameters do not differ significantly.
Publisher’s Note: MDPI stays neutral with regard to jurisdictional claims in published maps and institutional affiliations. |
© 2022 by the authors. Licensee MDPI, Basel, Switzerland. This article is an open access article distributed under the terms and conditions of the Creative Commons Attribution (CC BY) license (https://creativecommons.org/licenses/by/4.0/).
Share and Cite
MDPI and ACS Style
Rutkowska, B.; Szulc, W.; Wyżyński, W.; Gościnna, K.; Torma, S.; Vilček, J.; Koco, Š. Water Quality in a Small Lowland River in Different Land Use. Hydrology 2022, 9, 200. https://0-doi-org.brum.beds.ac.uk/10.3390/hydrology9110200
AMA Style
Rutkowska B, Szulc W, Wyżyński W, Gościnna K, Torma S, Vilček J, Koco Š. Water Quality in a Small Lowland River in Different Land Use. Hydrology. 2022; 9(11):200. https://0-doi-org.brum.beds.ac.uk/10.3390/hydrology9110200
Chicago/Turabian StyleRutkowska, Beata, Wieslaw Szulc, Wiktor Wyżyński, Katarzyna Gościnna, Stanislav Torma, Jozef Vilček, and Štefan Koco. 2022. "Water Quality in a Small Lowland River in Different Land Use" Hydrology 9, no. 11: 200. https://0-doi-org.brum.beds.ac.uk/10.3390/hydrology9110200
Note that from the first issue of 2016, this journal uses article numbers instead of page numbers. See further details here.