


A Novel Non-Contact Detection and Identification Method for the Post-Disaster Compression State of Injured Individuals Using UWB Bio-Radar

Abstract
:1. Introduction
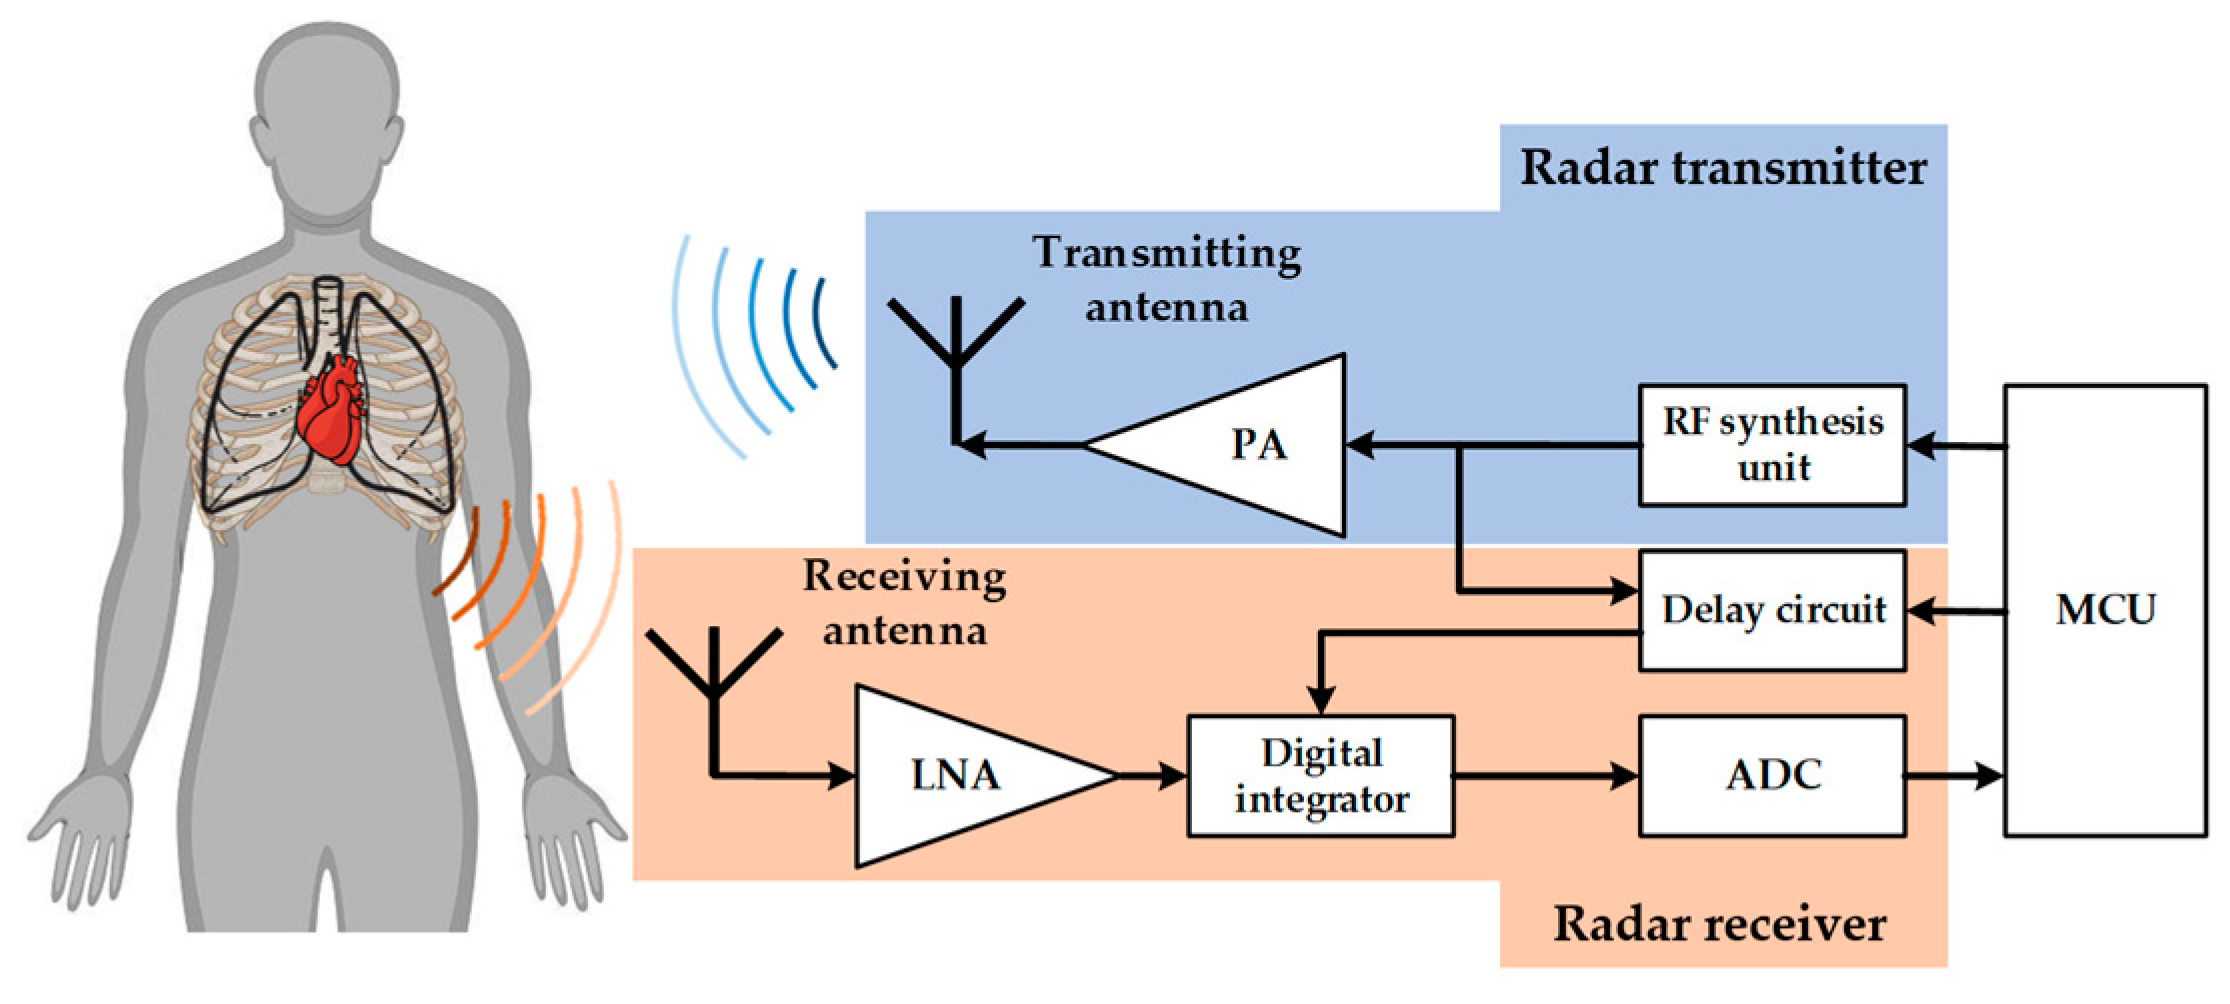
2. UWB Bio-Radar
3. Method
3.1. Reconstruction of Human Radar Life Signals
3.1.1. Principle of Variational Modal Decomposition
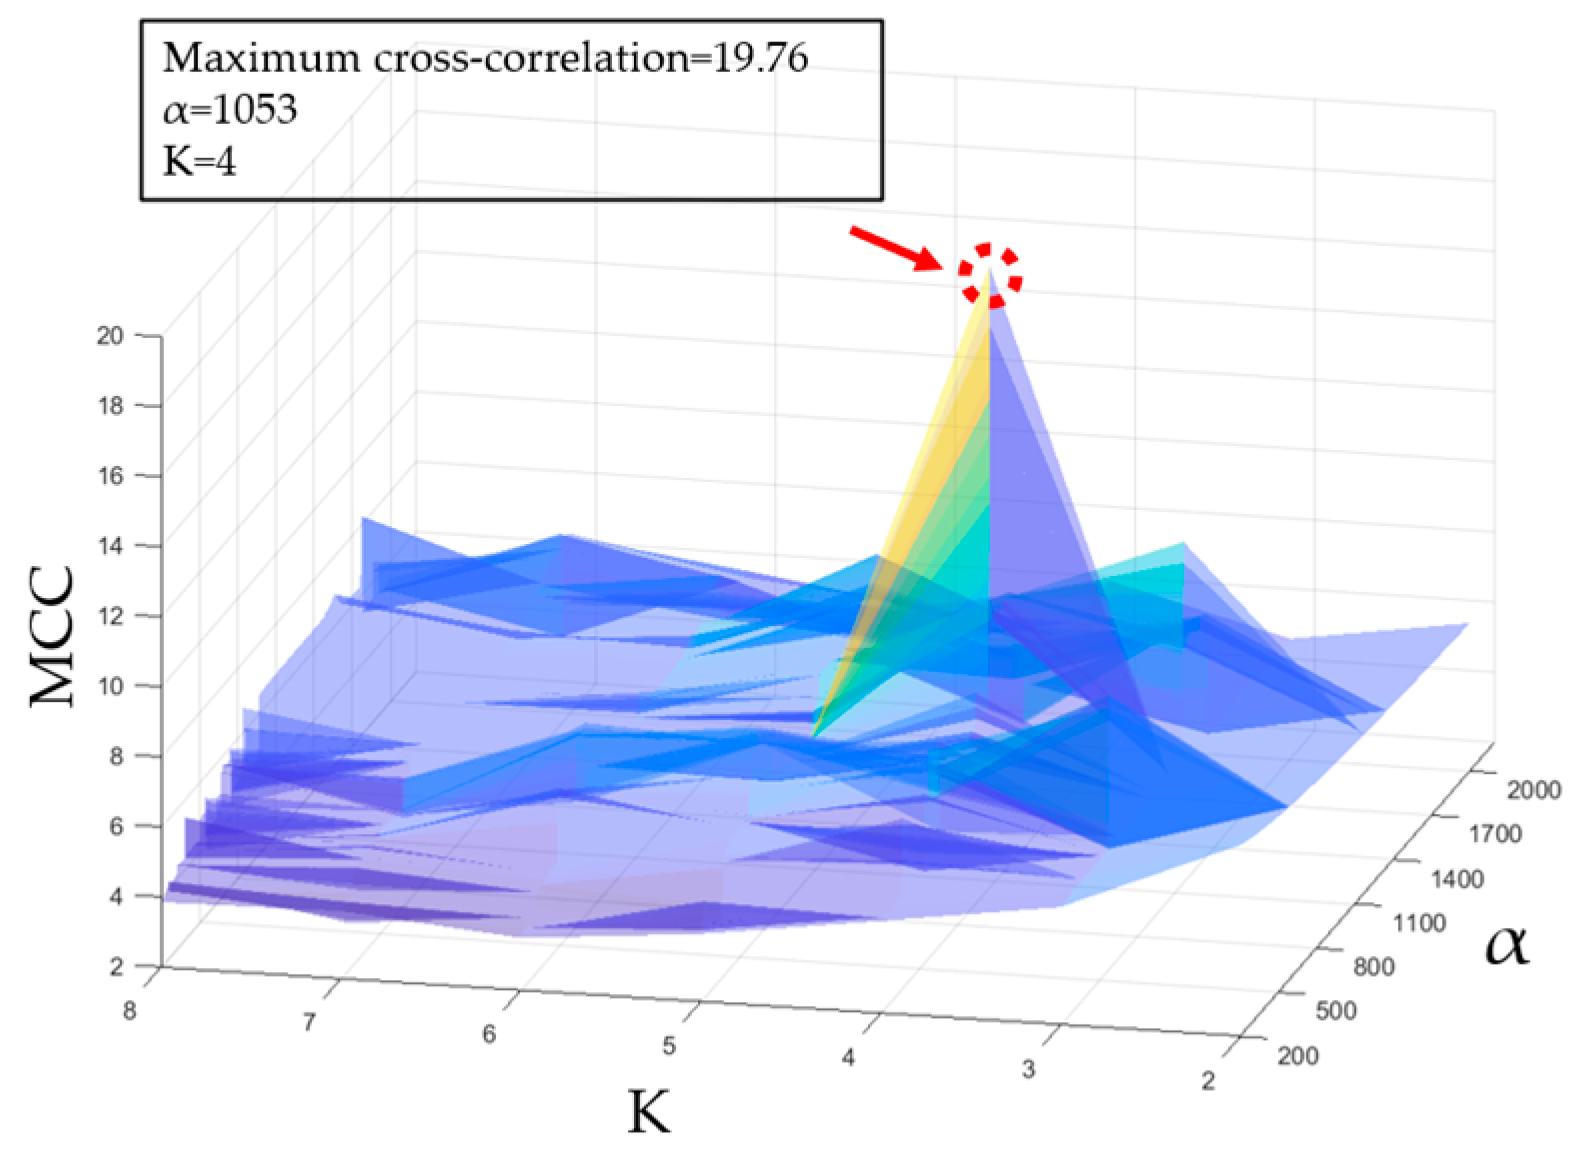
3.1.2. Particle Swarm Optimization for VMD
3.1.3. Life Signal Reconstruction Based on Permutation Entropy
- (1)
- The maximum cross-correlation between each IMF and the radar echo signal after VMD processing was used as the fitness function of the PSO to optimize the VMD parameters.
- (2)
- The radar echo signal was processed based on the parameter-optimized VMD and decomposed into a series of IMFs;
- (3)
- The entropy value of each IMF arrangement was calculated separately;
- (4)
- The entropy values of each IMF were compared and filtered with , high-noise IMFs larger than were directly removed, and the remaining IMFs were reconstructed to restore the radar life signal of the human target. A flowchart of this method is shown in Figure 6.
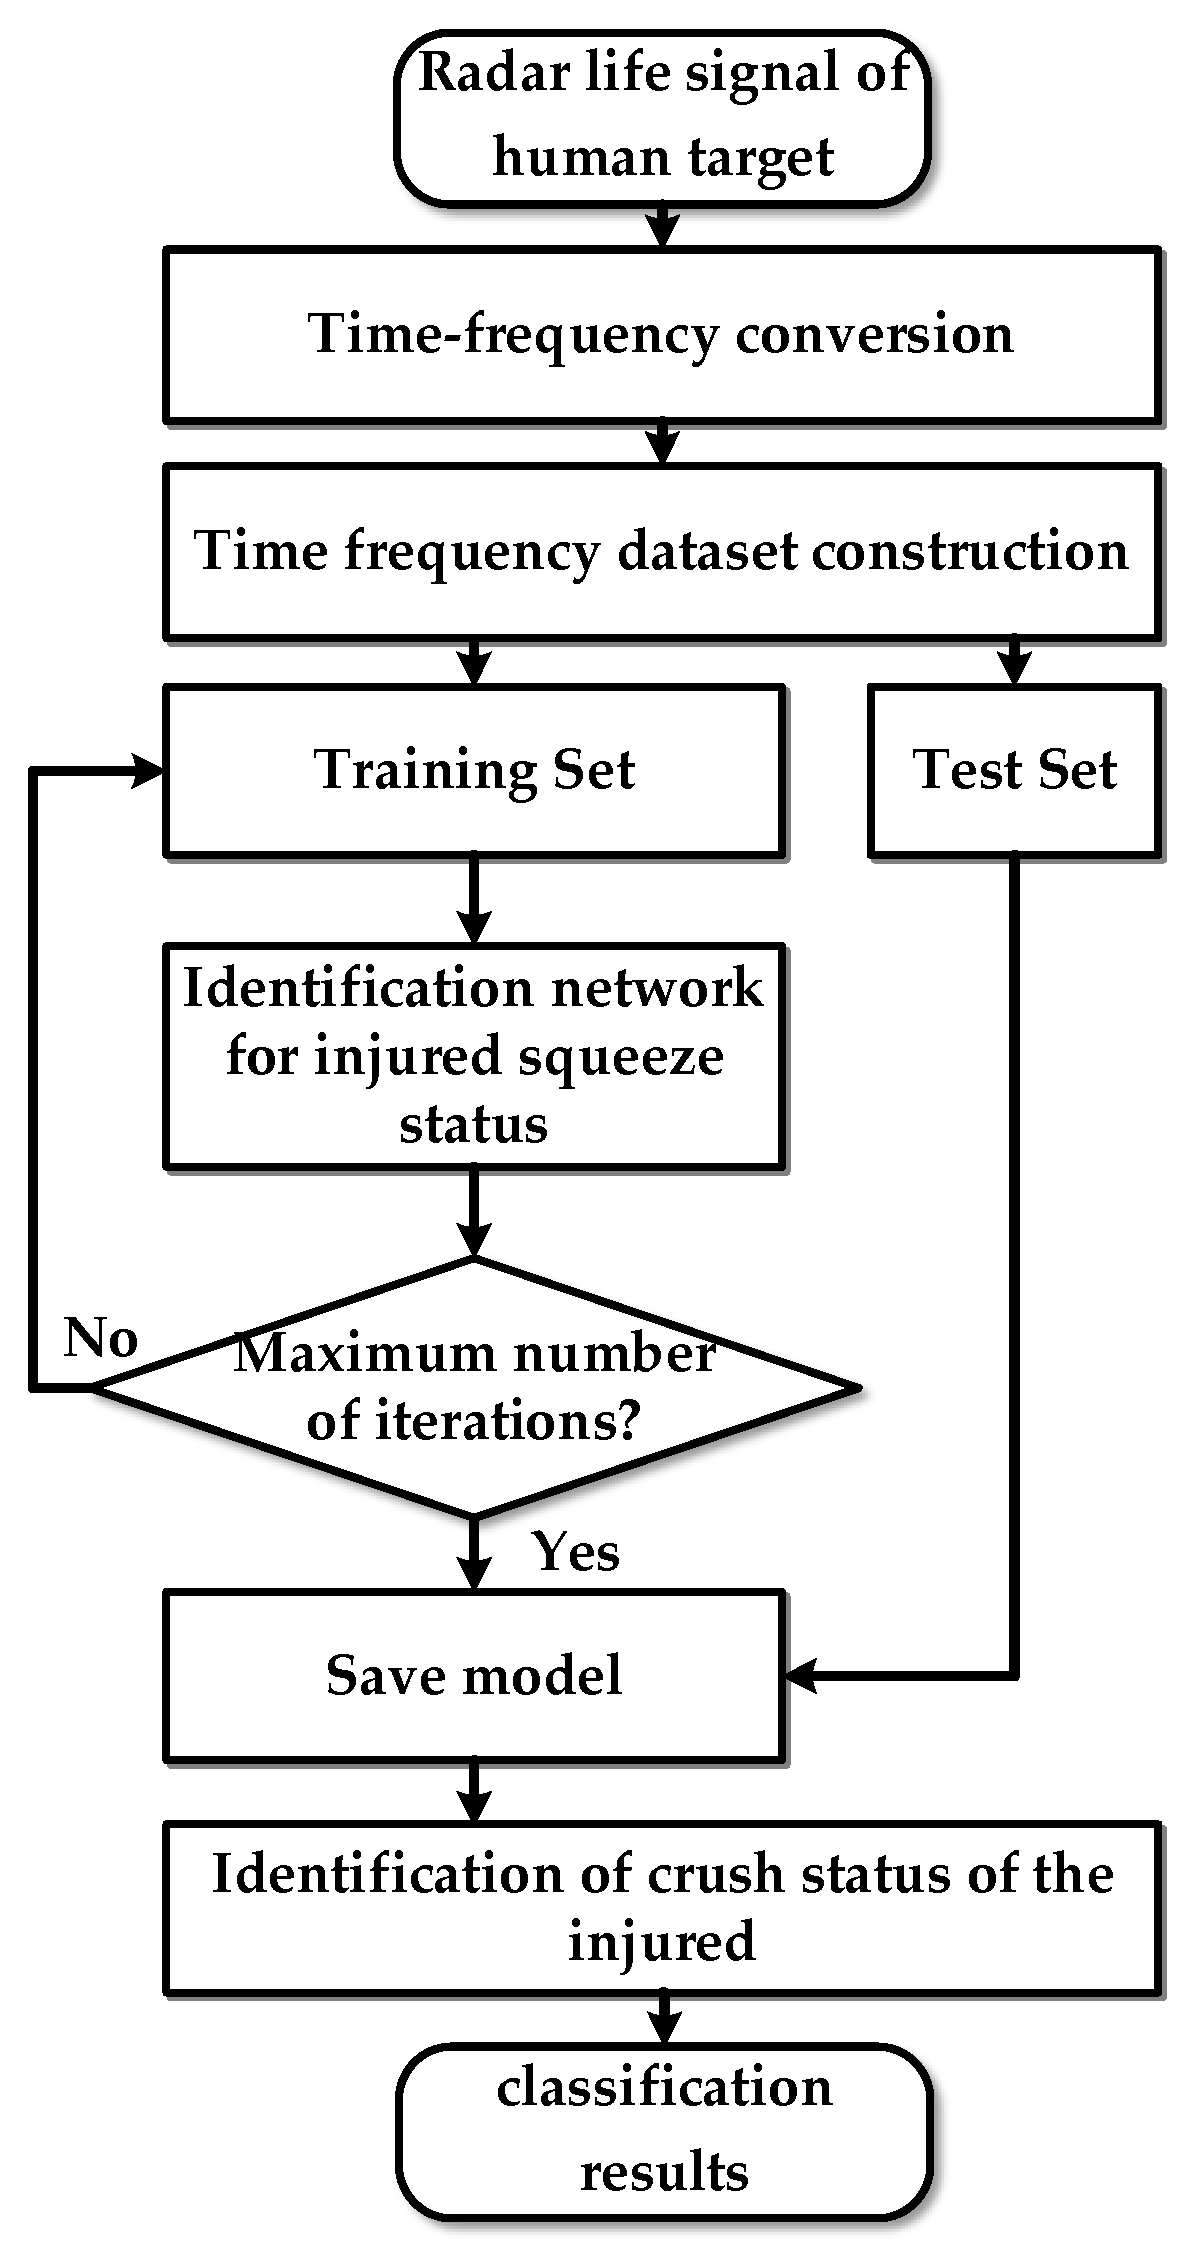
3.2. Identification of the Compression State of the Injured
3.2.1. Building the Radar Life Signal Time-Frequency Dataset
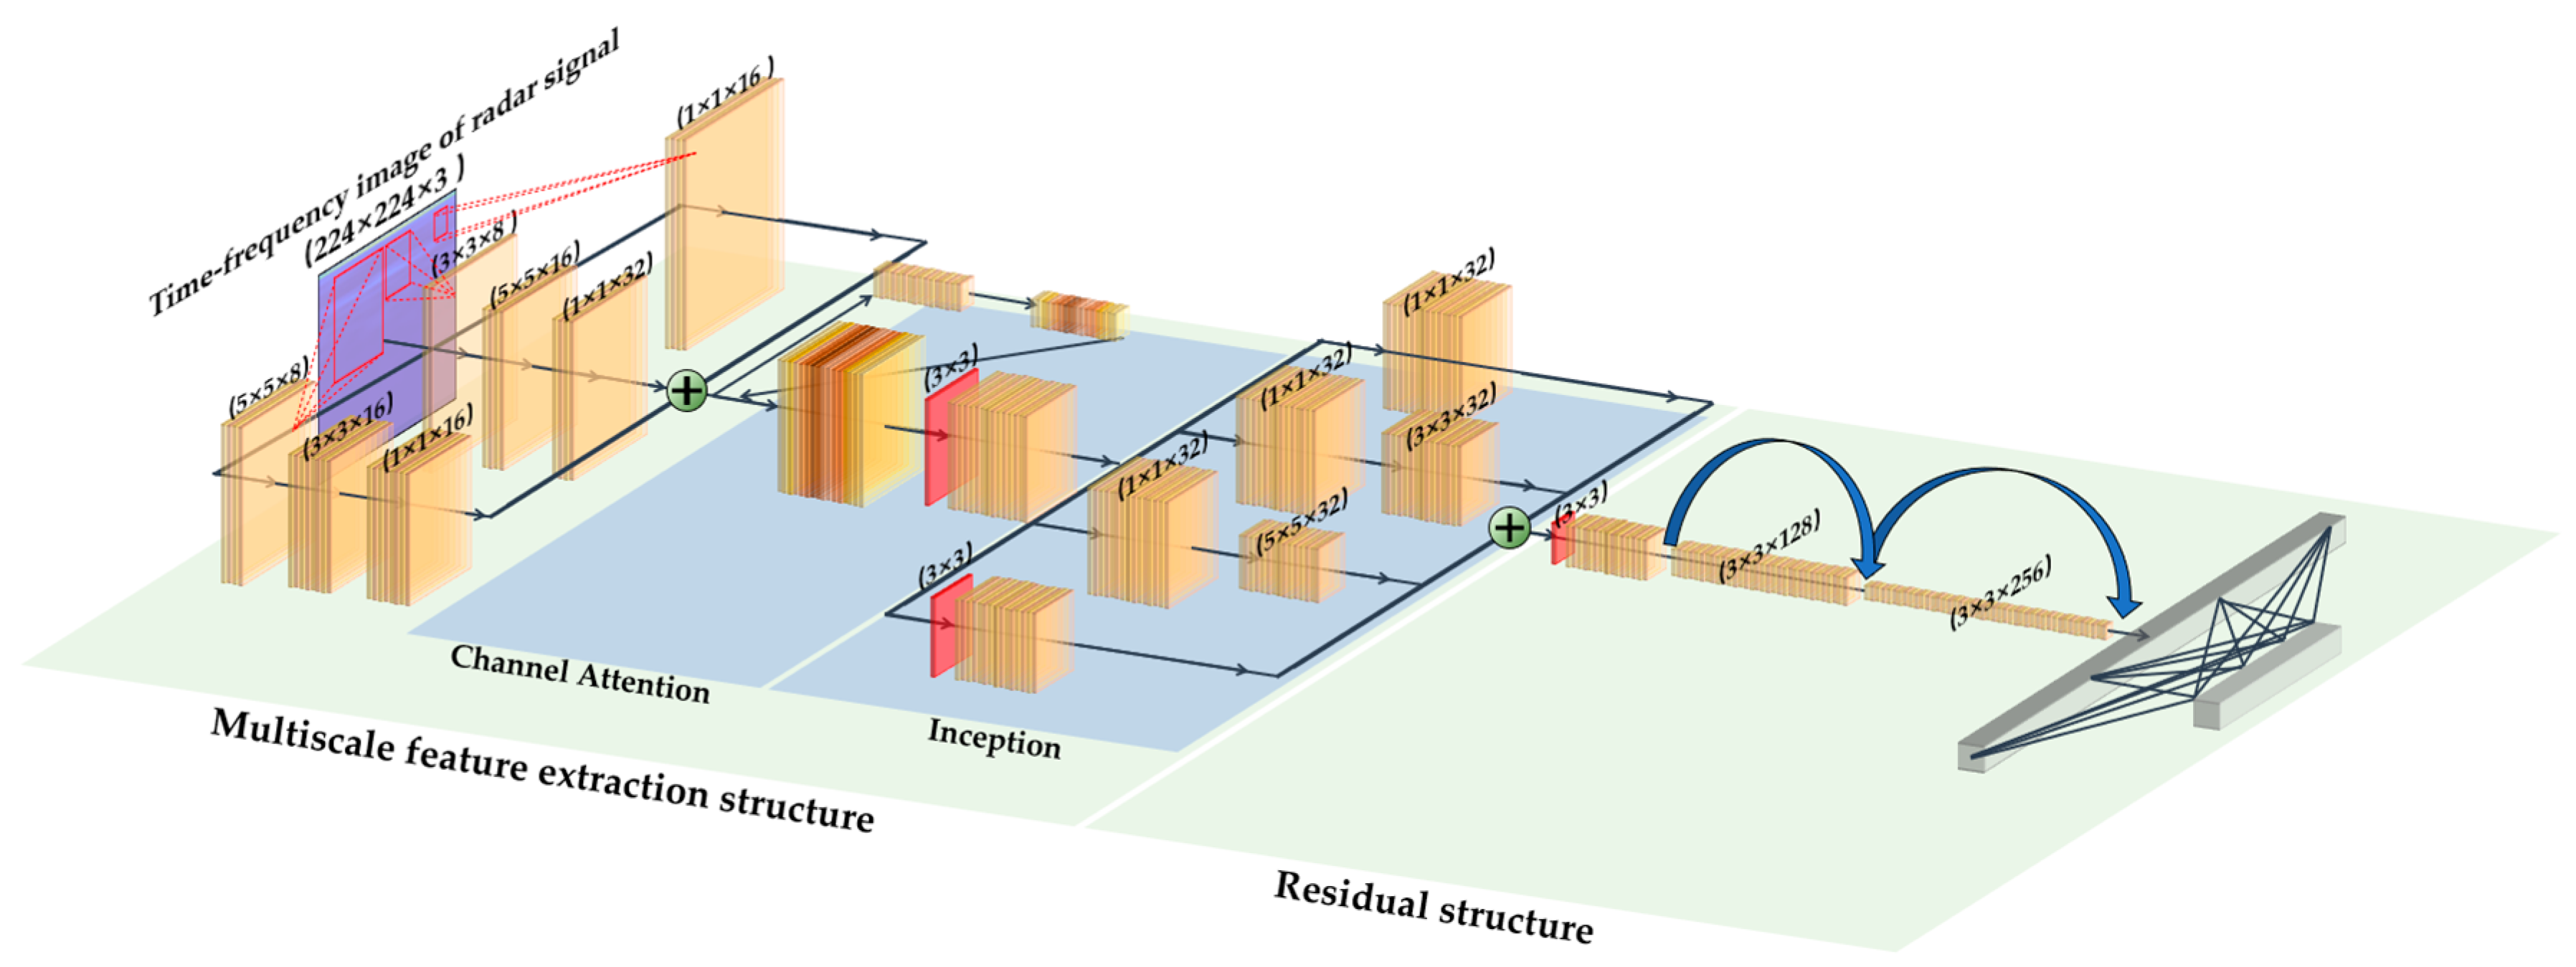
3.2.2. Establishment of the Compression State Identifying Network
4. Experiment Results
4.1. Experiment on Reconstructing Human Life Signals
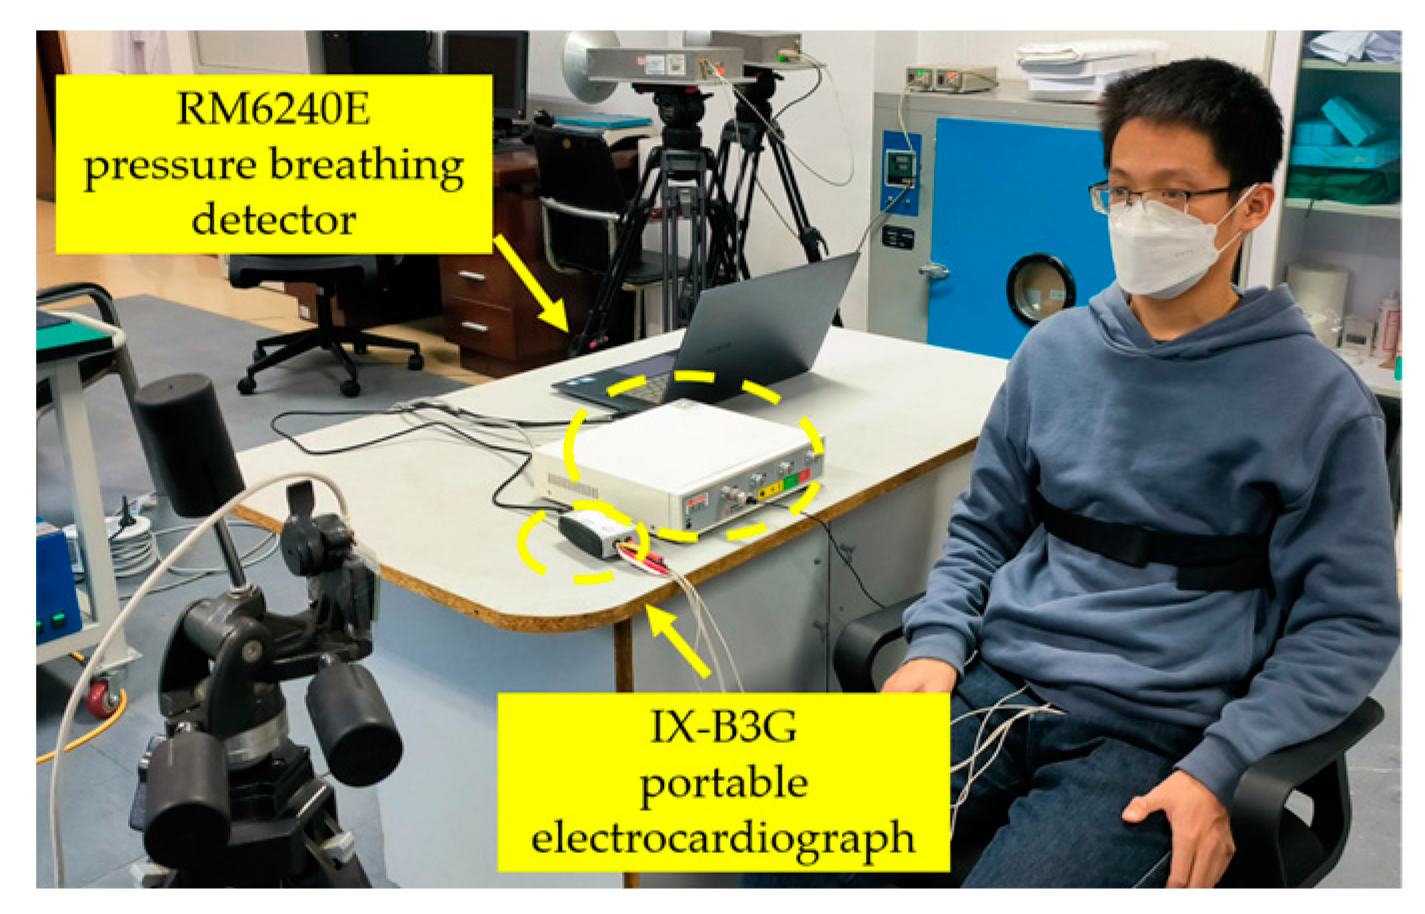
4.1.1. Indoor Free Space Detection Experiment
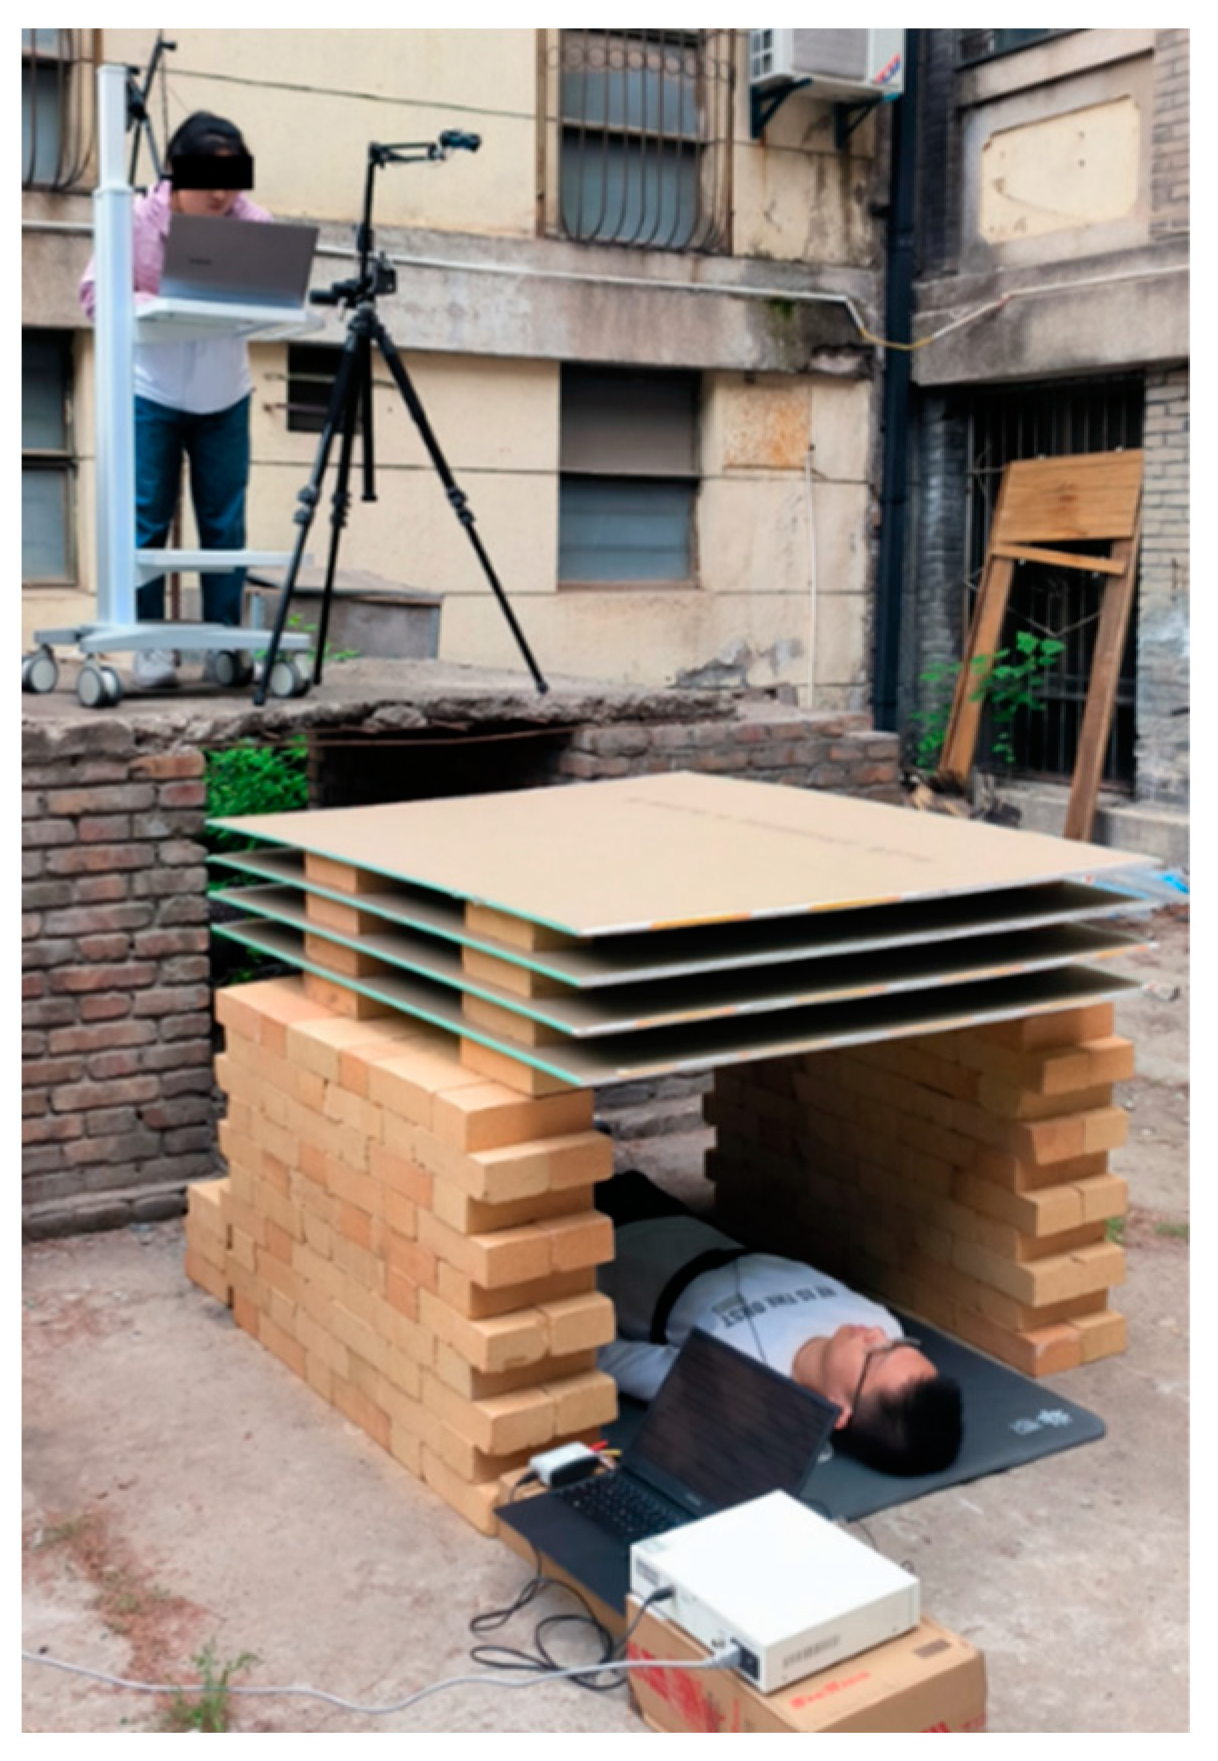
4.1.2. Outdoor Obstacle Barrier Scenario Detection Experiment
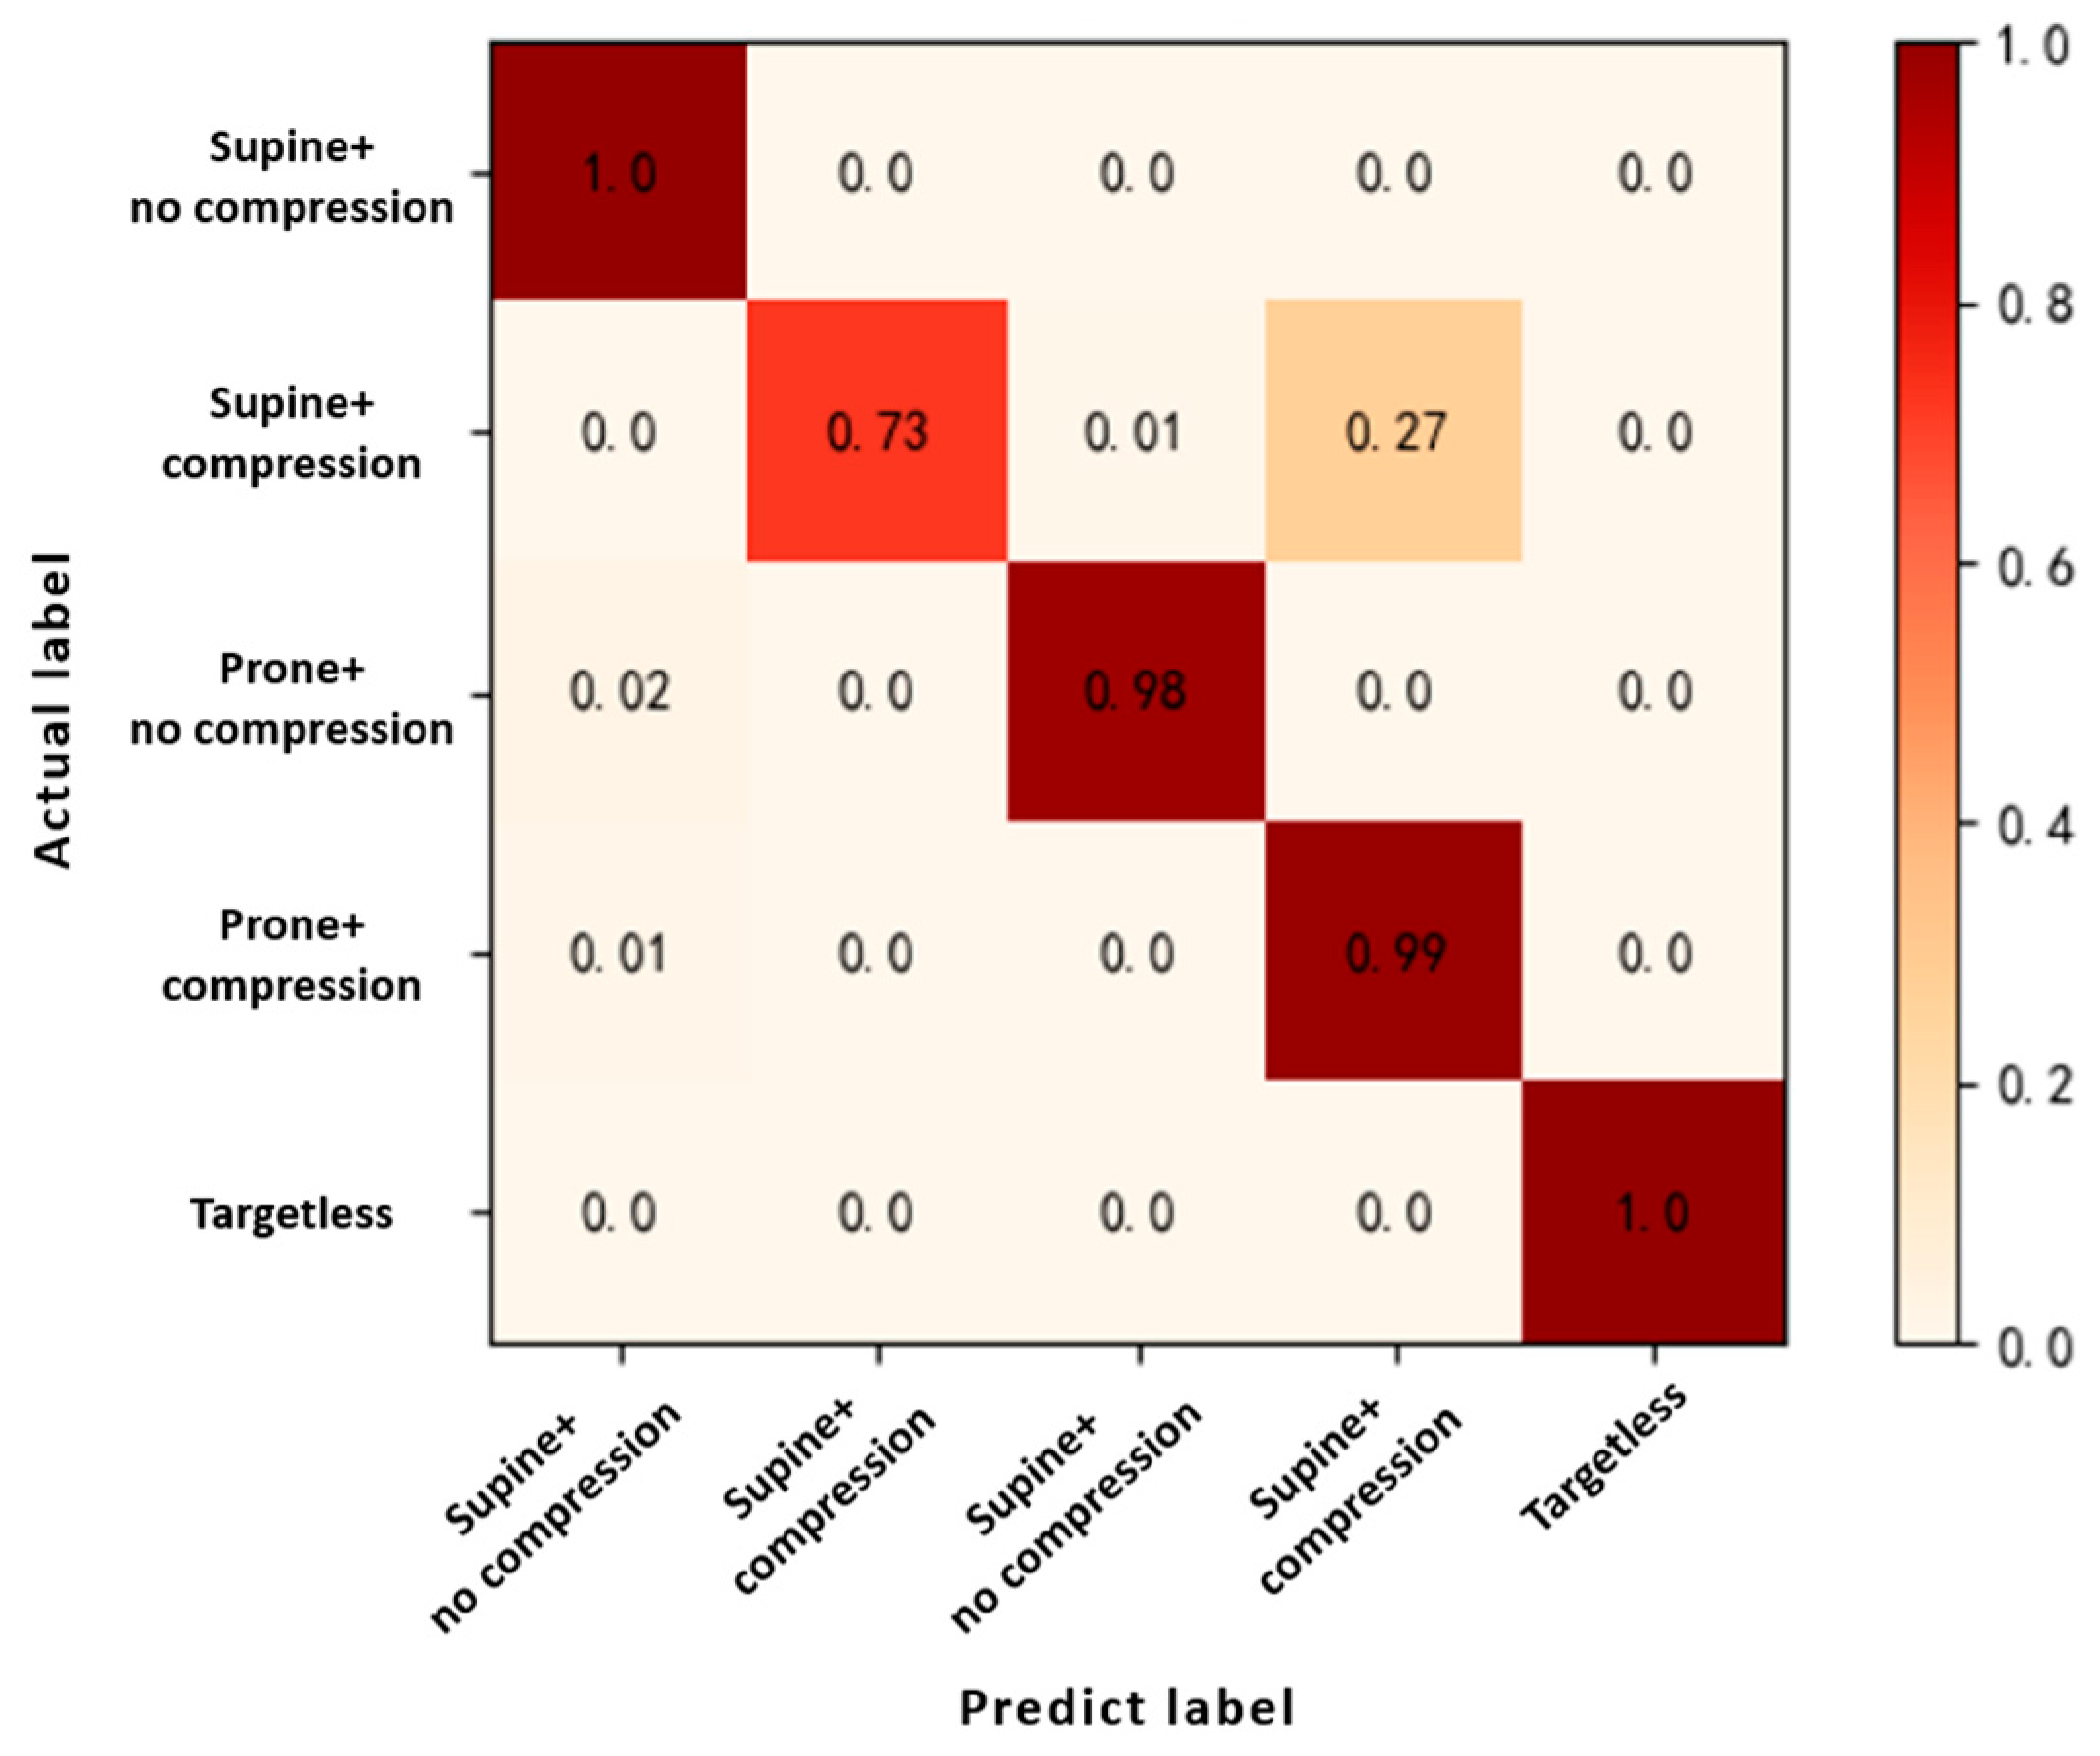
4.2. Compression State Identification Experiment
5. Discussion
6. Conclusions
Author Contributions
Funding
Institutional Review Board Statement
Informed Consent Statement
Data Availability Statement
Conflicts of Interest
References
- Bihan, T. Investigation on Occurrence Rule of Earthquake Casualties and Survivors’ Physical and Mental Trauma. Ph.D. Thesis, Second Military Medical University, Shanghai, China, 2017. [Google Scholar]
- Daxi, J.; Honglang, X.; Leishi, L. Continuous Blood Purification and Non-Renal Diseases. Chin. Crit. Care Med. 2001, 13, 5–9. [Google Scholar]
- Matsuoka, T. Long-Term Physical Outcome of Patients Who Suffered Crush Syndrome: Prognostic Indicators. Prehosp. Disaster Med. Off. J. Natl Assoc. EMS Phys. World Assoc. Emerg. Disaster Med. Assoc. Acute Care Found. 2002, 17, 26. [Google Scholar] [CrossRef] [Green Version]
- Lei, S.; Fansu, M. Pathophysiology and Diagnosis and Treatment of Rhabdomyolysis. Chin. J. Emerg. Med. 2007, 16, 1231–1232. [Google Scholar]
- Zhang, Y.; Zhang, Y.; Liang, F.-L.; Li, Z.; Lyu, H.; Xue, H.-J.; Zhang, H.; Wang, J.-Q. Rescue and Treatment of Post-Earthquake Crush Syndrome and Acute Renal Failure—Wenchuan Earthquake Special Report. Chin. J. Pract. Intern. Med. 2008, 28, 598–600. [Google Scholar]
- Vanholder, R.; Sever, M.S.; Erek, E.; Lameire, N. Acute Renal Failure Related to The Crush Syndrome: Towards An Era of Seismo-Nephrology? Nephrol. Dial. Transplant. 2000, 15, 1517–1521. [Google Scholar] [CrossRef] [PubMed] [Green Version]
- Haugg, F.; Elgendi, M.; Menon, C. Effectiveness of Remote PPG Construction Methods: A Preliminary Analysis. Bioengineering 2022, 9, 485. [Google Scholar] [CrossRef]
- Dingyang, W.; Yoo, S.; Cho, S.H. Experimental Comparison of IR-UWB Radar and FMCW Radar for Vital Signs. Sensors 2020, 20, 6695. [Google Scholar]
- Lenz, I.; Rong, Y.; Bliss, D. Contactless Stethoscope Enabled by Radar Technology. Bioengineering 2023, 10, 169. [Google Scholar] [CrossRef] [PubMed]
- Yang, Z.; Hao, L.; Fulai, L., etc. Status and Application Prospect of Noncontact Detection Technology for Injury Conditions of Wounded. Chin. Med. Equip. J. 2019, 40, 99–103. [Google Scholar]
- Zhang, Y.; Yu, X.; Hao, L.; Li, Z.; Lu, G.-H.; Li, S.; Wang, J.Q.; Jiao, T. Design and Implementation of Radar System for Pneumothorax Detection. Chin. Med. Equip. J. 2015, 36, 18–20. [Google Scholar]
- Zhang, Y.; Zhang, Y.; Liang, F.L.; Li, Z.; Lv, H.; Xue, H.J.; Zhang, H.; Wang, J.Q. Research of Multi-Target Identification Method Using Mono-Static Life Detection Radar. Chin. Med. Equip. J. 2018, 39, 1–4, 9. [Google Scholar]
- Cazzorla, A.; De Angelis, G.; Moschitta, A.; Dionigi, M.; Alimenti, F.; Carbone, P. A 5.6-GHz UWB Position Measurement System. IEEE Trans. Instrum. Meas. 2013, 62, 675–683. [Google Scholar] [CrossRef]
- Jimenez Ruiz, A.R.; Seco Granja, F. Comparing Ubisense, BeSpoon, and DecaWave UWB Location Systems: Indoor Performance Analysis. IEEE Trans. Instrum. Meas. 2017, 66, 2106–2117. [Google Scholar] [CrossRef]
- Levitas, B.; Matuzas, J. UWB Radar for Human Being Detection Behind the Wall. In Proceedings of the IEEE International Radar Symposium, Krakow, Poland, 24–26 May 2006. [Google Scholar]
- Ma, Y.; Liang, F.; Wang, P.; Lv, H.; Yu, X.; Zhang, Y.; Wang, J. An Accurate Method to Distinguish Between Stationary Human and Dog Targets Under Through-Wall Condition Using UWB Radar. Remote Sens. 2019, 11, 2571. [Google Scholar] [CrossRef] [Green Version]
- Wang, Y.; Yu, X.; Zhang, Y.; Lv, H.; Jiao, T.; Lu, G.; Li, W.Z.; Li, Z.; Jing, X.; Wang, J. Using Wavelet Entropy to Distinguish Between Humans and Dogs Detected by UWB Radar. Prog. Electromagn. Res. 2013, 139, 335–352. [Google Scholar] [CrossRef] [Green Version]
- Caro, C.G.; Bloice, J.A. Contractless Apna Detector Based on Radar. Lancet. 1971, 2, 959–961. [Google Scholar] [CrossRef] [PubMed]
- Lanbo, L.; Zijian, L.; Barrowes, B.E. Through-Wall Bio-Radiolocation with UWB Impulse Radar: Observation, Simulation and Signal Extraction. IEEE J. Sel. Top. Appl. Earth Obs. Remote Sensing. 2011, 4, 791–798. [Google Scholar]
- Yang, Z.; Teng, J.; Hao, L.; Li, S.; Li, C.; Lu, G.; Yu, X.; Li, Z.; Wang, J. An Interference Suppression Technique for Life Detection Using 5.75- and 35-GHz Dual-Frequency Continuous-Wave Radar. IEEE Geosci. Remote Sens. Lett. 2015, 12, 482–486. [Google Scholar] [CrossRef]
- Shiyou, W.; Siqi, Y.; Wei, L.; Tan, K.; Xia, Z.; Meng, S.; Chen, J.; Fang, G.; Yin, H. Study on A Novel UWB Linear Array Human Respiration Model and Detection Method. IEEE J. Sel. Top. Appl. Earth Obs. Remote Sens. 2016, 9, 125–140. [Google Scholar]
- Jiaming, Y. Research on Human Identification Theory and Technology Based on Noncontact Vital Sign Detection Radar. Ph.D. Thesis, Nanjing University of Science and Technology, Hefei, China, 2020. [Google Scholar]
- Yin, Y.; Yu, X.; Lv, H.; Liu, M.; Qi, F.; Wang, J. etc. Micro-Vibration Identification Between Humans and Animals Based on HHT and Frequency Energy Ratio Features Using UWB Radar. China Med. Devices 2021, 36, 26–30+58. [Google Scholar]
- Bugaev, A.S.; Chapursky, V.V.; Ivashov, S.I.; Razevig, V.V.; Sheyko, A.P.; Vasilyev, I.A. Through wall sensing of human breathing and heart beating by monochromatic radar. In Proceedings of the Tenth International Conference on Grounds Penetrating Radar, 2004. GPR 2004, Delft, The Netherlands, 21–24 June 2004; pp. 291–294. [Google Scholar]
- Lv, H.; Qi, F.; Zhang, Y.; Jiao, T.; Liang, F.; Li, Z.; Wang, J. Improved Detection of Human Respiration Using Data Fusion Based on a Multistatic UWB Radar. Remote Sens. 2016, 8, 773. [Google Scholar] [CrossRef] [Green Version]
- Kim, D. Performance of UWB Wireless Telecommunication Positioning for Disaster Relief Communication Environment Securing. Sustainability 2018, 10, 3857. [Google Scholar] [CrossRef] [Green Version]
- Kim, D.-Y.; Cho, S.-Y.; Lee, K.; Sohn, C.-B. A Study of Projection-Based Attentive Spatial–Temporal Map for Remote Photoplethysmography Measurement. Bioengineering 2022, 9, 638. [Google Scholar] [CrossRef] [PubMed]


| Network Module | Hierarchy | Network Parameters | |||
|---|---|---|---|---|---|
| Number of Input Channels | Number of Output Channels | Kernel Size | Step | ||
| Multiscale feature extraction | Convolution | 3 | 16 | (1 × 1) | 1 × 1 |
| Convolution | 3 | 32 | (3 × 3) (5 × 5) (1 × 1) | 1 × 1 | |
| Convolution | 3 | 16 | (5 × 5) (3 × 3) (1 × 1) | 1 × 1 | |
| Channel attention mechanism | Pooling | ~ | ~ | (3 × 3) | 2 × 2 |
| Inception-Resnet | Convolution | 32 | 32 | (1 × 1) | 1 × 1 |
| Convolution | 32 | 32 | (1 × 1) (3 × 3) | 1 × 1 | |
| Convolution | 32 | 32 | (1 × 1) (5 × 5) | 1 × 1 | |
| Pooling | ~ | ~ | (3 × 3) (1 × 1) | 2 × 2 | |
| Convolution | 32 | 128 | (3 × 3) | 1 × 1 | |
| Convolution | 128 | 256 | (3 × 3) | 1 × 1 | |
| Pooling | ~ | ~ | (3 × 3) | 2 × 2 | |
| Compression | No Compression | |
|---|---|---|
| Supine | Under compression in a supine state | Not compressed in a supine state |
| Prone | Under compression in a prone position | Not compressed in a prone position |
| Squeeze State Type | Number of Training Set Samples | Number of Test Set Samples |
|---|---|---|
| Supine + no compression | 720 | 180 |
| Supine + compression | 720 | 180 |
| Prone + no compression | 720 | 180 |
| Prone + compression | 720 | 180 |
| Targetless control group | 240 | 60 |
| total | 3120 | 780 |
| Control Group (No-Target) | Supine | Prone | |||
|---|---|---|---|---|---|
| No Compression | Compression | No Compression | Compression | ||
| Recall | 1.000 | 1.000 | 0.726 | 0.977 | 0.988 |
| Precision | 1.000 | 0.966 | 1.000 | 0.994 | 0.773 |
| Accuracy | 0.9278 | ||||
| Macro-F1 | 0.9422 | ||||
Disclaimer/Publisher’s Note: The statements, opinions and data contained in all publications are solely those of the individual author(s) and contributor(s) and not of MDPI and/or the editor(s). MDPI and/or the editor(s) disclaim responsibility for any injury to people or property resulting from any ideas, methods, instructions or products referred to in the content. |
© 2023 by the authors. Licensee MDPI, Basel, Switzerland. This article is an open access article distributed under the terms and conditions of the Creative Commons Attribution (CC BY) license (https://creativecommons.org/licenses/by/4.0/).
Share and Cite
Shi, D.; Liang, F.; Qiao, J.; Wang, Y.; Zhu, Y.; Lv, H.; Yu, X.; Jiao, T.; Liao, F.; Yan, K.; et al. A Novel Non-Contact Detection and Identification Method for the Post-Disaster Compression State of Injured Individuals Using UWB Bio-Radar. Bioengineering 2023, 10, 905. https://0-doi-org.brum.beds.ac.uk/10.3390/bioengineering10080905
Shi D, Liang F, Qiao J, Wang Y, Zhu Y, Lv H, Yu X, Jiao T, Liao F, Yan K, et al. A Novel Non-Contact Detection and Identification Method for the Post-Disaster Compression State of Injured Individuals Using UWB Bio-Radar. Bioengineering. 2023; 10(8):905. https://0-doi-org.brum.beds.ac.uk/10.3390/bioengineering10080905
Chicago/Turabian StyleShi, Ding, Fulai Liang, Jiahao Qiao, Yaru Wang, Yidan Zhu, Hao Lv, Xiao Yu, Teng Jiao, Fuyuan Liao, Keding Yan, and et al. 2023. "A Novel Non-Contact Detection and Identification Method for the Post-Disaster Compression State of Injured Individuals Using UWB Bio-Radar" Bioengineering 10, no. 8: 905. https://0-doi-org.brum.beds.ac.uk/10.3390/bioengineering10080905