
Radiation-Induced Alterations in Proliferation, Migration, and Adhesion in Lens Epithelial Cells and Implications for Cataract Development


Abstract
:1. Introduction
2. Materials and Methods
2.1. Cell Culture
2.2. Irradiation
2.3. Proliferation
2.4. Migration
2.5. Adhesion
2.6. Gene Expression
2.7. Statistical Analysis
3. Results
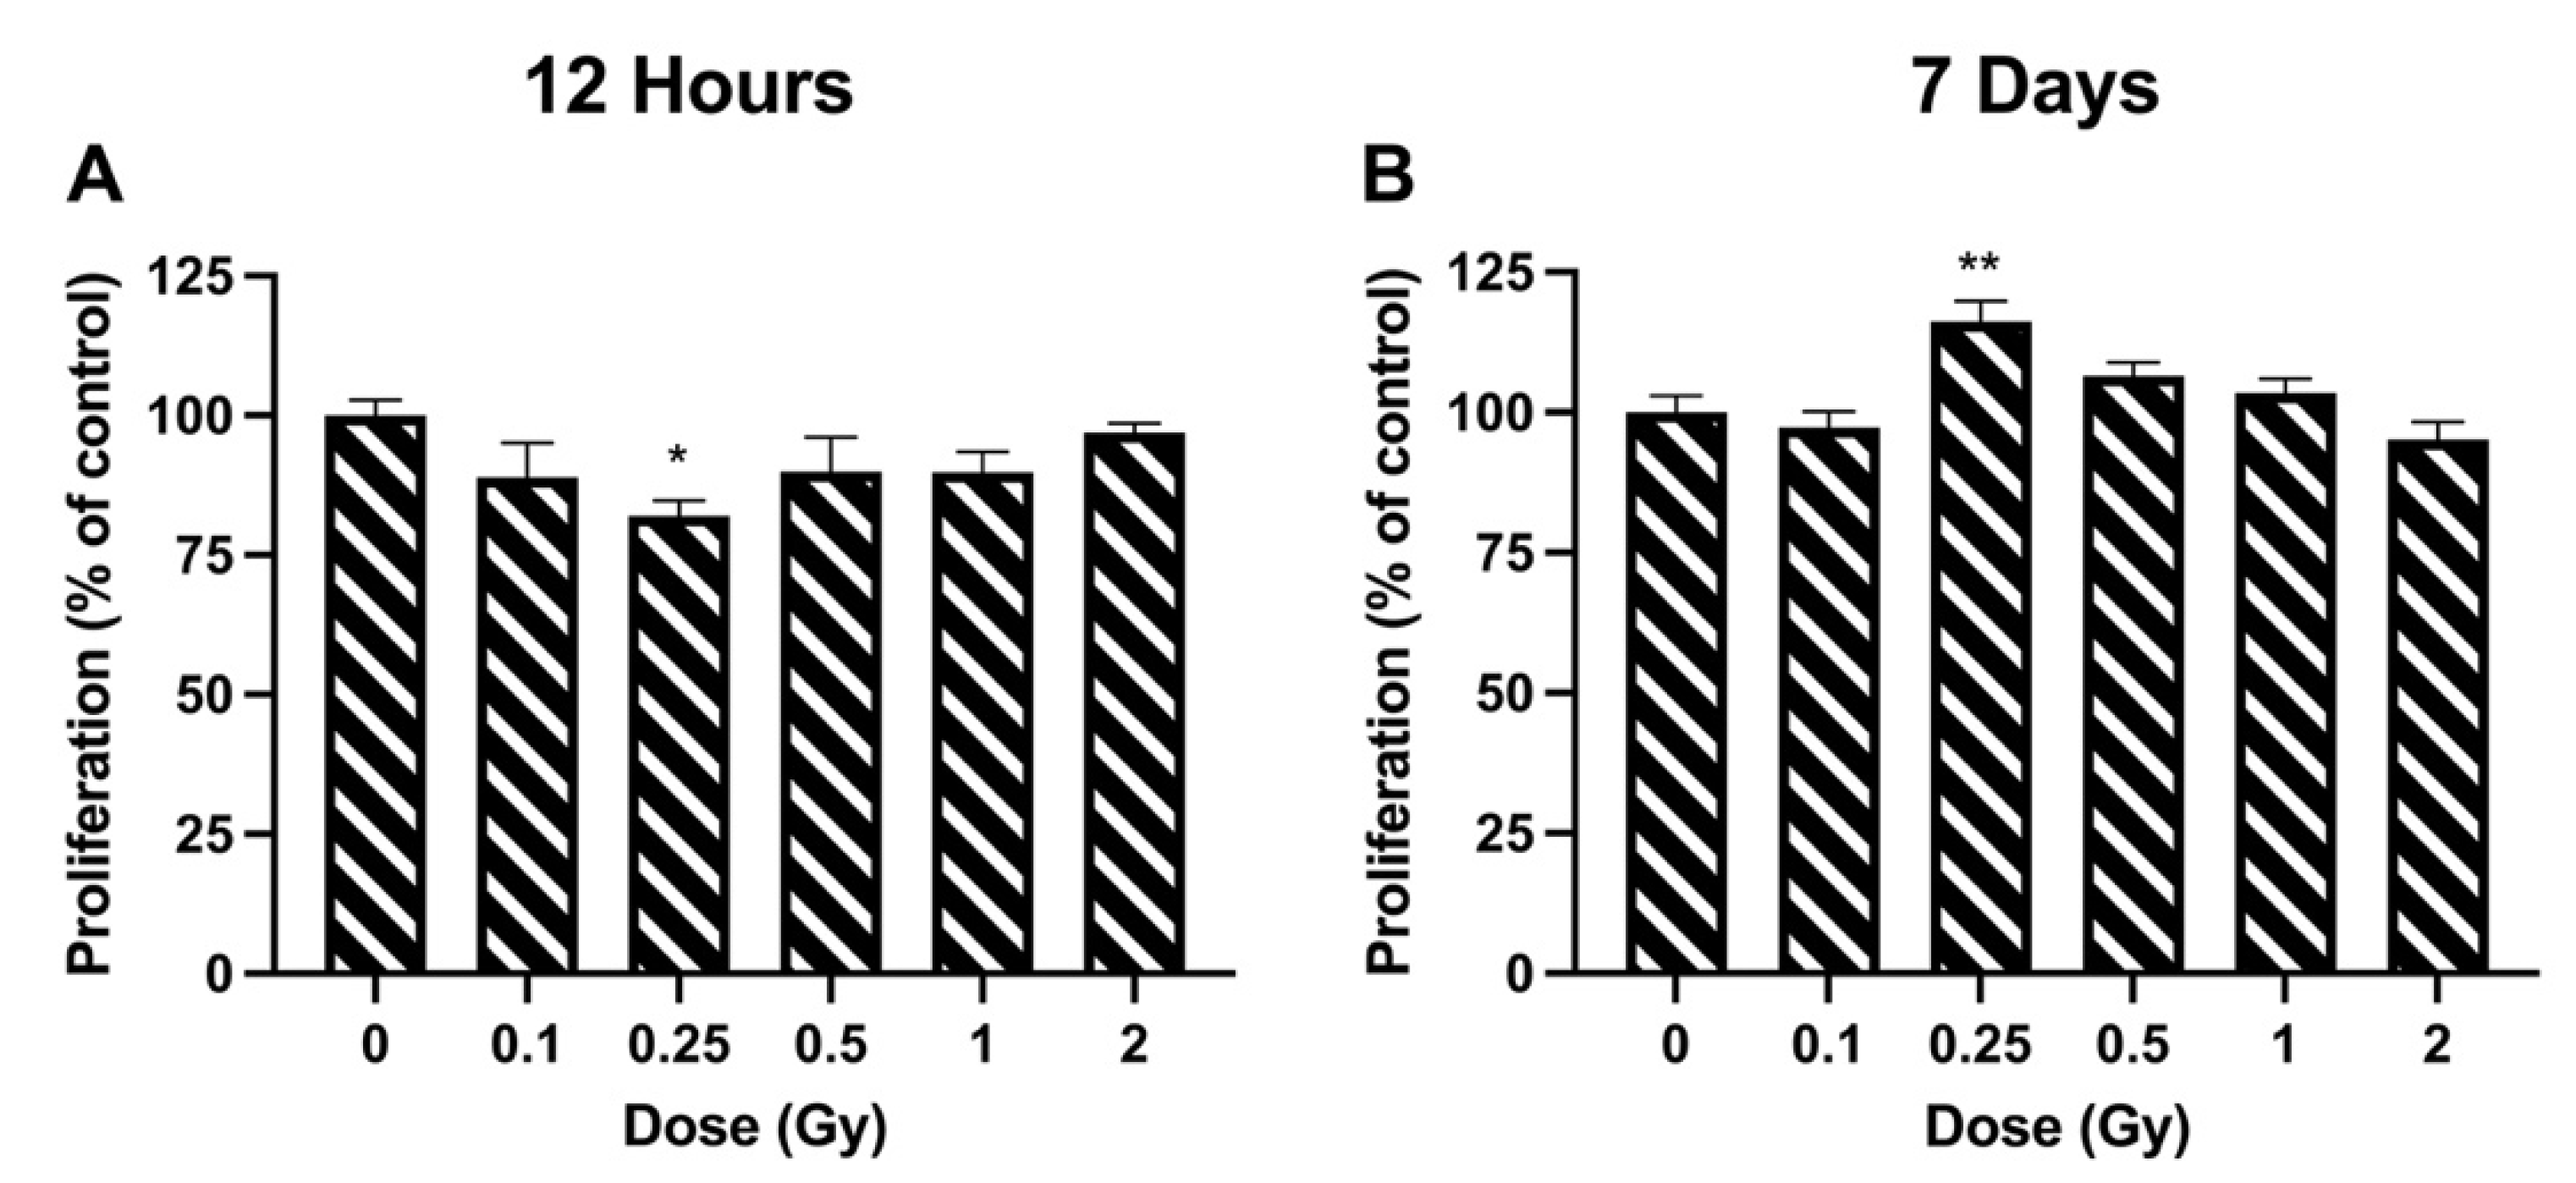
3.1. Proliferation
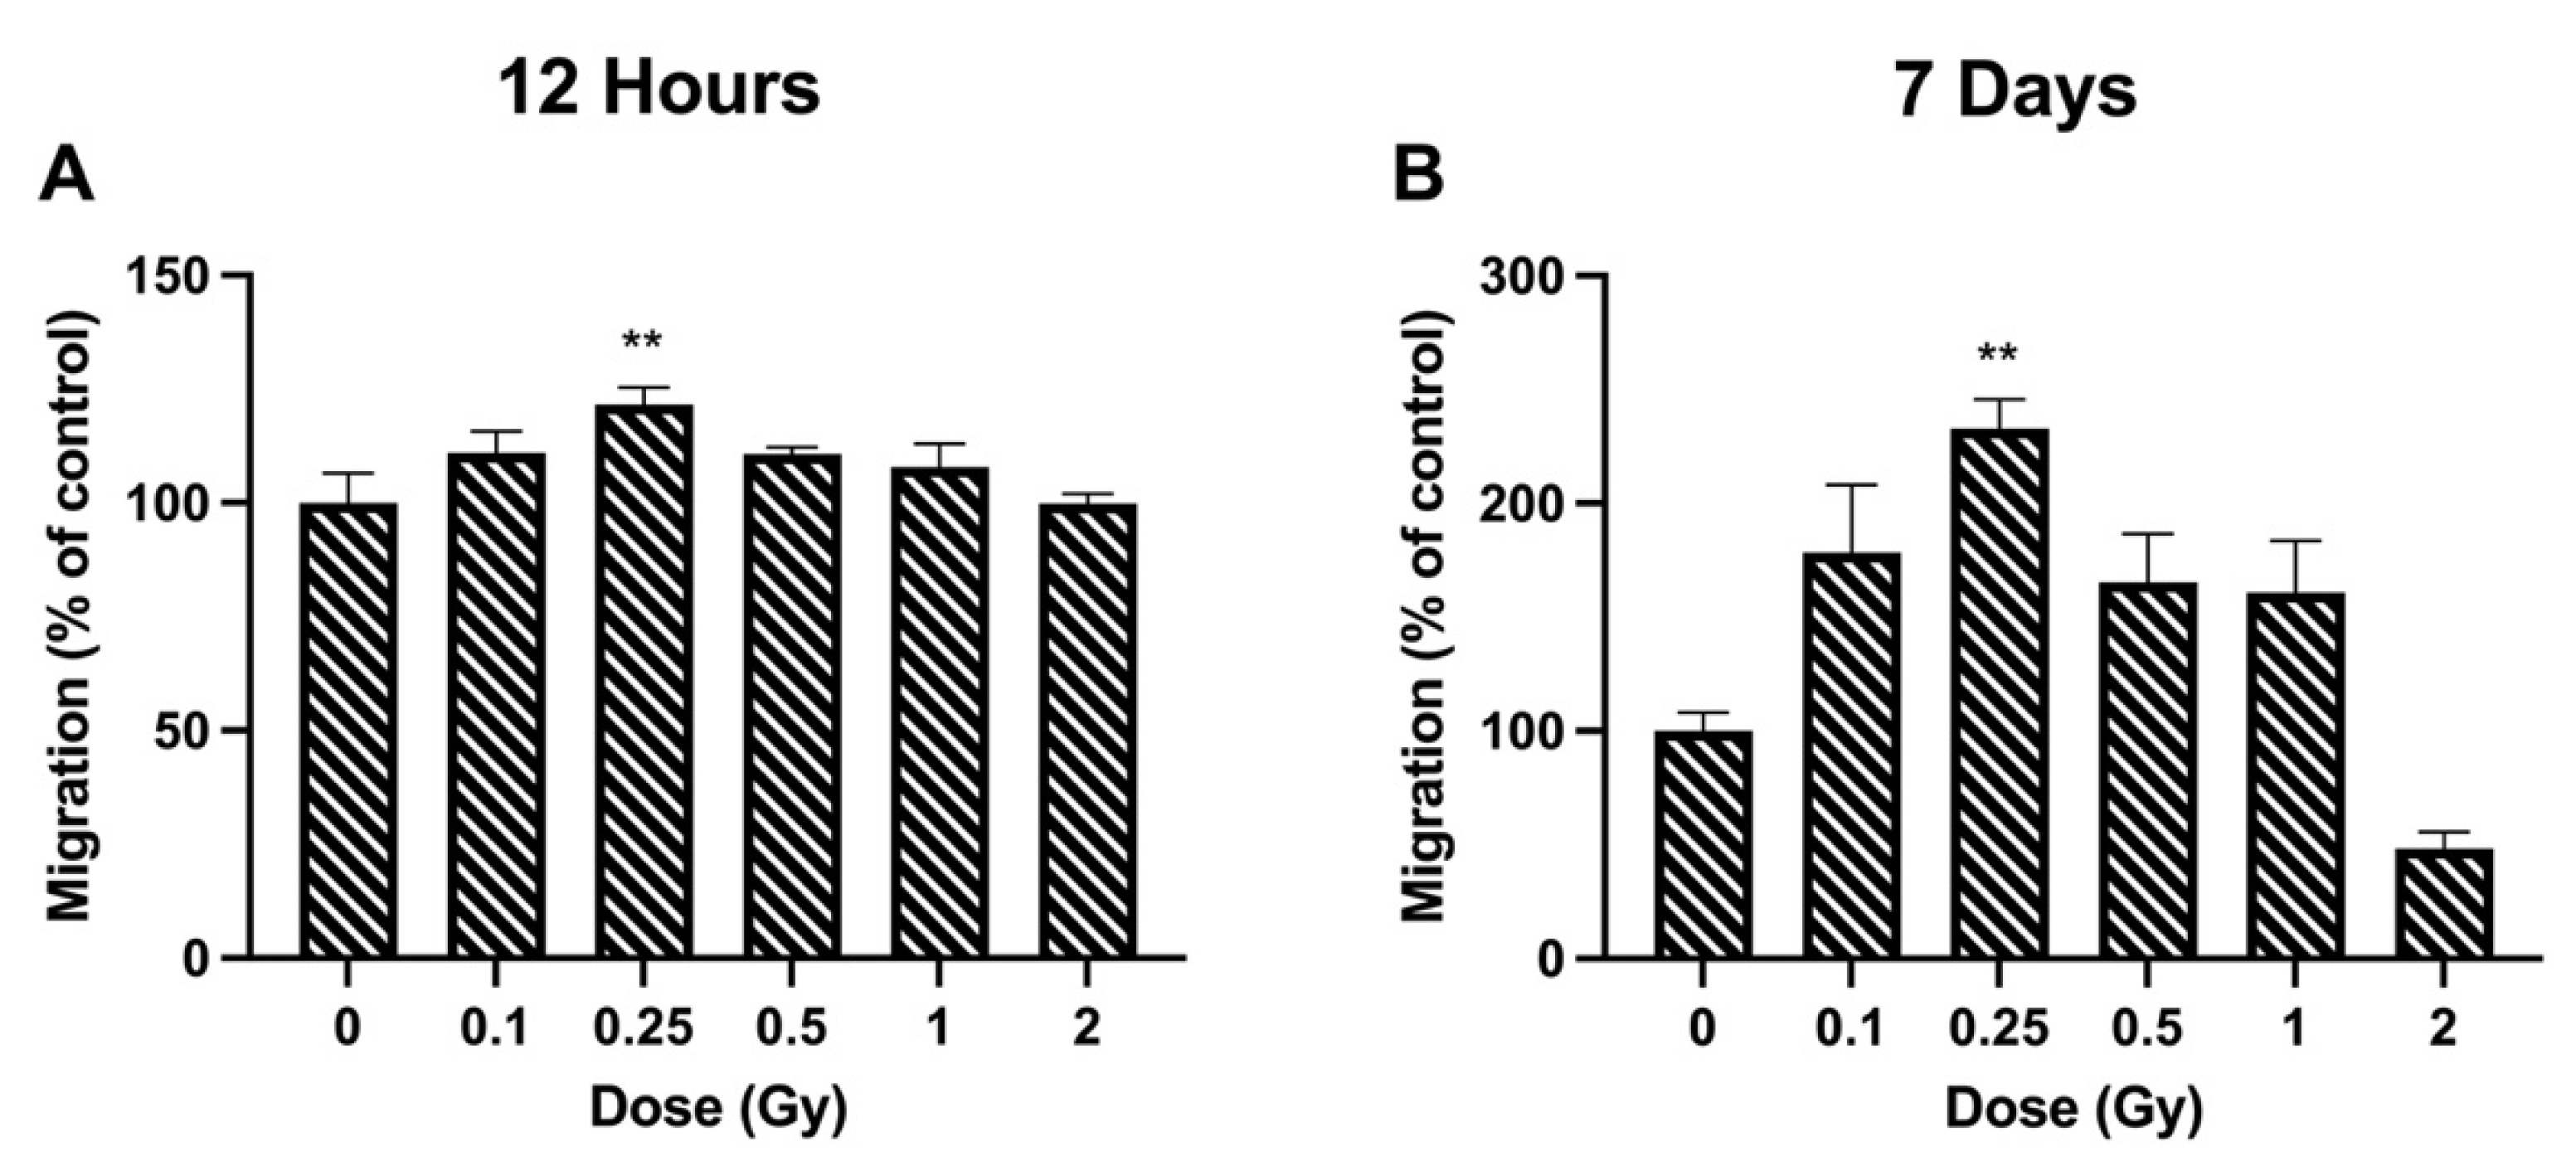
3.2. Migration
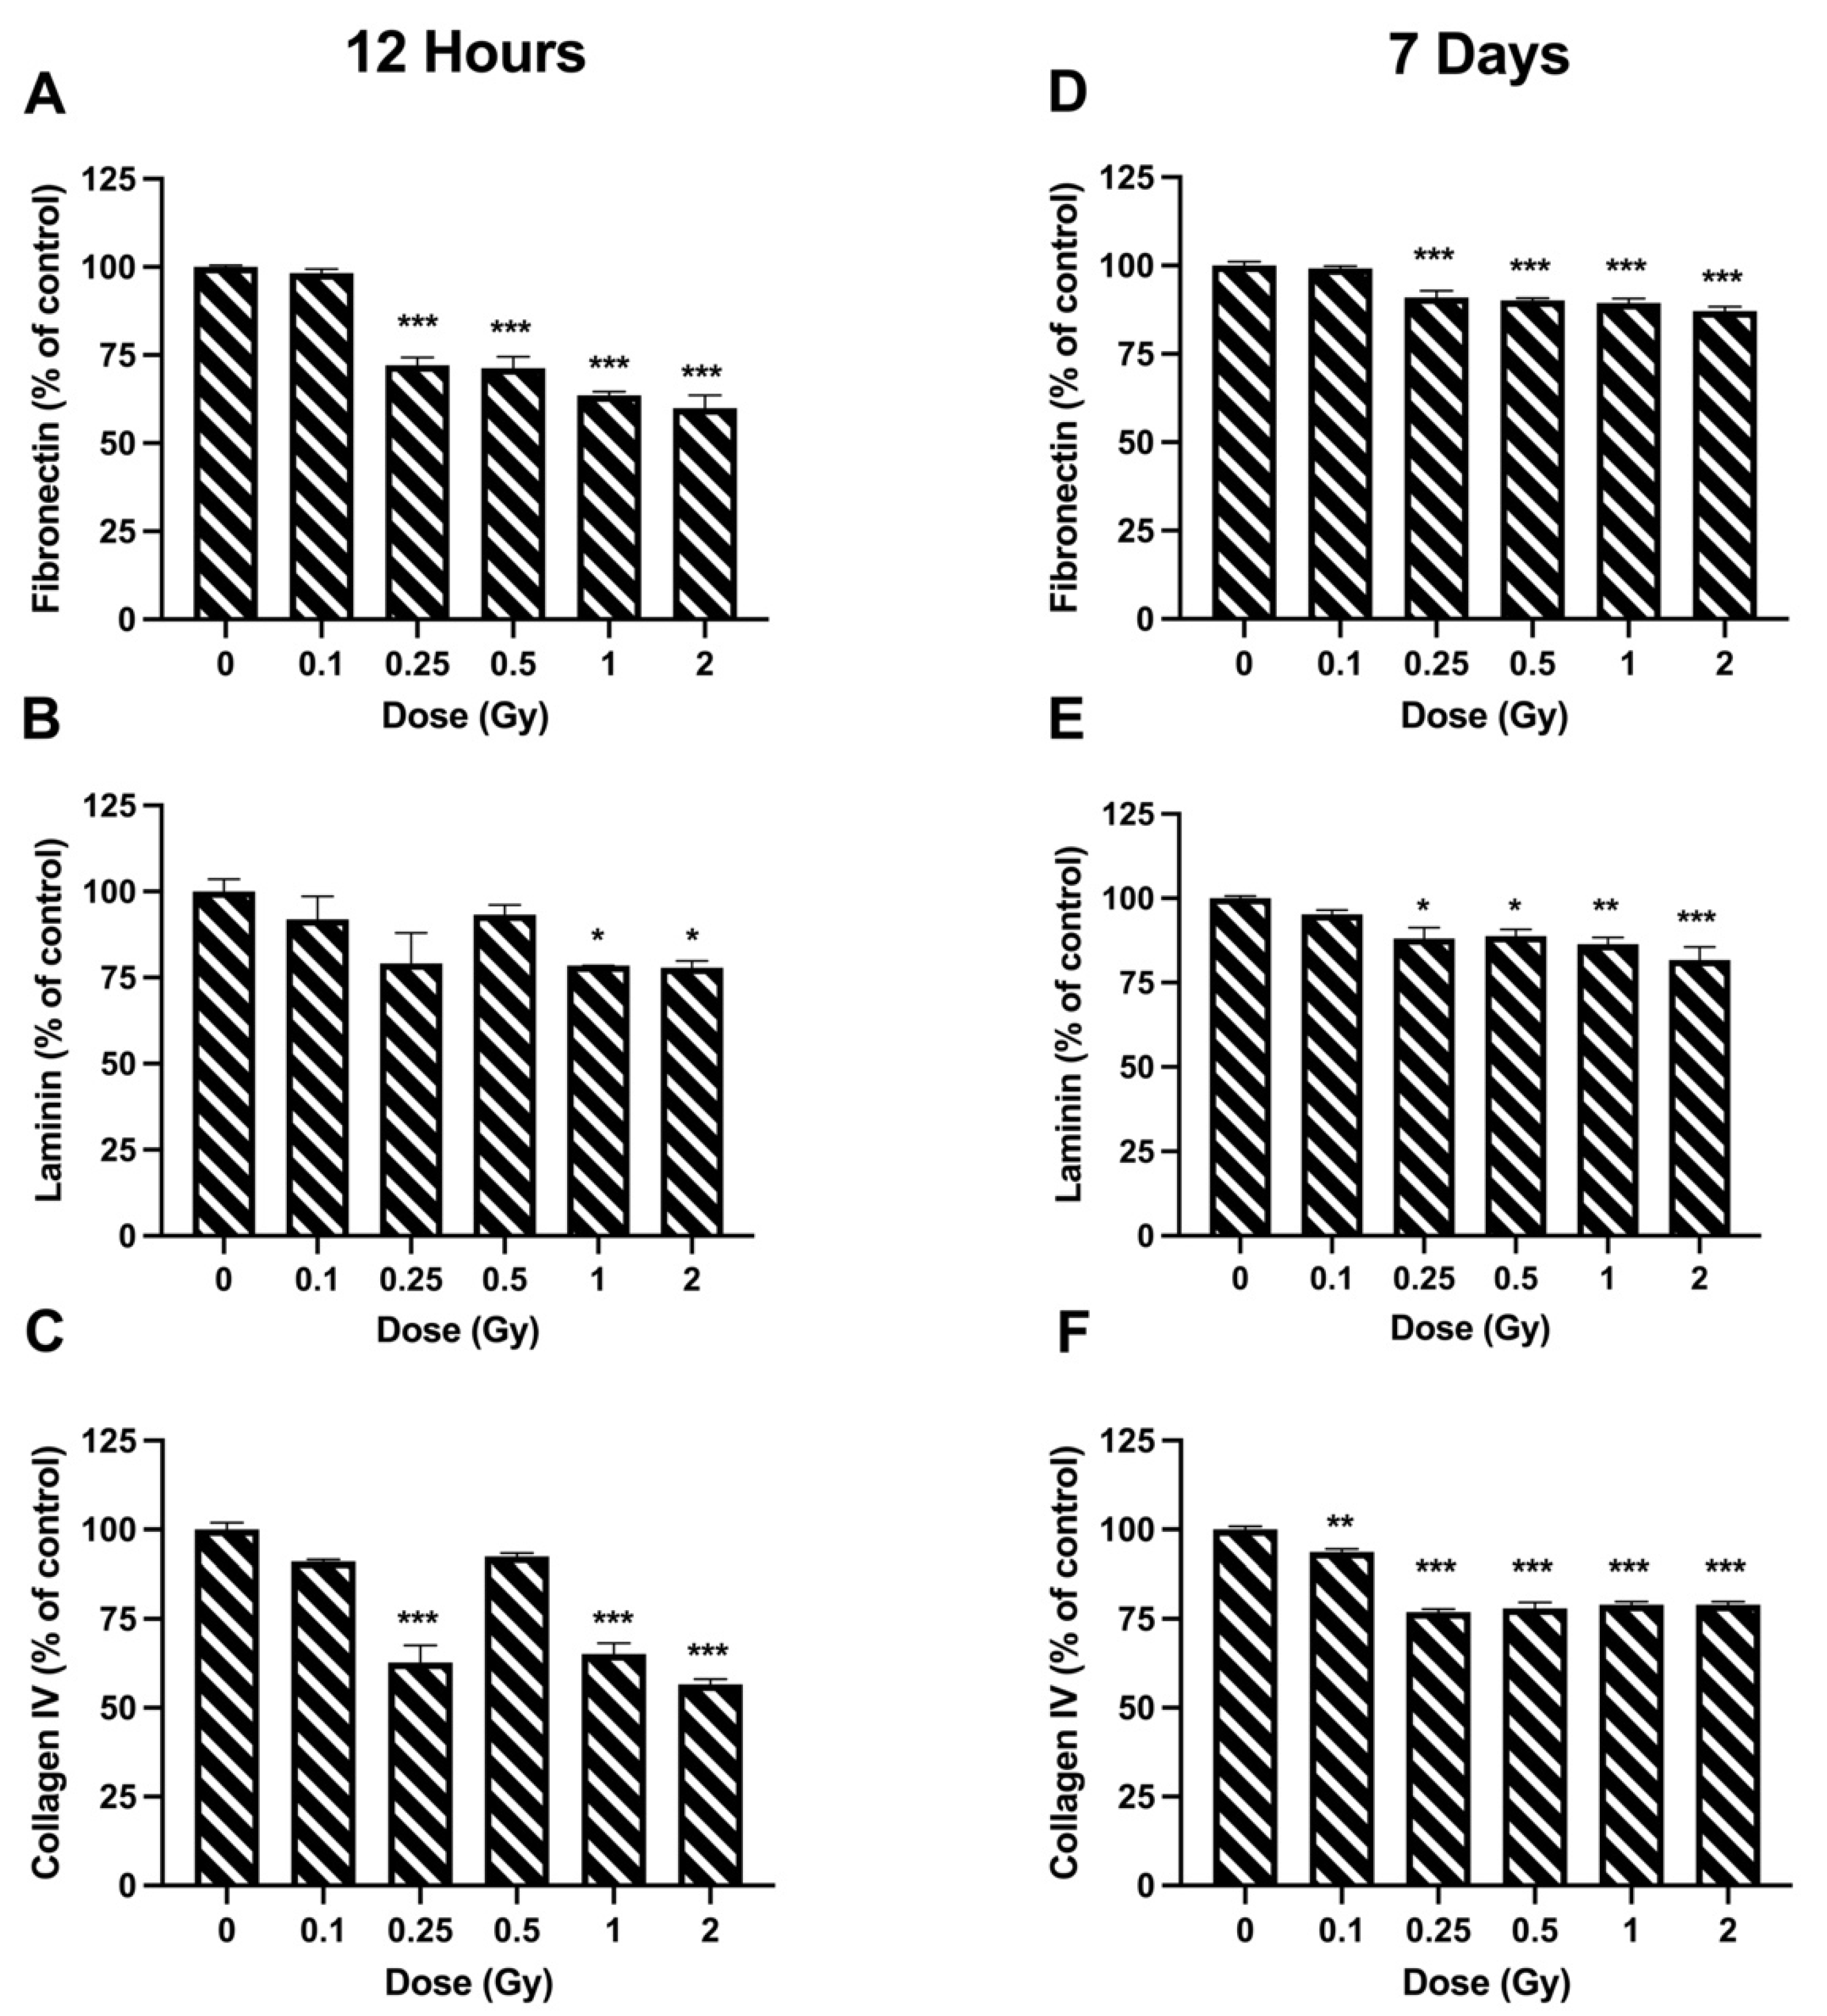
3.3. Adhesion
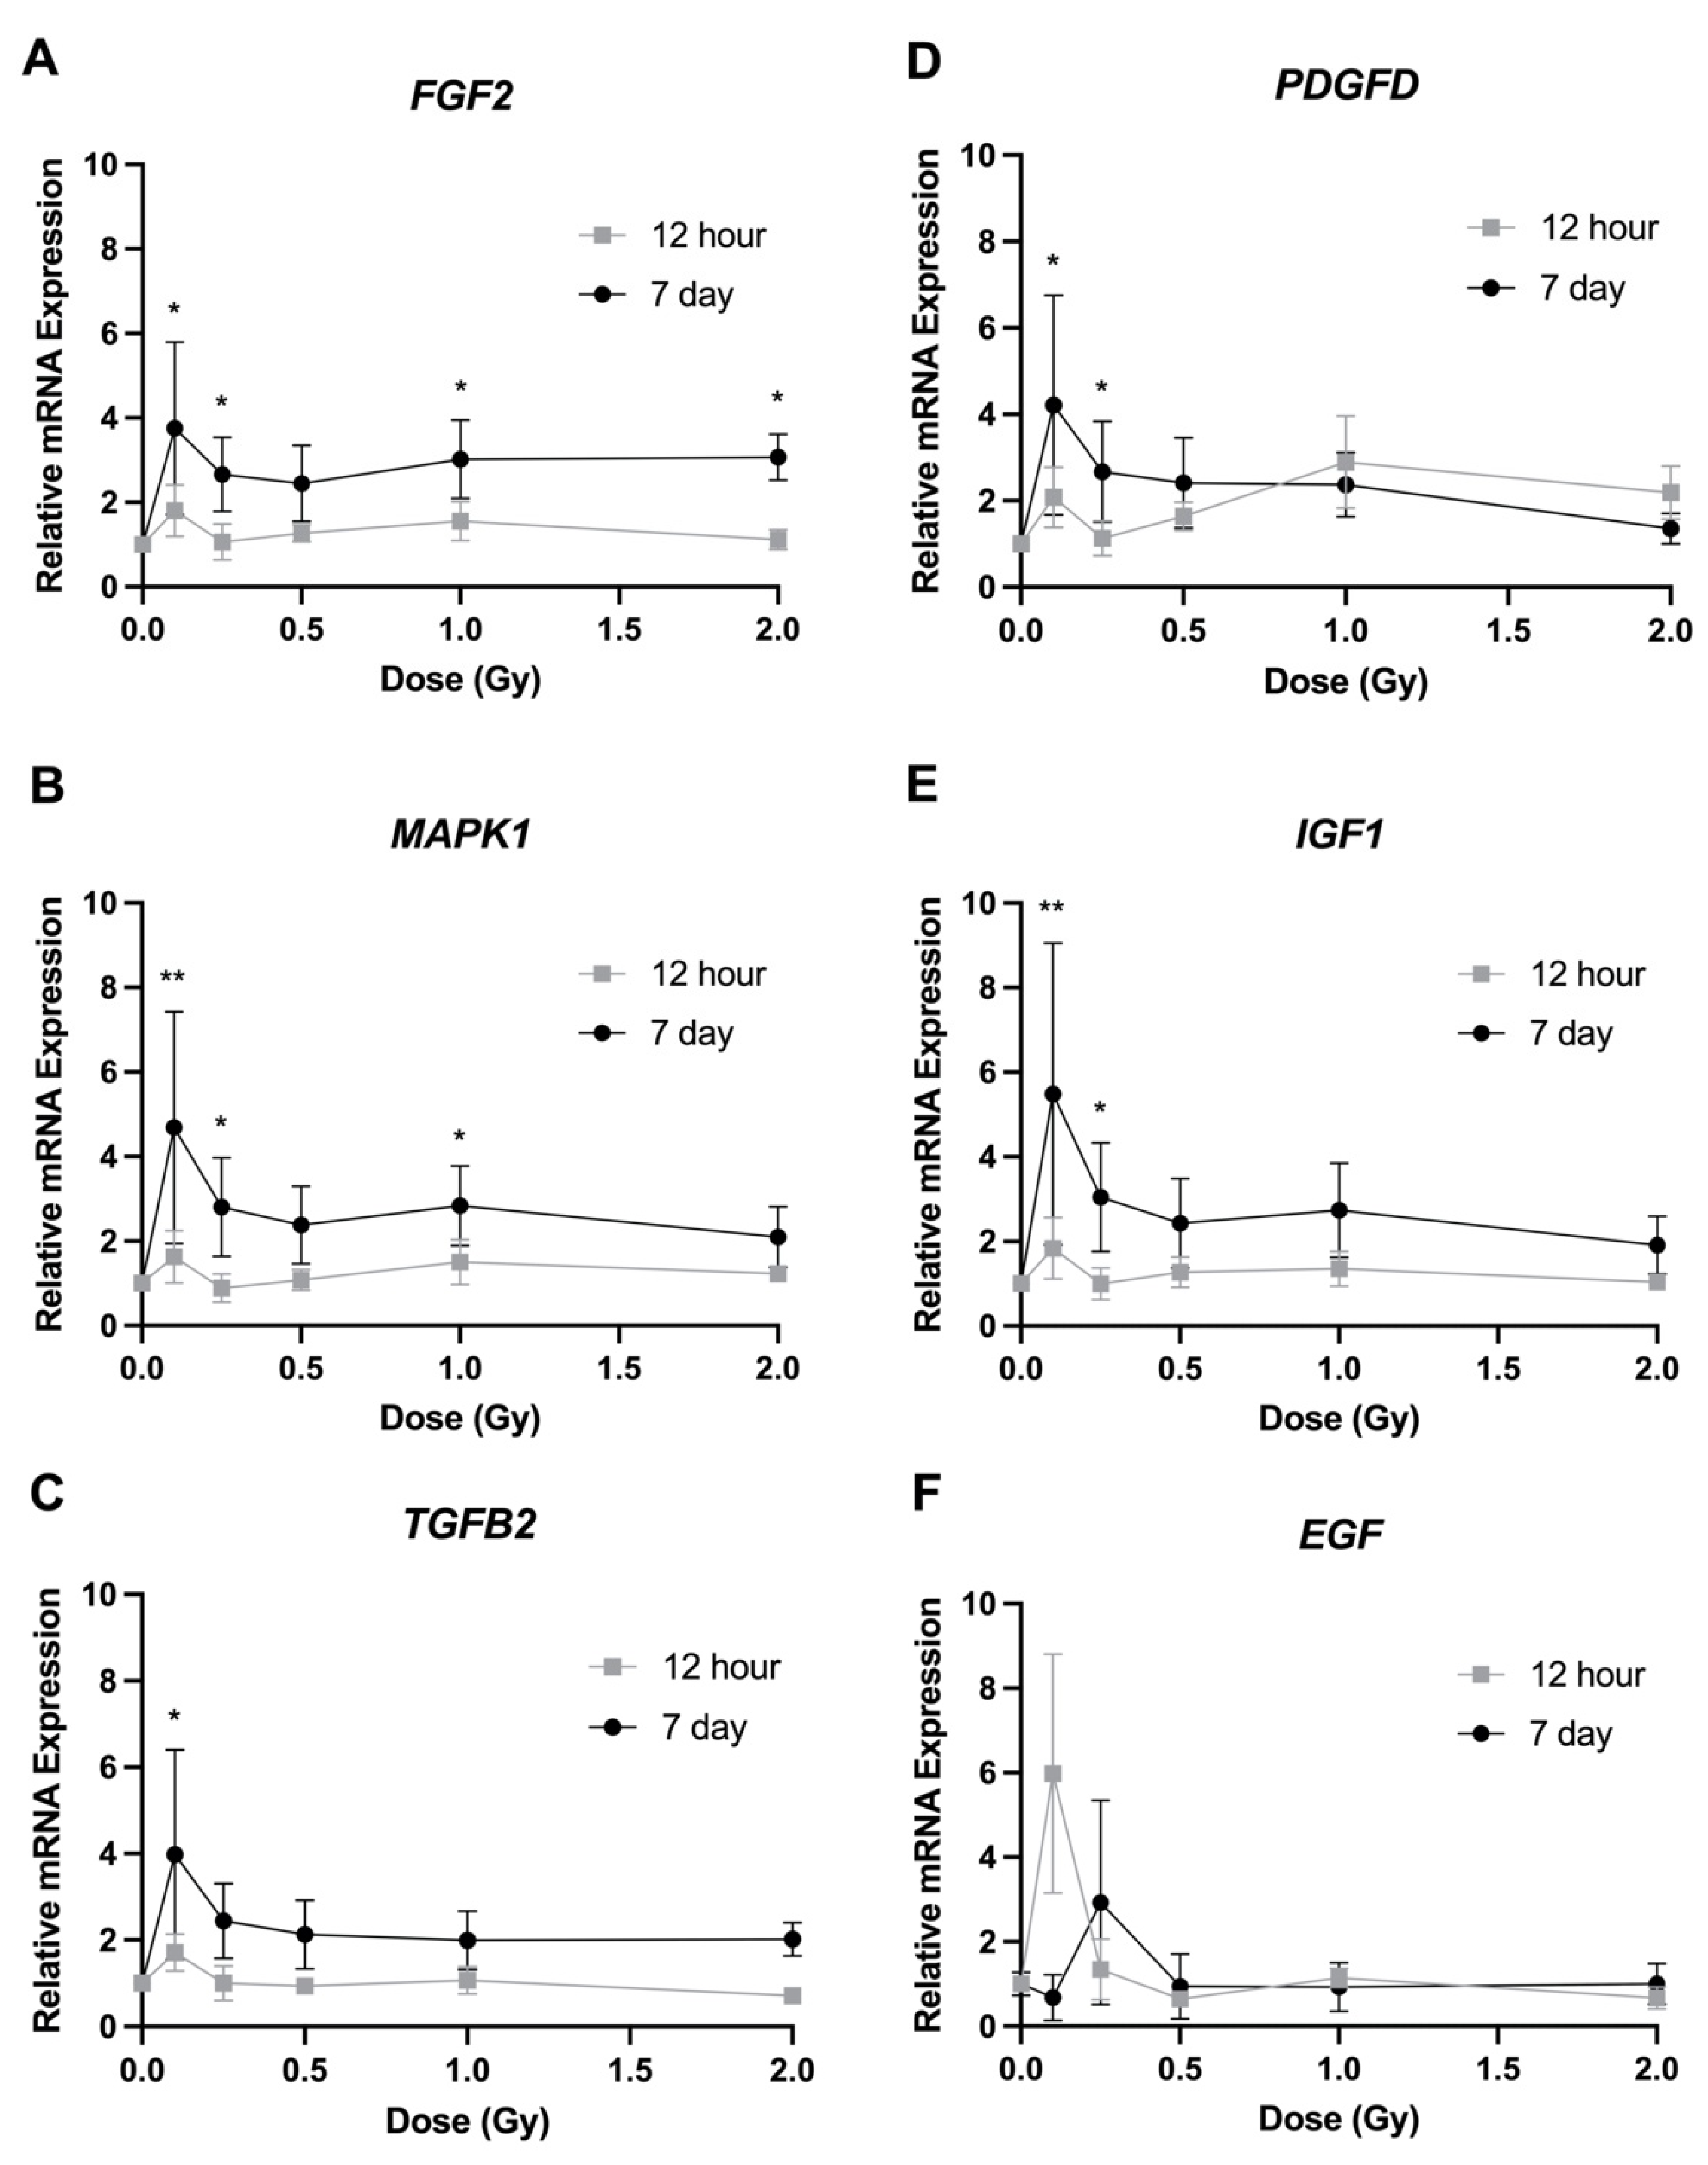
3.4. Gene Expression
4. Discussion
5. Conclusions
Author Contributions
Funding
Institutional Review Board Statement
Informed Consent Statement
Data Availability Statement
Acknowledgments
Conflicts of Interest
References
- International Commission on Radiological Protection. Recommendations of the ICRP. ICRP Publ. 26 Ann. ICRP 1977, 1, 3. [Google Scholar]
- International Commission on Radiological Protection. Nonstochastic effects of ionizing radiation. ICRP Publ. 41 Ann. ICRP 1984, 14, 3. [Google Scholar]
- International Commission on Radiological Protection. ICRP statement on tissue reactions/early and late effects of radiation in normal tissues and organs—Threshold doses for tissue reactions in a radiation protection context. ICRP Publ. 118 Ann. ICRP 2012, 41, 1–2. [Google Scholar]
- Thome, C.; Chambers, D.B.; Hooker, A.M.; Thompson, J.W.; Boreham, D.R. Deterministic Effects to the Lens of the Eye Following Ionizing Radiation Exposure: Is There Evidence to Support a Reduction in Threshold Dose? Health Phys. 2018, 114, 328–343. [Google Scholar] [CrossRef] [PubMed]
- Danysh, B.P.; Duncan, M.K. The lens capsule. Exp. Eye Res. 2009, 88, 151–164. [Google Scholar] [CrossRef] [PubMed]
- Ainsbury, E.A.; Barnard, S.; Bright, S.; Dalke, C.; Jarrin, M.; Kunze, S.; Tanner, R.; Dynlacht, J.R.; Quinlan, R.A.; Graw, J.; et al. Ionizing radiation induced cataracts: Recent biological and mechanistic developments and perspectives for future research. Mutat. Res. Mutat. Res. 2016, 770, 238–261. [Google Scholar] [CrossRef]
- Markiewicz, E.; Barnard, S.; Haines, J.; Coster, M.; van Geel, O.; Wu, W.; Richards, S.; Ainsbury, E.; Rothkamm, K.; Bouffler, S.; et al. Nonlinear ionizing radiation-induced changes in eye lens cell proliferation, cyclin D1 expression and lens shape. Open Biol. 2015, 5, 150011. [Google Scholar] [CrossRef] [Green Version]
- Kayastha, F.; Madhu, H.; Vasavada, A.; Johar, K. Andrographolide reduces proliferation and migration of lens epithelial cells by modulating PI3K/Akt pathway. Exp. Eye Res. 2014, 128, 23–26. [Google Scholar] [CrossRef]
- Chang, P.Y.; Bjornstad, K.A.; Chang, E.; McNamara, M.; Barcellos-Hoff, M.H.; Lin, S.P.; Aragon, G.; Polansky, J.R.; Lui, G.M.; Blakely, E.A. Particle irradiation induces FGF2 expression in normal human lens cells. Radiat. Res. 2000, 154, 477–484. [Google Scholar] [CrossRef]
- Chang, P.Y.; Bjornstad, K.A.; Rosen, C.J.; Lin, S.; Blakely, E.A. Particle radiation alters expression of matrix metalloproteases resulting in ECM remodeling in human lens cells. Radiat. Environ. Biophys. 2007, 46, 187–194. [Google Scholar] [CrossRef]
- Chang, P.Y.; Bjornstad, K.A.; Rosen, C.J.; McNamara, M.P.; Mancini, R.; Goldstein, L.E.; Chylack, L.T.; Blakely, E.A. Effects of Iron Ions, Protons and X Rays on Human Lens Cell Differentiation. Radiat. Res. 2005, 164, 531–539. [Google Scholar] [CrossRef] [PubMed]
- Fujimichi, Y.; Hamada, N. Ionizing Irradiation Not Only Inactivates Clonogenic Potential in Primary Normal Human Diploid Lens Epithelial Cells but Also Stimulates Cell Proliferation in a Subset of This Population. PLoS ONE 2014, 9, e98154. [Google Scholar] [CrossRef] [Green Version]
- Zhang, C.L.; Ren, H.J.; Liu, M.M.; Li, X.G.; Sun, D.L.; Li, N.; Ming, L. Modulation of Intestinal Epithelial Cell Proliferation, Migration, and Differentiation In Vitro by Astragalus Polysaccharides. PLoS ONE 2014, 9, e106674. [Google Scholar] [CrossRef]
- Ohguro, N.; Fukuda, M.; Sasabe, T.; Tano, Y. Concentration dependent effects of hydrogen peroxide on lens epithelial cells. Br. J. Ophthalmol. 1999, 83, 1064–1068. [Google Scholar] [CrossRef] [Green Version]
- Rasband, W.S.; ImageJ, U.S. National Institutes of Health, Bethesda, Maryland, USA, 1997–2018. Available online: https://imagej.nih.gov/ij/ (accessed on 22 January 2021).
- Pirkkanen, J.; Tharmalingam, S.; Morais, I.H.; Lam-Sidun, D.; Thome, C.; Zarnke, A.M.; Benjamin, L.V.; Losch, A.C.; Borgmann, A.J.; Sinex, H.C.; et al. Transcriptomic profiling of gamma ray induced mutants from the CGL1 human hybrid cell system reveals novel insights into the mechanisms of radiation-induced carcinogenesis. Free Radic. Biol. Med. 2019, 145, 300–311. [Google Scholar] [CrossRef]
- Livak, K.J.; Schmittgen, T.D. Analysis of Relative Gene Expression Data Using Real-Time Quantitative PCR and the 2−ΔΔCT Method. Methods 2001, 25, 402–408. [Google Scholar] [CrossRef] [PubMed]
- Von Sallmann, L. Experimental studies on early lens changes after roentgen irradiation. III. Effect of X-radiation on mitotic activity and nuclear fragmentation of lens epithelium in normal and cysteine-treated rabbits. AMA. Arch. Ophthalmol. 1952, 47, 305–320. [Google Scholar] [CrossRef]
- McAvoy, J.W.; Chamberlain, C.G.; de Longh, R.U.; Hales, A.M.; Lovicu, F.J. Lens development. Eye 1999, 13, 425–437. [Google Scholar] [CrossRef] [Green Version]
- Chamberlain, C.G.; McAvoy, J.W. Induction of Lens Fibre Differentiation by Acidic and Basic Fibroblast Growth Factor (FGF). Growth Factors 1989, 1, 125–134. [Google Scholar] [CrossRef]
- Chamberlain, C.G.; McAvoy, J.W. Fibre differentiation and polarity in the mammalian lens: A key role for FGF. Prog. Retin. Eye Res. 1997, 16, 443–478. [Google Scholar] [CrossRef]
- Moschos, M.M.; Armakolas, A.; Philippou, A.; Pissimissis, N.; Panteleakou, Z.; Nezos, A.; Kaparelou, M.; Koutsilieris, M. Expression of the insulin-like growth factor 1 (IGF-1) and type I IGF receptor mRNAs in human HLE-B3 lens epithelial cells. In Vivo 2011, 25, 179–184. [Google Scholar] [PubMed]
- Majima, K. Human Lens Epithelial Cells Proliferate in Response to Exogenous EGF and Have EGF and EGF Receptor. Ophthalmic Res. 1995, 27, 356–365. [Google Scholar] [CrossRef] [PubMed]
- Ray, S.; Gao, C.; Wyatt, K.; Fariss, R.; Bundek, A.; Zelenka, P.; Wistow, G. Platelet-derived Growth Factor D, Tissue-specific Expression in the Eye, and a Key Role in Control of Lens Epithelial Cell Proliferation. J. Biol. Chem. 2005, 280, 8494–8502. [Google Scholar] [CrossRef] [PubMed] [Green Version]
- Ibaraki, N.; Lin, L.R.; Reddy, V.N. Effects of growth factors on proliferation and differentiation in human lens epithelial cells in early subculture. Investig. Ophthalmol. Vis. Sci. 1995, 36, 2304–2312. [Google Scholar]
- Upadhya, D.; Ogata, M.; Reneker, L.W. MAPK1 is required for establishing the pattern of cell proliferation and for cell survival during lens development. Development 2013, 140, 1573–1582. [Google Scholar] [CrossRef] [Green Version]
- Reddan, J.R.; Wilson-Dziedzic, D. Insulin growth factor and epidermal growth factor trigger mitosis in lenses cultured in a serum-free medium. Investig. Ophthalmol. Vis. Sci. 1983, 24, 409–416. [Google Scholar]
- Lovicu, F.J.; McAvoy, J.W. FGF-induced lens cell proliferation and differentiation is dependent on MAPK (ERK1/2) signalling. Development 2001, 128, 5075–5084. [Google Scholar] [CrossRef]
- Dent, P.; Reardon, D.B.; Park, J.S.; Bowers, G.; Valerie, K.; Schmidt-ullrich, R. Radiation-induced Release of Transforming Growth Factor a Activates the Epidermal Growth Factor Receptor and Mitogen-activated Protein Kinase Pathway in Carci-noma Cells, Leading to Increased Proliferation and Protection from Radiation-induced Cell Death. Mol. Biol. Cell 1999, 10, 2493–2506. [Google Scholar] [CrossRef]
- Suman, S.; Kallakury, B.V.S.; Fornace, A.J.; Datta, K. Protracted Upregulation of Leptin and IGF1 is Associated with Activation of PI3K/Akt and JAK2 Pathway in Mouse Intestine after Ionizing Radiation Exposure. Int. J. Biol. Sci. 2015, 11, 274–283. [Google Scholar] [CrossRef] [Green Version]
- Gil Marques, F.; Poli, E.; Malaquias, J.; Carvalho, T.; Portêlo, A.; Ramires, A.; Aldeia, F.; Ribeiro, R.M.; Vitorino, E.; Diegues, I.; et al. Low doses of ionizing radiation activate endothelial cells and induce angiogenesis in peritumoral tissues. Radiother. Oncol. 2020, 151, 322–327. [Google Scholar] [CrossRef]
- Hanna, C.; O’Brien, J.E. Lens Epithelial Cell Proliferation and Migration in Radiation Cataracts. Radiat. Res. 1963, 19, 1–11. [Google Scholar] [CrossRef] [PubMed]
- de Iongh, R.; Gordon-Thomson, C.; Chamberlain, C.G.; Hales, A.M.; Avoy, J.W.M.C. TGFβ Receptor Expression in Lens: Implications for Differentiation and Cataractogenesis. Exp. Eye Res. 2001, 72, 649–659. [Google Scholar] [CrossRef] [PubMed]
- McAvoy, J.; Chamberlain, C. Fibroblast growth factor (FGF) induces different responses in lens epithelial cells depending on its concentration. Development 1989, 107, 221–228. [Google Scholar] [CrossRef] [PubMed]
- Liu, J.; Xu, D.; Li, J.; Gao, N.; Liao, C.; Jing, R.; Wu, B.; Ma, B.; Shao, Y.; Pei, C. The role of focal adhesion kinase in transforming growth factor-β2 induced migration of human lens epithelial cells. Int. J. Mol. Med. 2018, 42, 3591–3601. [Google Scholar] [CrossRef] [Green Version]
- Park, C.C.; Henshall-Powell, R.L.; Erickson, A.C.; Talhouk, R.; Parvin, B.; Bissell, M.J.; Barcellos-Hoff, M.H. Ionizing radiation induces heritable disruption of epithelial cell interactions. Proc. Natl. Acad. Sci. USA 2003, 100, 10728–10733. [Google Scholar] [CrossRef] [Green Version]
- Nishi, O.; Nishi, K.; Akaishi, T.; Shirasawa, E. Detection of cell adhesion molecules in lens epithelial cells of human cataracts. Investig. Ophthalmol. Vis. Sci. 1997, 38, 487–492. [Google Scholar]
- Pontoriero, G.F.; Smith, A.N.; Miller, L.-A.D.; Radice, G.L.; West-Mays, J.A.; Lang, R.A. Co-operative roles for E-cadherin and N-cadherin during lens vesicle separation and lens epithelial cell survival. Dev. Biol. 2009, 326, 403–417. [Google Scholar] [CrossRef] [Green Version]
- McLean, S.M.; Mathew, M.R.K.; Kelly, J.B.; Murray, S.B.; Bennett, H.G.B.; A Webb, L.; Esakowitz, L.; McLean, J.S. Detection of integrins in human cataract lens epithelial cells and two mammalian lens epithelial cell lines. Br. J. Ophthalmol. 2005, 89, 1506–1509. [Google Scholar] [CrossRef] [Green Version]
- Hynes, R.O. Integrins: Versatility, modulation, and signaling in cell adhesion. Cell 1992, 69, 11–25. [Google Scholar] [CrossRef]
- Awasthi, N.; Wang-Su, S.T.; Wagner, B.J. Downregulation of MMP-2 and -9 by Proteasome Inhibition: A Possible Mechanism to Decrease LEC Migration and Prevent Posterior Capsular Opacification. Investig. Opthalmol. Vis. Sci. 2008, 49, 1998–2003. [Google Scholar] [CrossRef]
- Thome, C.; Mitz, C.; Hulley, E.N.; Somers, C.M.; Manzon, R.G.; Wilson, J.Y.; Boreham, D.R. Initial Characterization of the Growth Stimulation and Heat-Shock-Induced Adaptive Response in Developing Lake Whitefish Embryos after Ionizing Radiation Exposure. Radiat. Res. 2017, 188, 475–485. [Google Scholar] [CrossRef] [PubMed]
- Redpath, J.L.; Lu, Q.; Lao, X.; Molloi, S.; Elmore, E. Low doses of diagnostic energy X-rays protect against neoplastic transformation in vitro. Int. J. Radiat. Biol. 2003, 79, 235–240. [Google Scholar] [CrossRef]
- Azzam, E.I.; De Toledo, S.M.; Raaphorst, G.P.; Mitchel, R.E.J. Low-Dose Ionizing Radiation Decreases the Frequency of Neoplastic Transformation to a Level below the Spontaneous Rate in C3H 10T1/2 Cells. Radiat. Res. 1996, 146, 369. [Google Scholar] [CrossRef] [PubMed]
- Janiak, M.K.; Wargocka, J.W.; Cheda, A.; Nowosielska, E.M.; Lisiak, E.; Bilski, M. Modulation of anti-tumour functions of NK cells and macrophages after single low-level exposures of mice to X-rays. Int. J. Low Radiat. 2006, 3, 178. [Google Scholar] [CrossRef]
- Scott, B.R.; Tharmalingam, S. The LNT model for cancer induction is not supported by radiobiological data. Chem. Interact. 2019, 301, 34–53. [Google Scholar] [CrossRef]
- Andley, U.P.; Rhim, J.S.; Chylack, L.T.; Fleming, T.P. Propagation and immortalization of human lens epithelial cells in culture. Investig. Ophthalmol. Vis. Sci. 1994, 35, 3094–3102. [Google Scholar]


| Gene | Primer Sequence | |
|---|---|---|
| Forward | Reverse | |
| Proliferation | ||
| FGF2 | GAGCGACCCTCACATCAAGC | ATAGCCAGGTAACGGTTAGCAC |
| TGFB2 | GTGCTTTGGATGCGGCCTA | GGCATGCTCCAGCACAGAA |
| IGF1 | ACCCGGAGTACTTCAGCGC | CACAGAAGCTTCGTTGAGAA |
| EGF | GAGATGGGTGTCCCAGTGTG | GGGGTGGAGTAGAGTCAAGACA |
| PDGFD | CTCAGGCGAGATGAGAGCAAT | GCACGTAGCCGTTTCCTTTC |
| MAPK1 | ATCTTAAATTTGTCAGGACAAGGG | AGACAGGACCAGGGGTCAA |
| Migration | ||
| MMP9 | CTTTGAGTCCGGTGGACGAT | TCGCCAGTACTTCCCATCCT |
| PTK2 | TGGGCGGAAAGAAATCCTGC | GGCTTGACACCCTCGTTGTA |
| Adhesion | ||
| ITGA5 | GTCGGGGGCTTCAACTTAGAC | GCACACTGACCCCGTCTG |
| ITGB1 | ACCGTAGCAAAGGAACAGCA | TCTGTGGCTCCCCTGATCTT |
| ICAM1 | TTGAGGGCACCTACCTCTGT | GATAGGTTCAGGGAGGCGTG |
| CDH2 | ATGGGAAATGGAAACTTGATGGC | CAGTTGCTAAACTTCACTGAAAGG |
| Housekeeping | ||
| RSP13 | CTTTCGTTGCCTGATCGCCG | TCAACTTCAACCAAGTGGGGA |
| RSP18 | ATTAAGGGTGTGGCCGAAG | GGTGATCACACGTTCCACCT |
| RPL4 | CACGCAAGAAGATCCATCGC | CCGGAGCTTGTGATTCCTGG |
Publisher’s Note: MDPI stays neutral with regard to jurisdictional claims in published maps and institutional affiliations. |
© 2022 by the authors. Licensee MDPI, Basel, Switzerland. This article is an open access article distributed under the terms and conditions of the Creative Commons Attribution (CC BY) license (https://creativecommons.org/licenses/by/4.0/).
Share and Cite
Vigneux, G.; Pirkkanen, J.; Laframboise, T.; Prescott, H.; Tharmalingam, S.; Thome, C. Radiation-Induced Alterations in Proliferation, Migration, and Adhesion in Lens Epithelial Cells and Implications for Cataract Development. Bioengineering 2022, 9, 29. https://0-doi-org.brum.beds.ac.uk/10.3390/bioengineering9010029
Vigneux G, Pirkkanen J, Laframboise T, Prescott H, Tharmalingam S, Thome C. Radiation-Induced Alterations in Proliferation, Migration, and Adhesion in Lens Epithelial Cells and Implications for Cataract Development. Bioengineering. 2022; 9(1):29. https://0-doi-org.brum.beds.ac.uk/10.3390/bioengineering9010029
Chicago/Turabian StyleVigneux, Graysen, Jake Pirkkanen, Taylor Laframboise, Hallie Prescott, Sujeenthar Tharmalingam, and Christopher Thome. 2022. "Radiation-Induced Alterations in Proliferation, Migration, and Adhesion in Lens Epithelial Cells and Implications for Cataract Development" Bioengineering 9, no. 1: 29. https://0-doi-org.brum.beds.ac.uk/10.3390/bioengineering9010029