Feedforward Neural Network-Based Architecture for Predicting Emotions from Speech


Department of Telecommunications, Faculty of Electronics, Telecommunications, and Information Technology, University “Politehnica”, Bucharest 060042, Romania
*
Author to whom correspondence should be addressed.
Data 2019, 4(3), 101; https://0-doi-org.brum.beds.ac.uk/10.3390/data4030101
Submission received: 21 May 2019
/
Revised: 9 July 2019
/
Accepted: 11 July 2019
/
Published: 15 July 2019
Abstract
:We propose a novel feedforward neural network (FFNN)-based speech emotion recognition system built on three layers: A base layer where a set of speech features are evaluated and classified; a middle layer where a speech matrix is built based on the classification scores computed in the base layer; a top layer where an FFNN- and a rule-based classifier are used to analyze the speech matrix and output the predicted emotion. The system offers 80.75% accuracy for predicting the six basic emotions and surpasses other state-of-the-art methods when tested on emotion-stimulated utterances. The method is robust and the fastest in the literature, computing a stable prediction in less than 78 s and proving attractive for replacing questionnaire-based methods and for real-time use. A set of correlations between several speech features (intensity contour, speech rate, pause rate, and short-time energy) and the evaluated emotions is determined, which enhances previous similar studies that have not analyzed these speech features. Using these correlations to improve the system leads to a 6% increase in accuracy. The proposed system can be used to improve human–computer interfaces, in computer-mediated education systems, for accident prevention, and for predicting mental disorders and physical diseases.

1. Introduction
Although given the current technology development, humans are creating increasingly more communication tools, speech remains the fastest and most efficient way of communication between people. With this important feature as a premise, extensive research was conducted to employ speech in human–computer as well as computer-mediated communication, focusing both on translating the spoken message and generating appropriate computer actions, as well as on recognizing more subtle aspects of speech, such as the ones related to emotions. Recognizing emotions from speech is a complex task because of the multitude of languages that can be used, different speech styles, different accents, and high variation of speech features [1,2,3]. There is also a broad spectrum of speech features that can be analyzed and selecting the most relevant of them is a complex problem itself, often resolved through trial-and-error. Some papers even suggest that, under certain conditions, the speech might not be sufficient to identify the exact emotion affecting the analyzed subject. A significant study was conducted by Partila et al. [4] with the aim of improving voice security systems. Speech activity is recorded from patients reading a predefined text, in both neutral and stressed states, with the purpose of studying how human emotions affect physiological characteristics and their changes. The researchers focused on extracting Mel-frequency cepstral coefficients (MFCC) and their dynamic and accelerated derivations and used a Gaussian mixture model (GMM)-based classifier for emotion recognition. The results show that speech signals might not be sufficient to recognize subjects’ emotions if they try to conceal them, especially when they are affected by stress, and suggest that other physiological signals could be used, such as heart rate, skin conductivity, or brain waves. With these points considered, we can state that predicting human emotions by analyzing speech is a difficult task.
In the literature, a broad spectrum of methods has been proposed for building efficient and accurate speech emotion recognition (SER) systems. Guoth et al. [5] propose a two-dimensional homomorphic analysis based on bat algorithm and particle swarm optimization (PSO) for recognizing the six basic emotions (fear, anger, surprise, happiness, sadness, and disgust) in continuous space. The proposed architecture is tested on the interactive emotional dyadic motion capture (IEMOCAP) database [6] and reaches an accuracy of 75%. Vydana et al. [7] conducted a similar study in which the speech regions that are rich in emotional information from a given utterance are determined, and only the spectrum of those regions is analyzed. Emotions are classified using GMM-based classifiers and tested on EMO-DB database [8]. Researchers show that this type of analysis, which focuses on emotionally significant regions, compared to analyzing the entire utterance, increases the accuracy with up to 11%, but it also determines that such an approach can ignore inter-segment variations, which sometimes contain emotionally rich information. Fan et al. [9] propose a study in which utterances are not pre-segmented to avoid eliminating possible inter-segment emotion variations that may contain relevant information and use a multi-time-scaled sliding window based on automatic emotion variation detection (MSW-AEVD) instead. A fixed-size sliding window is used to track the utterance, and every emotion is associated with a moving pattern of this window. The emotion classification is done using hidden Markov models (HMM), and the method is tested on EMO-DB database [8] in the German language, reaching an accuracy of over 90% at identifying variations between anger and the neutral state and between happiness and neutral state. Shami and Kamel [10] propose a speaker-independent architecture based on naturally enriched speech. Researchers regard the utterance as a combination of vocal signals and not just a single one, identified based on the statistical measurement of the spectrum, intensity, and pitch contours, calculated at speech segment and utterance levels. For classification, they use support vector machines (SVM) and K-nearest neighbors (KNN), both methods offering an accuracy of over 87%.
In terms of SER systems that use methods based on neural networks (NN), Fu et al. [11] propose an algorithm for fusing three HMM-based and NN-based classifiers using a voting system. Their results on Berlin database [8] show an accuracy of over 70% at classifying the six basic emotions. A method employing a set of convolutional neural networks (CNN) for extracting speech features from normalized spectrogram is proposed by Zhang et al. [12]. Using random forests (RF) for the emotion classification task, the method reaches an accuracy of over 80%. Chakraborty and Aftabuddin [13] combine CNN with long short-term memory (LSTM) networks to analyze 13 MFCCs with 13 velocity and 13 acceleration components. The proposed method is tested on Berlin database [8], reaching an emotion classification accuracy of 80%. Parthasarathy and Tashev [14] review different CNN-based architectures and pooling techniques with the purpose of reducing the discrepancy between unweighted accuracy (UA) and weighted accuracy (WA). The most efficient architecture leads to an improvement of UA+WA performance from 118.10 to 121.15 compared to a baseline algorithm. Zhang et al. [15] explore how deep convolutional neural networks (DCNNs) can be used to bridge the emotion gap in speech signals. Their method extracts the static, delta, and delta-delta channels of Mel spectrograms and provides them as input to a set of DCNNs. Discriminant temporal pyramid matching (DTPM) strategy is used to combine the temporal pyramid matching and optimal Lp-norm pooling and build global utterance-level representations. The results show that the proposed method surpasses other state-of-the-art DCNN-based SER systems in terms of accuracy, sensitivity, and specificity. Zhao et al. [16] propose a unique architecture based on a merged CNN with two branches, a one-dimensional CNN (1D-CNN) and a two-dimensional one (2D-CNN), which learn high-level features from raw audio clips and log-Mel spectrograms. 1D-CNN and 2D-CNN are first trained, and then the learned features are repurposed and transferred to a merged CNN which is fine-tuned. The results show that the approach improves with up to 3% the accuracy compared to other state-of-the-art CNN-based SER systems. Shahin et al. [17] propose a hybrid method using a cascaded GMM and deep neural network (DNN) to recognize emotions for a text-independent, speaker-independent SER system. The approach offers an accuracy of up to 83.97% when tested on Emirati speech database [18], 14% higher than other state-of-the-art feedforward neural network (FFNN)-based SER systems. Lotfidereshgi and Goumay [19] start from the hypothesis that conventional feature-based classification methods offer lower accuracy because it is hard to determine the most efficient set of spectral and prosodic features. Hence, they propose a method based on a biologically inspired spiking neural network (SNN) that operates directly in the speech signal. The source and vocal tract components are extracted from the speech signal and converted to spectral representations, which are then fetched to two separate reservoirs of neurons, the result of each reservoir being fed to a final classifier outputting the predicted emotion. Tested on Berlin database [8], the method offers an accuracy of up to 78%.
In this paper, we propose an FFNN-based novel architecture for analyzing the speech features with the purpose of predicting the six basic emotions. We use the most common way of defining emotions, which was first described by Clynes [20] who emphasizes the idea of pure basic sentic states, and later refined by Paul Ekman’s research [21], by defining the six basic emotions: Anger, surprise, fear, happiness, sadness, and disgust. Alongside human–computer interfaces (HCI), this architecture can be used for improving the conversation in call center departments by predicting the caller’s emotional state and providing advice to agents on how to best approach the caller [22,23]; diagnosing mental disorders or physical diseases based on the emotional patterns displayed by the subject over the course of time (knowing that there are proved correlations between these emotional patterns and several mental disorders [24,25,26] and physical diseases [27]); determining the perpetrator by analyzing suspects’ emotions during interrogations in crime investigation departments [28,29]; or preventing plane or car accidents by analyzing driver’s or pilot’s speech, determining if they are affected by negative emotions, and taking preventive measures in such cases, such as stopping the car or informing the control tower [30,31]. In the following sections, we present the experimental results obtained, as well as the methods used for implementing the proposed architecture.
2. Results
2.1. Databases Used
There is a broad spectrum of databases that are commonly used for predicting emotion from speech, collected in different languages. In this paper, we focus on recognizing emotions from English speakers, not only because the English language is the lingua franca in different domains, but mainly because this study is part of a research project aiming to build a system for diagnosing mental disorders and physical diseases by analyzing information collected from different sources, non-invasively (such as emotional patterns through speech analysis), for applications in the healthcare industry in English-speaking countries. The most relevant databases containing utterances collected in English language, which are also used in this study, are: AVIC (AudioVisual Interest Corpus) [32] containing audio-visual recordings acquired from 21 subjects (11 males and 10 females), displaying the six basic emotions in naturalistic conditions; eNTERFACE [33] containing audio-visual recordings collected from 42 subjects (34 males and 8 females), simulating the six basic emotions; McGilloway [34] containing audio recordings collected from 40 subjects whose emotions are stimulated; structured Belfast [35] containing audio recordings collected from 50 subjects whose emotions are stimulated; naturalistic Belfast [35] containing audio-visual recordings collected in naturalistic conditions from 125 subjects (31 males and 94 females); and SALAS [36], containing audio-visual recordings with stimulated emotions collected from 20 subjects. We use these databases to evaluate our proposed SER system in comparison with other state-of-the-art methods.
Because we need a more extensive database that would correlate emotions with speech features and would allow for a more in-depth analysis on how emotional stimuli affect the prediction accuracy as well as study emotion prediction over longer periods of time, we create our own database by involving 128 Caucasian subjects (64 males and 64 females), with ages between 18 and 35 years old, participating in conformity with the Helsinki Ethical Declaration [37]. During each session, we ask each subject to watch different videos aimed at stimulating each of the six basic emotions and comment each video while watching it. Subjects’ utterances are recorded using a Sony ECM-VG1 Electret Condenser Shotgun microphone in low noise conditions. After watching each emotion-stimulating videos, the subject is asked to complete the discrete emotions questionnaire (DEQ) [38]. We also ask the subject to comment neutral videos (that are not meant to stimulate any emotion), also collecting the DEQ results after each watching session. The DEQ results are evaluated by trained psychologists to exclude those that are not precisely filled in. The DEQ result is used for emotionally labeling the audio recordings with the actual emotion of the subject after watching both emotionally neutral and emotionally stimulated videos (the actual emotion of the subject can be different than the stimulated one). For stimulating the six basic emotions, we use videos from LIRIS-ACCEDE database [39]. Because the videos from this database last between 8 and 12 s, while analyzing relevant speech features might need a longer time, we combine multiple videos for the same emotion in 1-minute videos. Speech is collected in the English language. We collect the samples for each subject on six different sessions, with a pause of two weeks between these sessions in order to include the speech emotion-related dynamics over time. Therefore, at the end of the three months dedicated to collecting the samples, for each subject we have 36 audio recordings when emotion is stimulated (six for each of the six stimulated emotions), 30 audio recordings when no emotion is stimulated, and 66 DEQ results. The average time needed to fill in DEQ is 12.1 min. We divide the database into:
- -
- Dataset Controlled (DSC): Utterances are collected in the presence of an emotional stimulus;
- -
- Dataset Random (DSR): Utterances are collected in the absence of an emotional stimulus.
The proposed database is not publicly available.
The proposed FFNN-based SER system is built in Scala (as a programming language), using Spark library, a java virtual machine (JVM) with eclipse as integrated development environment (IDE). It has a complexity of approximately 6000 code lines and runs on a testbed with Intel i7 processor, 8 Gigabytes (GB) of random-access memory (RAM), and Linux Solaris 11.3 as the operating system.
In order to evaluate the proposed architecture, we use the following statistical measures (where TP refers to the number of true positives, TN is the number of true negatives, FP is the number of false positives, and FN is the number of false negatives) [40]:
- -
- Accuracy (ACC):
- -
- Sensitivity or True Positive Rate (TPR):
- -
- Specificity or True Negative Rate (TNR):
2.2. Intra-Subject Methodology
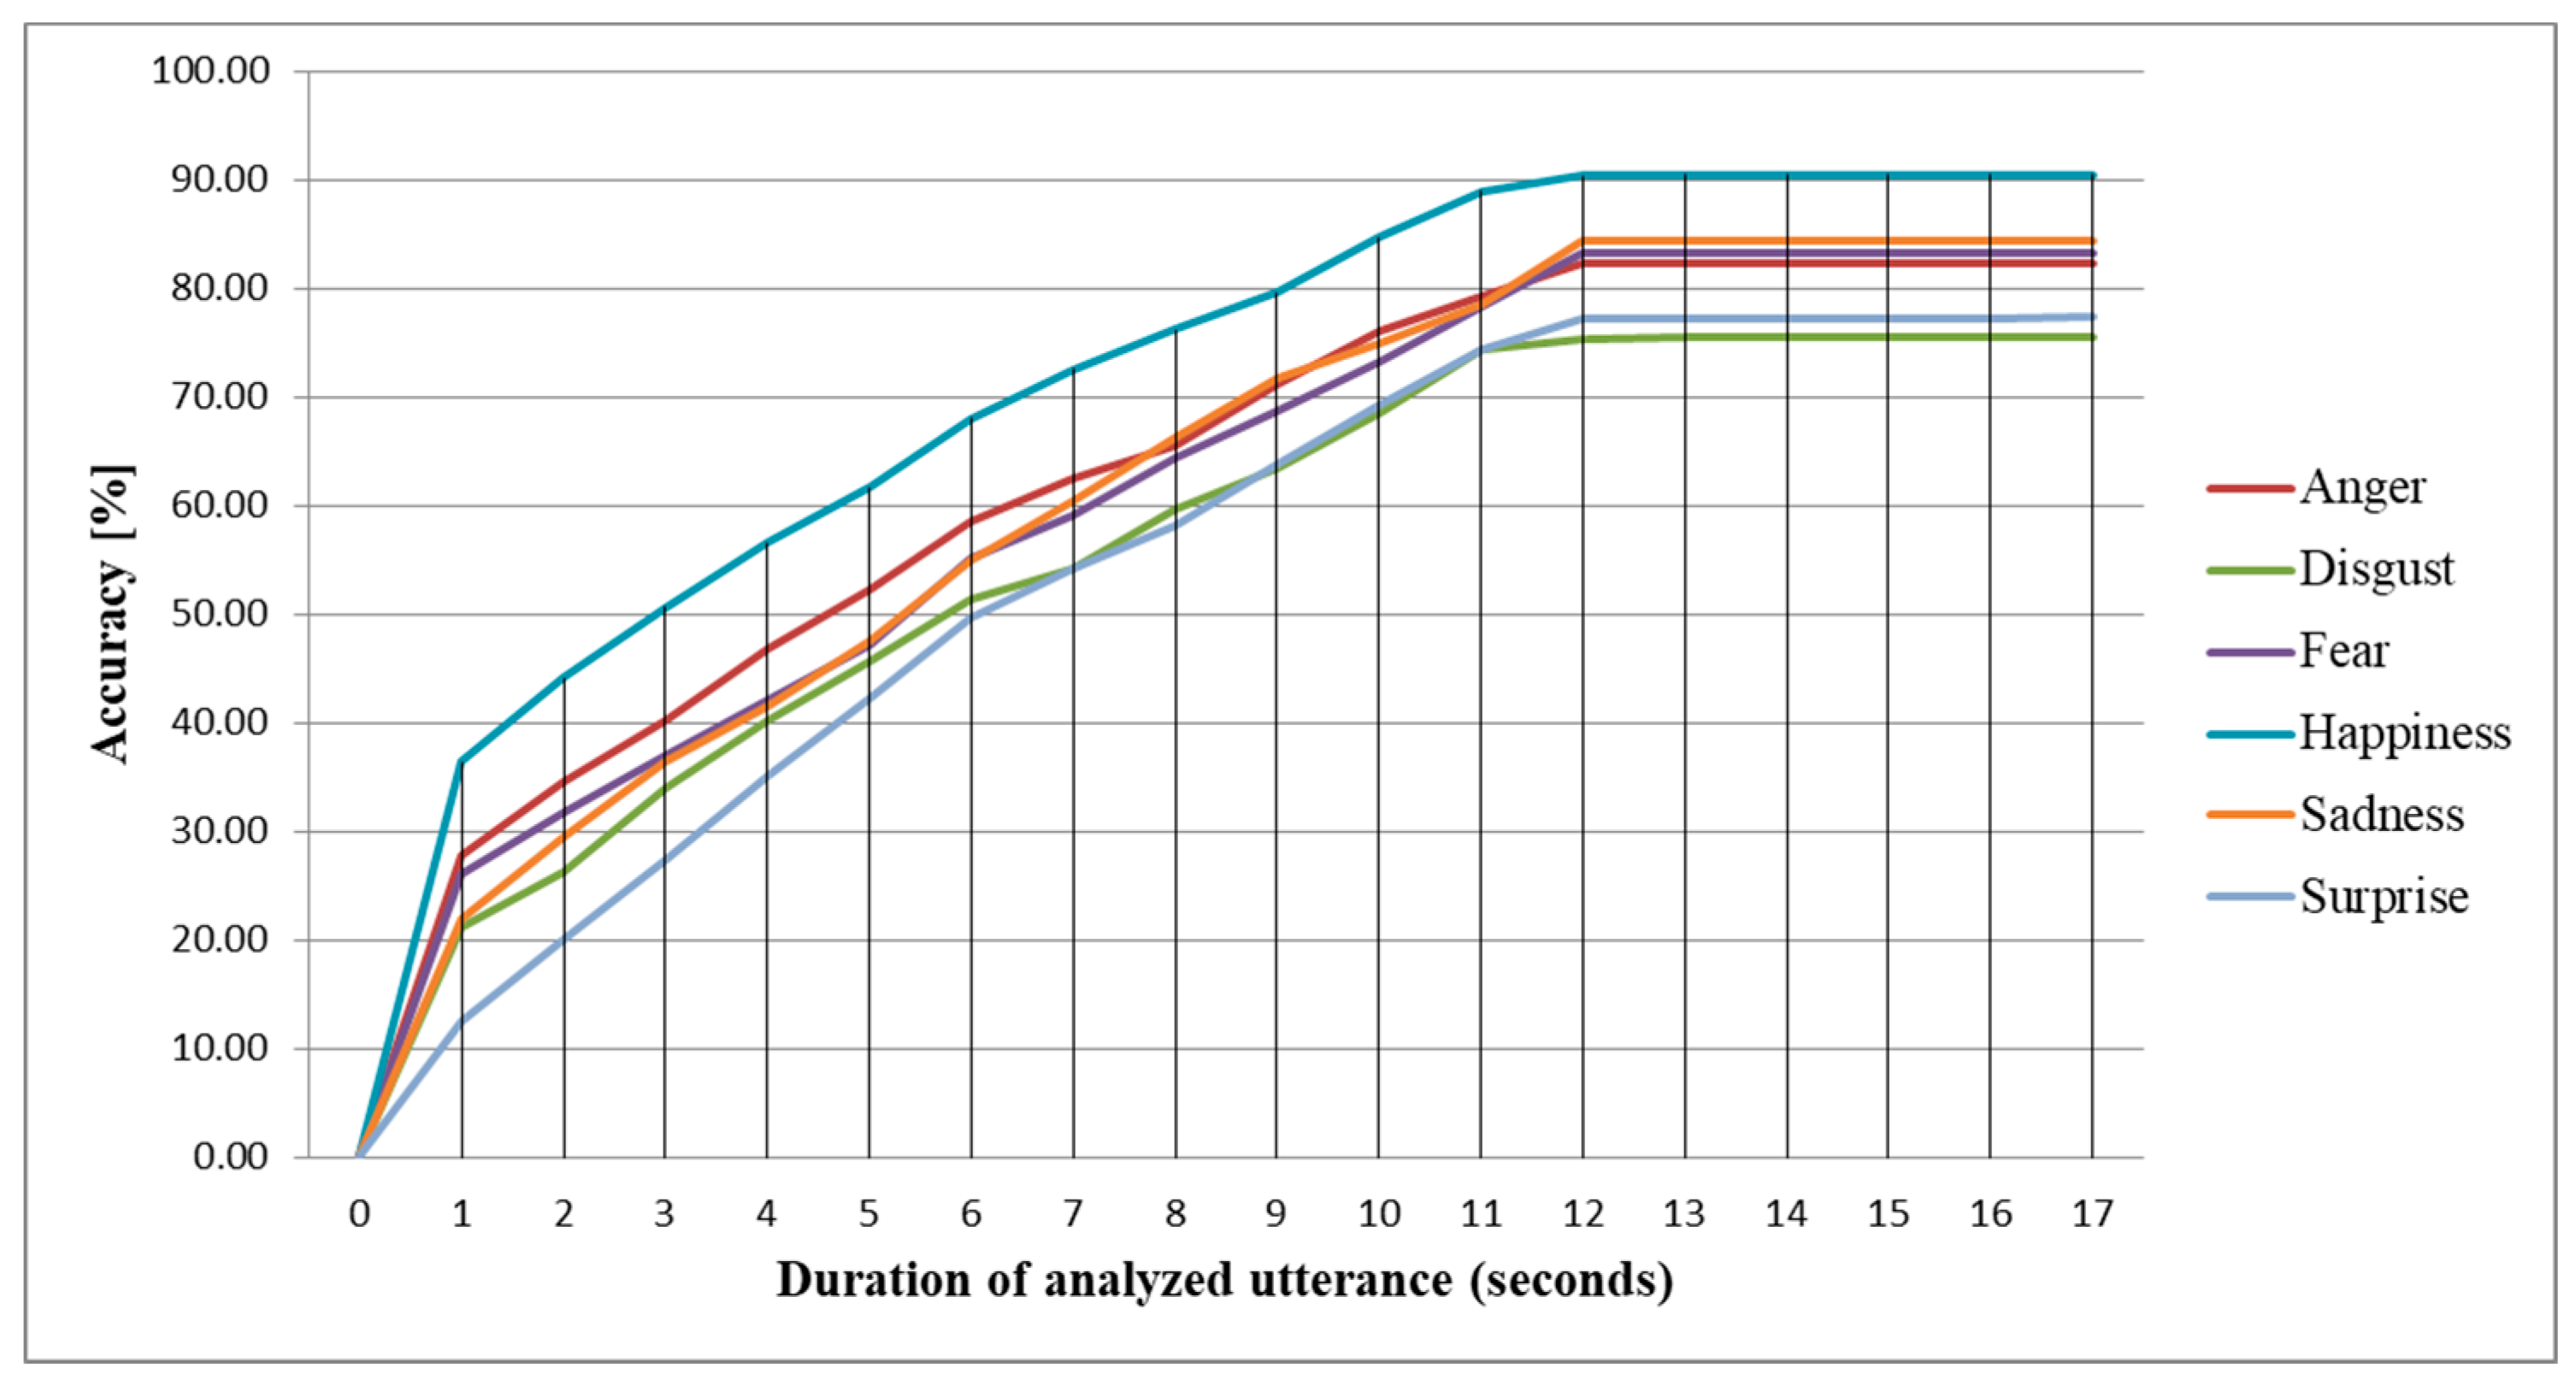
The intra-subject methodology corresponds to speaker-dependent tests. We train and test the proposed architecture using samples pertaining to the same subject, and we vary the dataset used for training and testing (DSC, DSR, or both). We use leave-one-out, and we repeat the tests for all 128 subjects, averaging the results. Table 1 shows the results obtained, and Table 2 displays the confusion matrix. As expected, given the emotionally rich content of DSC, the highest accuracy of 83.35% is obtained when we use DSC for both training and testing phases, while the lowest accuracy is obtained when we train and test the proposed architecture using DSR (67.8%). Although the difference between the prediction accuracy for these two tests is of approximately 16%, if we keep DSC for the training phase and we use DSR for testing the proposed architecture, the accuracy decreases with less than 1.5% compared to when DSC is used for both phases. This result shows that utterances collected when emotion is stimulated add more value to the system if they are used for training, while for testing, utterances collected in non-emotion-stimulating conditions can be used without significantly affecting the prediction accuracy. This finding makes the system practical as the subject only needs to comment emotion-stimulating videos in order to train the proposed architecture, while for further assessment of the emotion, the utterances can be collected without the need of emotional stimuli. In this case, considered the most practically relevant (DSC is used for the training phase and DSR for the testing phase), the average duration of the utterance needed for the proposed architecture to converge to a stable prediction is 12 s, therefore the subject only needs to speak for 12 s for the system to be able to predict the emotion accurately (Figure 1).
Given the fact that processing 30 frames lasts, on average, 5 s, the average duration for predicting emotions in intra-subject methodology is 72 s, significantly faster than the 12.1 min needed to complete DEQ, making the approach faster than the questionnaire, and with the advantage of allowing real-time monitoring of emotions and being less prone to bias compared with the questionnaire-based methods [41]. The highest accuracy is obtained for happiness (90.4%), followed by sadness (84.3%), fear (83.2%), and anger (82.3%). Disgust and surprise are predicted with less than 78% accuracy.
2.3. Inter-Subject Methodology
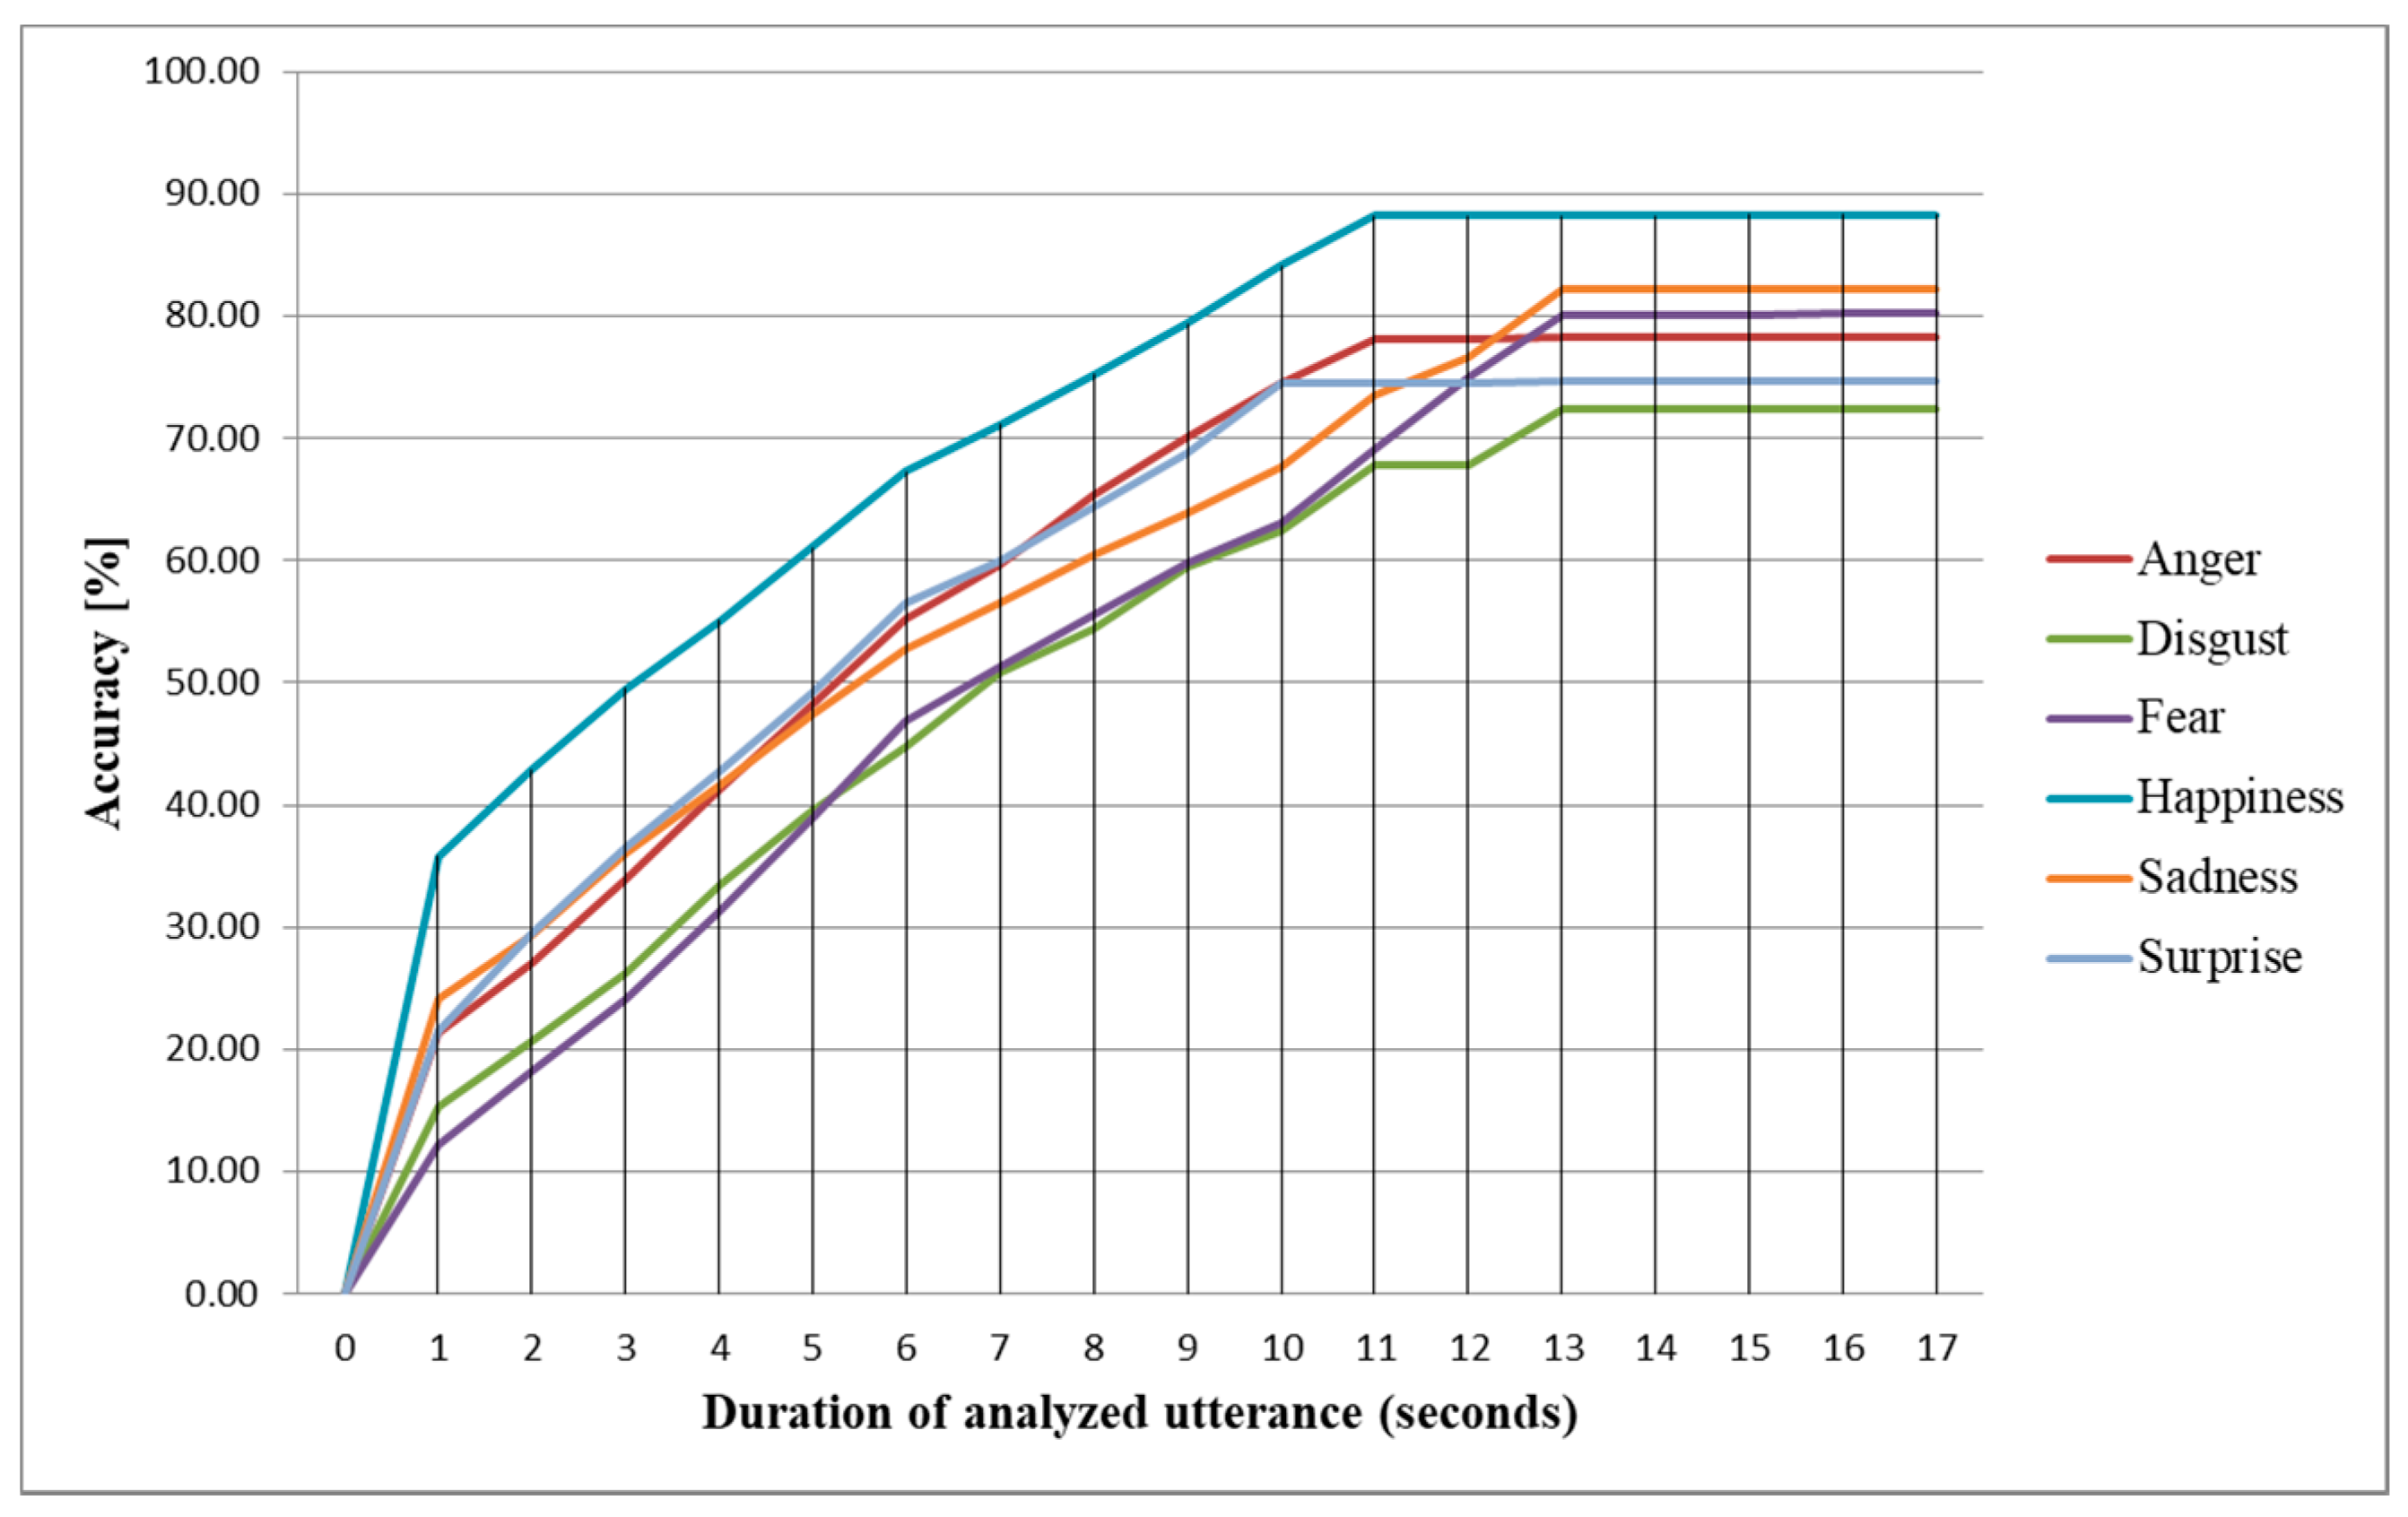
The inter-subject methodology corresponds to a speaker-independent approach. We train the proposed architecture using samples collected from a set of subjects, and we test it using samples collected from a subject that is not involved in the training phase, alternating the dataset used for training and testing phases as well as the number of subjects involved in the training phase. We use a leave-one-out approach for these tests, repeating them until all subjects have been involved in the testing phase, and averaging the results. The results are displayed in Table 3, and the confusion matrix is presented in Table 4. As we can observe, the findings are similar to the ones obtained in intra-subject methodology. The highest accuracy is obtained when DSC is used for both training and testing phases, and the number of subjects involved in the training phase is the highest (127 subjects). In this case, we obtain an accuracy of 80.75%, 12% higher compared to when DSR is used for both training and testing phases. Similarly, we see a decrease of only 1% in terms of accuracy and less than 0.5% for sensitivity and specificity when we maintain DSC for the training phase, and we use DSR for the testing phase compared to the case when we use DSC for both phases. The conclusion is similar to the one from the intra-subject methodology, but more valuable here because the system can be pre-trained using samples from different subjects, while the end user does not have to do any additional training as the emotion can be evaluated in random conditions, with no emotional stimulus, without significantly affecting the accuracy. In this most practical case, we need 1 more second for the system to converge to a stable prediction compared to the intra-subject methodology, the average duration of the analyzed utterance being 13 s (Figure 2).
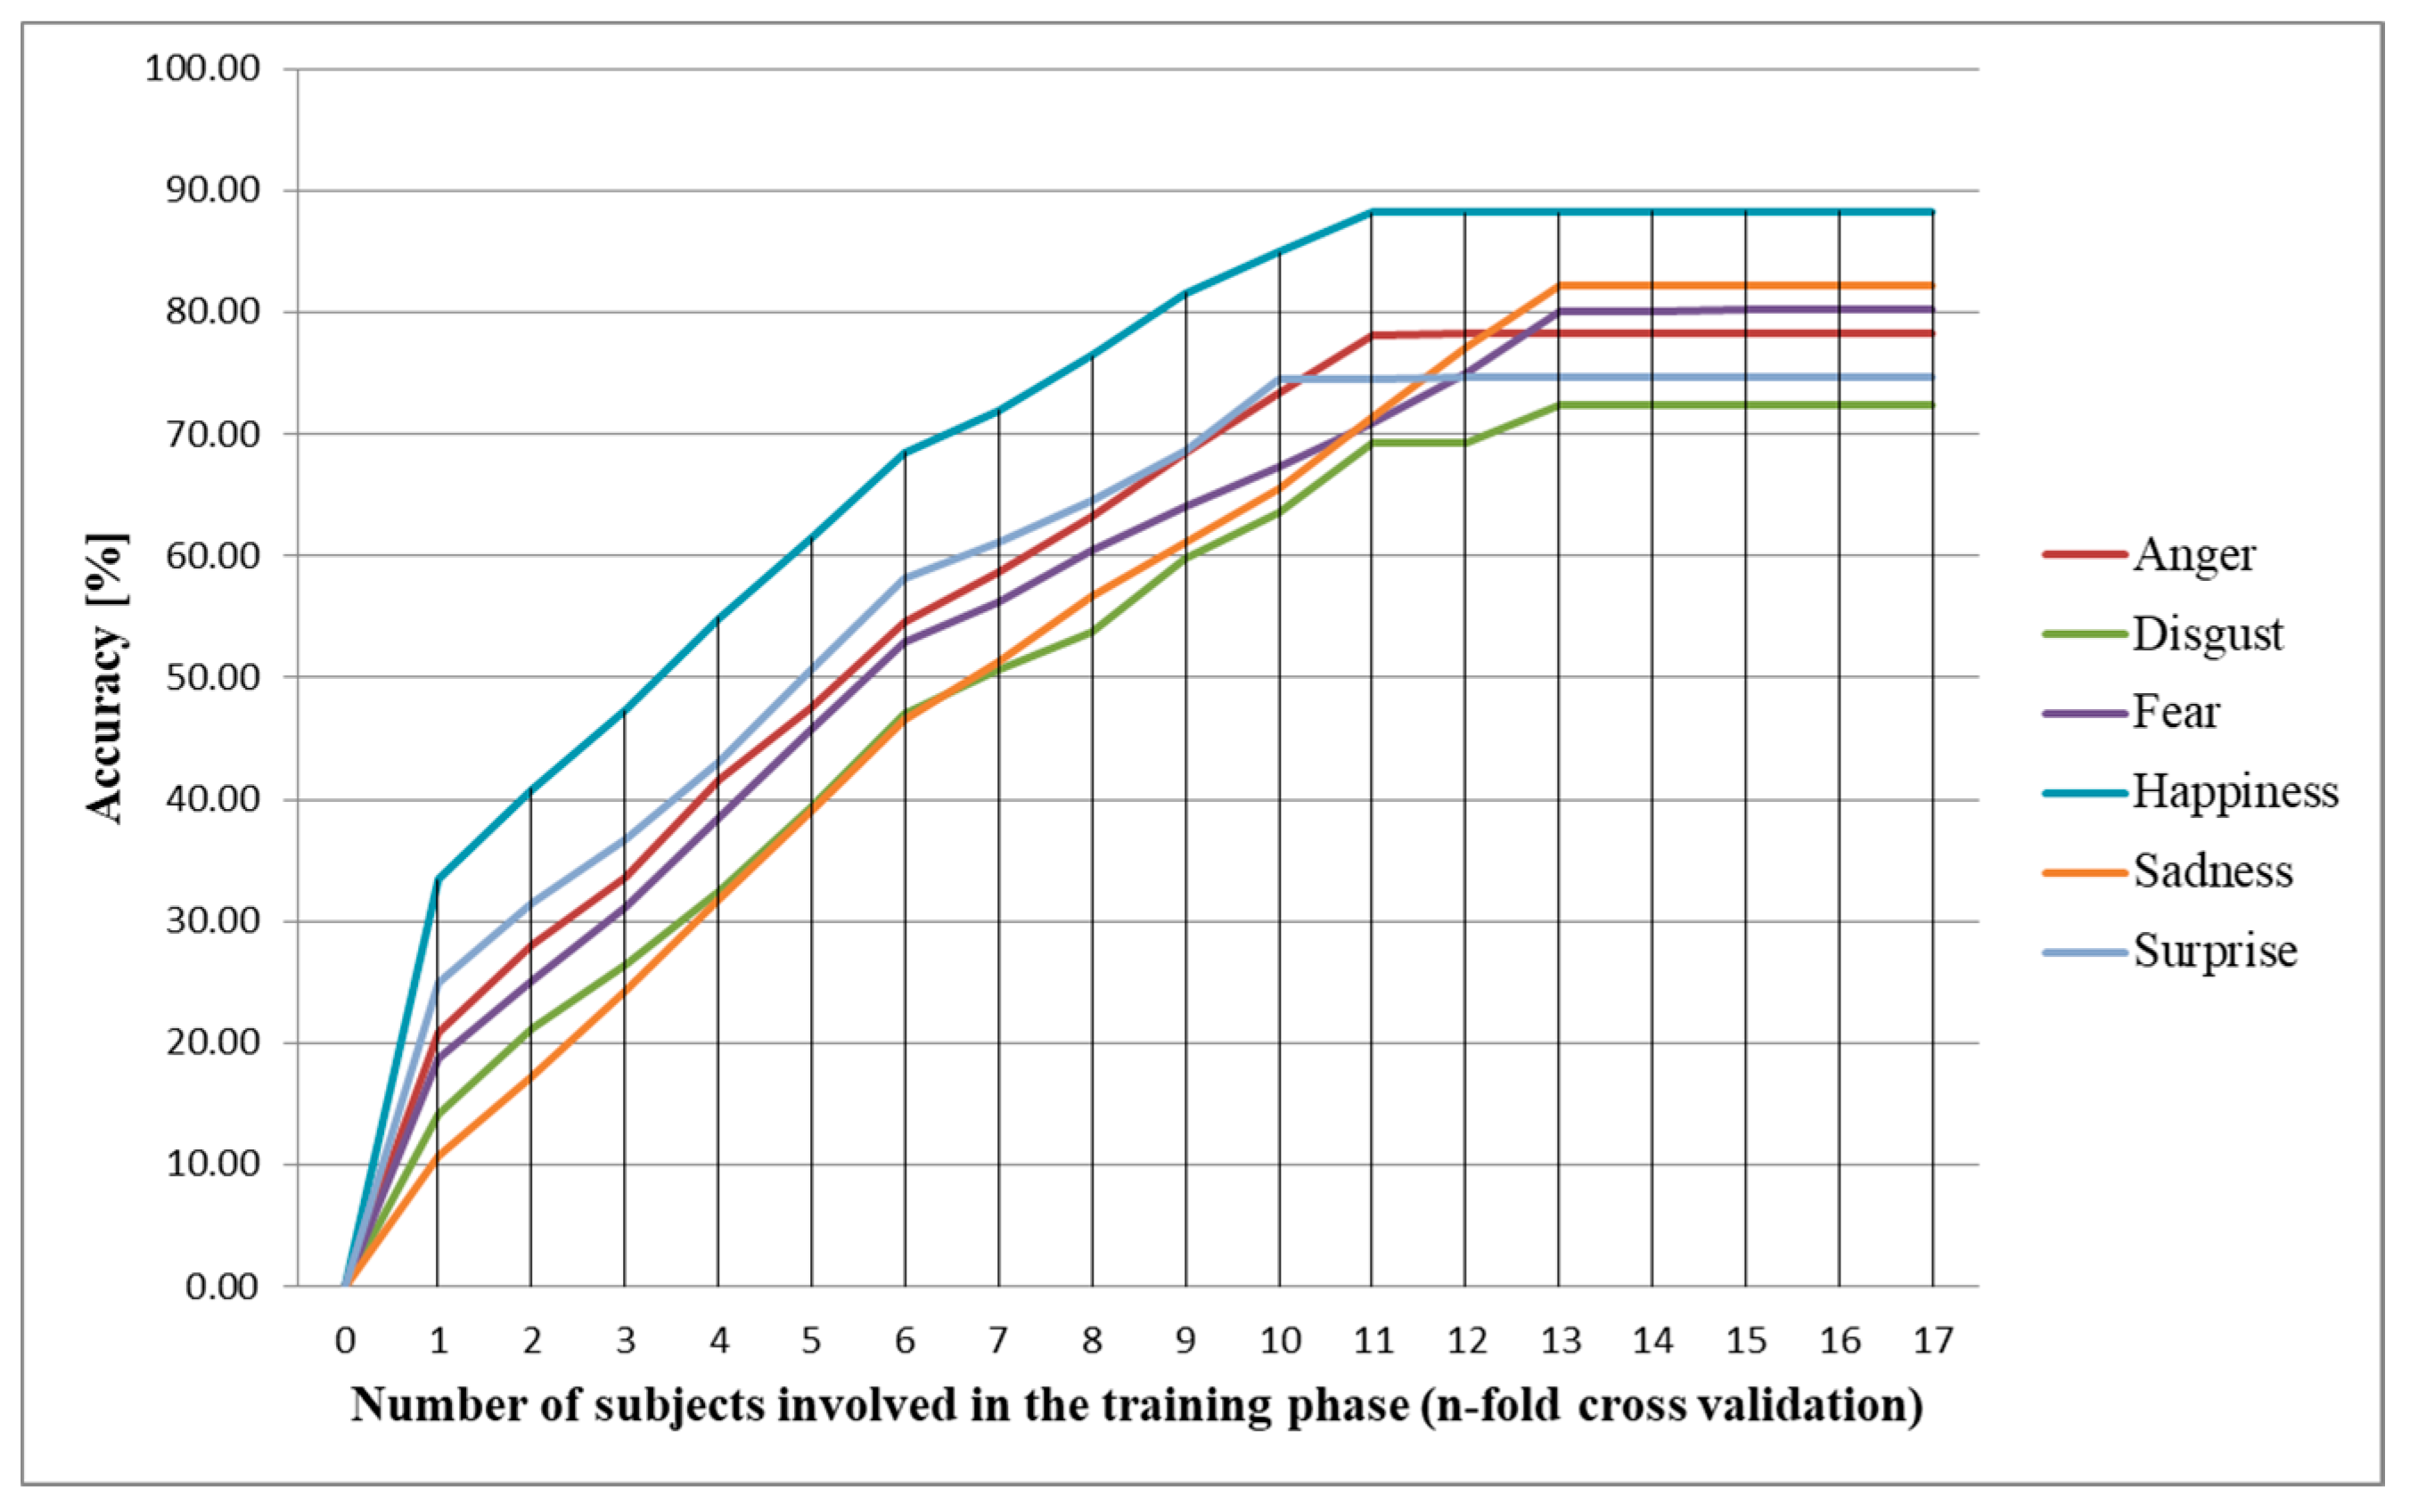
Given the 5 s needed for the proposed architecture to process 30 frames, the average time needed for emotion prediction is 78 s, significantly less than the time needed to complete DEQ. This shows again that the proposed architecture can be used to replace DEQ, with the main advantages of being suitable for real-time monitoring and reducing the subjectivity often associated with questionnaire-based methods [41]. We test the accuracy of the proposed architecture on different number of subjects used for training, and we determine an optimal number of 94 subjects (Figure 3). If we train the proposed architecture on more than 94 subjects, the prediction accuracy does not increase significantly. We obtain, similar to intra-subject methodology, the highest prediction accuracy for happiness (88.1%), sadness (81.8%), fear (80.5%), and anger (77.6%). For disgust and surprise, the prediction accuracy is lower than 73%.
2.4. Correlations Between Speech Features and Emotions
We conduct an additional study in which we aim to determine correlations between the analyzed speech features and each of the six basic emotions that can further be used to enhance the accuracy of the proposed architecture. For this, we build a background application that searches the speech matrix (SM) built in the middle layer of the architecture and determines the speech features that are present when each emotion is predicted correctly in the most practical case when we use DSC for the training phase and DSR for the testing phase. The correlations are detailed in Table 5. We observe that anger is associated with a high pitch and high zero-crossing rate (ZCR), while happiness is correlated with a high fundamental frequency (FF) and low ZCR, speech rate (SR), and pause rate (PR), as well as a high number of intensity peaks per second. The results obtained for anger, happiness, and fear, and which link them to the pitch contour, ZCR, and FF are on par with those described in previous studies [42,43], while we determine different correlations for disgust, which was previously correlated with high FF [43], while in this study, we determine it is related to low ZCR, low short-time energy (STE), median short-time energy (EAVG), low short-time energy standard deviation (ESTDEV), and low median of maximum pitch values (PMAXAVG). Although not the first study of this kind, our findings enhance previous studies [42,43] by finding correlations related to the intensity contour, speech rate (SR), pause rate (PR), and short-time energy (STE), which were not studied before.
We use these combinations to improve the prediction accuracy of the proposed architecture by predicting the emotion directly when these features are present, bypassing the top layer of the architecture containing the FFNN structure. This enhancement leads to an increase in prediction accuracy, sensitivity, and specificity with up to 6% and a decrease with 18 s in terms of processing time when we train the system on DSC, test on DSR, with a leave-one-out approach in inter-subject methodology (the most practical case).
2.5. Comparison with State-of-the-Art Methods
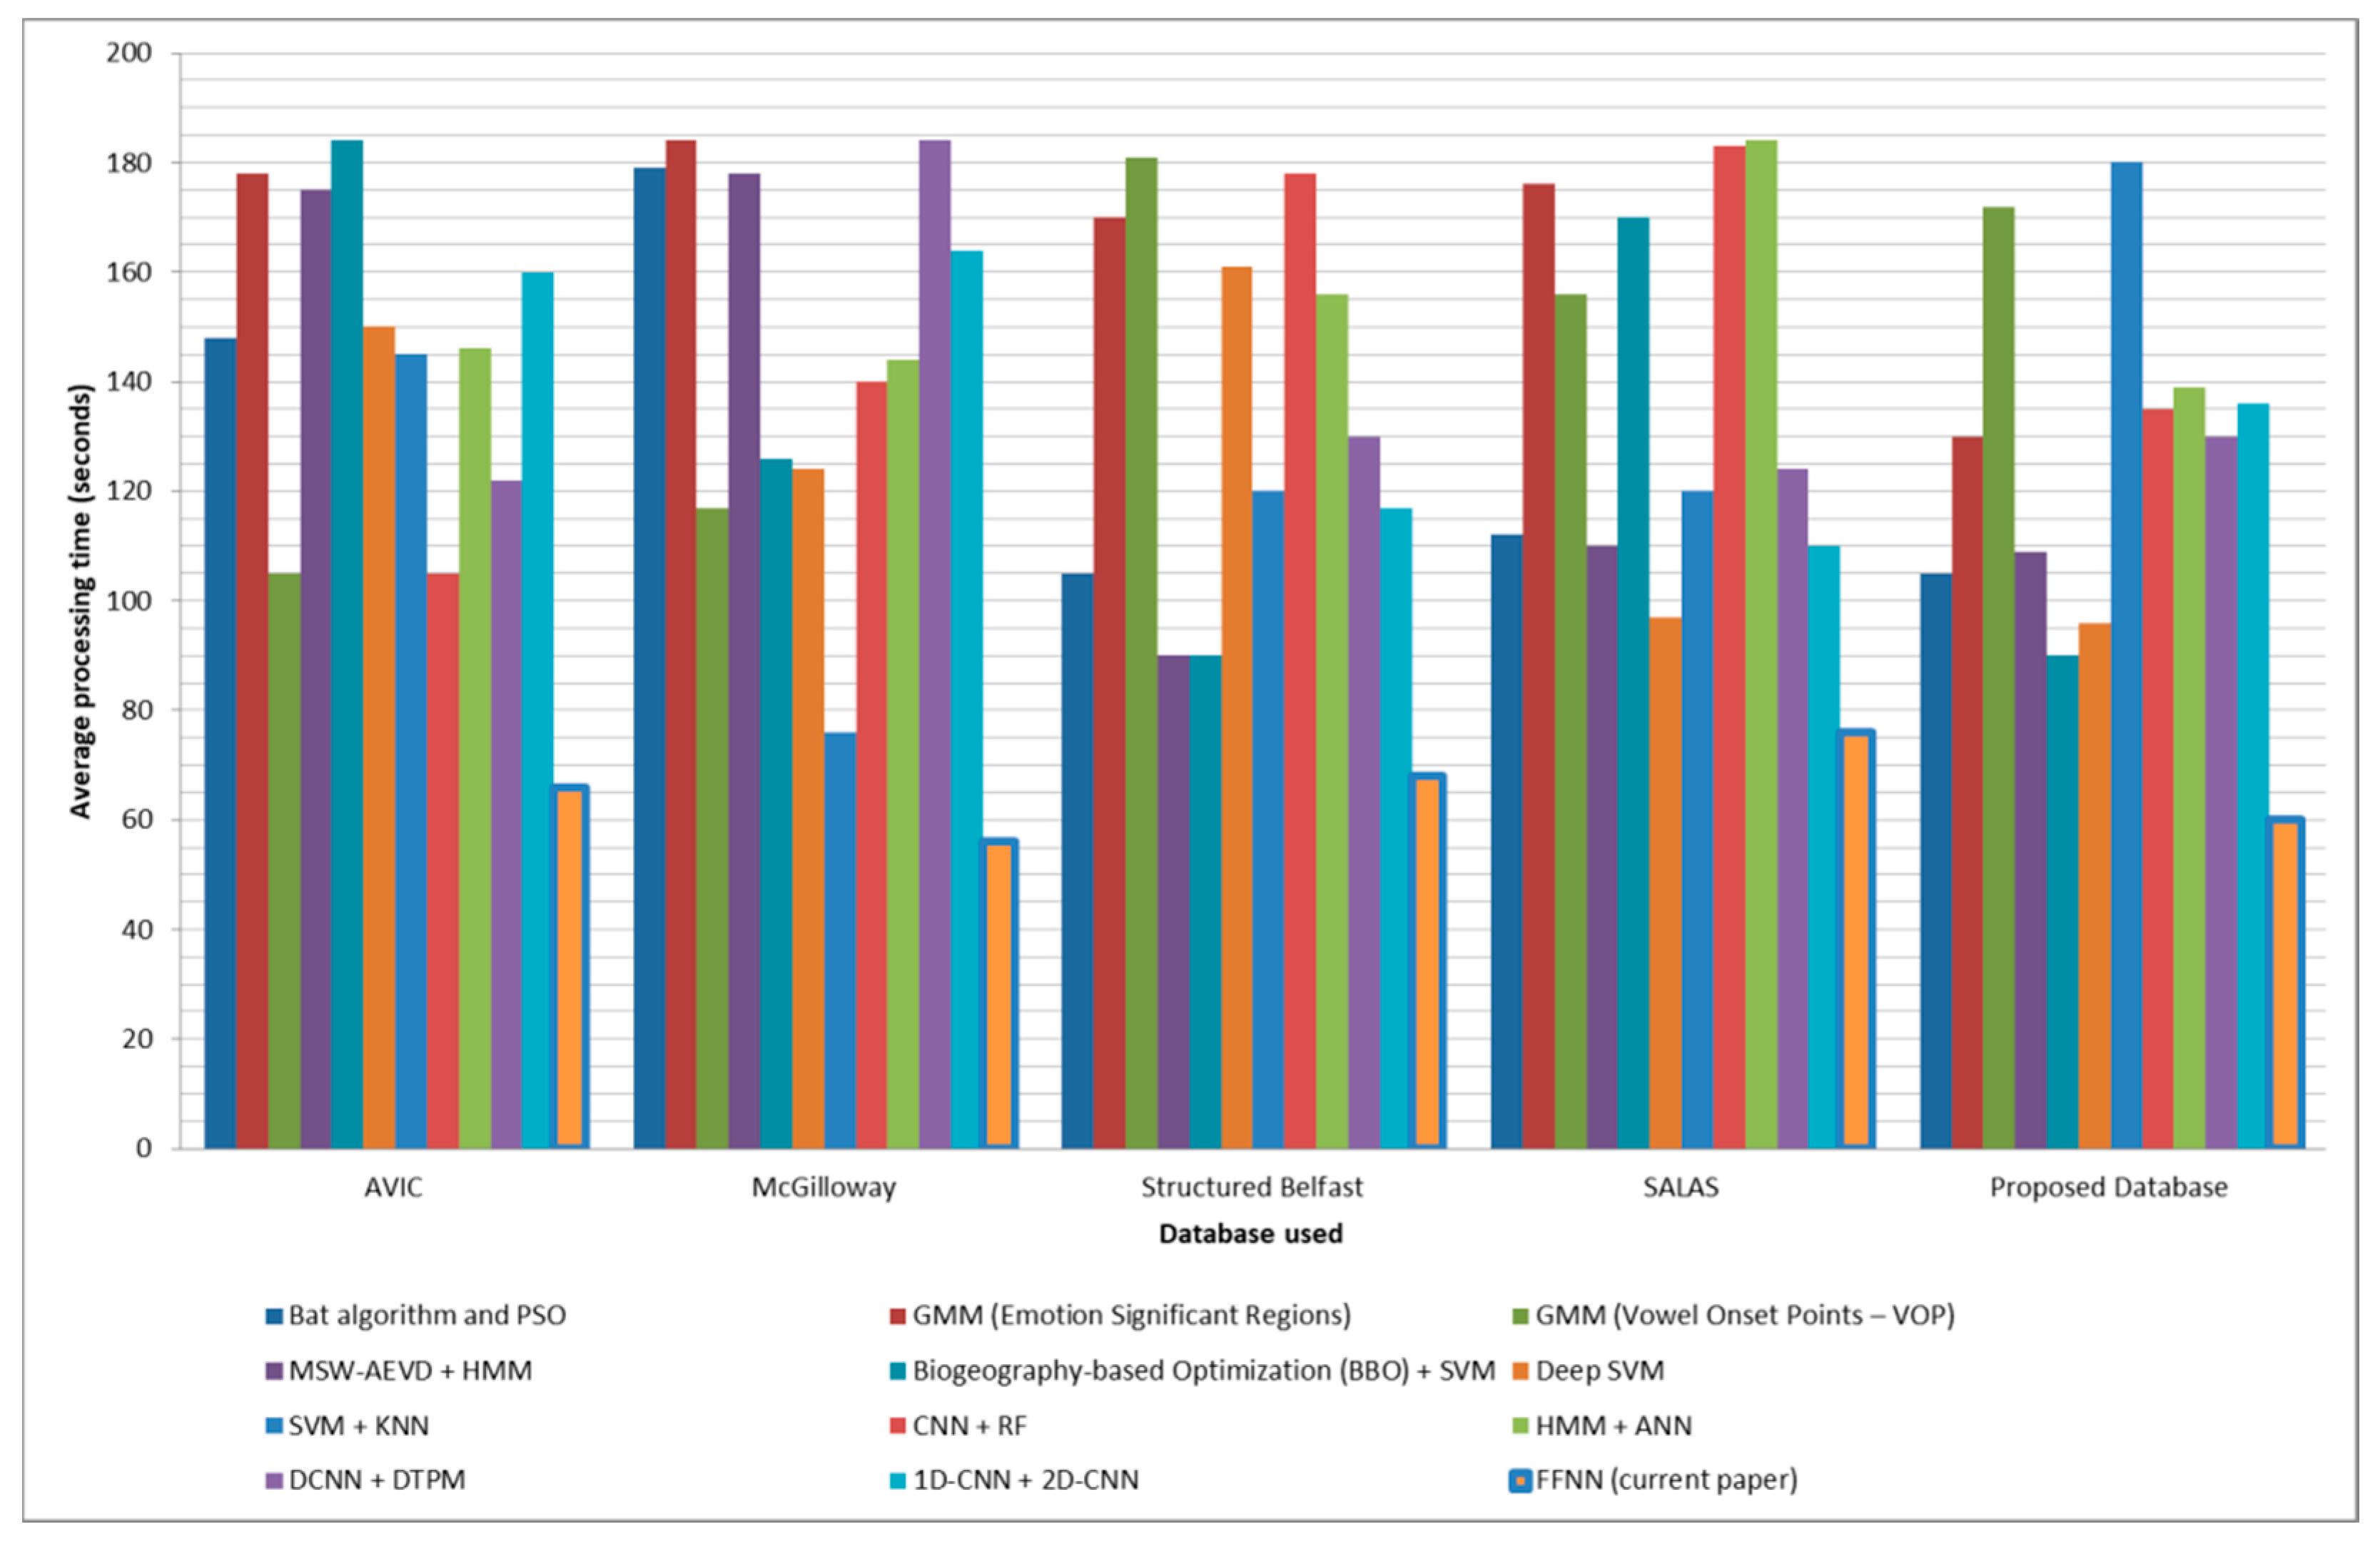
The SER system proposed in this study and enhanced to include the correlations between the analyzed speech features and the six basic emotions (as detailed in the previous paragraph) is compared with other state-of-the-art SER systems on AVIC [32], McGilloway [34], structured Belfast [35], SALAS [36], and the database introduced by this study. In testing the different state-of-the-art methods, we use the inter-subject methodology with the highest number of subjects used for training and a leave-one-out approach. The results in terms of accuracy, sensitivity, and specificity can be observed in Table 6, while comparison in terms of processing time is displayed in Figure 4.
As it can be observed, our proposed SER system surpasses with over 3% accuracy and 4% sensitivity and specificity other NN-based methods (combination of HMM and ANN-based classifiers [11], DCNN with DTPM [15], merged 1D-CNN / 2D-CNN [16], and combination of CNN and RF [12]) when tested on all five databases. Moreover, the proposed system offers higher accuracy, sensitivity, and specificity compared to other non-NN-based SER systems on McGilloway [34], structured Belfast [35], SALAS [36], and the database proposed in this study. When tested on the AVIC database [32], the state-of-the-art method offering the most accurate predictions remains the one based on Bat algorithm and PSO [5]. This shows that our system performs well at predicting emotions that are stimulated, while for emotions collected in naturalistic conditions other methods offer higher accuracy and could be fused with the proposed FFNN-based method to reach better accuracy.
The proposed SER system is the fastest in the literature (as it can be observed in Figure 4) surpassing other state-of-the-art methods with up to 36 s in terms of average processing time, and also proves to be robust, offering over 73% accuracy and similar processing time across all five databases.
3. Discussion
In this study, we propose a non-invasive architecture for predicting emotions based on speech. The proposed architecture is tested in both intra-subject and inter-subject methodologies using a new database introduced in this paper, with the purpose of determining how the emotional stimuli affect the accuracy of the proposed architecture and what approach is the most suitable for practical use. The proposed database is divided into two datasets, a controlled one containing utterances where emotion is stimulated, and a random one containing utterances collected in naturalistic conditions. In both intra-subject and inter-subject methodologies we show that the controlled dataset enhances the prediction accuracy of the proposed architecture only if it is used in the training phase, while, if it is used for testing, the prediction accuracy is similar to the one obtained when the random dataset is used for this phase. This shows that the proposed architecture is practical: For intra-subject methodology, the analyzed subject only needs to watch and comment emotion-stimulating videos once for training the system while further assessments of the emotion can be done in random conditions; for inter-subject methodology, the analyzed subject does not have to watch any emotion-stimulating videos, the proposed architecture is pre-trained using emotion-stimulated utterances collected from another set of subjects used for training. Therefore, in both methodologies, for testing the system, we do not need an emotional stimulus, which makes the proposed architecture practical and an attractive alternative for replacing the standard questionnaire.
We obtain an accuracy of 83.25% for intra-subject methodology and 80.75% for inter-subject methodology, with 72 s (intra-subject) and 78 s (inter-subject) as the time needed for the proposed architecture to converge to a stable prediction. The time needed for predicting emotions is significantly lower than the one needed for filling in DEQ, making our proposed architecture attractive for replacing the questionnaire with the advantages of being suitable for real-time monitoring and being less prone to bias. We also conduct a study to determine possible correlations between the analyzed speech features and the evaluated emotions and we confirm the findings of previous studies [42,43] for anger, happiness, and fear, as well as determine new correlations between disgust and low ZCR, low short-time energy (STE), median short-time energy (EAVG), low short-time energy standard deviation (ESTDEV), and low median of maximum pitch values (PMAXAVG). Our findings also enhance previous studies [42,43] by finding correlations related to the intensity contour, speech rate (SR), pause rate (PR), and short-time energy (STE), which were not studied before. Using these correlations, we modify the proposed architecture, leading to an increase in accuracy of up to 6%, most emotions (except disgust) being predicted with over 80% accuracy. The highest accuracy is obtained for happiness (90.4%), sadness (84.3%), fear (83.2%), and anger (82.3%). Disgust and surprise are predicted with lower accuracy, mainly because these emotions have a more dominant facial expression compared to how they affect speech.
We show that the proposed SER system offers higher accuracy, sensitivity, and specificity than other NN-based SER systems, as well as the lowest average processing time, surpassing other state-of-the-art methods with up to 36 s. The system also proves to be robust, offering over 73% accuracy and similar processing time across different databases, and is only surpassed by the method based on bat algorithm and PSO [5] on naturalistic databases, showing that the proposed SER system performs very well at predicting emotions that are stimulated, while for emotions collected in naturalistic conditions, other methods offer better results and can be fused with the proposed FFNN-based method to reach higher accuracy.
Given the high accuracy, the proposed architecture can be successfully used in HCI based on speech interaction. The computers that use voice to communicate with humans can adapt their message and intonation to match that of the user, simulating empathy. The proposed architecture can be integrated with computer-mediated education systems and give the tutor the ability to determine the emotions of the students and adapt the content of the course to improve the learning rate [47]. Similarly, the computer system of a car or plane can benefit from this architecture by detecting emotionally tense situations or negative emotions that are affecting the driver or the pilot and take preventive safety measures, such as stopping the car or informing the control tower [30,31]. As the emotional patterns can be used to determine different mental disorders [24,25,26] as well as physical diseases [27], the proposed architecture can be used for real-time monitoring and analysis of these patterns. The proposed architecture can also help people suffering from autism spectrum disorder (ASD) to better communicate with others and integrate into society [48,49,50]. Of course, the proposed architecture can be integrated into call center departments to analyze agent conversations and determine their as well as their customers’ emotions, providing advice on how to improve the customer satisfaction and quality of the service [22,23]. Analyzing the speech from phone conversations or suspect interrogation and studying the emotional patterns can also help crime investigation departments to find the perpetrator [28,51]. Nonetheless, analyzing 911 calls can determine the genuineness of the call and flag possible false calls as well as sort the calls based on the emergency level predicted based on callers’ speech [28].
As a path forward, other speech features can be analyzed and integrated into the proposed architecture with the purpose of improving the prediction accuracy, as well as fuse the speech analysis, with the analysis of facial expressions, gestures, or body posture. Also, other types of neural networks (CNN or recurrent neural networks—RNN) or other algorithms like those based on RF, SVM, or PSO can be fused with the proposed architecture to improve the accuracy of the system in both naturalistic as well as emotion-stimulated scenarios, and reduce the prediction time. Increasing the number of samples from the database and adding different scenarios in which utterances are collected could also provide richer and more relevant information for the FFNN-based structure to output better predictions. All these can be explored to improve the proposed architecture’s prediction accuracy, sensitivity, specificity, and processing time.
4. Materials and Methods
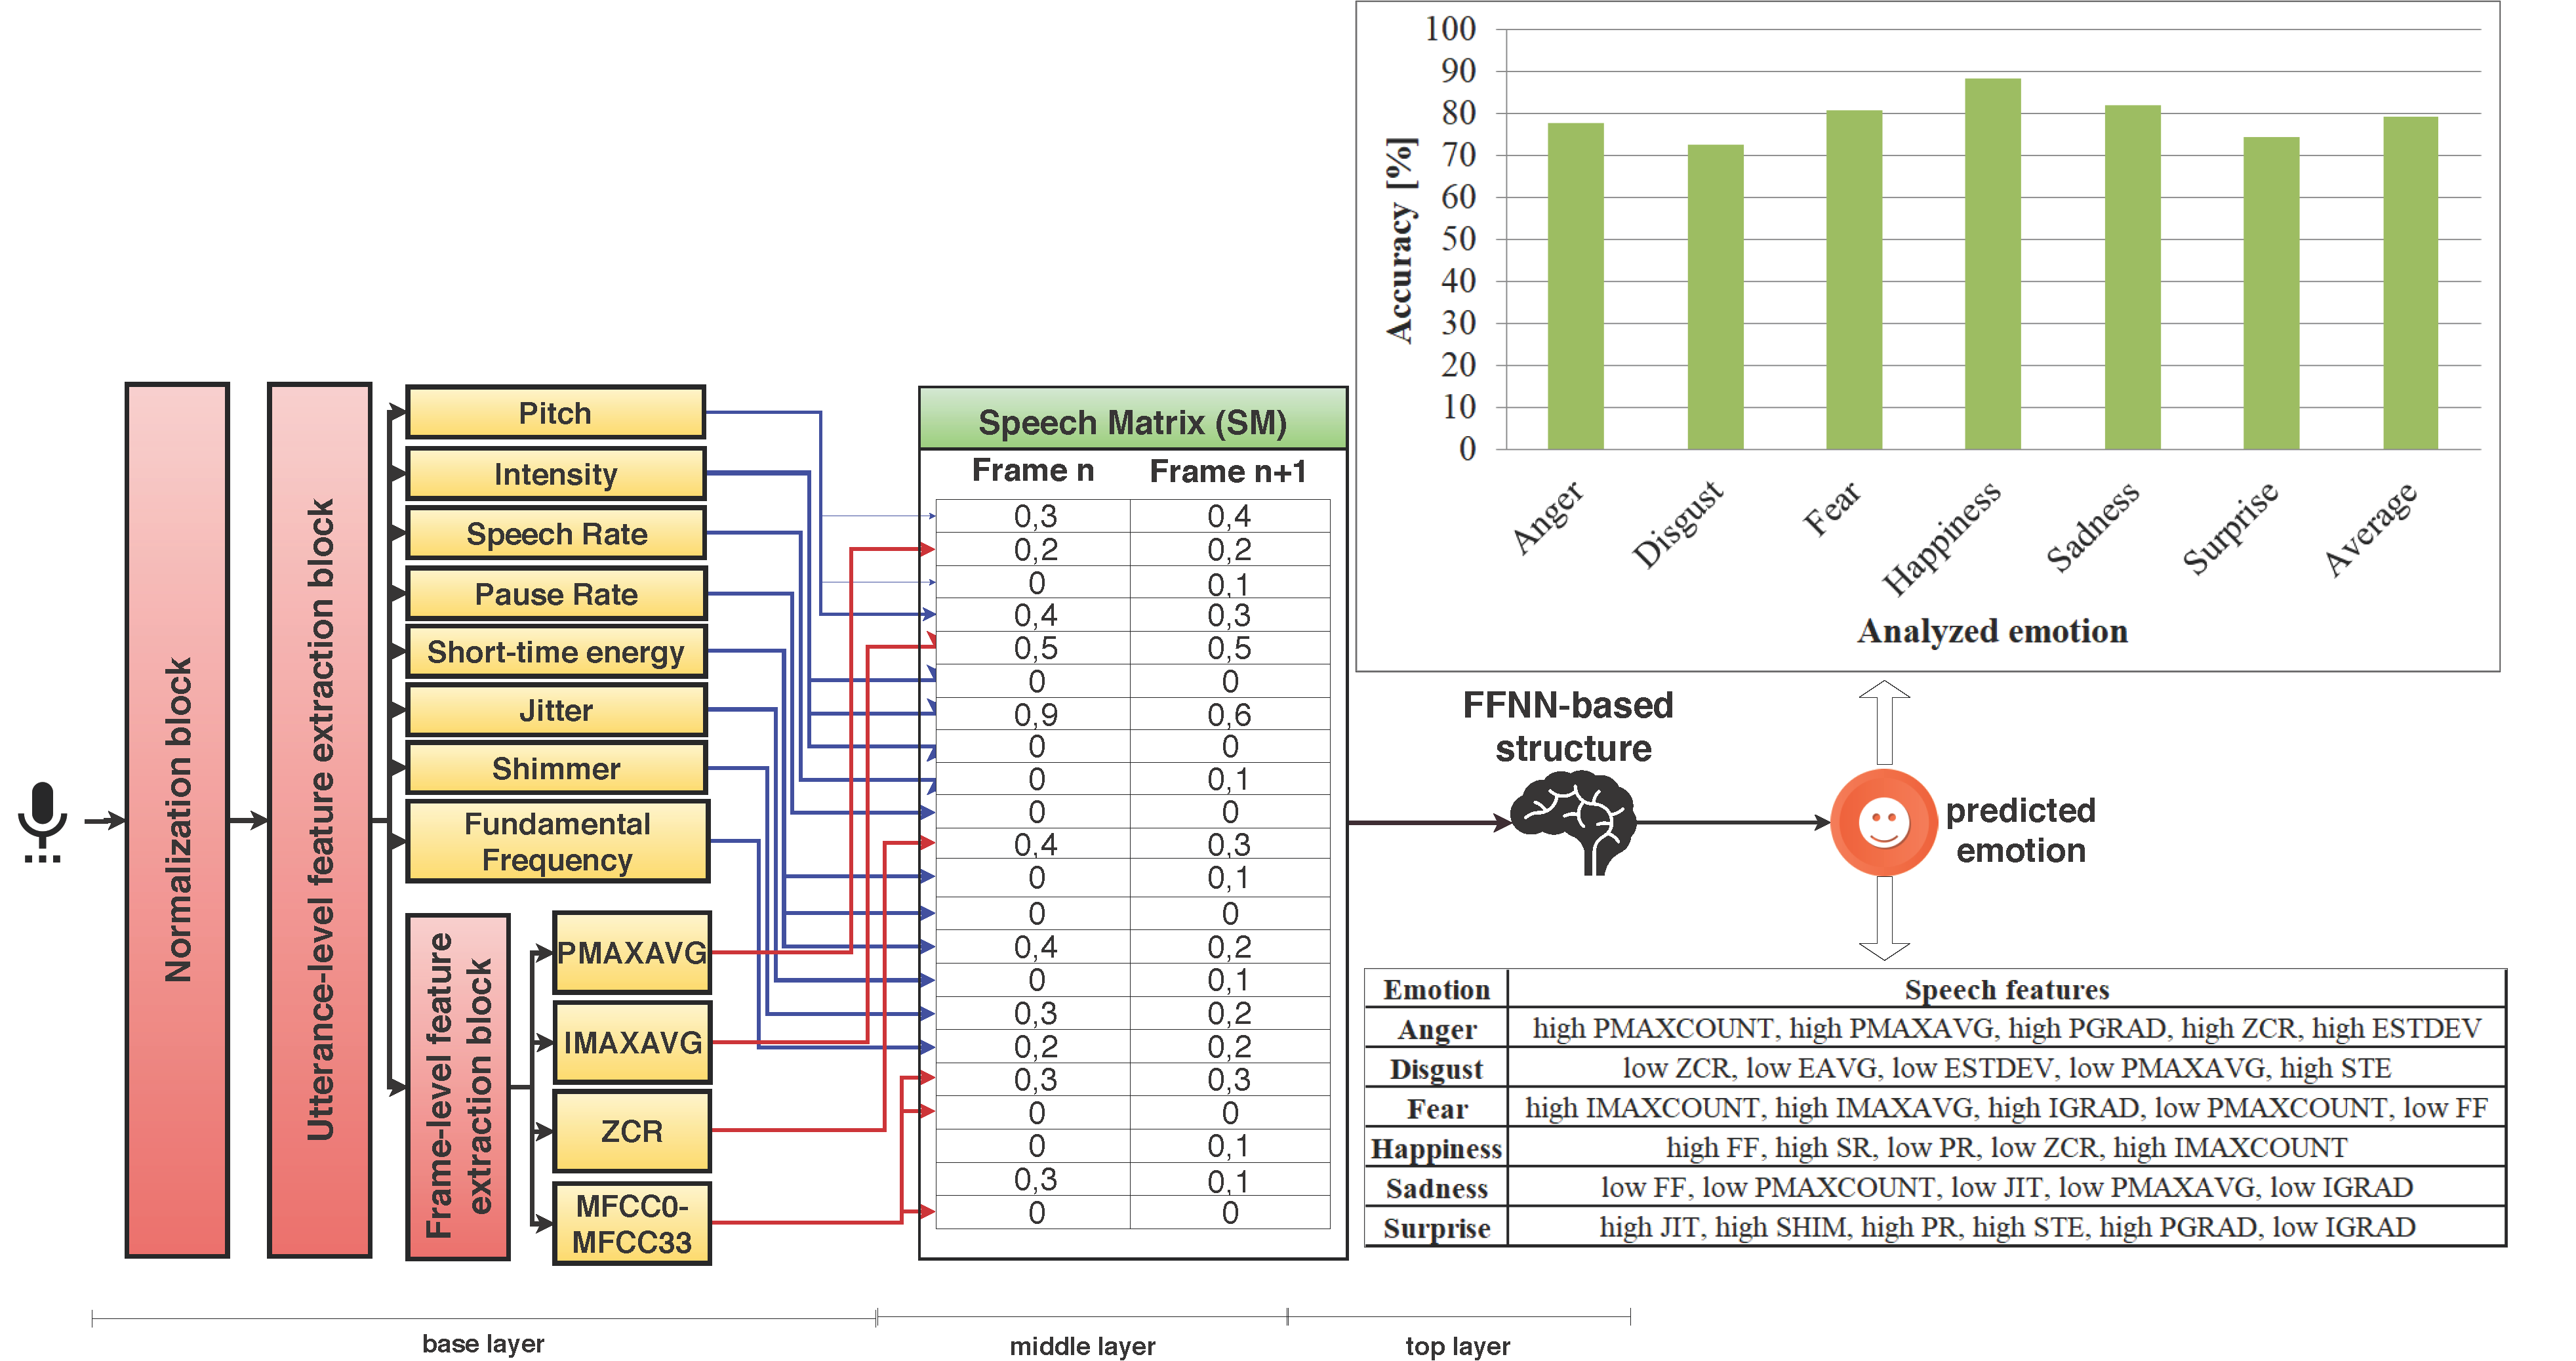
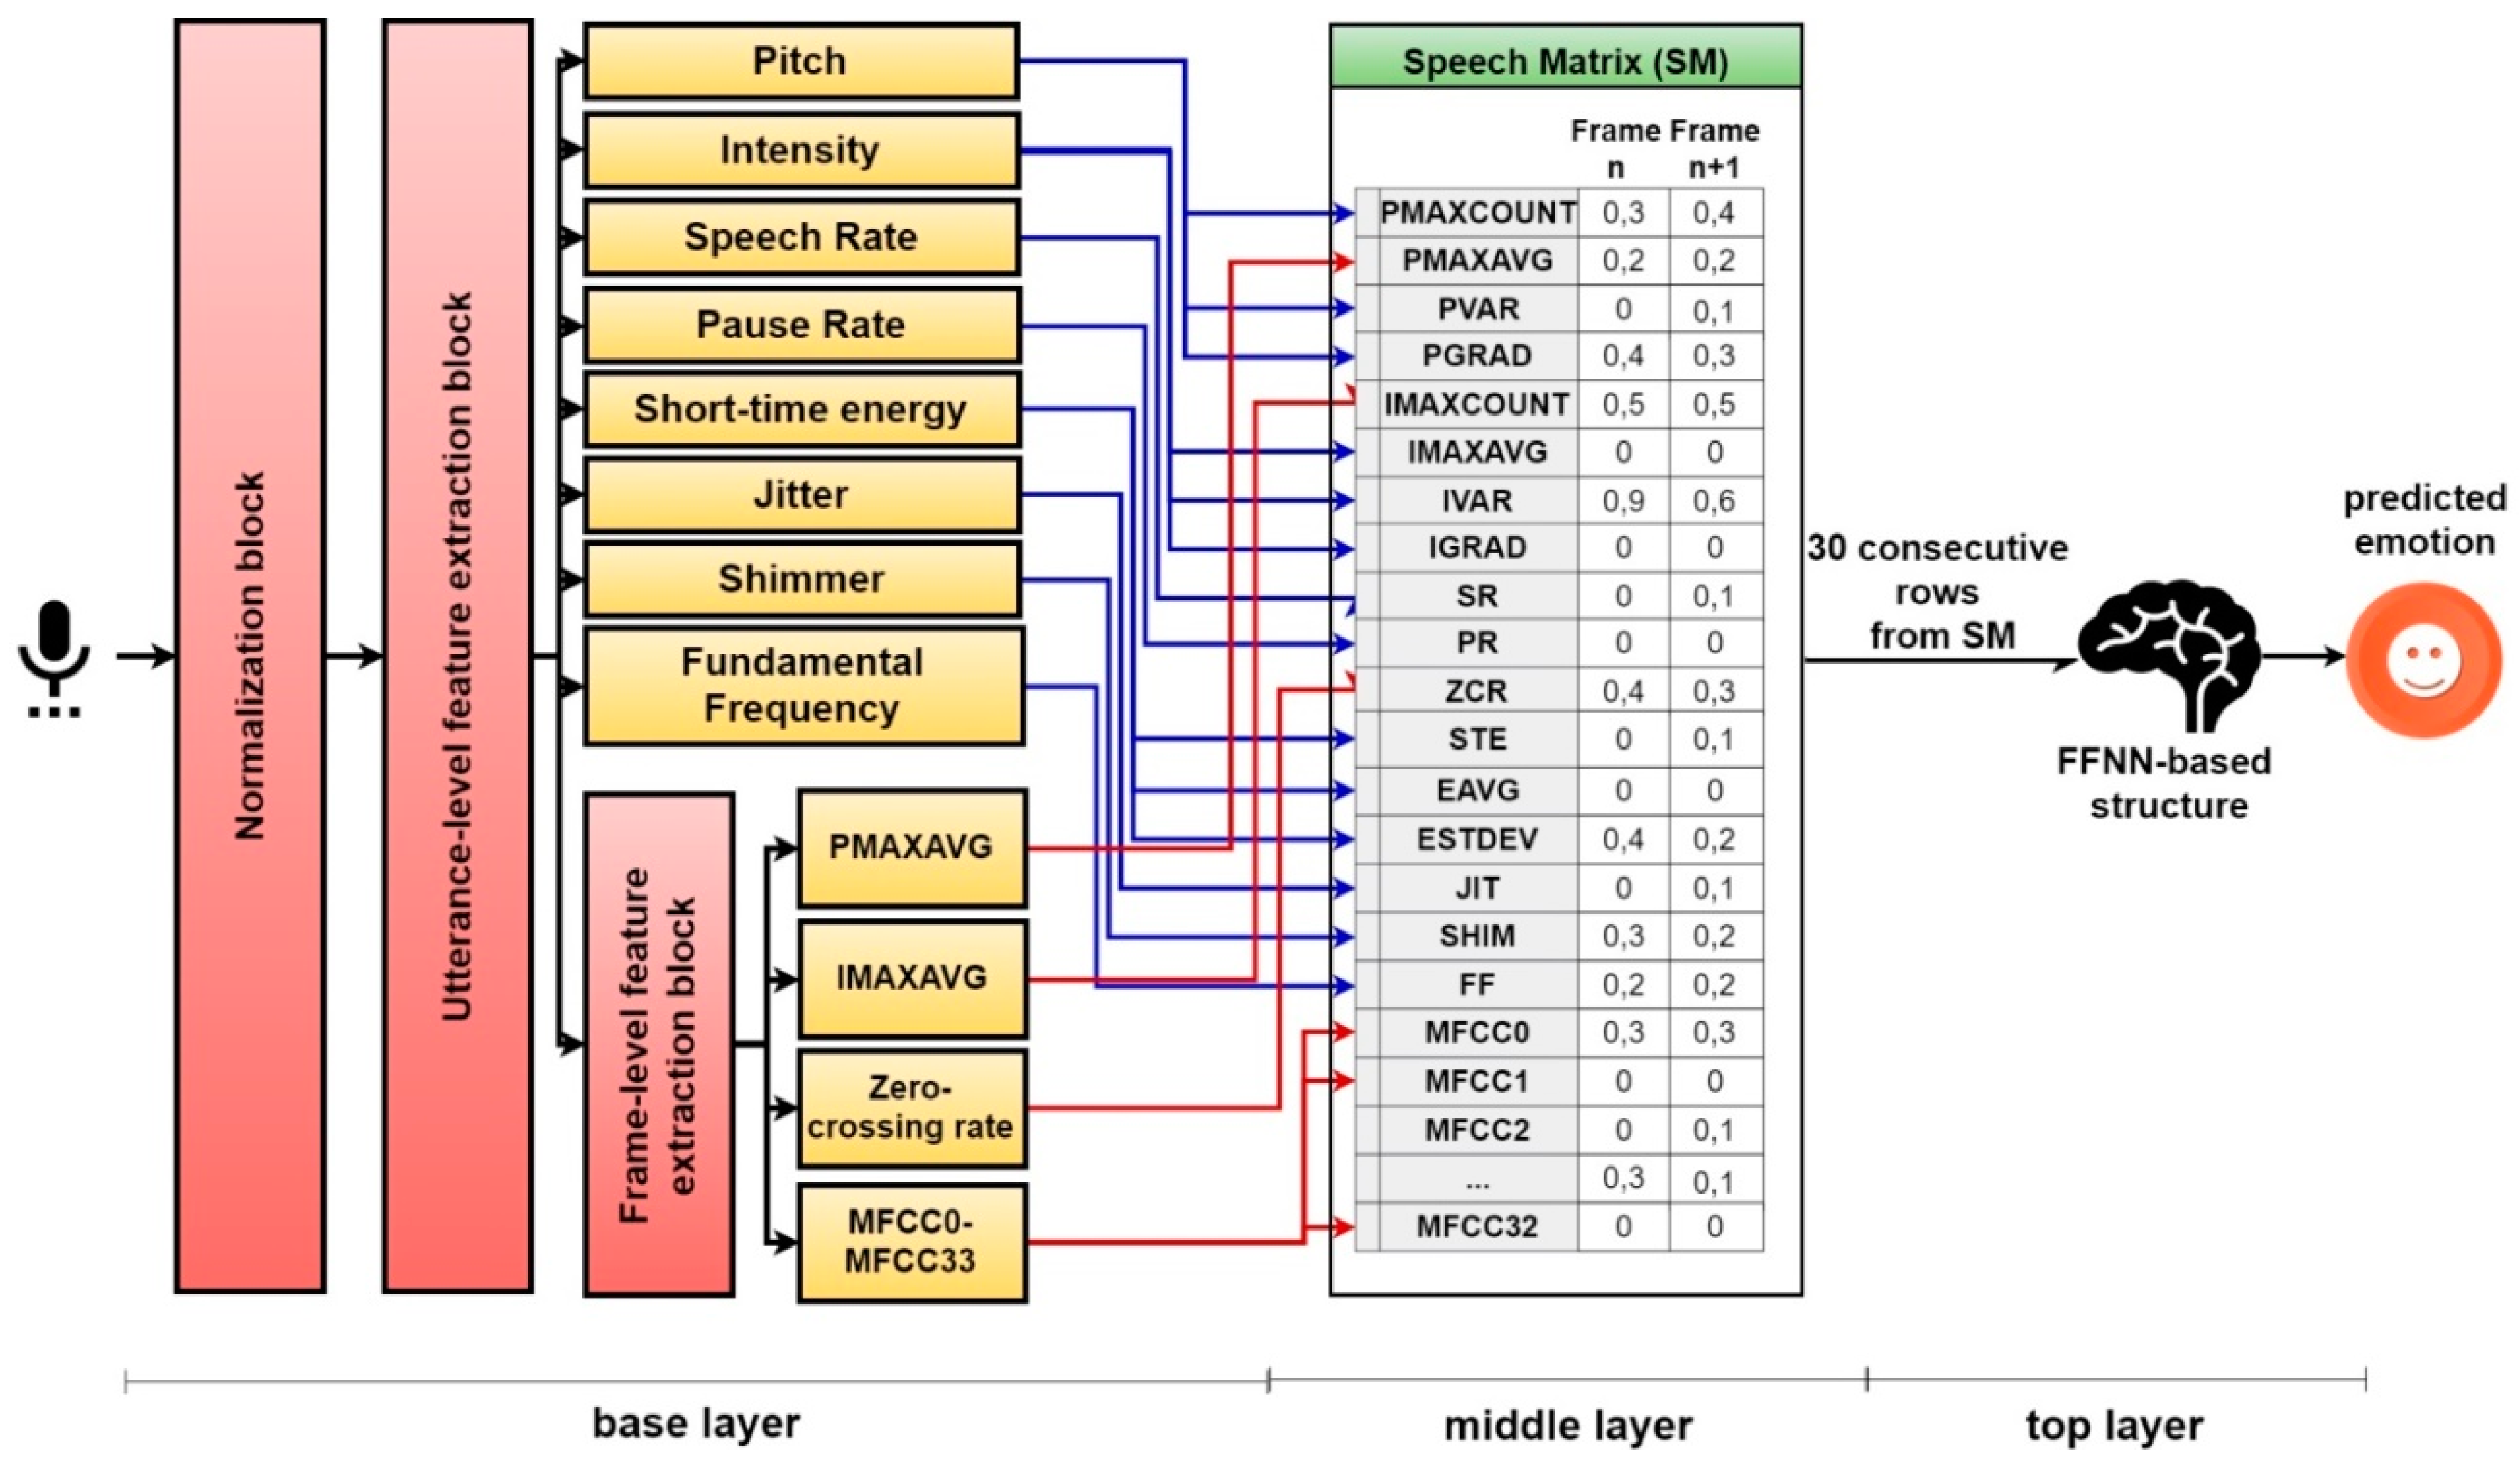
The architecture proposed in this paper has an unique structure based on three layers: A base layer where the speech is analyzed and speech features are classified in [0,1] interval, a middle layer in which a matrix is built based on the classification results provided by the base layer, and a top layer where an FFNN-based structure analyzes the patterns from the middle layer and predicts the emotion of the subject. In the following paragraphs, the three layers are detailed.
4.1. Base Layer
The base layer has the main purpose of analyzing the speech signal and classifying a set of speech features. It is divided into three main blocks: Normalization block, utterance-level feature extraction block, and frame-level feature extraction block.
Because the speech signal contains noise caused by the acoustic background or the acoustic signals produced by the instrument used for recording the voice, as well as due to the variability of recording scenarios and speaking styles of the subjects, the first step is to normalize the speech signal which is done in the normalization block. For this, we initially apply a noise reduction filter based on spectral subtraction [52], being an efficient method with a low computational cost. We continue with energy normalization in order to compensate for different recording scenarios from different databases. We scale the vocal signals such that the average energy of the utterance is the same as the average energy of all the utterances from the database used for training the system. We use cepstral mean normalization (CMN) with Bayesian networks (BN) [53] because it is efficient, fast, and computationally less costly compared to other methods. Finally, we perform pitch normalization to compensate for the variations caused by different types of voice. We use the method based on semitones [54] because it is largely used in similar research and is efficient in problems related to speech analysis. Because we want the system to analyze voice in real-time, we process the utterance frame-by-frame, therefore normalization is applied initially to the first frame, then it is refreshed with every new frame provided as input by taking into account the frames from the last 7 s (this temporal threshold is determined as optimal through trial-and-error in order to comprise at least two vocal pauses and allow the refreshing of the spectral subtraction algorithm). For the first 7 s of the utterance, we use only the existing frames (for example, when we fetch the first frame of second 4, we analyze the first 3 s together with this frame).
After the speech signal is normalized, we extract the speech features at utterance and frame levels. As mentioned before, there are a large number of speech features that can be used and selecting a proper subset of these features is very important to ensure that the selected features contain the right amount of emotional information, but also to avoid the redundancy caused by selecting too many features [55] and overfitting the FFNN structure. Because they are largely used in similar papers [28] and because they are robust and can be evaluated using computationally less costly methods, we use the following speech features in this study [56]: Pitch contour (evaluated by computing the number of peaks per second—PMAXCOUNT, the median of maximum pitch values—PMAXAVG, the variance of maximum pitch values—PVAR, and the pitch gradient—PGRAD), the intensity contour (number of peaks per second—IMAXCOUNT, the median of maximum intensity values—IMAXAVG, the variance of maximum intensity values—IVAR, and the intensity gradient—IGRAD), the speech rate (SR), the pause rate (PR), the zero-crossing rate (ZCR), the short-time energy (evaluating its position—STE, median—EAVG, and standard deviation—ESTDEV), the jitter (JIT), the shimmer (SHIM), the fundamental frequency (FF), and 33 MFCC coefficients.
In the utterance-level feature extraction block, we analyze the last 7 seconds of the utterance every time a new frame is provided as input. The speech features analyzed in this block are PMAXCOUNT, PVAR, PGRAD, IMAXCOUNT, IVAR, SR, PR, STE, EAVG, ESTDEV, JIT, SHIM, and FF. In the frame-level feature extraction block, we analyze PMAXAVG, IMAXAVG, ZCR, JIT, SHIM, and the 33 MFCC coefficients (MFCC0 ... MFCC32). All the values are normalized in [0,1] interval using min–max normalization [57], the minimum and maximum being determined based on all utterances used for training. All the features used in this paper are extensively employed in similar systems [28]. For example, pitch, intensity, fundamental frequency, speech, and pause rate are shown to be efficient for identifying different types of emotions [28], being correlated with the quantity of energy needed for expressing emotions. When a subject is affected by anger or happiness, speech has a higher fundamental frequency and speech rate and a lower pause rate, as well as higher pitch and intensity variations.
4.2. Middle Layer
For every frame provided as input to the base layer, we classify 50 speech features, which are sent to the middle layer and stored in a speech matrix (SM). Therefore, SM contains the normalized classifications for each feature. For each analyzed frame in the utterance, a row is stored in the matrix with the following structure: [PMAXCOUNT] [PMAXAVG] [PVAR] [PGRAD] [IMAXCOUNT] [IMAXAVG] [IVAR] [IGRAD] [SR] [PR] [ZCR] [STE] [EAVG] [ESTDEV] [JIT] [SHIM] [FF] [MFCC0] [MFCC1] [MFCC2] [MFCC3] [MFCC4] ... [MFCC32]. When we have 30 consecutive unprocessed rows in SM, we provide them as input to an FFNN-based structure in the top layer, which analyzes them in a pattern recognition task with the purpose of predicting the emotion of the subject. The threshold of 30 consecutive frames is determined as optimal through trial-and-error. In Figure 5, we can observe the structure of the base and middle layer.
4.3. Top Layer
In the top layer, we use an FFNN-based structure to evaluate the patterns from SM and output predictions related to the emotion of the subject. We test different combinations of FFNN-based structures in order to determine which of them provides the highest accuracy. We use FFNNs and no other types of neural networks because they are successfully used in image processing and speech recognition, offering the ability to classify inputs efficiently when they are severely affected by noise or are non-linear [58], conditions we face in this case as well. We have initially performed several tests using more than two hidden layers, which led to high processing times (over 120 s per 1 s of analyzed utterance), often being affected by the vanishing gradient problem mainly due to the high number of speech features analyzed (resulting in a high number of input nodes), while using one or two hidden layers proved to be faster and offer better prediction accuracy. With this in mind, and since we aim to build a system able to recognize emotions in real time, we evaluate only two types of FFNNs: With one hidden layer or with two hidden layers. In terms of activation functions, we evaluate tanh, sigmoid, ReLU, and softmax. Because ReLU offers outputs in (0,+ ∞) interval, and it is affected by the exceeding gradient problem [59], we evaluate it only for the hidden layers. On the other side, softmax is an activation function, which is inefficient in hidden layers [60], and we evaluate its use only for the output layer. As a training method, backpropagation is used as it is largely employed for training FFNNs and for pattern recognition tasks [61]. We use the Nguyen–Widrow method [62] for initializing the weights in the initial state. We use gradient descent for optimizing the weights and biases and minimize the average absolute relative error to less than 0.02. AARE is calculated using the formula below, with being the expected value and the estimated value:
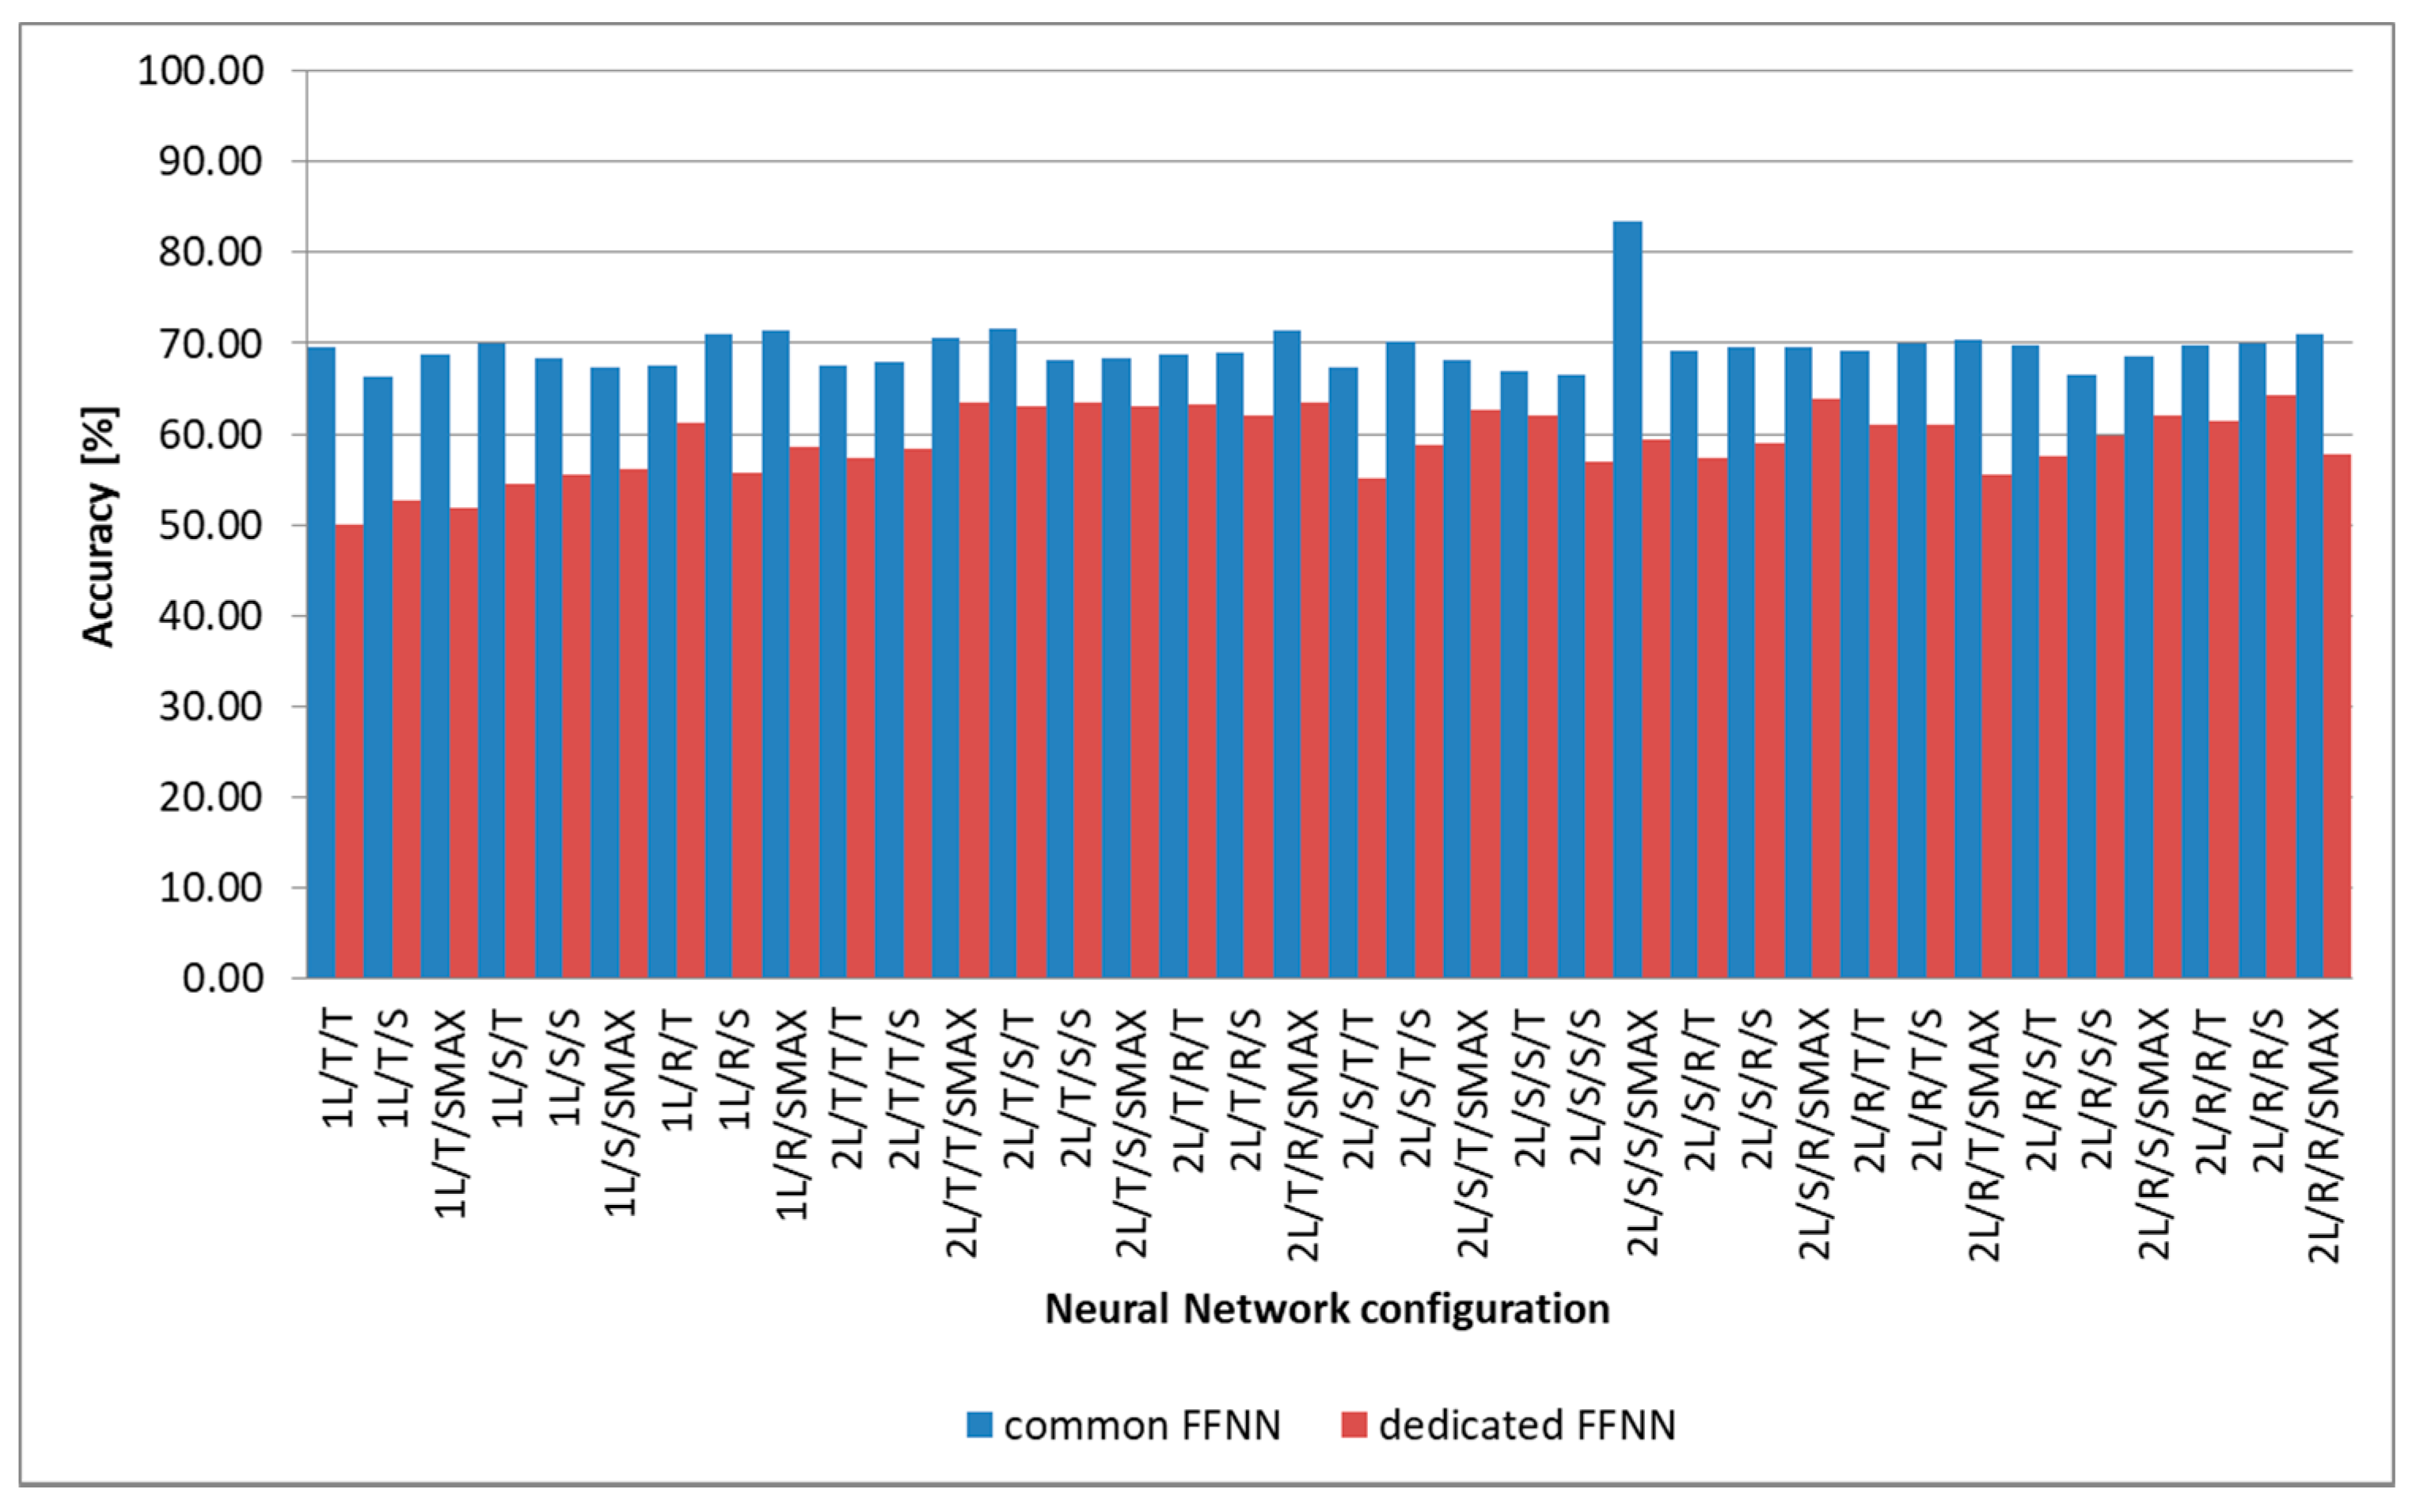
On top of testing FFNN with different number of hidden layers and different activation functions, we also test different combinations of FFNN structures: One FFNN for all six emotions or dedicated FFNNs for each emotion. The results of all the tests conducted can be observed in Figure 6.
We determine the highest accuracy when we use a single FFNN to predict all six emotions. This shows that, from a speech point of view, emotions are strongly correlated; analyzing all emotions with a single FFNN offering better results than when having dedicated FFNNs for each emotion.
The optimal FFNN has two hidden layers, both having sigmoid as activation function, while for the output layer the optimal activation function is softmax. Because we analyze 50 speech features, and the top layer receives 30 consecutive rows from SM, the number of input neurons is 1500, normalized in [0,1] interval. The FFNN has six output nodes, one for each of the six emotions, also normalized in [0,1] interval and represent the probability for the subject to be affected by each of the six emotions. We evaluate different number of neurons in the two hidden layers, and the results are observed in Figure 7. We determine as optimal 840 hidden nodes in the first hidden layer and 40 for the second hidden layer. We name this optimal FFNN – Speech Emotion Neural Network (SENN) - and its structure can be observed in Figure 8 where we denote the matrix of weights between the input layer and first hidden layer, the matrix of weights between the first and the second hidden layer, and the matrix of weights between the second hidden layer and the output layer, the number of hidden nodes from the first hidden layer, and the number of hidden nodes from the second hidden layer. The optimal learning rate is 0.04, the optimal momentum is 0.2, and a bias is needed in the second hidden layer. Further, 6000 training epochs are needed, and the training process lasts 6 h.
As mentioned previously, the proposed architecture is built in Scala as a programming language, using Spark library, a java virtual machine (JVM) with Eclipse as integrated development environment (IDE). It has a complexity of approximately 6000 code lines and runs on a testbed with Intel i7 processor, 8 GB of RAM, and Linux Solaris 11.3 as the operating system.
4.4. Training and Testing Phases
The architecture functions in two phases: training and testing.
In the training phase, utterances from the dataset used for training are provided as input, frame by frame, to the base layer for normalization, and the features at utterance and frame level are extracted and provided to the middle layer. The middle layer builds the SM with the results provided by the base layer and contains a row for each frame, storing the classifications of all speech features in that given frame. When 30 new rows are present in SM, they are sent to the top layer where SENN is trained through backpropagation, comparing the predicted outcome with the expected one and modifying the weights until AARE is minimized (<0.02) or the training dataset is exhausted.
In the testing phase, the system receives as input utterances that are different from the ones used in the training phase, which are normalized, similarly to the training phase. The 50 speech features are classified in the base layer, and the results are sent to the middle layer, which builds SM. When 30 new rows are present in SM, these are sent to the top layer where the previously trained SENN provides six outputs in [0,1] interval, representing the probability for the subject to be associated with each of the six emotions. A final rule-based classifier (RBC) is used to collect the results obtained from the output neurons of SENN and provide a final result. If the same result is provided by SENN for 5 consecutive s, the emotion with the highest probability is offered as a final output, representing the predicted emotion for the subject whose utterance is analyzed. Otherwise, the RBC outputs Undefined, which means that the information is insufficient for a prediction.
5. Conclusions
We propose a novel non-invasive FFNN-based SER system built on three layers: In the base layer specific speech features are evaluated and classified; in the middle layer a matrix is built based on the classification scores computed in the base layer; in the top layer, a feedforward neural network and a rule-based classifier are used to analyze the matrix from the middle layer and output the predicted emotion. We test the system in both intra-subject and inter-subject methodologies using a new database introduced in this paper, and we show that emotion inducing utterances are needed only for training the system while testing it on utterances collected in naturalistic conditions offers an accuracy similar to the one obtained when emotion-stimulated utterances are used. This shows that the proposed SER system is practical as the analyzed subject does not have to watch any emotion-stimulating videos, the system being pre-trained using emotion-stimulated utterances collected from another set of subjects used for training. We obtain an accuracy of 83.25% for intra-subject methodology and 80.75% for inter-subject methodology, with 72 s (intra-subject) and 78 s (inter-subject) as average processing time. The time needed for predicting emotions is significantly lower than the one needed for filling in DEQ, making our proposed SER system attractive for replacing the questionnaire with the advantages of being suitable for real-time monitoring and being less prone to bias. We also conduct a study to determine possible correlations between the analyzed speech features and the evaluated emotions and we confirm the findings of previous studies [42,43] for anger, happiness, and fear, as well as determine new correlations between disgust and ZCR, STE, EAVG, ESTDEV, and PMAXAVG. Our findings enhance previous studies [42,43] by finding correlations related to the intensity contour, SR, PR, and STE that were not studied before. Using these correlations, we modify the proposed architecture, leading to an increase in accuracy of up to 6%, most emotions (except disgust) being predicted with over 80% accuracy. The highest accuracy is obtained for happiness (90.4%), sadness (84.3%), fear (83.2%), and anger (82.3%). Disgust and surprise are predicted with lower accuracy, mainly because these emotions have a more dominant facial expression compared to how they affect speech.
We show that the proposed SER system offers higher accuracy, sensitivity, and specificity than other NN-based SER systems, as well as the lowest average processing time, surpassing other state-of-the-art methods with up to 36 s. The system also proves to be robust, offering over 73% accuracy and similar processing time across different databases, and we show that it performs very well at predicting emotions that are stimulated, while for emotions collected in naturalistic conditions, other methods offer better results and can be fused with the proposed FFNN-based method to reach higher accuracy. As a path forward, other speech features can be analyzed and integrated with the proposed system to improve the prediction accuracy as well as fuse the speech analysis with the analysis of facial expressions, gestures, or body postures. Increasing the number of samples in the database as well as the scenarios in which they are collected could also provide richer information to improve the FFNN-based SER system predictions and processing time.
The proposed SER system can be successfully used in HCI based on speech interaction, as well as integrated in computer-mediated education systems [47], for airplane or car accidents prevention [30,31], diagnosing mental disorders [24,25,26] and physical diseases [27], in call centers to improve the quality of customer service [22,23], and crime investigation departments by analyzing emotional patterns during suspect interrogations to find the perpetrator [28,51].
Author Contributions
Conceptualization, M.G.; methodology, M.G. and N.V.; software, M.G.; validation, M.G. and N.V.; formal analysis, M.G.; investigation, M.G. and N.V.; resources, M.G. and N.V.; data curation, M.G.; writing—original draft preparation, M.G.; writing—review and editing, M.G. and N.V.; visualization, M.G.; project administration, M.G. and N.V.
Funding
This research received no external funding.
Conflicts of Interest
The authors declare no conflict of interest.
References
- Liebenthal, E.; Silbersweig, D.A.; Stern, E. The Language, Tone and Prosody of Emotions: Neural Substrates and Dynamic of Spoken-Word Emotion Perception. Front. Neurosci. 2016, 10, 506. [Google Scholar] [CrossRef] [PubMed]
- Koolagudi, S.G.; Sreenivasa Rao, K. Emotion recognition from speech: A review. Int. J. Speech Tech. 2012, 15, 99–117. [Google Scholar] [CrossRef]
- Al-Talabani, A.; Sellahewa, H.; Jassim, S.A. Emotion recognition from speech: Tools and challenges. In Proceedings of the SPIE 9497, Mobile Multimedia/Image Processing, Security, and Applications 2015, Baltimore, MD, USA, 21 May 2015. [Google Scholar]
- Partila, P.; Tovarek, J.; Frnda, J.; Voznak, M.; Penhaker, M.; Peterek, T. Emotional Impact on Neurological Characteristics and Human Speech. In Proceedings of the First Euro-China Conference on Intelligent Data Analysis and Applications, Shenzhen, China, 13–15 June 2014; pp. 527–533. [Google Scholar]
- Guoth, I.; Chmulik, M.; Polacky, J.; Kuba, M. Two-dimensional cepstrum analysis approach in emotion recognition from speech. In Proceedings of the 39th International Conference on Telecommunications and Signal Processing, Vienna, Austria, 27–29 June 2016. [Google Scholar]
- Busso, C.; Bulut, M.; Lee, C.C.; Kazemzadeh, A.; Mower, E.; Kim, S.; Chang, J.N.; Lee, S.; Narayan, S.S. IEMOCAP: Interactive emotional dyadic motion capture database. J. Lang. Resour. Eval. 2008, 42, 335–359. [Google Scholar] [CrossRef]
- Vydana, H.K.; Vikash, P.; Vamsi, T.; Kumar, K.P.; Vuppala, A.K. Detection of emotionally significant regions of speech for emotion recognition. In Proceedings of the 2015 Annual IEEE India Conference, New Delhi, India, 17–20 December 2015. [Google Scholar]
- Burkhardt, F.; Paeschke, A.; Rolfes, M.; Sendlmeier, W.F.; Weiss, B. A database of German emotional speech. In Proceedings of the 9th European Conference on Speech Communication and Technology, Lisboa, Portugal, 4–8 September 2005; pp. 1517–1520. [Google Scholar]
- Fan, Y.; Xu, M.; Wu, Z.; Cai, L. Automatic Emotion Variation Detection in continuous speech. In Proceedings of the Signal and Information Processing Association Annual Summit and Conference (APSIPA), 2014 Asia-Pacific, Siem Reap, Cambodia, 9–12 December 2014. [Google Scholar]
- Shami, M.T.; Kamel, M.S. Segment-based approach to the recognition of emotions in speech. In Proceedings of the IEEE International Conference on Multimedia and Expo, Amsterdam, The Netherlands, 6–8 July 2005. [Google Scholar]
- Fu, L.; Wang, C.; Zhang, Y. Classifier fusion for speech emotion recognition. In Proceedings of the IEEE International Conference on Intelligent Computing and Intelligent Systems, Xiamen, China, 29–31 October 2010. [Google Scholar]
- Zhang, C.; Yu, C.; Hansen, J.H.L. An Investigation of Deep-Learning Frameworks for Speaker Verification Antispoofing. IEEE J. Selected Topics Signal Process. 2017, 11, 684–694. [Google Scholar] [CrossRef]
- Basu, S.; Chakraborty, J.; Aftabuddin, M. Emotion recognition from speech using convolutional neural network with recurrent neural network architecture. In Proceedings of the 2nd International Conference on Communication and Electronics Systems (ICCES), Coimbatore, India, 19–20 October 2017. [Google Scholar]
- Parthasarathy, S.; Tashev, I. Convolutional Neural Network Techniques for Speech Emotion Recognition. In Proceedings of the 16th International Workshop on Acoustic Signal Enhancement, Tokyo, Japan, 17–20 September 2018. [Google Scholar]
- Zhang, S.; Zhang, S.; Huang, T.; Gao, W. Speech emotion recognition using deep convolutional neural network and discriminant temporal pyramid matching. IEEE Trans. Multimed. 2018, 30, 1576–1590. [Google Scholar] [CrossRef]
- Zhao, J.; Mao, X.; Chen, L. Learning deep features to recognize speech emotion using merged deep CNN. IET Signal Process. 2018, 12, 713–721. [Google Scholar] [CrossRef]
- Shahin, I.; Nassif, A.B.; Hamsa, S. Emotion Recognition using hybrid Gaussian mixture model and deep neural network. IEEE Access 2019, 26777–26787. [Google Scholar] [CrossRef]
- Shahin, I. Emirati speaker verification based on HMMIs, HMM2s, and HMM3s. In Proceedings of the IEEE 13th International Conference on Signal Processing (ICSP), Chengdu, China, 6–10 November 2016. [Google Scholar]
- Lotfidereshgi, R.; Gournay, P. Biologically inspired speech emotion recognition. In Proceedings of the IEEE International Conference on Acoustics, Speech and Signal Processing, New Orleans, LA, USA, 5–9 March 2017. [Google Scholar]
- Clynes, M. Sentics: The Touch of the Emotions; Anchor Press: New York, NY, USA, 1978. [Google Scholar]
- Ekman, P. Are there basic emotions? Psychol. Rev. 1992, 99, 550–553. [Google Scholar] [CrossRef]
- Vidrascu, L.; Devillers, L. Real-Life Emotion Representation and Detection in Call Centers Data. In Proceedings of the International Conference on Affective Computing and Intelligent Interaction, Beijing, China, 22–24 October 2005; pp. 739–746. [Google Scholar]
- Vaudable, C.; Devillers, L. Negative emotions detection as an indicator of dialogs quality in call centers. In Proceedings of the IEEE International Conference on Acoustics, Speech and Signal Processing, Kyoto, Japan, 25–30 March 2012. [Google Scholar]
- Park, C.; Rosenblat, J.D.; Lee, Y.; Pan, Z.; Cao, B.; Iacobucci, M.; McIntyre, R.S. The neural system of emotion regulation and abnormalities in major depressive disorder. Behav. Brain Res. 2019, 367, 181–188. [Google Scholar] [CrossRef] [PubMed]
- Jakubczyk, A.; Trucco, E.M.; Kopera, M.; Kobylinski, P.; Suszek, H.; Fudalej, S.; Brower, K.J.; Wojnar, M. The association between impulsivity, emotion regulation, and symptoms of alcohol use disorder. J. Subst. Abuse Treat. 2018, 91, 49–56. [Google Scholar] [CrossRef] [PubMed]
- Fowler, J.C.; Madan, A.; Oldham, J.M.; Frueh, B.C. Differentiating bipolar disorder from borderline personality disorder: Diagnostic accuracy of the difficulty in emotion regulation scale and personality inventory for DSM-5. J. Affect. Disord. 2019, 245, 856–860. [Google Scholar] [CrossRef] [PubMed]
- Trudel-Fitzgerald, C.; Qureshi, F.; Appleton, A.A.; Kubzansky, L.D. A healthy mix of emotions: Underlying biological pathways linking emotions to physical health. Curr. Opin. Behav. Sci. 2017, 15, 16–21. [Google Scholar] [CrossRef]
- Brook, M.; Brieman, C.L.; Kosson, D.S. Emotion processing in Psychopathy Checklist - assessed psychopathy: A review of the literature. Clin. Psycho. Rev. 2013, 33, 979–995. [Google Scholar] [CrossRef] [PubMed]
- Baumann, F.; Benndorf, V.; Friese, M. Loss-induced emotions and criminal behavior: An experimental analysis. J. Econom. Behav. Organ. 2019, 159, 134–145. [Google Scholar] [CrossRef]
- Wan, P.; Wu, C.; Lin, Y.; Ma, X. On-road experimental study on driving anger identification model based on physiological features by ROC curve analysis. IET Intell. Transp. Syst. 2017, 11, 290–298. [Google Scholar] [CrossRef]
- Drury, D.A.; Dorrian, J.; Ferguson, S.A.; Thomas, M.J.W. Detection of heightened emotional activity in commercial airline crews: A reliability study. Aviat. Psychol. Appl. Human Fact. 2013, 3, 83–91. [Google Scholar] [CrossRef]
- Schuller, B.; Vlasenko, B.; Eyben, F.; Wollmer, M.; Stuhlzatz, A.; Wendemuth, A.; Rigoll, G. Cross-Corpus Acoustic Emotion Recognition: Variances and Strategies. IEEE Trans. Affect. Comput. 2010, 1, 119–131. [Google Scholar] [CrossRef]
- Martin, O.; Kotsia, I.; Macq, B.; Pitas, I. The eNTERFACE’ 05 Audio-Visual Emotion Database. In Proceedings of the 22nd International Conference on Data Engineering Workshops, Atlanta, GA, USA, 3–7 April 2006. [Google Scholar]
- Douglas-Cowie, E.; Campbell, N.; Cowie, R.; Roach, P. Emotional speech: Towards a new generation of databases. Speech Commun. 2003, 40, 33–60. [Google Scholar] [CrossRef] [Green Version]
- Sneddon, I.; McRorie, M.; McKeown, G.; Hanratty, J. The Belfast Induced Natural Emotion Database. IEEE Trans. Affect. Comput. 2012, 3, 32–41. [Google Scholar] [CrossRef]
- Balomenos, T.; Raouzaiou, A.; Karpouzis, K.; Kollias, S.; Cowie, R. An Introduction to Emotionally Rich Man-Machine Intelligent System. In Proceedings of the Third European Symposium on Intelligent Technologies, Hybrid Systems and their implementation on Smart Adaptive Systems, Oulu, Finland, 10–12 July 2013. [Google Scholar]
- World Medical Association, World Medical Association Declaration of Helsinki: Ethical principles for medical research involving human subjects. JAMA 2013, 310, 2191–2194. [CrossRef] [PubMed]
- Harmon-Jones, C.; Bastian, B.; Harmon-Jones, E. The Discrete Emotions Questionnaire: A New Tool for Measuring State Self-Reported Emotions. PLoS One 2016, 11, e0159915. [Google Scholar] [CrossRef] [PubMed]
- Baveye, Y.; Dellandrea, E.; Chamaret, C.; Chen, L. LIRIS-ACCEDE: A Video Database for Affective Content Analysis. IEEE Trans. Affect. Comput. 2015, 6, 43–55. [Google Scholar] [CrossRef] [Green Version]
- Simundic, A.M. Measures of Diagnostic Accuracy: Basic Definitions. Electr. J. Int. Federation Clin. Chem. Lab. Med. 2009, 19, 203–211. [Google Scholar]
- Bertrand, M.; Mullainathan, S. Do People Mean What They Say? Implications for Subjective Survey Data. Am. Econom. Rev. 2001, 91, 67–72. [Google Scholar] [CrossRef]
- Paidi, G.; Kadiri, S.R.; Yegnanarayana, B. Analysis of Emotional Speech—A Review. In Toward Robotic Socially Believable Behaving Systems—Volume I: Modeling Emotions; Springer: Berlin/Heidelberg, Germany, 2016; pp. 205–238. [Google Scholar]
- Banse, R.; Scherer, K.R. Acoustic profiles in vocal emotion expression. J. Person. Soc. Psychol. 1996, 70, 614. [Google Scholar] [CrossRef]
- Koolagudi, S.G.; Rao, K.S. Real life emotion classification using VOP and pitch based spectral features. In Proceedings of the Annual IEEE India Conference, Kolkata, India, 17–19 December 2011. [Google Scholar]
- Ding, N.; Ye, N.; Huang, H.; Wang, R.; Malekian, R. Speech emotion features selection based on BBO-SVM. In Proceedings of the 10th International Conference on Advanced Computational Intelligence, Xiamen, China, 29–31 March 2018. [Google Scholar]
- Aouani, H.; Ayed, Y.B. Emotion recognition in speech using MFCC with SVM, DSVM and auto-encoder. In Proceedings of the 4th International Conference on Advanced Technologies for Signal and Image Processing, Susah, Tunisia, 21–24 March 2018. [Google Scholar]
- Kolakowska, A.; Landowska, A.; Szwoch, M.; Szwock, W.; Wrobel, M. Emotion Recognition and Its Applications. In Human-Computer Systems Interaction: Backgrounds and Applications; Springer: Cham, Switzerland, 2014; Volume 3, pp. 51–62. [Google Scholar]
- Philip, R.C.; Whalley, H.C.; Stanfield, A.C.; Sprengelmeyer, R.; Santos, I.M.; Young, A.W.; Atkinson, A.P.; Calder, A.J.; Johnstone, E.C.; Lawrie, S.M.; et al. Deficits in facial, body movement and vocal emotional processing in autism spectrum disorders. Psychol. Med. 2010, 40, 1919–1929. [Google Scholar] [CrossRef] [Green Version]
- Stewart, M.E.; McAdam, C.; Ota, M.; Peppe, S.; Cleland, J. Emotional recognition in autism spectrum conditions from voices and faces. Autism 2013, 17, 6–14. [Google Scholar] [CrossRef]
- Schelinski, S.; von Kriegstein, K. The relation between vocal pitch and vocal emotion recognition abilities in people with Autism Spectrum Disorder and Typical Development. J. Autism Dev. Disord. 2019, 49, 68–82. [Google Scholar] [CrossRef]
- Ekpenyong, M.; Obot, O. Speech Quality Enhancement in Digital Forensic Voice Analysis. Comput. Intell. Digit. Forensics: Forensic Invest. Appl. 2014, 555, 429–451. [Google Scholar]
- Upadhyay, N.; Karmakar, A. Speech Enhancement using Spectral Subtraction-type Algorithms: A comparison and simulation study. Procedia Comput. Sci. 2015, 54, 574–588. [Google Scholar] [CrossRef]
- Prasad, N.V.; Umesh, S. Improved cepstral mean and variance normalization using Bayesian framework. In Proceedings of the IEEE Workshop on Automatic Speech Recognition and Understanding, Olomouc, Czech Republic, 8–12 December 2013. [Google Scholar]
- Nolan, F. Intonational equivalence: An experimental evaluation of pitch scales. In Proceedings of the 15th International Congress of Phonetic Sciences, Barcelona, Spain, 3–9 August 2003. [Google Scholar]
- Gurban, M.; Thiran, J.P. Information Theoretic Feature Extraction for Audio-Visual Speech Recognition. IEEE Trans. Signal Process. 2009, 57, 4765–4776. [Google Scholar] [CrossRef] [Green Version]
- Ayadi, M.E.; Kamel, M.S.; Karray, F. Survey on speech emotion recognition: features, classification schemes, and databases. Pattern Recognit. 2011, 44, 572–587. [Google Scholar] [CrossRef]
- Aksoy, S.; Haralick, R.M. Feature normalization and likelihood-based similarity measures for image retrieval. Pattern Recogn. Lett. 2001, 22, 563–582. [Google Scholar] [CrossRef] [Green Version]
- Saxen, H.; Petterson, F. A methodology for developing Nonlinear Models by Feedforward Neural Networks. In Proceedings of the International Conference on Adaptive and Natura Computing Algorithms, Kuopio, Finland, 23–25 April 2009; pp. 72–78. [Google Scholar]
- Hara, K.; Saito, D.; Shouno, H. Analysis of function of rectified linear unit used in deep learning. In Proceedings of the International Joint Conference on Neural Network, Killarney, Ireland, 11–16 July 2015. [Google Scholar]
- Bridle, J.S. Probabilistic Interpretation of Feedforward Classification Network Outputs, with Relationships to Statistical Pattern Recognition. Neurocomputing 1990, 68, 227–236. [Google Scholar]
- Li, J.; Cheng, J.H.; Huang, F. Brief Introduction of Back Propagation BP) Neural Network Algorithm and Its Improvement. Adv. Comput. Sci. Inf. Eng. 2012, 169, 553–558. [Google Scholar]
- Masood, S.; Doja, M.N.; Chandra, P. Analysis of weight initialization techniques for gradient descent. In Proceedings of the Annual IEEE India Conference 2015, New Delhi, India, 17–20 December 2015. [Google Scholar]
Figure 1.
Emotion prediction accuracy based on the duration of the analyzed utterance (intra-subject methodology).
Figure 1.
Emotion prediction accuracy based on the duration of the analyzed utterance (intra-subject methodology).

Figure 2.
Emotion prediction accuracy based on the duration of the analyzed utterance (inter-subject methodology).
Figure 2.
Emotion prediction accuracy based on the duration of the analyzed utterance (inter-subject methodology).

Figure 3.
Emotion prediction accuracy based on the number of subjects involved in the training phase (inter-subject methodology).
Figure 3.
Emotion prediction accuracy based on the number of subjects involved in the training phase (inter-subject methodology).

Figure 4.
Average processing time - comparison with state-of-the-art methods.

Figure 5.
The overall architecture for predicting emotions based on speech.

Figure 6.
Prediction accuracy using different feedforward neural network (FFNN) combinations; we denote with T—tanh activation function, S—sigmoid activation function, R—ReLU activation function, SMAX—softmax activation function, 1L—FFNN with one hidden layer, 2L—FFNN with two hidden layers, and each combination is labeled with [number of hidden layers][1st hidden layer activation function][2nd hidden layer activation function (if FFNN has two hidden layers][output layer activation function].

Figure 7.
SENN prediction accuracy based on the number of neurons in hidden layers.

Figure 8.
SENN configuration and hyperparameters.


Table 1.
Emotion prediction based on speech—intra-subject methodology.
| TRDT | TEDT | AVGD | MM | A | D | F | H | S | SPR | Avg. |
|---|---|---|---|---|---|---|---|---|---|---|
| DSC | DSC | 10 | AC | 83.20 ± 0.05 | 76.20 ± 0.14 | 84.30 ± 0.12 | 91.10 ± 0.03 | 86.40 ± 0.12 | 78.90 ± 0.16 | 83.35 ± 0.15 |
| SE | 77.40 | 70.90 | 78.40 | 85.50 | 82.40 | 73.70 | 78.04 | |||
| SP | 74.10 | 67.10 | 76.40 | 84.10 | 78.30 | 70.70 | 75.12 | |||
| DSC | DSR | 12 | AC | 82.30 ± 0.10 | 75.40 ± 0.23 | 83.20 ± 0.21 | 90.40 ± 0.03 | 84.30 ± 0.16 | 77.20 ± 0.21 | 82.13 ± 0.19 |
| SE | 77.10 | 70.80 | 78.00 | 85.40 | 80.00 | 73.00 | 77.44 | |||
| SP | 73.30 | 67.02 | 75.20 | 84.02 | 77.70 | 70.54 | 75.04 | |||
| DSR | DSC | 16 | AC | 70.80 ± 0.34 | 65.10 ± 0.34 | 71.60 ± 0.39 | 78.20 ± 0.43 | 71.30 ± 0.37 | 66.30 ± 0.39 | 70.55 ± 0.38 |
| SE | 65.10 | 60.80 | 67.60 | 73.30 | 67.30 | 61.40 | 65.90 | |||
| SP | 63.70 | 57.50 | 64.70 | 70.70 | 62.40 | 59.20 | 63.02 | |||
| DSR | DSR | 15 | AC | 68.20 ± 0.46 | 62.40 ± 0.64 | 69.20 ± 0.62 | 75.30 ± 0.65 | 68.60 ± 0.56 | 63.60 ± 0.55 | 67.88 ± 0.58 |
| SE | 63.00 | 57.40 | 63.90 | 70.40 | 64.60 | 57.90 | 62.86 | |||
| SP | 61.10 | 54.10 | 60.00 | 67.80 | 61.50 | 57.40 | 60.31 | |||
| DSC + DSR | DSC + DSR | 13 | AC | 81.30 ± 0.43 | 74.20 ± 0.45 | 81.80 ± 0.43 | 89.10 ± 0.49 | 83.20 ± 0.47 | 76.10 ± 0.42 | 80.95 ± 0.45 |
| SE | 77.00 | 68.40 | 76.70 | 83.30 | 79.00 | 70.20 | 75.76 | |||
| SP | 73.20 | 65.40 | 72.70 | 82.60 | 76.80 | 69.90 | 73.60 |
H—Happiness; S—Sadness; A—Anger; F—Fear; SPR—Surprise; D—Disgust; AC—Accuracy [%]; SE—Sensitivity [%]; SP—Specificity [%]; Measurement Method—MM; TRDT—Training dataset; TEDT—Testing Dataset; AVGT—Average duration of the analyzed utterance (s).
Table 2.
Confusion matrix—intra-subject methodology.
| Predicted Output | Expected Output | |||||||
| Anger | Disgust | Fear | Happiness | Sadness | Surprise | |||
| Train: DSC Test: DSC | Anger | 83.20 | 0.00 | 9.20 | 0.00 | 7.60 | 0.00 | |
| Disgust | 11.20 | 76.20 | 1.20 | 0.00 | 11.40 | 0.00 | ||
| Fear | 0.00 | 4.50 | 84.30 | 0.00 | 0.00 | 11.20 | ||
| Happiness | 0.00 | 0.00 | 0.00 | 91.10 | 0.00 | 8.90 | ||
| Sadness | 1.50 | 12.10 | 0.00 | 0.00 | 86.40 | 0.00 | ||
| Surprise | 1.30 | 0.00 | 9.60 | 10.20 | 0.00 | 78.90 | ||
| Train: DSC Test: DSR | Anger | 82.30 | 0.00 | 10.20 | 0.00 | 7.50 | 0.00 | |
| Disgust | 14.30 | 75.40 | 2.70 | 0.00 | 7.60 | 0.00 | ||
| Fear | 0.00 | 5.40 | 83.20 | 0.00 | 0.00 | 11.40 | ||
| Happiness | 0.00 | 0.00 | 0.00 | 90.40 | 0.00 | 9.60 | ||
| Sadness | 4.40 | 11.30 | 0.00 | 0.00 | 84.30 | 0.00 | ||
| Surprise | 1.70 | 0.00 | 9.90 | 11.20 | 0.00 | 77.20 | ||
| Train: DSR Test: DSC | Anger | 70.80 | 0.00 | 16.50 | 0.00 | 10.20 | 2.50 | |
| Disgust | 21.20 | 65.10 | 1.80 | 1.40 | 10.50 | 0.00 | ||
| Fear | 0.00 | 7.20 | 71.60 | 0.00 | 0.00 | 21.20 | ||
| Happiness | 1.50 | 3.80 | 0.00 | 78.20 | 0.00 | 16.50 | ||
| Sadness | 7.60 | 18.50 | 0.00 | 2.60 | 71.30 | 0.00 | ||
| Surprise | 3.80 | 0.00 | 11.40 | 18.50 | 0.00 | 66.30 | ||
| Train: DSR Test: DSR | Anger | 68.20 | 0.00 | 17.60 | 0.00 | 11.20 | 3.00 | |
| Disgust | 24.30 | 62.40 | 1.00 | 1.00 | 11.30 | 0.00 | ||
| Fear | 0.00 | 7.60 | 69.20 | 0.00 | 0.00 | 23.20 | ||
| Happiness | 2.30 | 4.20 | 0.00 | 75.30 | 0.00 | 18.20 | ||
| Sadness | 8.10 | 21.20 | 0.00 | 2.10 | 68.60 | 0.00 | ||
| Surprise | 4.00 | 0.00 | 12.20 | 20.20 | 0.00 | 63.60 | ||
| Train: DSC+DSR Test: DSC+DSR | Anger | 81.30 | 0.00 | 10.80 | 0.00 | 7.90 | 0.00 | |
| Disgust | 14.40 | 74.20 | 3.10 | 0.00 | 8.30 | 0.00 | ||
| Fear | 0.00 | 5.80 | 81.80 | 0.00 | 0.00 | 12.40 | ||
| Happiness | 0.00 | 0.00 | 0.00 | 89.10 | 0.00 | 10.90 | ||
| Sadness | 4.60 | 11.40 | 0.00 | 0.00 | 83.20 | 0.80 | ||
| Surprise | 1.80 | 0.00 | 10.40 | 11.70 | 0.00 | 76.10 | ||
Table 3.
Emotion prediction based on speech—inter-subject methodology.
| TRDT | TEDT | AVGD | NTS | MM | A | D | F | H | S | SUP | Avg. |
|---|---|---|---|---|---|---|---|---|---|---|---|
| DSC | DSC | 2 | 64 | AC | 68.71 ± 0.48 | 62.21 ± 0.45 | 68.91 ± 0.43 | 75.25 ± 0.49 | 71.51 ± 0.47 | 64.21 ± 0.43 | 68.51 ± 0.41 |
| SE | 65.42 | 59.72 | 66.72 | 71.71 | 69.41 | 61.42 | 65.74 | ||||
| SP | 61.11 | 53.43 | 60.01 | 67.02 | 63.61 | 56.74 | 60.33 | ||||
| DSC | DSC | 1 | 96 | AC | 74.74 ± 0.34 | 69.15 ± 0.33 | 77.72 ± 0.31 | 84.73 ± 0.34 | 78.14 ± 0.37 | 71.93 ± 0.39 | 76.01 ± 0.35 |
| SE | 71.95 | 65.84 | 74.11 | 80.81 | 74.85 | 68.31 | 72.61 | ||||
| SP | 66.34 | 61.41 | 70.63 | 77.53 | 70.56 | 63.84 | 68.43 | ||||
| DSC | DSC | 0.5 | 127 | AC | 79.31 ± 0.21 | 74.23 ± 0.21 | 82.15 ± 0.23 | 89.44 ± 0.23 | 83.25 ± 0.22 | 76.26 ± 0.21 | 80.75 ± 0.21 |
| SE | 76.23 | 70.51 | 79.24 | 86.81 | 80.21 | 73.34 | 77.74 | ||||
| SP | 71.22 | 65.82 | 73.71 | 82.00 | 75.85 | 68.21 | 72.83 | ||||
| DSR | DSR | 18 | 64 | AC | 61.31 ± 0.95 | 57.81 ± 0.91 | 62.35 ± 0.92 | 73.01 ± 0.95 | 64.34 ± 0.97 | 56.70 ± 0.94 | 62.51 ± 0.92 |
| SE | 57.33 | 55.01 | 58.84 | 70.41 | 60.71 | 52.90 | 59.24 | ||||
| SP | 53.24 | 49.42 | 54.01 | 65.00 | 55.35 | 47.82 | 54.15 | ||||
| DSR | DSR | 15 | 96 | AC | 64.35 ± 0.65 | 60.11 ± 0.65 | 65.71 ± 0.67 | 74.61 ± 0.65 | 68.02 ± 0.65 | 59.23 ± 0.53 | 65.34 ± 0.61 |
| SE | 62.14 | 56.74 | 63.33 | 72.32 | 65.51 | 56.54 | 62.71 | ||||
| SP | 56.61 | 52.73 | 57.82 | 65.91 | 59.55 | 51.64 | 57.35 | ||||
| DSR | DSR | 8 | 127 | AC | 66.61 ± 0.56 | 63.11 ± 0.54 | 68.61 ± 0.54 | 76.71 ± 0.52 | 70.94 ± 0.54 | 62.53 ± 0.54 | 68.14 ± 0.53 |
| SE | 63.42 | 59.24 | 65.33 | 73.25 | 68.51 | 58.71 | 64.72 | ||||
| SP | 59.34 | 55.55 | 61.01 | 69.63 | 62.85 | 53.94 | 60.41 | ||||
| DSC | DSR | 1.5 | 127 | AC | 77.63 ± 0.29 | 72.33 ± 0.28 | 80.51 ± 0.31 | 88.11 ± 0.27 | 81.84 ± 0.22 | 74.35 ± 0.27 | 79.13 ± 0.26 |
| SE | 74.31 | 68.31 | 76.74 | 85.73 | 79.31 | 72.20 | 76.14 | ||||
| SP | 70.23 | 64.21 | 72.63 | 79.73 | 74.65 | 65.51 | 71.15 | ||||
| DSR | DSC | 7 | 127 | AC | 68.75 ± 0.59 | 65.14 ± 0.55 | 71.01 ± 0.54 | 79.21 ± 0.52 | 73.14 ± 0.54 | 64.52 ± 0.56 | 70.34 ± 0.55 |
| SE | 66.66 | 62.12 | 68.31 | 76.73 | 70.01 | 62.24 | 67.71 | ||||
| SP | 61.01 | 57.41 | 63.34 | 70.54 | 65.32 | 57.35 | 62.54 | ||||
| DSC + DSR | DSC + DSR | 5 | 127 | AC | 76.81 ± 0.49 | 71.75 ± 0.50 | 79.63 ± 0.51 | 87.41 ± 0.48 | 81.14 ± 0.45 | 73.61 ± 0.54 | 78.35 ± 0.51 |
| SE | 73.44 | 69.23 | 75.91 | 84.02 | 77.35 | 71.55 | 75.24 | ||||
| SP | 68.53 | 63.41 | 72.15 | 79.31 | 73.01 | 66.34 | 70.51 |
H—Happiness; S—Sadness; A—Anger; F—Fear; SPR—Surprise; D—Disgust; AC—Accuracy [%]; SE—Sensitivity [%]; SP—Specificity [%]; MM—Measurement Method; TRDT—Training dataset; TEDT—Testing Dataset; AVGD—Average duration of analyzed utterance (s); NTS—number of subjects used for training.
Table 4.
Confusion matrix—inter-subject methodology.
| Predicted Output | Expected Output | |||||||
| Anger | Disgust | Fear | Happiness | Sadness | Surprise | |||
| Train: DSC Test: DSC | Anger | 79.31 | 0.00 | 14.30 | 0.00 | 6.39 | 0.00 | |
| Disgust | 10.20 | 74.23 | 5.07 | 0.00 | 10.50 | 0.00 | ||
| Fear | 0.00 | 6.65 | 82.15 | 0.00 | 0.00 | 11.20 | ||
| Happiness | 0.00 | 0.00 | 0.00 | 89.44 | 0.00 | 10.56 | ||
| Sadness | 6.95 | 9.80 | 0.00 | 0.00 | 83.25 | 0.00 | ||
| Surprise | 2.84 | 0.00 | 10.50 | 10.40 | 0.00 | 76.26 | ||
| Train: DSC Test: DSR | Anger | 77.63 | 0.00 | 15.40 | 0.00 | 6.97 | 0.00 | |
| Disgust | 16.50 | 72.33 | 4.67 | 0.00 | 6.50 | 0.00 | ||
| Fear | 0.00 | 4.09 | 80.51 | 0.00 | 0.00 | 15.40 | ||
| Happiness | 0.00 | 0.00 | 0.00 | 88.11 | 0.00 | 11.89 | ||
| Sadness | 3.86 | 14.30 | 0.00 | 0.00 | 81.84 | 0.00 | ||
| Surprise | 5.95 | 0.00 | 6.50 | 13.20 | 0.00 | 74.35 | ||
| Train: DSR Test: DSC | Anger | 68.75 | 0.00 | 15.40 | 0.00 | 9.50 | 6.35 | |
| Disgust | 16.50 | 65.14 | 5.60 | 4.26 | 8.50 | 0.00 | ||
| Fear | 0.00 | 9.49 | 71.01 | 0.00 | 0.00 | 19.50 | ||
| Happiness | 3.59 | 6.70 | 0.00 | 79.21 | 0.00 | 10.50 | ||
| Sadness | 7.60 | 15.40 | 0.00 | 3.86 | 73.14 | 0.00 | ||
| Surprise | 5.60 | 0.00 | 10.48 | 19.40 | 0.00 | 64.52 | ||
| Train: DSR Test: DSR | Anger | 66.61 | 0.00 | 16.50 | 0.00 | 10.20 | 6.69 | |
| Disgust | 18.20 | 63.11 | 4.50 | 4.59 | 9.60 | 0.00 | ||
| Fear | 0.00 | 9.89 | 68.61 | 0.00 | 0.00 | 21.50 | ||
| Happiness | 4.30 | 3.59 | 0.00 | 76.71 | 0.00 | 15.40 | ||
| Sadness | 8.70 | 16.50 | 0.00 | 3.86 | 70.94 | 0.00 | ||
| Surprise | 7.67 | 0.00 | 10.40 | 19.40 | 0.00 | 62.53 | ||
| Train: DSC+DSR Test: DSC+DSR | Anger | 76.81 | 0.00 | 15.40 | 0.00 | 7.79 | 0.00 | |
| Disgust | 14.30 | 71.75 | 4.30 | 0.00 | 9.65 | 0.00 | ||
| Fear | 0.00 | 6.17 | 79.63 | 0.00 | 0.00 | 14.20 | ||
| Happiness | 0.00 | 0.00 | 0.00 | 87.41 | 0.00 | 12.59 | ||
| Sadness | 2.96 | 10.50 | 0.00 | 0.00 | 81.14 | 5.40 | ||
| Surprise | 4.29 | 0.00 | 6.70 | 15.40 | 0.00 | 73.61 | ||
Table 5.
Correlations between speech features and the six basic emotions.
| Emotion | Speech Features | AC | SE | SP | APT |
|---|---|---|---|---|---|
| Anger | high PMAXCOUNT, high PMAXAVG, high PGRAD, high ZCR, high ESTDEV | 83.5 | 80.2 | 78.4 | 55 |
| Disgust | low ZCR, low EAVG, low ESTDEV, low PMAXAVG, low STE | 78.3 | 76.2 | 75.4 | 55 |
| Fear | high IMAXCOUNT, high IMAXAVG, high IGRAD, low PMAXCOUNT, low FF | 86.4 | 83.2 | 81.4 | 55 |
| Happiness | high FF, high SR, low PR, low ZCR, high IMAXCOUNT | 92.1 | 90.1 | 89.4 | 34 |
| Sadness | low FF, low PMAXCOUNT, low JIT, low PMAXAVG, low IGRAD | 88.2 | 84.5 | 82.3 | 60 |
| Surprise | low JIT, low SHIM, high PR, high STE, high PGRAD, low IGRAD | 80.1 | 77.6 | 75.9 | 55 |
AC—Accuracy [%]; SE—Sensitivity [%]; SP—Specificity [%]; APT—Average processing time (s).
Table 6.
Comparison with state-of-the-art methods.
| Method Used | Measurement Method | Avic [32] | Mcgilloway [34] | Structured Belfast [35] | Salas [36] | Proposed Database | |
|---|---|---|---|---|---|---|---|
| Non NN-Based Methods | Bat algorithm and PSO [5] | Accuracy [%] | 80.66 | 64.31 | 72.91 | 67.47 | 72.37 |
| Sensitivity [%] | 75.57 | 59.54 | 68.14 | 64.44 | 66.01 | ||
| Specificity [%] | 76.85 | 59.04 | 67.58 | 61.56 | 68.09 | ||
| GMM (Emotion Significant Regions) [7] | Accuracy [%] | 71.15 | 64.67 | 72.71 | 68.20 | 77.12 | |
| Sensitivity [%] | 68.53 | 58.95 | 67.64 | 63.53 | 73.12 | ||
| Specificity [%] | 66.84 | 58.67 | 69.17 | 63.97 | 74.01 | ||
| GMM (Vowel Onset Points – VOP) [44] | Accuracy [%] | 66.92 | 65.84 | 69.46 | 68.25 | 75.41 | |
| Sensitivity [%] | 62.91 | 62.96 | 65.04 | 65.47 | 70.47 | ||
| Specificity [%] | 60.13 | 60.84 | 64.42 | 63.89 | 69.94 | ||
| MSW-AEVD + HMM [9] | Accuracy [%] | 68.61 | 69.68 | 72.51 | 79.63 | 70.12 | |
| Sensitivity [%] | 65.02 | 64.74 | 69.82 | 75.21 | 65.89 | ||
| Specificity [%] | 62.43 | 63.18 | 66.04 | 74.61 | 65.31 | ||
| Biogeography-based Optimization (BBO) + SVM [45] | Accuracy [%] | 71.03 | 68.63 | 71.11 | 70.18 | 76.12 | |
| Sensitivity [%] | 67.04 | 63.11 | 66.18 | 67.41 | 73.24 | ||
| Specificity [%] | 66.51 | 64.26 | 65.78 | 65.02 | 70.93 | ||
| Deep SVM [46] | Accuracy [%] | 66.56 | 71.31 | 68.72 | 71.93 | 72.71 | |
| Sensitivity [%] | 61.31 | 65.41 | 66.55 | 66.31 | 67.44 | ||
| Specificity [%] | 62.14 | 63.73 | 62.81 | 65.48 | 66.93 | ||
| SVM + KNN [10] | Accuracy [%] | 64.61 | 68.12 | 74.19 | 73.64 | 73.26 | |
| Sensitivity [%] | 61.62 | 64.37 | 70.32 | 69.64 | 69.86 | ||
| Specificity [%] | 59.32 | 63.96 | 69.44 | 68.84 | 67.84 | ||
| NN-Based Methods | CNN + RF [12] | Accuracy [%] | 64.54 | 70.22 | 74.31 | 69.82 | 70.77 |
| Sensitivity [%] | 61.56 | 69.54 | 73.97 | 67.78 | 68.42 | ||
| Specificity [%] | 60.83 | 69.75 | 73.57 | 65.01 | 67.37 | ||
| HMM + ANN [11] | Accuracy [%] | 68.14 | 65.48 | 69.14 | 74.12 | 70.59 | |
| Sensitivity [%] | 65.86 | 60.67 | 65.22 | 71.27 | 68.11 | ||
| Specificity [%] | 62.81 | 61.12 | 63.18 | 69.81 | 64.43 | ||
| DCNN + DTPM [15] | Accuracy [%] | 71.74 | 71.11 | 72.50 | 71.64 | 80.22 | |
| Sensitivity [%] | 69.51 | 66.14 | 67.42 | 68.71 | 76.48 | ||
| Specificity [%] | 62.40 | 64.92 | 63.94 | 67.68 | 76.37 | ||
| 1D-CNN + 2D-CNN [16] | Accuracy [%] | 68.34 | 69.34 | 74.86 | 69.53 | 77.01 | |
| Sensitivity [%] | 64.33 | 59.78 | 63.62 | 69.26 | 74.01 | ||
| Specificity [%] | 64.47 | 65.17 | 65.05 | 72.84 | 72.62 | ||
| FFNN (current paper) | Accuracy [%] | 73.03 | 73.67 | 76.88 | 81.21 | 84.8 | |
| Sensitivity [%] | 70.46 | 67.64 | 71.13 | 74.08 | 81.9 | ||
| Specificity [%] | 67.51 | 66.47 | 70.59 | 73.61 | 80.5 | ||
© 2019 by the authors. Licensee MDPI, Basel, Switzerland. This article is an open access article distributed under the terms and conditions of the Creative Commons Attribution (CC BY) license (http://creativecommons.org/licenses/by/4.0/).
Share and Cite
MDPI and ACS Style
Gavrilescu, M.; Vizireanu, N. Feedforward Neural Network-Based Architecture for Predicting Emotions from Speech. Data 2019, 4, 101. https://0-doi-org.brum.beds.ac.uk/10.3390/data4030101
AMA Style
Gavrilescu M, Vizireanu N. Feedforward Neural Network-Based Architecture for Predicting Emotions from Speech. Data. 2019; 4(3):101. https://0-doi-org.brum.beds.ac.uk/10.3390/data4030101
Chicago/Turabian StyleGavrilescu, Mihai, and Nicolae Vizireanu. 2019. "Feedforward Neural Network-Based Architecture for Predicting Emotions from Speech" Data 4, no. 3: 101. https://0-doi-org.brum.beds.ac.uk/10.3390/data4030101