
Predicting Student Dropout and Academic Success

1
VALORIZA—Research Center for Endogenous Resource Valorization, Instituto Politécnico de Portalegre, 7300-555 Portalegre, Portugal
2
Escola Superior de Tecnologia e Gestão, Instituto Politécnico de Portalegre, 7300-555 Portalegre, Portugal
*
Author to whom correspondence should be addressed.
Data 2022, 7(11), 146; https://0-doi-org.brum.beds.ac.uk/10.3390/data7110146
Submission received: 11 October 2022
/
Revised: 23 October 2022
/
Accepted: 25 October 2022
/
Published: 28 October 2022
(This article belongs to the Special Issue Data Mining and Computational Intelligence for E-learning and Education)
Abstract
:Higher education institutions record a significant amount of data about their students, representing a considerable potential to generate information, knowledge, and monitoring. Both school dropout and educational failure in higher education are an obstacle to economic growth, employment, competitiveness, and productivity, directly impacting the lives of students and their families, higher education institutions, and society as a whole. The dataset described here results from the aggregation of information from different disjointed data sources and includes demographic, socioeconomic, macroeconomic, and academic data on enrollment and academic performance at the end of the first and second semesters. The dataset is used to build machine learning models for predicting academic performance and dropout, which is part of a Learning Analytic tool developed at the Polytechnic Institute of Portalegre that provides information to the tutoring team with an estimate of the risk of dropout and failure. The dataset is useful for researchers who want to conduct comparative studies on student academic performance and also for training in the machine learning area.
Dataset License: CC BY 4.0
1. Introduction
Academic success in higher education is vital for jobs, social justice, and economic growth. Dropout represents the most problematic issue that higher education institutions must address to improve their success. There is no universally accepted definition of dropout. The proportion of students who dropout varies between different studies depending on how dropout is defined, the data source, and the calculation methods [1]. Frequently, dropout is analyzed in the research literature based on the timing of the dropout (early vs. late) [2]. Due to differences in reporting, it is not possible to compare dropout rates across institutions [3]. In this work, we define dropouts from a micro-perspective, where field and institution changes are considered dropouts independently of the timing these occur. This approach leads to much higher dropout rates than the macro-perspective, which considers only students who leave the higher education system without a degree.
According to the independent report for the European Commission, too many students drop out before the end of their higher education courses [4]. Even in the most successful country (Denmark), only around 80% of students complete their studies, while in Italy, this rate is only 46%. This report highlights key factors that lead students to drop out, with the major cause being socioeconomic conditions.
Namoun and Alshanqiti [5] performed an exhaustive search that found 62 papers published in peer-reviewed journals between 2010 and 2020, which present intelligent models to predict student performance. Additionally, in recent years, early prediction of student outcomes has attracted increasing research interest [6,7,8,9]. However, despite the research interest and the considerable amount of data that the universities generate, there is a need to collect more and better administrative data, including dropout and transfer reasons [2].
This descriptor presents a dataset created from a higher education institution (acquired from several disjoint databases) related to students enrolled in different undergraduate degrees, such as agronomy, design, education, nursing, journalism, management, social service, and technologies. The dataset includes information known at the time of student enrollment (academic path, demographics, and macroeconomics and socioeconomic factors) and the students’ academic performance at the end of the first and second semesters. The data are used to build classification models to predict student dropout and academic success. The problem is formulated as a three-category classification task (dropout, enrolled, and graduate) at the end of the normal duration of the course. These classification models are part of a Learning Analytic tool that includes predictive analyses which provide information to the tutoring team at our higher education institution with an estimate of the risk of dropout and failure. With this information, the tutoring team provides more accurate help to students.
The dataset contained 4424 records with 35 attributes, where each record represents an individual student and can be used for benchmarking the performance of different algorithms for solving the same type of problem and for training in the machine learning area.
In addition to this introduction section, the rest of the descriptor is organized as follows. Section 2 provides the details of the dataset. Section 3 presents the methodology that was followed for the development of this dataset and also presents a brief exploratory data analysis. Section 4 presents the conclusions, which are followed by references.
2. Data Description
The dataset includes demographic data, socioeconomic and macroeconomic data, data at the time of student enrollment, and data at the end of the first and second semesters. The data sources used consist of internal and external data from the institution and include data from (i) the Academic Management System (AMS) of the institution, (ii) the Support System for the Teaching Activity of the institution (developed internally and called PAE), (iii) the annual data from the General Directorate of Higher Education (DGES) regarding admission through the National Competition for Access to Higher Education (CNAES), and (iv) the Contemporary Portugal Database (PORDATA) regarding macroeconomic data.
The data refer to records of students enrolled between the academic years 2008/2009 (after the application of the Bologna Process to higher education in Europe) to 2018/2019. These include data from 17 undergraduate degrees from different fields of knowledge, such as agronomy, design, education, nursing, journalism, management, social service, and technologies. The final dataset is available as a comma-separated values (CSV) file encoded as UTF8 and consists of 4424 records with 35 attributes and contains no missing values.
Table 1 describes each attribute used in the dataset grouped by class: demographic, socioeconomic, macroeconomic, academic data at enrollment, and academic data at the end of the first and second semesters. Appendix A contains the descriptions of possible values for the attributes, and the URL referenced in the Supplementary Material contains more detailed information.
3. Materials and Methods
This section describes the process that was followed for building the dataset and also presents a brief exploratory data analysis highlighting some relevant issues that may help other researchers quickly get their hands on the dataset and work with it, such as the imbalanced nature of data, the multicollinearity found in the features, and the results of permutation feature importance using the most used algorithms in similar problems shown in the literature.
3.1. Data Preprocessing
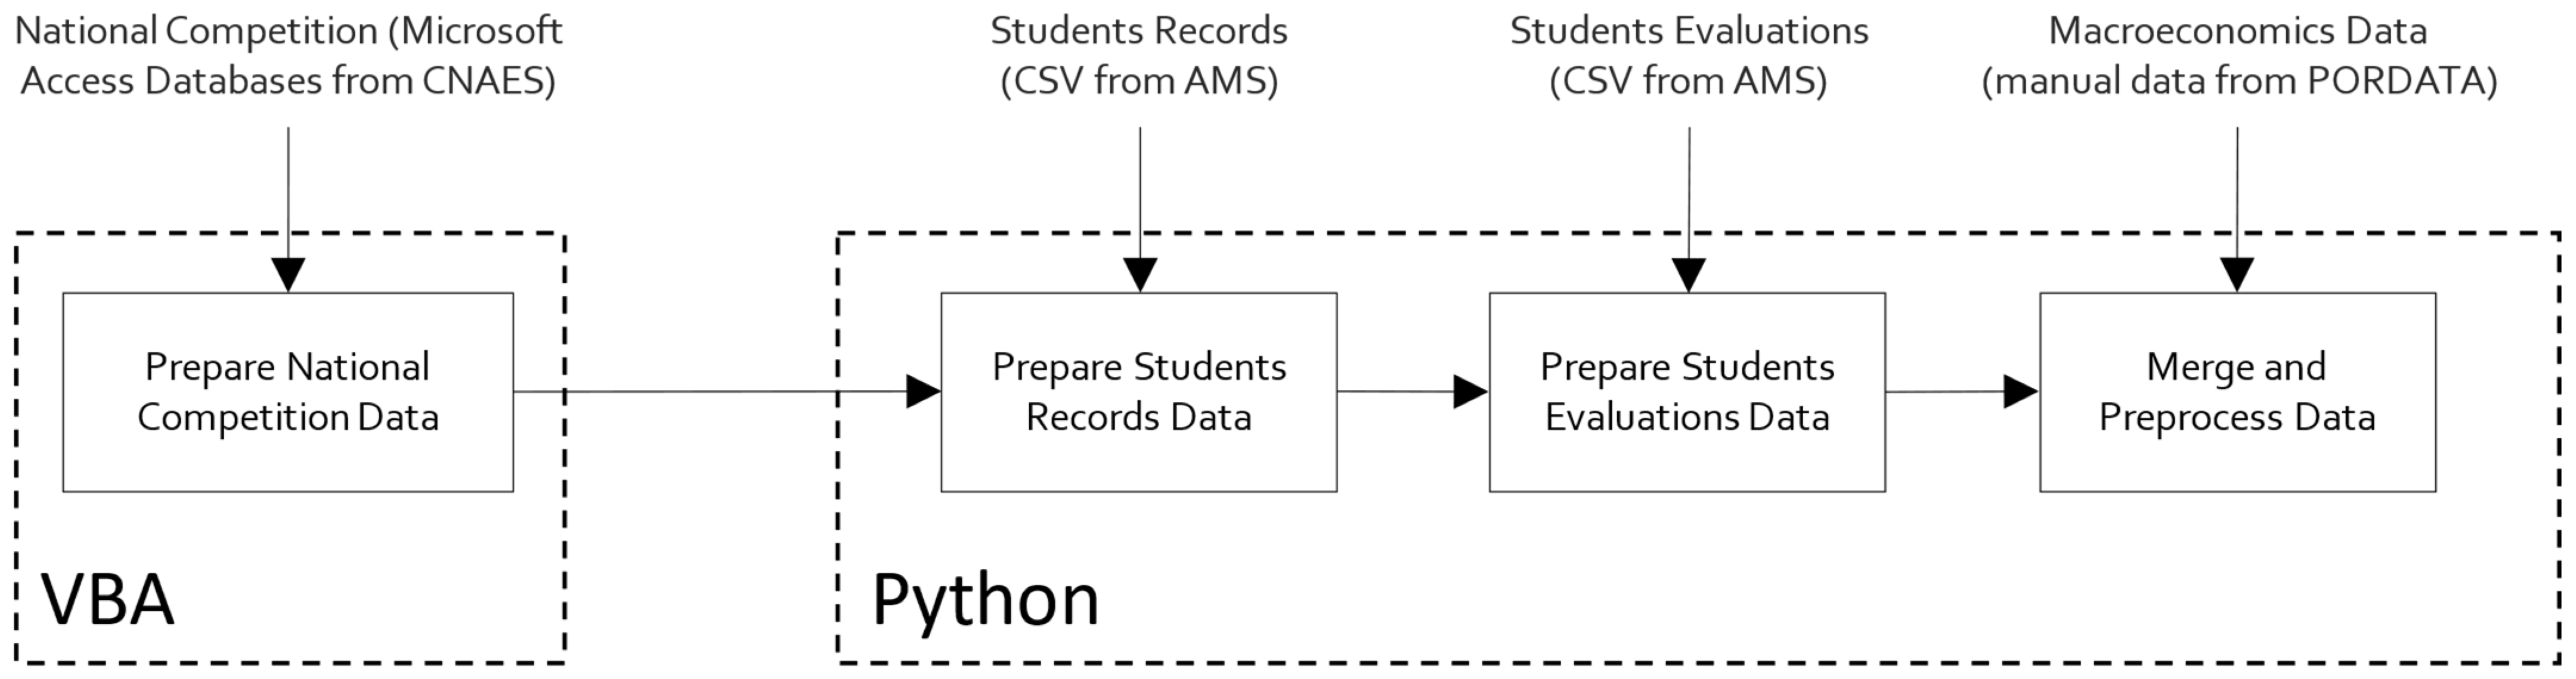
The data are collected in three different formats: (i) as Microsoft Access databases from CNAES; (ii) as comma-separated values (CSV) files from the AMS; and (iii) as manual data collected from the site of PORDATA concerning macroeconomics data.
Apart from the data received from CNAES, which are processed through a Visual Basic for Applications (VBA) program in a Microsoft Windows system, all the other code (in Python) runs on the Ubuntu operating system on an NVIDIA DGX Station computer with 2 CPU Intel Xeon E5-2698V4 with 20 core 2.2 GHz, 256 GB of memory, and 4 NVIDIA Tesla V100 GPU. This same computer was also used for training the machine learning models and to predict students’ performance, which is part of the Learning Analytics tool developed.
Figure 1 shows the workflow designed to create the dataset, which contains four steps that are described next.
- Prepare National Competition Data. The data relating to the National Competition for Access to Higher Education (CNAES) are received, every year, after the results of the competition, as a Microsoft Access database. We developed a Visual Basic for Applications (VBA) program that collects, from the different Microsoft Access databases (one for each year), the information needed and exports a CSV file (competition.csv) that contains one row for each student with fields related to the group “Data at Enrollment” described in Table 1.
- Prepare Student Records Data. In this step, the CSV received from the AMS with students’ records is prepared to be processed in the next steps. This file contains 13,992 rows and 398 columns, with a significant number of rows and columns that are duplicated or irrelevant to our study. To resume, this step comprises the deletion of students’ records enrolled in old courses that do not currently accept enrollments, the deletion of students’ records with irrelevant ways of enrollment such as Erasmus, the selection and renaming of relevant columns, and the elimination of duplicated rows. At the end of this step, all data related to the groups “Demographics Data” and “Socioeconomics Data” (see Table 1) are gathered to be used in the next steps.
- Prepare Student Evaluations Data. In this step, the CSV file with all the information related to the evaluation attempts of students is processed. For each student that results from the processing in the previous step, the attributes related to the groups “Academic data at the end of 1st semester” and “Academic data are calculated at the end of 2nd semester” (see Table 1).
- Merge and Preprocessing Data. All data gathered in the previous steps are merged into one single dataset in which are added the attributes related to “Macroeconomics Data”. Then, we performed rigorous data preprocessing to handle anomalies, unexplainable outliers, and missing values. Finally, each student is classified as a dropout, enrolled, or graduate depending on their situation at the end of the normal duration of the course (3 years, except Nursing which has 4 years). The result is the final dataset, available at https://0-doi-org.brum.beds.ac.uk/10.5281/zenodo.5777339 (accessed on 10 October 2022).
3.2. Data Analysis
We performed a brief exploratory data analysis in Python 3 using the Pandas library version 1.4.3, the Scikit-learn library version 1.1.1, and the Bokeh library version 2.4.3 for visualizations.
3.2.1. Descriptive Analysis
Table 2, Table 3, Table 4, Table 5, Table 6, Table 7 and Table 8 contain basic statistics about all the attributes. These tables include a histogram of attribute values, the central tendency of each attribute value (mode for categorical attributes and mean for numeric attributes), the median of each attribute value, the dispersion of the attribute values (the entropy of the value distribution for categorical attributes and coefficient of variation for numeric attributes), and the minimum and maximum value for numerical attributes only.
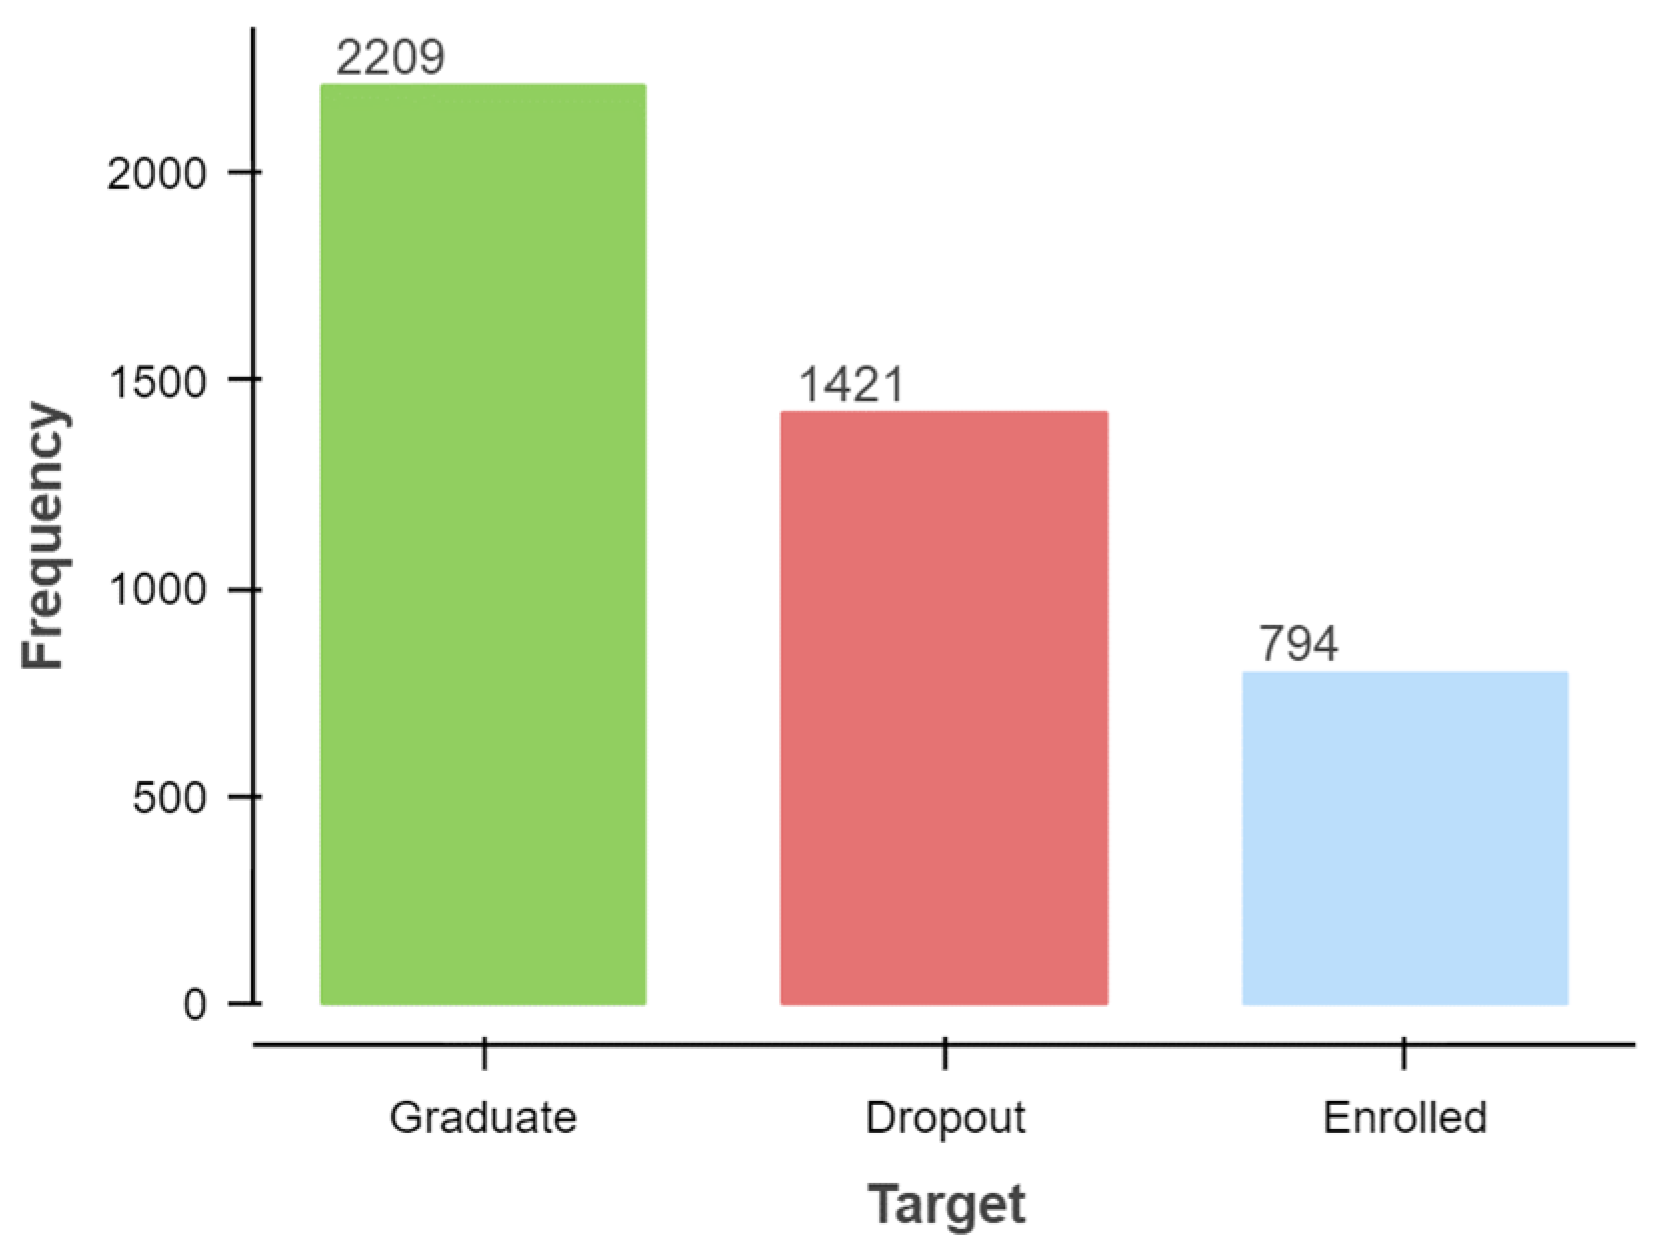
3.2.2. Imbalanced Data
The problem was formulated as a three-category classification task, in which there is a strong imbalance towards one of the classes (Figure 2). The majority class, Graduate, represents 50% of the records (2209 of 4424) and Dropout represents 32% of total records (1421 of 4424), while the minority class, Enrolled, represents 18% of total records (794 of 4424). This might result in a high prediction accuracy driven by the majority class at the expense of a poor performance of the minority class. Therefore, anyone using this dataset should pay attention to this problem and address it with a data-level approach or with an algorithm-level approach. At the data-level approach, a sampling technique such as the Synthetic Minority Over Sampling Technique (SMOTE) [10] or the Adaptive Synthetic Sampling Approach (ADASYN) [11] or any variant thereof can be applied. At the algorithm-level approach, a machine learning algorithm that already incorporates balancing steps must be used, such as Balanced Random Forest [12] or Easy Ensemble [13], or bagging classifiers with additional balancing, such as Exactly Balanced Bagging [14], Roughly Balanced Bagging [15], Over-Bagging [14], or SMOTE-Bagging [16].
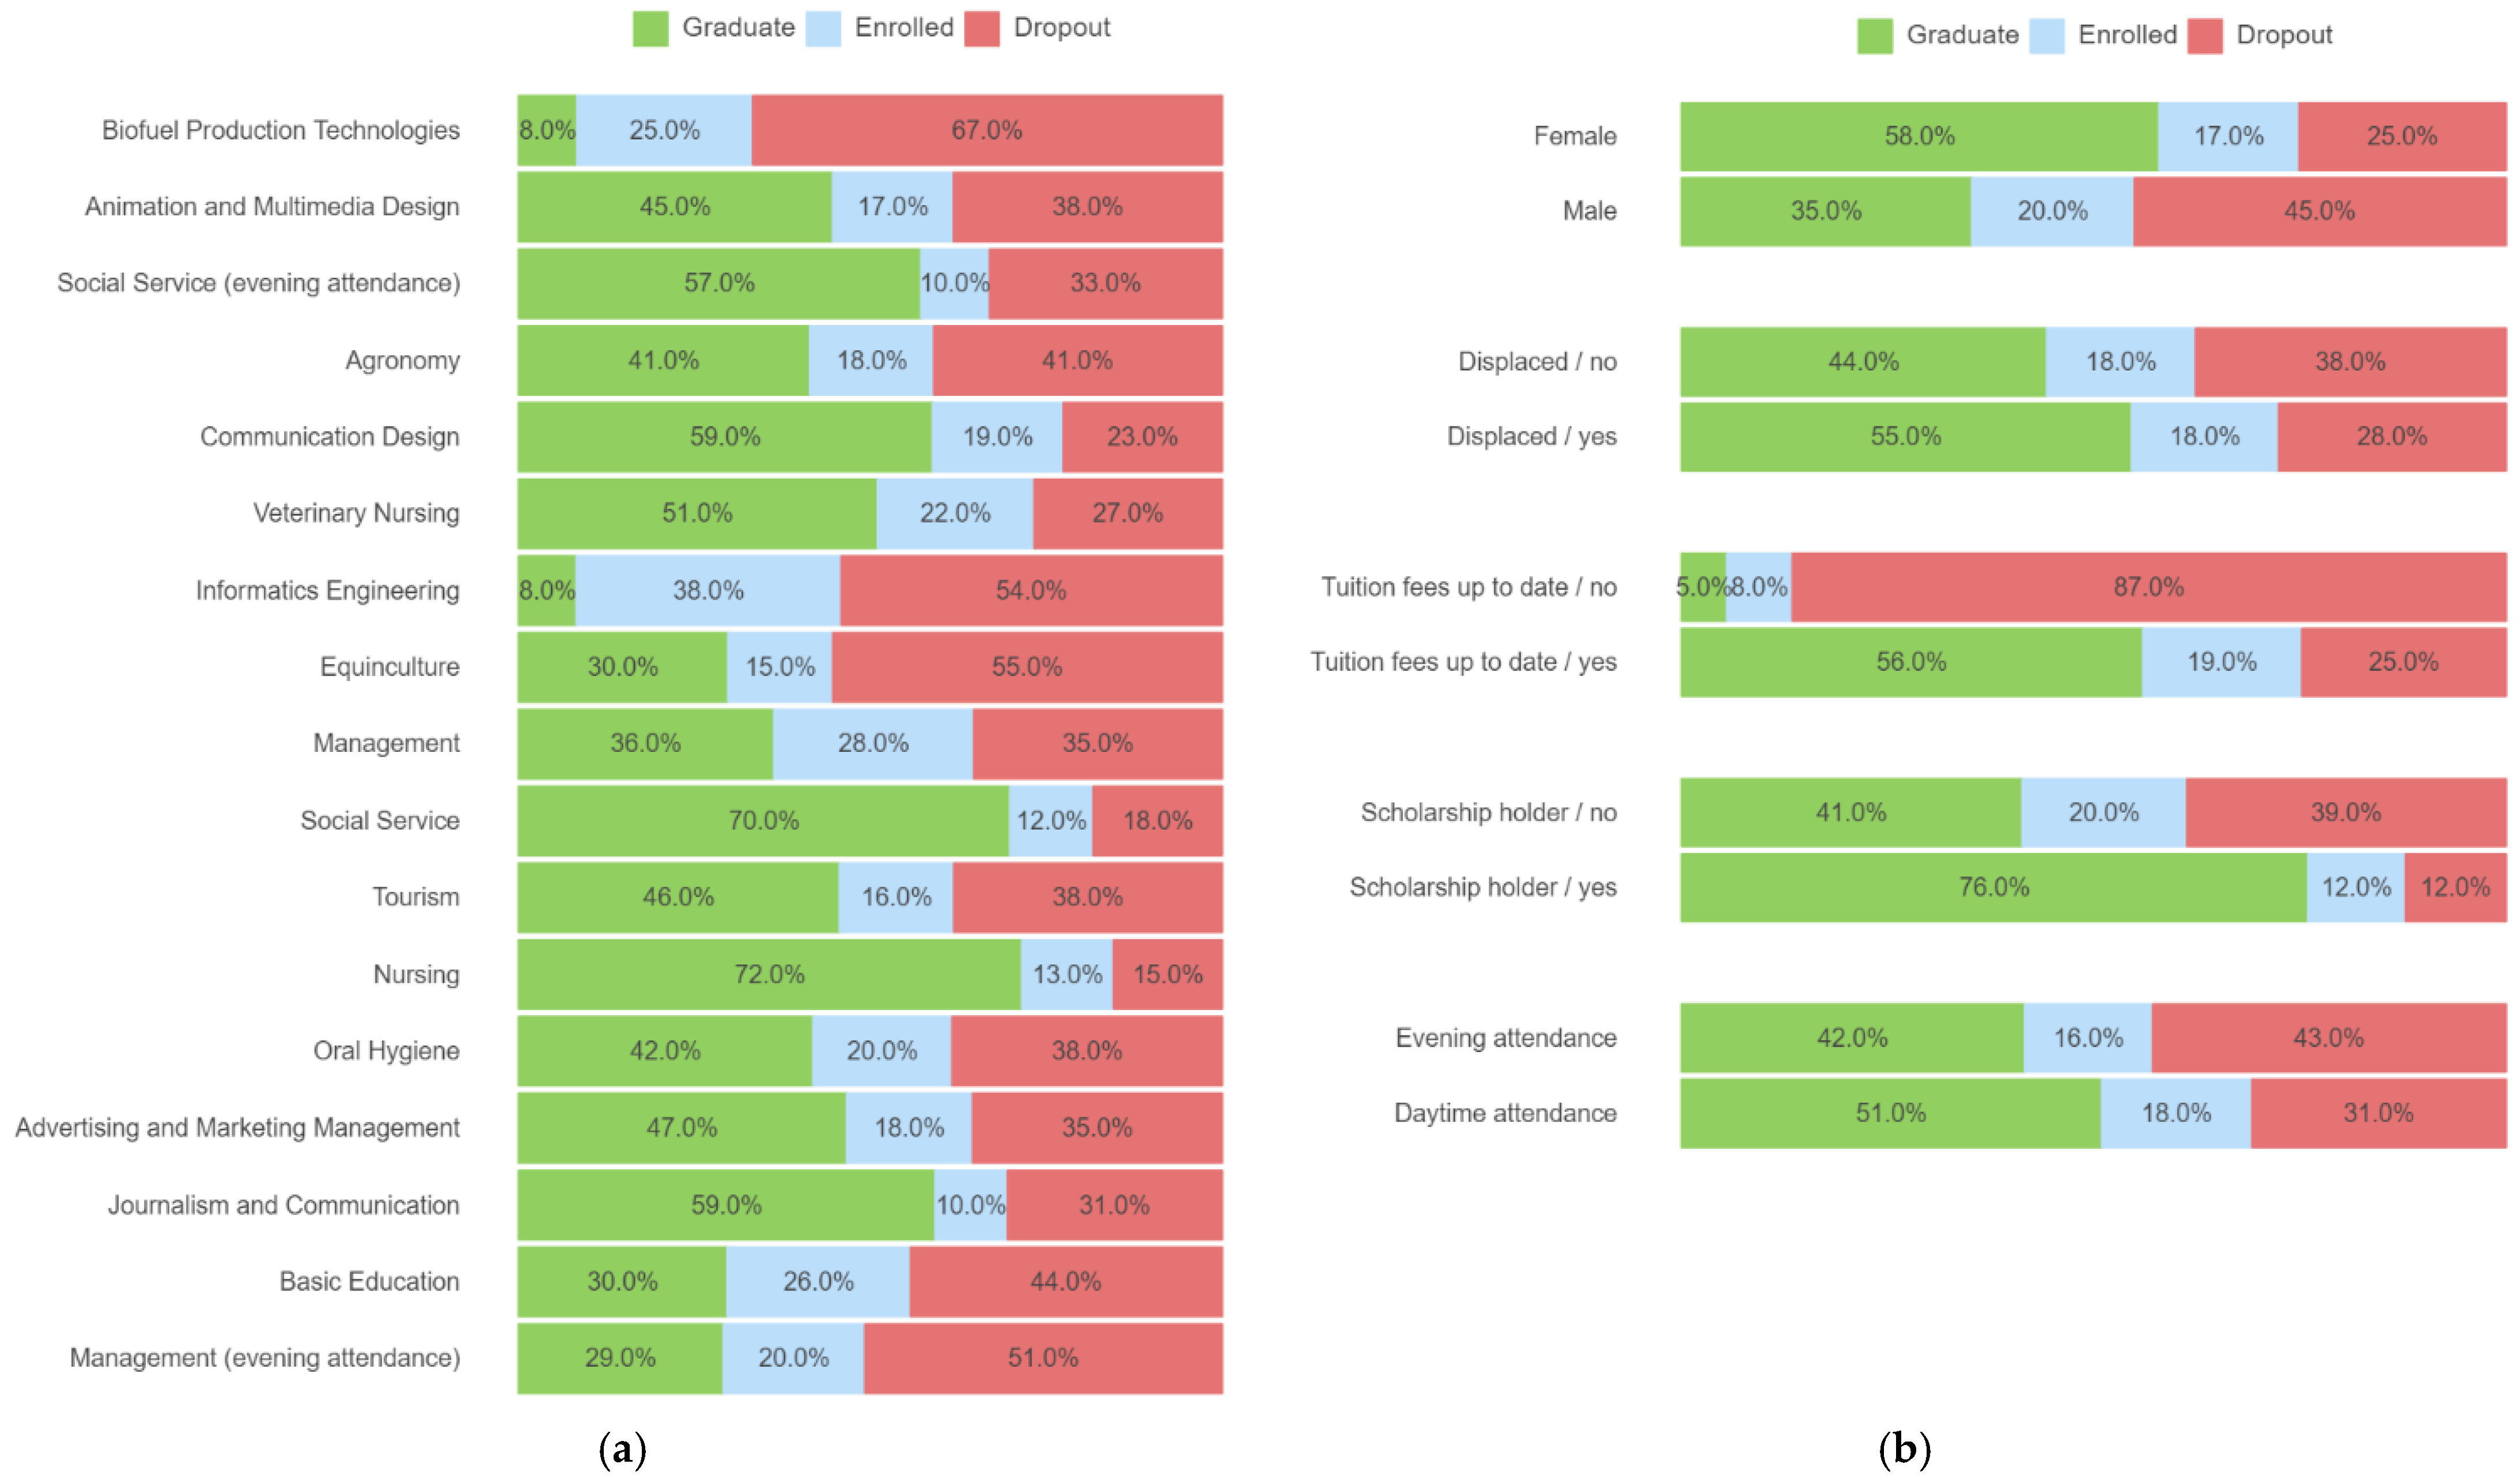
Figure 3 shows the same imbalanced nature of data when grouping the student outcomes by course, gender, student displaced, tuition fees up to date, scholarship holder, and evening/daytime attendance. Figure 3a shows that the most successful courses are Nursing and Social Service, with 72% and 70% of the students, respectively, receiving their degree within the normal duration of the course. On the opposite side, the technologies field with the courses of Biofuel Production Technologies and Informatics Engineering presents the most unsuccessful results, with only 8% of the students receiving their degree within the normal duration of the course. Dropout is also higher in these two courses (67% and 54%, respectively), along with the Equiniculture course with 55% dropout. Figure 3b shows that females are most successful, as well as the students that hold a scholarship and have their tuition fees up to date. Regarding the attendance regime (daytime or evening), the results show that students with daytime attendance finish the course earlier than evening students, as well as the students that are displaced from their homes.
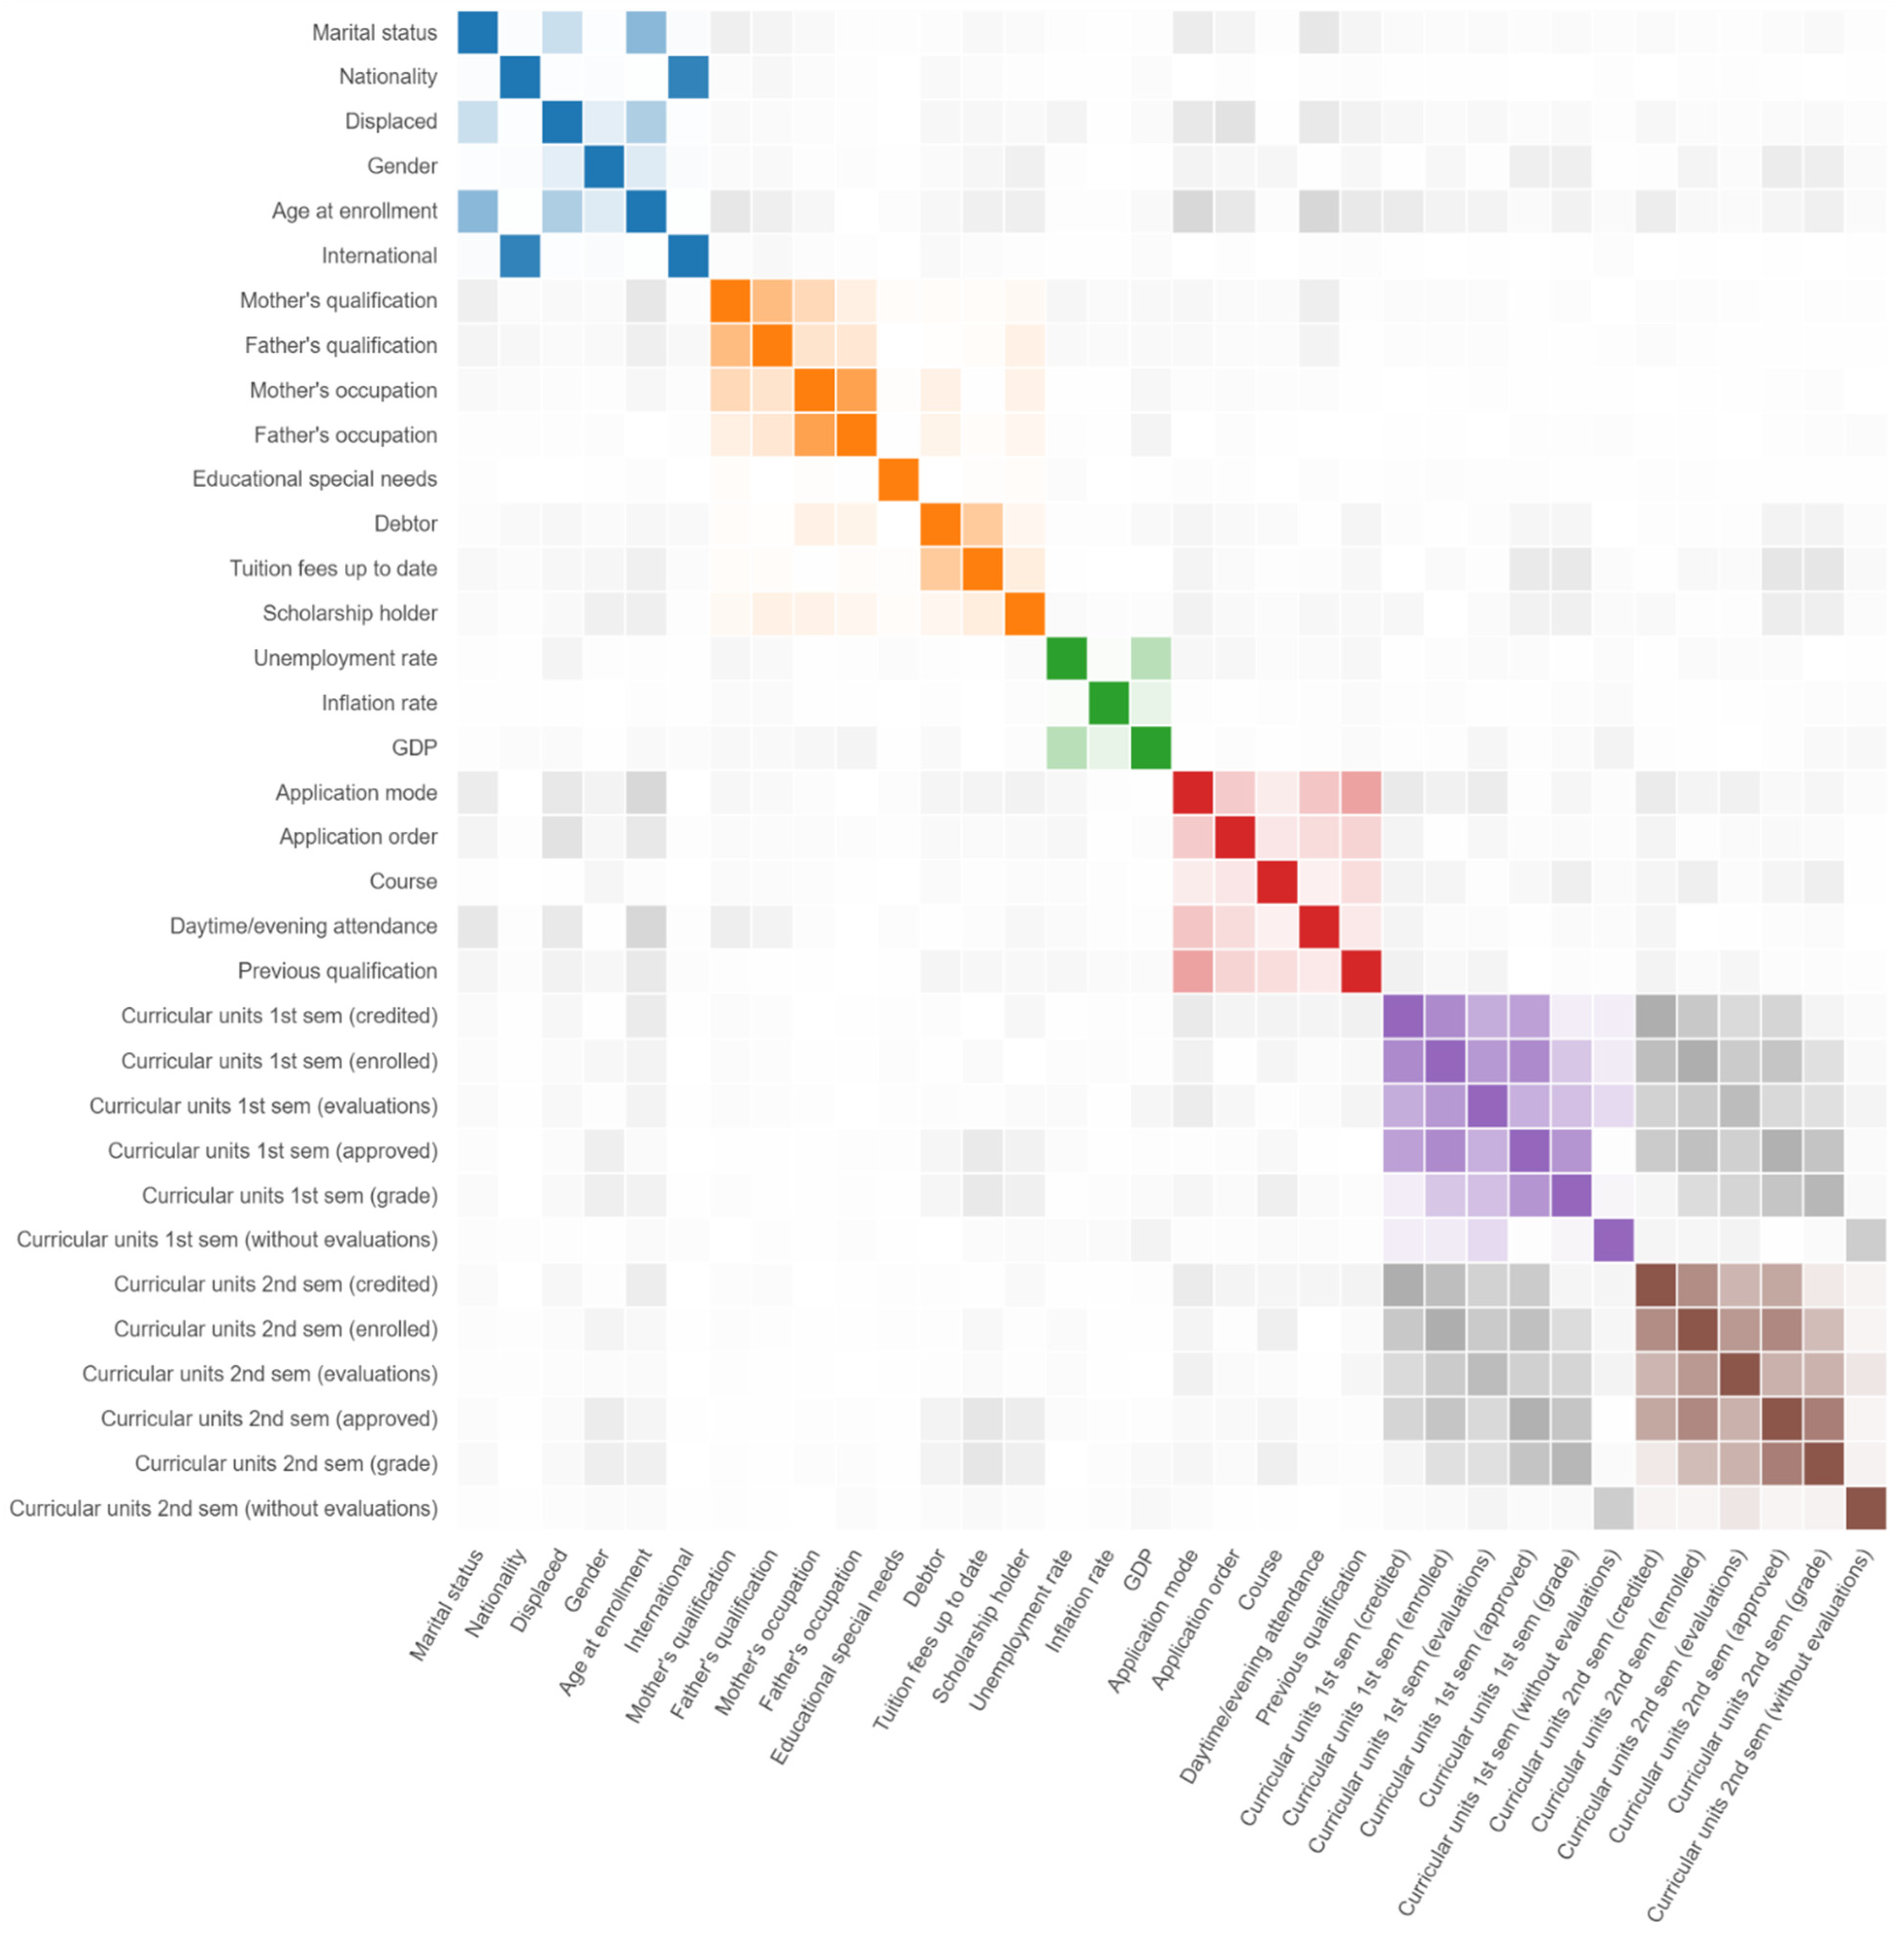
3.2.3. Multi-collinearity
Collinearity (or multi-collinearity) may be an issue that must be considered in some types of problems. The analysis of the heatmap (Figure 4), using the Pearson correlation coefficient, shows that there are some pairs of features having high correlation coefficients, which increases multi-collinearity in the dataset. In Figure 4, the blues represent the heatmap between demographics features, the oranges between socioeconomics features, the greens between macroeconomics features, the reds between academics features at enrollment time, the purples between academics features at the end of the first semester, the browns at the end of the second semester and, the grays represent collinearity between groups of features.
The collinearity is strongest within the same group of features, but we can also find higher values of correlation between groups. Table 9 shows a Pearson correlation coefficient greater than 0.7, which shows that the correlation is the strongest in features in the same groups, such as “Nationality” and “International” or “Mother’s occupation” and “Father’s occupation”, but also between the groups related with the performance at the end of the first semester and the second semester, such as “Curricular units 1st sem (approved)” and “Curricular units 2nd sem (approved)”.
3.2.4. Feature Importance
Feature importance plays an important role in understanding the data and also in the improvement and interpretation of the machine learning models. On the other hand, useless data results in bias that messes up the final results of a machine learning problem, so feature importance is frequently used to reduce de number of features used. The most important features differ depending on the technique used to calculate the importance of each feature and also the machine learning algorithm used [17]. One of the simplest and most used techniques to measure feature importance is Permutation Feature Importance. In this technique, feature importance is calculated by noticing the increase or decrease in error when we permute the values of a feature. If permuting the values causes a huge change in the error, it means the feature is important for our model.
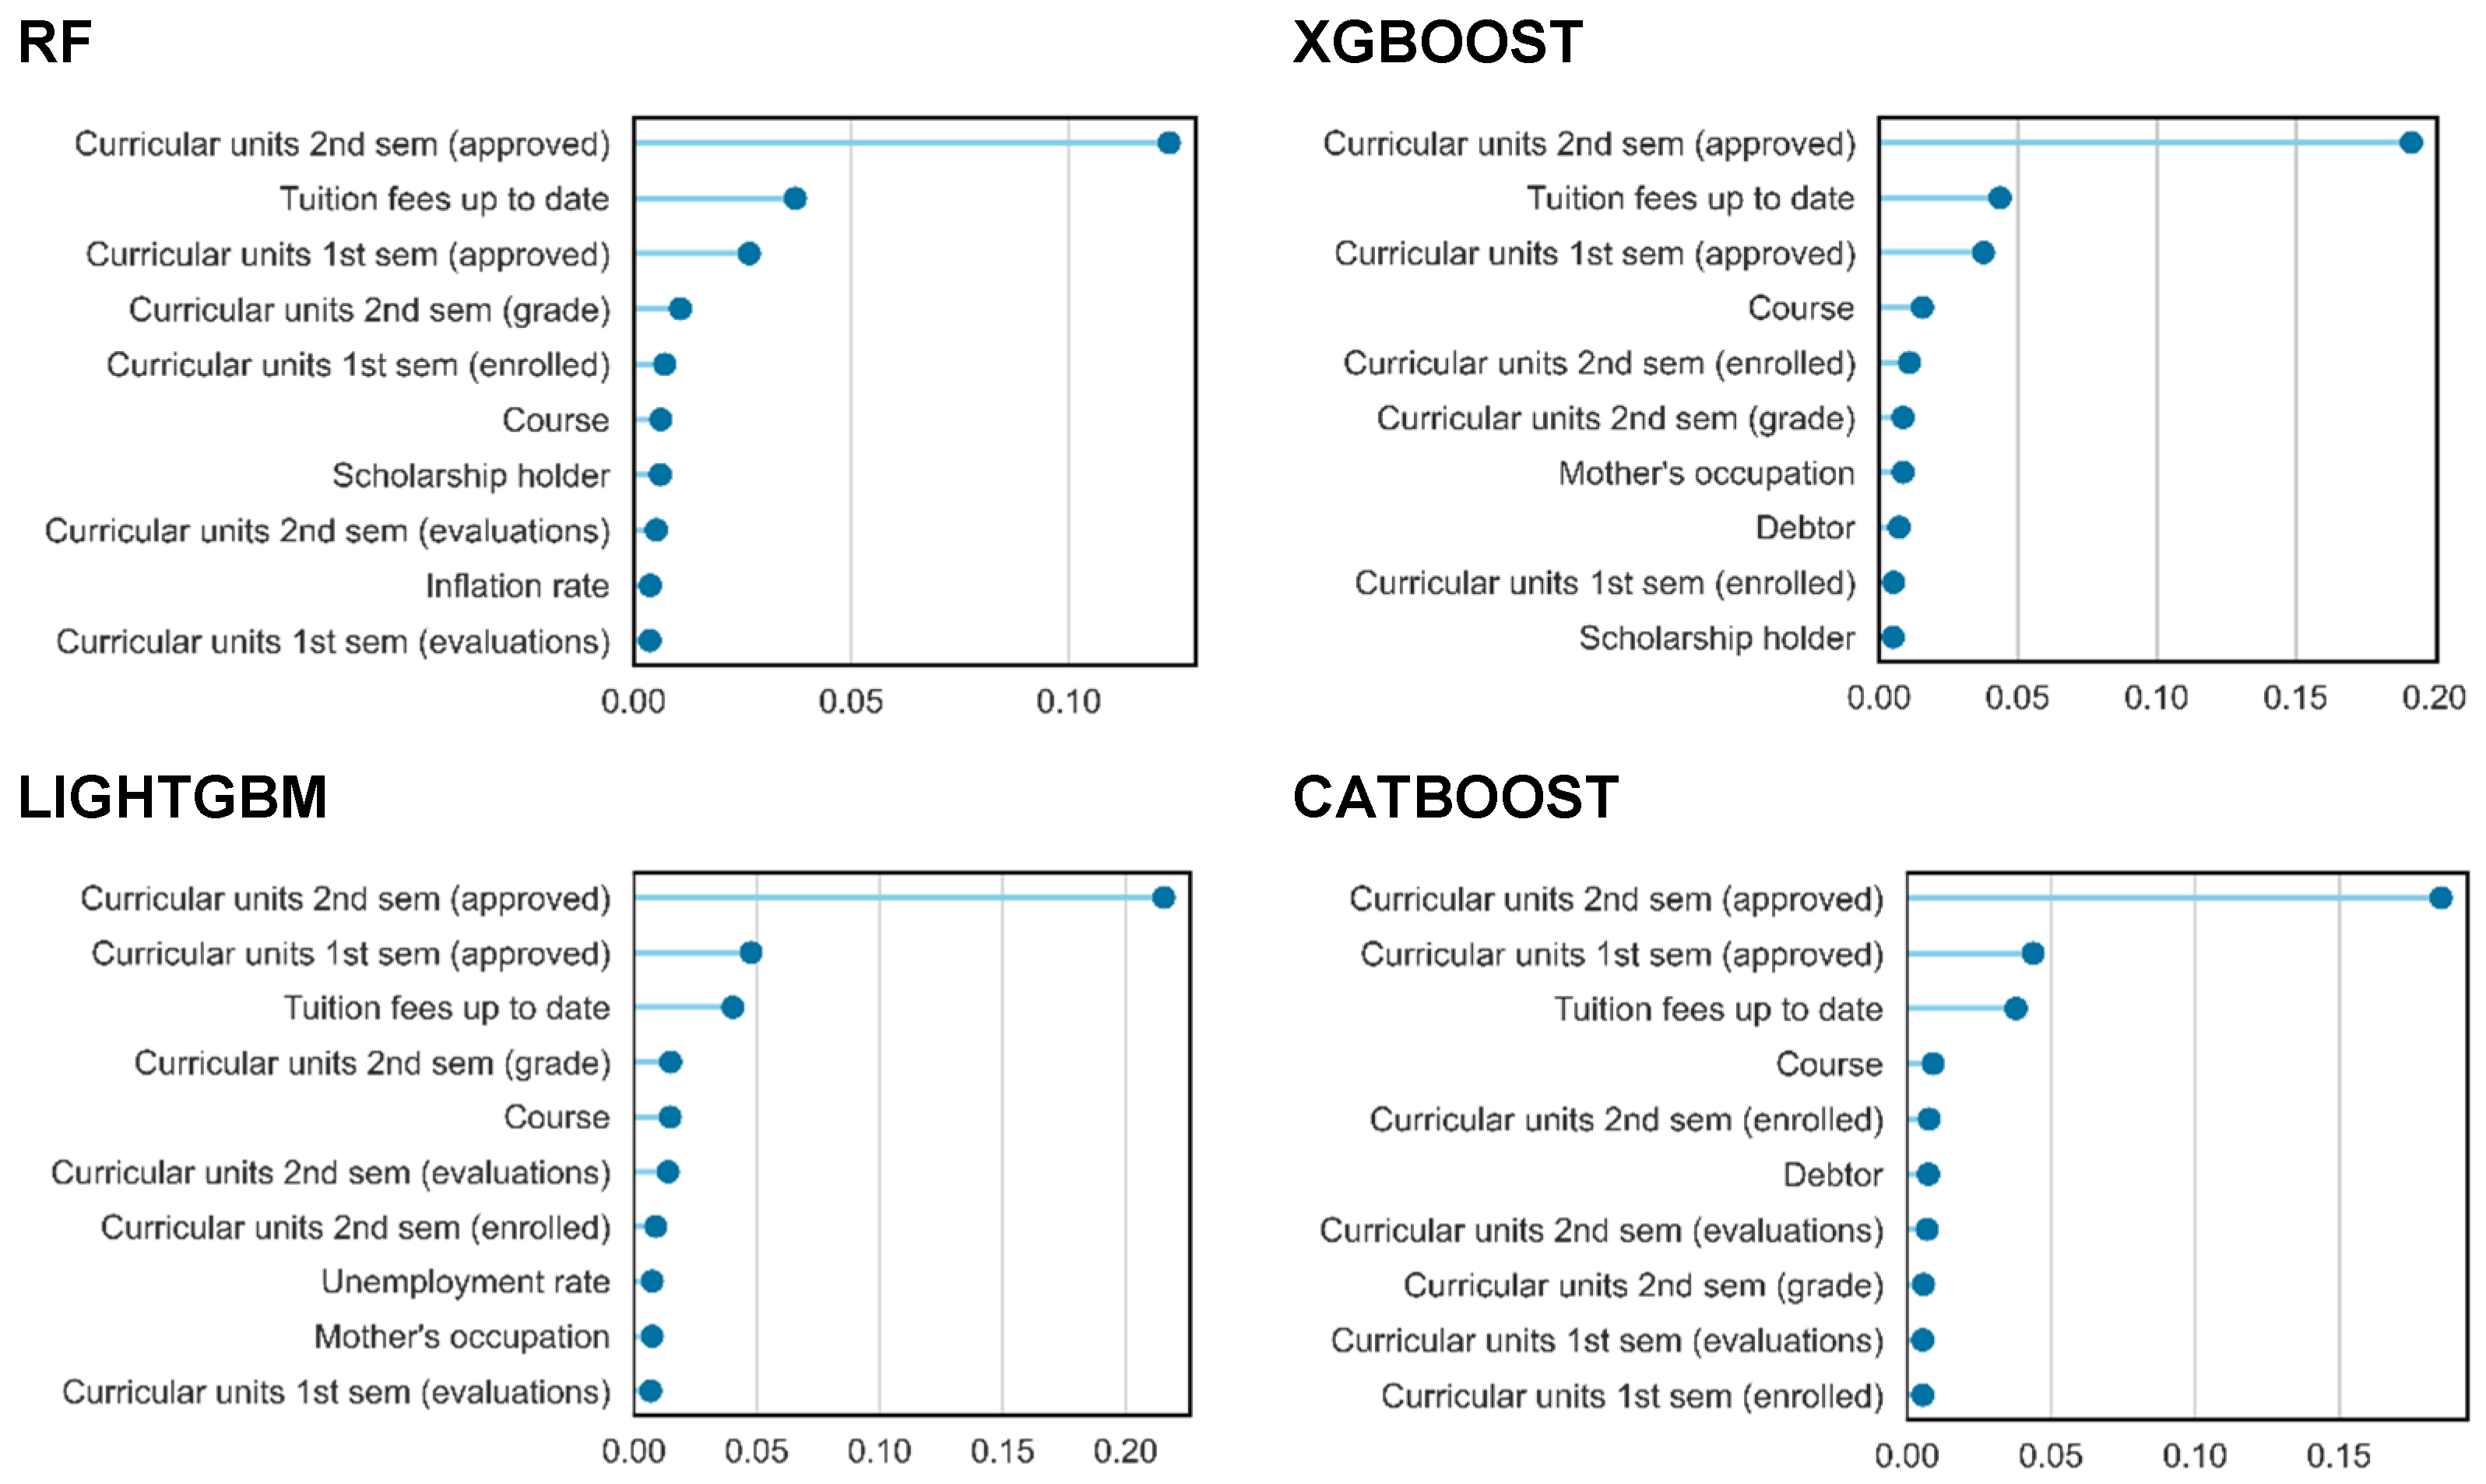
We performed a test to determine the most important features considering the Permutation Feature Importance, using F1 as the error metric, which is a metric more adequate for imbalanced data, taking into account the trade-off between precision and recall. The Permutation Feature Importance was applied to some of the most interesting results reported in the literature for multiclass imbalanced classification [18,19]. We used the ensemble method Random Forest (RF) [20] and three general boosting methods: Extreme Gradient Boosting (XGBOOST) [21], Light Gradient Boosting Machine (LIGHTGBM) [22], and CatBoost (CATBOOST) [23]. Figure 5 shows the 10 biggest changes in the F1-score metric using the Permutation Feature Importance technic for each machine learning algorithm considered. The analysis of these results shows that five features are considered important in all algorithms: “Curricular units 2nd sem (approved)”, “Curricular units 1st sem (approved)”, “Curricular units 2nd sem (grade)”, “Course”, and “Tuition fees up to date”. The features “Curricular units 1st sem (enrolled)”, “Curricular units 1st sem (evaluations)”, “Curricular units 2nd sem (enrolled)”, and “Curricular units 2nd sem (evaluations)” are important in three of the algorithms.
3.3. Compliances
All data are anonymized, and compliance with the Privacy and Personal Data Processing Policy of the institution is ensured according to the General Data Protection Regulation (GDPR). This dataset is also compliant with the FAIR (Findability, Accessibility, Interoperability, and Reusability) principles for scientific data management [24].
4. Conclusions
This descriptor presents a dataset created from the Polytechnic Institute of Portalegre (acquired from several disjoint databases) related to students enrolled in different undergraduate degrees, such as agronomy, design, education, nursing, journalism, management, social service, and technologies. It contains 4424 records with 35 attributes that include information known at the time of student enrollment, demographics, socioeconomics, macroeconomics data, and students’ academic performance at the end of the first and second semesters.
The dataset is useful for researchers who want to conduct comparative studies on student academic performance and also for training in the machine learning area.
Supplementary Materials
The document with detailed features information can be consulted at: http://valoriza.ipportalegre.pt/piaes/features-info-stats.html (accessed on 10 October 2022).
Author Contributions
Conceptualization, V.R., J.M., L.B. and M.V.M.; methodology, M.V.M., J.M. and V.R.; software, V.R.; validation, V.R. and M.V.M.; resources, V.R.; data curation, V.R. and M.V.M.; writing—original draft preparation, V.R.; writing—review and editing, L.B. and M.V.M.; visualization, V.R.; project administration, V.R.; funding acquisition, V.R. All authors have read and agreed to the published version of the manuscript.
Funding
This research was funded by the program SATDAP—Capacitação da Administração Pública under grant number POCI-05-5762-FSE-000191.
Institutional Review Board Statement
Privacy issues related to the use and publication of the dataset were validated by the Data Protection Officer (DPO) of the Polytechnic Institute of Portalegre according to the General Data Protection Regulation (GDPR) directives.
Informed Consent Statement
Not applicable.
Data Availability Statement
The data presented in this study are publicly available at https://0-doi-org.brum.beds.ac.uk/10.5281/zenodo.5777339 (accessed on 10 October 2022).
Acknowledgments
The authors would like to thank the Polytechnic Institute of Portalegre for providing support for this project, particularly to the Academic Services Department for providing the data and explaining the attributes used.
Conflicts of Interest
The authors declare no conflict of interest.
Abbreviations
The following abbreviations are used in this manuscript:
| AMS | Academic Management System |
| CATBOOST | CatBoost |
| CSV | Comma-separated values |
| DGES | Direção Geral do Ensino Superior |
| DPO | Data Protection Officer |
| GDPR | General Data Protection Regulation |
| LIGHTGBM | Light Gradient Boosting Machine |
| PAE | Enterprise Application Platform |
| RF | Random Forest |
| XGBOOST | Extreme Gradient Boost |
Appendix A

Table A1.
Marital status values.
| Attribute | Values |
| Marital status | 1—Single |
| 2—Married | |
| 3—Widower | |
| 4—Divorced | |
| 5—Facto union | |
| 6—Legally separated |
Table A2.
Nationality values.
| Attribute | Values |
| Nationality | 1—Portuguese |
| 2—German | |
| 3—Spanish | |
| 4—Italian | |
| 5—Dutch | |
| 6—English | |
| 7—Lithuanian | |
| 8—Angolan | |
| 9—Cape Verdean | |
| 10—Guinean | |
| 11—Mozambican | |
| 12—Santomean | |
| 13—Turkish | |
| 14—Brazilian | |
| 15—Romanian | |
| 16—Moldova (Republic of) | |
| 17—Mexican | |
| 18—Ukrainian | |
| 19—Russian | |
| 20—Cuban | |
| 21—Colombian |
Table A3.
Application mode values.
| Attribute | Values |
| Application mode | 1—1st phase—general contingent |
| 2—Ordinance No. 612/93 | |
| 3—1st phase—special contingent (Azores Island) | |
| 4—Holders of other higher courses | |
| 5—Ordinance No. 854-B/99 | |
| 6—International student (bachelor) | |
| 7—1st phase—special contingent (Madeira Island) | |
| 8—2nd phase—general contingent | |
| 9—3rd phase—general contingent | |
| 10—Ordinance No. 533-A/99, item b2) (Different Plan) | |
| 11—Ordinance No. 533-A/99, item b3 (Other Institution) | |
| 12—Over 23 years old | |
| 13—Transfer | |
| 14—Change in course | |
| 15—Technological specialization diploma holders | |
| 16—Change in institution/course | |
| 17—Short cycle diploma holders | |
| 18—Change in institution/course (International) |
Table A4.
Course values.
| Attribute | Values |
| Course | 1—Biofuel Production Technologies |
| 2—Animation and Multimedia Design | |
| 3—Social Service (evening attendance) | |
| 4—Agronomy | |
| 5—Communication Design | |
| 6—Veterinary Nursing | |
| 7—Informatics Engineering | |
| 8—Equiniculture | |
| 9—Management | |
| 10—Social Service | |
| 11—Tourism | |
| 12—Nursing | |
| 13—Oral Hygiene | |
| 14—Advertising and Marketing Management | |
| 15—Journalism and Communication | |
| 16—Basic Education | |
| 17—Management (evening attendance) |
Table A5.
Previous qualification values.
| Attribute | Values |
| Previous qualification | 1—Secondary education |
| 2—Higher education—bachelor’s degree | |
| 3—Higher education—degree | |
| 4—Higher education—master’s degree | |
| 5—Higher education—doctorate | |
| 6—Frequency of higher education | |
| 7—12th year of schooling—not completed | |
| 8—11th year of schooling—not completed | |
| 9—Other—11th year of schooling | |
| 10—10th year of schooling | |
| 11—10th year of schooling—not completed | |
| 12—Basic education 3rd cycle (9th/10th/11th year) or equivalent | |
| 13—Basic education 2nd cycle (6th/7th/8th year) or equivalent | |
| 14—Technological specialization course | |
| 15—Higher education—degree (1st cycle) | |
| 16—Professional higher technical course | |
| 17—Higher education—master’s degree (2nd cycle) |
Table A6.
Mother’s and Father’s values.
| Attribute | Values |
| Mother’s qualification Father’s qualification | 1—Secondary Education—12th Year of Schooling or Equivalent |
| 2—Higher Education—bachelor’s degree | |
| 3—Higher Education—degree | |
| 4—Higher Education—master’s degree | |
| 5—Higher Education—doctorate | |
| 6—Frequency of Higher Education | |
| 7—12th Year of Schooling—not completed | |
| 8—11th Year of Schooling—not completed | |
| 9—7th Year (Old) | |
| 10—Other—11th Year of Schooling | |
| 11—2nd year complementary high school course | |
| 12—10th Year of Schooling | |
| 13—General commerce course | |
| 14—Basic Education 3rd Cycle (9th/10th/11th Year) or Equivalent | |
| 15—Complementary High School Course | |
| 16—Technical-professional course | |
| 17—Complementary High School Course—not concluded | |
| 18—7th year of schooling | |
| 19—2nd cycle of the general high school course | |
| 20—9th Year of Schooling—not completed | |
| 21—8th year of schooling | |
| 22—General Course of Administration and Commerce | |
| 23—Supplementary Accounting and Administration | |
| 24—Unknown | |
| 25—Cannot read or write | |
| 26—Can read without having a 4th year of schooling | |
| 27—Basic education 1st cycle (4th/5th year) or equivalent | |
| 28—Basic Education 2nd Cycle (6th/7th/8th Year) or equivalent | |
| 29—Technological specialization course | |
| 30—Higher education—degree (1st cycle) | |
| 31—Specialized higher studies course | |
| 32—Professional higher technical course | |
| 33—Higher Education—master’s degree (2nd cycle) | |
| 34—Higher Education—doctorate (3rd cycle) |
Table A7.
Mother’s and Father’s occupation.
| Attribute | Values |
| Mother’s occupation Father’s occupation | 1—Student |
| 2—Representatives of the Legislative Power and Executive Bodies, Directors, Directors and Executive Managers | |
| 3—Specialists in Intellectual and Scientific Activities | |
| 4—Intermediate Level Technicians and Professions | |
| 5—Administrative staff | |
| 6—Personal Services, Security and Safety Workers, and Sellers | |
| 7—Farmers and Skilled Workers in Agriculture, Fisheries, and Forestry | |
| 8—Skilled Workers in Industry, Construction, and Craftsmen | |
| 9—Installation and Machine Operators and Assembly Workers | |
| 10—Unskilled Workers | |
| 11—Armed Forces Professions | |
| 12—Other Situation; 13—(blank) | |
| 14—Armed Forces Officers | |
| 15—Armed Forces Sergeants | |
| 16—Other Armed Forces personnel | |
| 17—Directors of administrative and commercial services | |
| 18—Hotel, catering, trade, and other services directors | |
| 19—Specialists in the physical sciences, mathematics, engineering, and related techniques | |
| 20—Health professionals | |
| 21—Teachers | |
| 22—Specialists in finance, accounting, administrative organization, and public and commercial relations | |
| 23—Intermediate level science and engineering technicians and professions | |
| 24—Technicians and professionals of intermediate level of health | |
| 25—Intermediate level technicians from legal, social, sports, cultural, and similar services | |
| 26—Information and communication technology technicians | |
| 27—Office workers, secretaries in general, and data processing operators | |
| 28—Data, accounting, statistical, financial services, and registry-related operators | |
| 29—Other administrative support staff | |
| 30—Personal service workers | |
| 31—Sellers | |
| 32—Personal care workers and the like | |
| 33—Protection and security services personnel | |
| 34—Market-oriented farmers and skilled agricultural and animal production workers | |
| 35—Farmers, livestock keepers, fishermen, hunters and gatherers, and subsistence | |
| 36—Skilled construction workers and the like, except electricians | |
| 37—Skilled workers in metallurgy, metalworking, and similar | |
| 38—Skilled workers in electricity and electronics | |
| 39—Workers in food processing, woodworking, and clothing and other industries and crafts | |
| 40—Fixed plant and machine operators | |
| 41—Assembly workers | |
| 42—Vehicle drivers and mobile equipment operators | |
| 43—Unskilled workers in agriculture, animal production, and fisheries and forestry | |
| 44—Unskilled workers in extractive industry, construction, manufacturing, and transport | |
| 45—Meal preparation assistants | |
| 46—Street vendors (except food) and street service providers |
Table A8.
Gender values.
| Attribute | Values |
| Gender | 1—male |
| 0—female |
Table A9.
Attendance regime values.
| Attribute | Values |
| Daytime/evening attendance | 1—daytime |
| 0—evening |
Table A10.
Yes/No attributes.
| Attribute | Values |
| Displaced Educational special needs Debtor Tuition fees up to date Scholarship holder International | 1—yes 0—no |
References
- Behr, A.; Giese, M.; Teguim Kamdjou, H.D.; Theune, K. Motives for Dropping out from Higher Education—An Analysis of Bachelor’s Degree Students in Germany. Eur. J. Educ. 2021, 56, 325–343. [Google Scholar] [CrossRef]
- Kehm, B.M.; Larsen, M.R.; Sommersel, H.B. Student Dropout from Universities in Europe: A Review of Empirical Literature. Hungarian Educ. Res. J. 2020, 9, 147–164. [Google Scholar] [CrossRef]
- Atchley, W.; Wingenbach, G.; Akers, C. Comparison of Course Completion and Student Performance through Online and Traditional Courses. Int. Rev. Res. Open Distance Learn. 2013, 14, 104–116. [Google Scholar] [CrossRef] [Green Version]
- Quinn, J. Dropout and Completion in Higher Education in Europe among Students from Under-Represented Groups; An Independent report authored for the NESET network of experts; European Commission: Brussels, Belgium, 2013.
- Namoun, A.; Alshanqiti, A. Predicting Student Performance Using Data Mining and Learning Analytics Techniques: A Systematic Literature Review. Appl. Sci. 2020, 11, 237. [Google Scholar] [CrossRef]
- Saa, A.A.; Al-Emran, M.; Shaalan, K. Mining Student Information System Records to Predict Students’ Academic Performance. Adv. Intell. Syst. Comput. 2020, 921, 229–239. [Google Scholar] [CrossRef]
- Akçapınar, G.; Altun, A.; Aşkar, P. Using Learning Analytics to Develop Early-Warning System for at-Risk Students. Int. J. Educ. Technol. High. Educ. 2019, 16, 40. [Google Scholar] [CrossRef]
- Daud, A.; Lytras, M.D.; Aljohani, N.R.; Abbas, F.; Abbasi, R.A.; Alowibdi, J.S. Predicting Student Performance Using Advanced Learning Analytics. In Proceedings of the 26th International World Wide Web Conference 2017, WWW 2017 Companion, Perth, Australia, 3–7 April 2017; pp. 415–421. [Google Scholar] [CrossRef] [Green Version]
- Martins, M.V.; Tolledo, D.; Machado, J.; Baptista, L.M.T.; Realinho, V. Early Prediction of Student’s Performance in Higher Education: A Case Study. Adv. Intell. Syst. Comput. 2021, 1365, 166–175. [Google Scholar] [CrossRef]
- Chawla, N.V.; Bowyer, K.W.; Hall, L.O.; Kegelmeyer, W.P. SMOTE: Synthetic Minority Over-Sampling Technique. J. Artif. Intell. Res. 2002, 16, 321–357. [Google Scholar] [CrossRef]
- He, H.; Bai, Y.; Garcia, E.A.; Li, S. ADASYN: Adaptive Synthetic Sampling Approach for Imbalanced Learning. In Proceedings of the International Joint Conference on Neural Networks, Hong Kong, China, 1–8 June 2008; pp. 1322–1328. [Google Scholar] [CrossRef]
- Chen, C.; Liaw, A.; Breiman, L. Using Random Forest to Learn Imbalanced Data. Univ. Calif. Berkeley 2004, 110, 1–12. [Google Scholar]
- Liu, X.Y.; Wu, J.; Zhou, Z.H. Exploratory Undersampling for Class-Imbalance Learning. IEEE Trans. Syst. Man Cybern. Part B Cybern. 2009, 39, 539–550. [Google Scholar] [CrossRef]
- Maclin, R.; Opitz, D. An Empirical Evaluation of Bagging and Boosting. In Proceedings of the National Conference on Artificial Intelligence, Providence, RI, USA; 1997; pp. 546–551. [Google Scholar]
- Hido, S.; Kashima, H.; Takahashi, Y. Roughly Balanced Bagging for Imbalanced Data. Stat. Anal. Data Min. 2009, 2, 412–426. [Google Scholar] [CrossRef]
- Wang, S.; Yao, X. Diversity Analysis on Imbalanced Data Sets by Using Ensemble Models. In Proceedings of the 2009 IEEE Symposium on Computational Intelligence and Data Mining, Nashville, TN, USA, 30 March–2 April 2009; pp. 324–331. [Google Scholar] [CrossRef] [Green Version]
- Saarela, M.; Jauhiainen, S. Comparison of Feature Importance Measures as Explanations for Classification Models. SN Appl. Sci. 2021, 3, 272. [Google Scholar] [CrossRef]
- Spelmen, V.S.; Porkodi, R. A Review on Handling Imbalanced Data. In Proceedings of the 2018 International Conference on Current Trends towards Converging Technologies (ICCTCT), Coimbatore, India, 1–3 March 2018. [Google Scholar] [CrossRef]
- Ali, H.; Salleh, M.N.M.; Saedudin, R.; Hussain, K.; Mushtaq, M.F. Imbalance Class Problems in Data Mining: A Review. Indones. J. Electr. Eng. Comput. Sci. 2019, 14, 1552–1563. [Google Scholar] [CrossRef]
- Ho, T.K. Random Decision Forests. In Proceedings of the 3rd International Conference on Document Analysis and Recognition, Montreal, QC, Canada, 14–16 August 1995; Volume 1, pp. 278–282. [Google Scholar] [CrossRef]
- Chen, T.; Guestrin, C. XGBoost: A Scalable Tree Boosting System. In Proceedings of the 22nd ACM SIGKDD International Conference, San Francisco, CA, USA, 13–17 August 2016. [Google Scholar] [CrossRef]
- Ke, G.; Meng, Q.; Finley, T.; Wang, T.; Chen, W.; Ma, W.; Ye, Q.; Liu, T.Y. LightGBM: A Highly Efficient Gradient Boosting Decision Tree. Adv. Neural Inf. Process. Syst. 2017, 30, 3147–3155. [Google Scholar] [CrossRef]
- Prokhorenkova, L.; Gusev, G.; Vorobev, A.; Dorogush, A.V.; Gulin, A. CatBoost: Unbiased Boosting with Categorical Features. arXiv 2017, arXiv:1706.09516v5. [Google Scholar] [CrossRef]
- Wilkinson, M.D.; Dumontier, M.; Aalbersberg, I.J.; Appleton, G.; Axton, M.; Baak, A.; Blomberg, N.; Boiten, J.W.; da Silva Santos, L.B.; Bourne, P.E.; et al. The FAIR Guiding Principles for Scientific Data Management and Stewardship. Sci. Data 2016, 3, 160018. [Google Scholar] [CrossRef] [PubMed]
Figure 1.
Workflow designed to create the dataset.

Figure 2.
Distribution of student records among the three categories considered for academic success.
Figure 2.
Distribution of student records among the three categories considered for academic success.

Figure 3.
Student outcomes grouped by: (a) course; (b) gender, student displaced, tuition fees up to date, scholarship holder, and evening/daytime attendance.
Figure 3.
Student outcomes grouped by: (a) course; (b) gender, student displaced, tuition fees up to date, scholarship holder, and evening/daytime attendance.

Figure 4.
Heatmap with Pearson correlation.

Figure 5.
Plot of top 10 Permutation Feature Importance for each machine learning algorithm considered.
Figure 5.
Plot of top 10 Permutation Feature Importance for each machine learning algorithm considered.

Table 1.
Attributes used grouped by class of attribute.
| Class of Attribute | Attribute | Type |
|---|---|---|
| Demographic data | Marital status | Numeric/discrete |
| Nationality | Numeric/discrete | |
| Displaced | Numeric/binary | |
| Gender | Numeric/binary | |
| Age at enrollment | Numeric/discrete | |
| International | Numeric/binary | |
| Socioeconomic data | Mother’s qualification | Numeric/discrete |
| Father’s qualification | Numeric/discrete | |
| Mother’s occupation | Numeric/discrete | |
| Father’s occupation | Numeric/discrete | |
| Educational special needs | Numeric/binary | |
| Debtor | Numeric/binary | |
| Tuition fees up to date | Numeric/binary | |
| Scholarship holder | Numeric/binary | |
| Macroeconomic data | Unemployment rate | Numeric/continuous |
| Inflation rate | Numeric/continuous | |
| GDP | Numeric/continuous | |
| Academic data at enrollment | Application mode | Numeric/discrete |
| Application order | Numeric/ordinal | |
| Course | Numeric/discrete | |
| Daytime/evening attendance | Numeric/binary | |
| Previous qualification | Numeric/discrete | |
| Academic data at the end of 1st semester | Curricular units 1st sem (credited) | Numeric/discrete |
| Curricular units 1st sem (enrolled) | Numeric/discrete | |
| Curricular units 1st sem (evaluations) | Numeric/discrete | |
| Curricular units 1st sem (approved) | Numeric/discrete | |
| Curricular units 1st sem (grade) | Numeric/continuous | |
| Curricular units 1st sem (without evaluations) | Numeric/discrete | |
| Academic data at the end of 2nd semester | Curricular units 2nd sem (credited) | Numeric/discrete |
| Curricular units 2nd sem (enrolled) | Numeric/discrete | |
| Curricular units 2nd sem (evaluations) | Numeric/discrete | |
| Curricular units 2nd sem (approved) | Numeric/discrete | |
| Curricular units 2nd sem (grade) | Numeric/continuous | |
| Curricular units 2nd sem (without evaluations) | Numeric/discrete | |
| Target | Target | Categorical |
Table 2.
Basic statistics information about demographic data.
| Attribute | Distrib. | Mean | Median | Dispersion | Min. | Max. |
|---|---|---|---|---|---|---|
| Marital status |  | 1.180 | 1 | 0.510 | 1 | 6 |
| Nationality |  | 1.250 | 1 | 1.390 | 1 | 21 |
| Displaced |  | 0.548 | 1 | 0.907 | 0 | 1 |
| Gender |  | 0.352 | 0 | 1.358 | 0 | 1 |
| Age at enrollment |  | 23.130 | 20 | 0.320 | 17 | 70 |
| International |  | 0.025 | 0 | 6.262 | 0 | 1 |
Table 3.
Basic statistics information about socioeconomics data.
| Attribute | Distrib. | Mean | Median | Dispersion | Min. | Max. |
|---|---|---|---|---|---|---|
| Father’s qualification |  | 16.460 | 14 | 0.670 | 1 | 34 |
| Mother’s qualification |  | 12.320 | 13 | 0.730 | 1 | 29 |
| Father’s occupation |  | 7.820 | 8 | 0.620 | 1 | 46 |
| Mother’s occupation |  | 7.320 | 6 | 0.550 | 1 | 32 |
| Educational special needs |  | 0.012 | 0 | 9.260 | 0 | 1 |
| Debtor |  | 0.114 | 0 | 2.792 | 0 | 1 |
| Tuition fees up to date |  | 0.881 | 1 | 0.368 | 0 | 1 |
| Scholarship holder |  | 0.248 | 0 | 1.739 | 0 | 1 |
Table 4.
Basic statistics information about macroeconomics data.
| Attribute | Distrib. | Mean | Median | Dispersion | Min. | Max. |
|---|---|---|---|---|---|---|
| Unemployment rate |  | 11.566 | 11.100 | 0.230 | 7.600 | 16.200 |
| Inflation rate |  | 1.228 | 1.400 | 1.126 | −0.800 | 3.700 |
| GDP |  | 0.002 | 0.320 | 1152.820 | −4.100 | 3.500 |
Table 5.
Basic statistics information about academic data at enrollment.
| Attribute | Distrib. | Mean | Median | Dispersion | Min. | Max. |
|---|---|---|---|---|---|---|
| Application mode |  | 6.890 | 8 | 0.770 | 1 | 18 |
| Application order |  | 1.730 | 1 | 0.760 | 1 | 9 |
| Course |  | 9.900 | 10 | 0.440 | 1 | 17 |
| Daytime/evening attendance |  | 0.891 | 1 | 0.350 | 0 | 1 |
| Previous qualification |  | 2.530 | 1 | 1.570 | 1 | 17 |
Table 6.
Basic statistics information about academic data at end of the first semester.
| Attribute | Distrib. | Mean | Median | Dispersion | Min. | Max. |
|---|---|---|---|---|---|---|
| Curricular units 1st sem (credited) |  | 0.710 | 0 | 3.320 | 0 | 20 |
| Curricular units 1st sem (enrolled) |  | 6.270 | 6 | 0.400 | 0 | 26 |
| Curricular units 1st sem (evaluations) |  | 8.300 | 8 | 0.500 | 0 | 45 |
| Curricular units 1st sem (approved) |  | 4.710 | 5 | 0.660 | 0 | 26 |
| Curricular units 1st sem (grade) |  | 10.641 | 12.286 | 0.455 | 0.000 | 18.875 |
| Curricular units 1st sem (without evaluations) |  | 0.140 | 0 | 5.020 | 0 | 12 |
Table 7.
Basic statistics information about academic data at end of the second semester.
| Attribute | Distrib. | Mean | Median | Dispersion | Min. | Max. |
|---|---|---|---|---|---|---|
| Curricular units 2nd sem (credited) |  | 0.540 | 0 | 3.540 | 0 | 19 |
| Curricular units 2nd sem (enrolled) |  | 6.230 | 6 | 0.350 | 0 | 23 |
| Curricular units 2nd sem (evaluations) |  | 8.060 | 8 | 0.490 | 0 | 33 |
| Curricular units 2nd sem (approved) |  | 4.440 | 5 | 0.680 | 0 | 20 |
| Curricular units 2nd sem (grade) |  | 10.230 | 12.200 | 0.509 | 0.000 | 18.571 |
| Curricular units 2nd sem (without evaluations) |  | 0.150 | 0 | 5.010 | 0 | 12 |
Table 8.
Basic statistics information about Target.
| Attribute | Distrib. | Center | Median | Dispersion | Min. | Max. |
|---|---|---|---|---|---|---|
| Target |  | Graduate | 1.02 |
Table 9.
Collinearity between features with Pearson correlation coefficient greater than 0.7.
| Feature | Collinearity with | Pearson |
|---|---|---|
| Curricular units 1st sem (credited) | Curricular units 2nd sem (credited) | 0.9448 |
| Curricular units 1st sem (enrolled) | 0.7743 | |
| Curricular units 1st sem (enrolled) | Curricular units 2nd sem (enrolled) | 0.9426 |
| Curricular units 1st sem (approved) | 0.7691 | |
| Curricular units 2nd sem (credited) | 0.7537 | |
| Nationality | International | 0.9117 |
| Curricular units 1st sem (approved) | Curricular units 2nd sem (approved) | 0.9040 |
| Curricular units 2nd sem (enrolled) | 0.7338 | |
| Curricular units 1st sem (grade) | Curricular units 2nd sem (grade) | 0.8372 |
| Curricular units 1st sem (evaluations) | Curricular units 2nd sem (evaluations) | 0.7789 |
| Curricular units 2nd sem (approved) | Curricular units 2nd sem (grade) | 0.7608 |
| Mother’s occupation | Father’s occupation | 0.7240 |
| Curricular units 2nd sem (enrolled) | Curricular units 2nd sem (approved) | 0.7033 |
Publisher’s Note: MDPI stays neutral with regard to jurisdictional claims in published maps and institutional affiliations. |
© 2022 by the authors. Licensee MDPI, Basel, Switzerland. This article is an open access article distributed under the terms and conditions of the Creative Commons Attribution (CC BY) license (https://creativecommons.org/licenses/by/4.0/).
Share and Cite
MDPI and ACS Style
Realinho, V.; Machado, J.; Baptista, L.; Martins, M.V. Predicting Student Dropout and Academic Success. Data 2022, 7, 146. https://0-doi-org.brum.beds.ac.uk/10.3390/data7110146
AMA Style
Realinho V, Machado J, Baptista L, Martins MV. Predicting Student Dropout and Academic Success. Data. 2022; 7(11):146. https://0-doi-org.brum.beds.ac.uk/10.3390/data7110146
Chicago/Turabian StyleRealinho, Valentim, Jorge Machado, Luís Baptista, and Mónica V. Martins. 2022. "Predicting Student Dropout and Academic Success" Data 7, no. 11: 146. https://0-doi-org.brum.beds.ac.uk/10.3390/data7110146