
Changes in Body Size during Early Growth Are Independently Associated with Arterial Properties in Early Childhood

 and
and
Abstract
:1. Introduction
- (1)
- Are early variations in z-BW, z-BH, z-BWH and/or z-BMI associated with arterial variations at age 6 years (y.), with independence of exposure to CV risk factors (CRFs), body size at birth and/or body size at the time of the study?
- (2)
- Which is the anthropometric index whose changes show significant strength of association with arterial parameter variations at age 6 years?
- (3)
- Do the associations depend on the growth interval considered?
- (4)
- Are early changes in body size mainly associated with hemodynamic (e.g., systolic (SBP), diastolic (DBP) or pulse pressure (PP), wave-derived parameters), structural (e.g., diameter, intima–media thickness) or stiffness parameters?
- (5)
- Are they primarily associated with peripheral (pBP) or with central pressure (cBP)?
2. Materials and Methods
2.1. Study Population
2.2. Anthropometric Evaluation
2.3. Clinical Evaluation
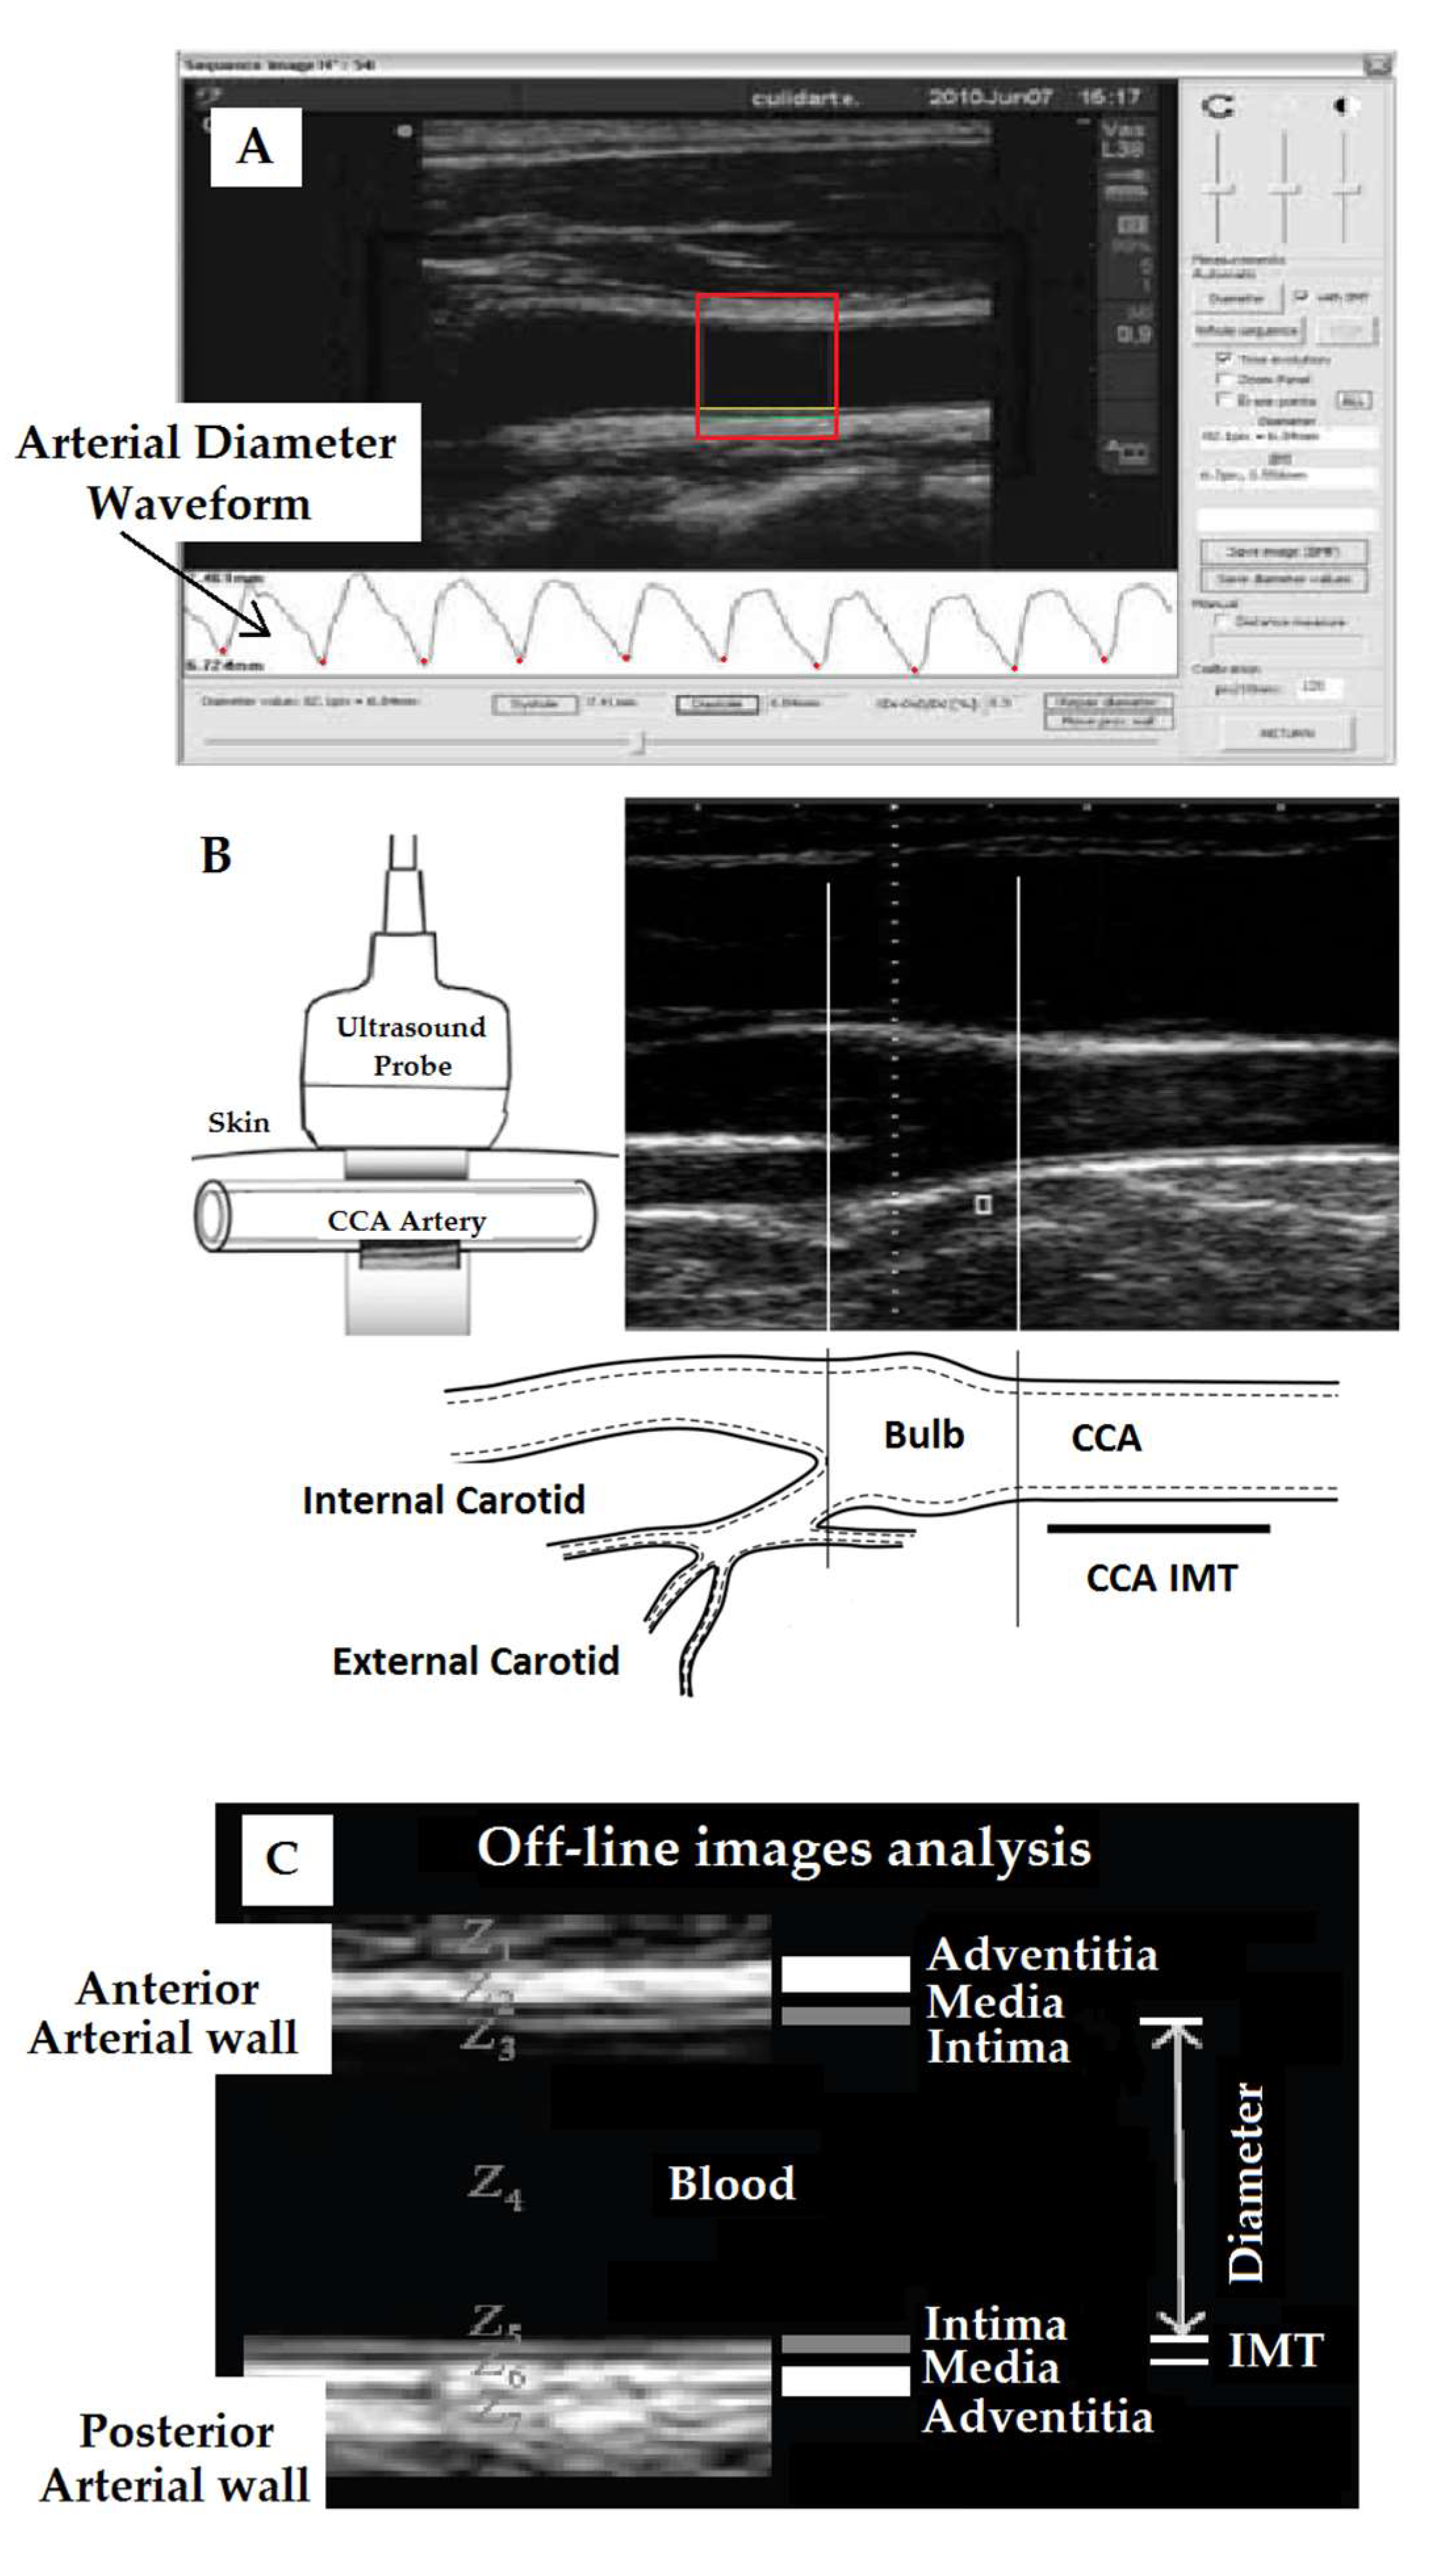
2.4. Arterial and Hemodynamic Evaluation
2.5. Peripheral and Central Pressure and Aortic Wave-Derived Parameters
2.6. Arterial Beat-to-Beat Diameter and Intima–Media Thickness
2.7. Local and Regional Arterial Stiffness
2.8. Data Analysis
3. Results
3.1. Subjects’Characteristics
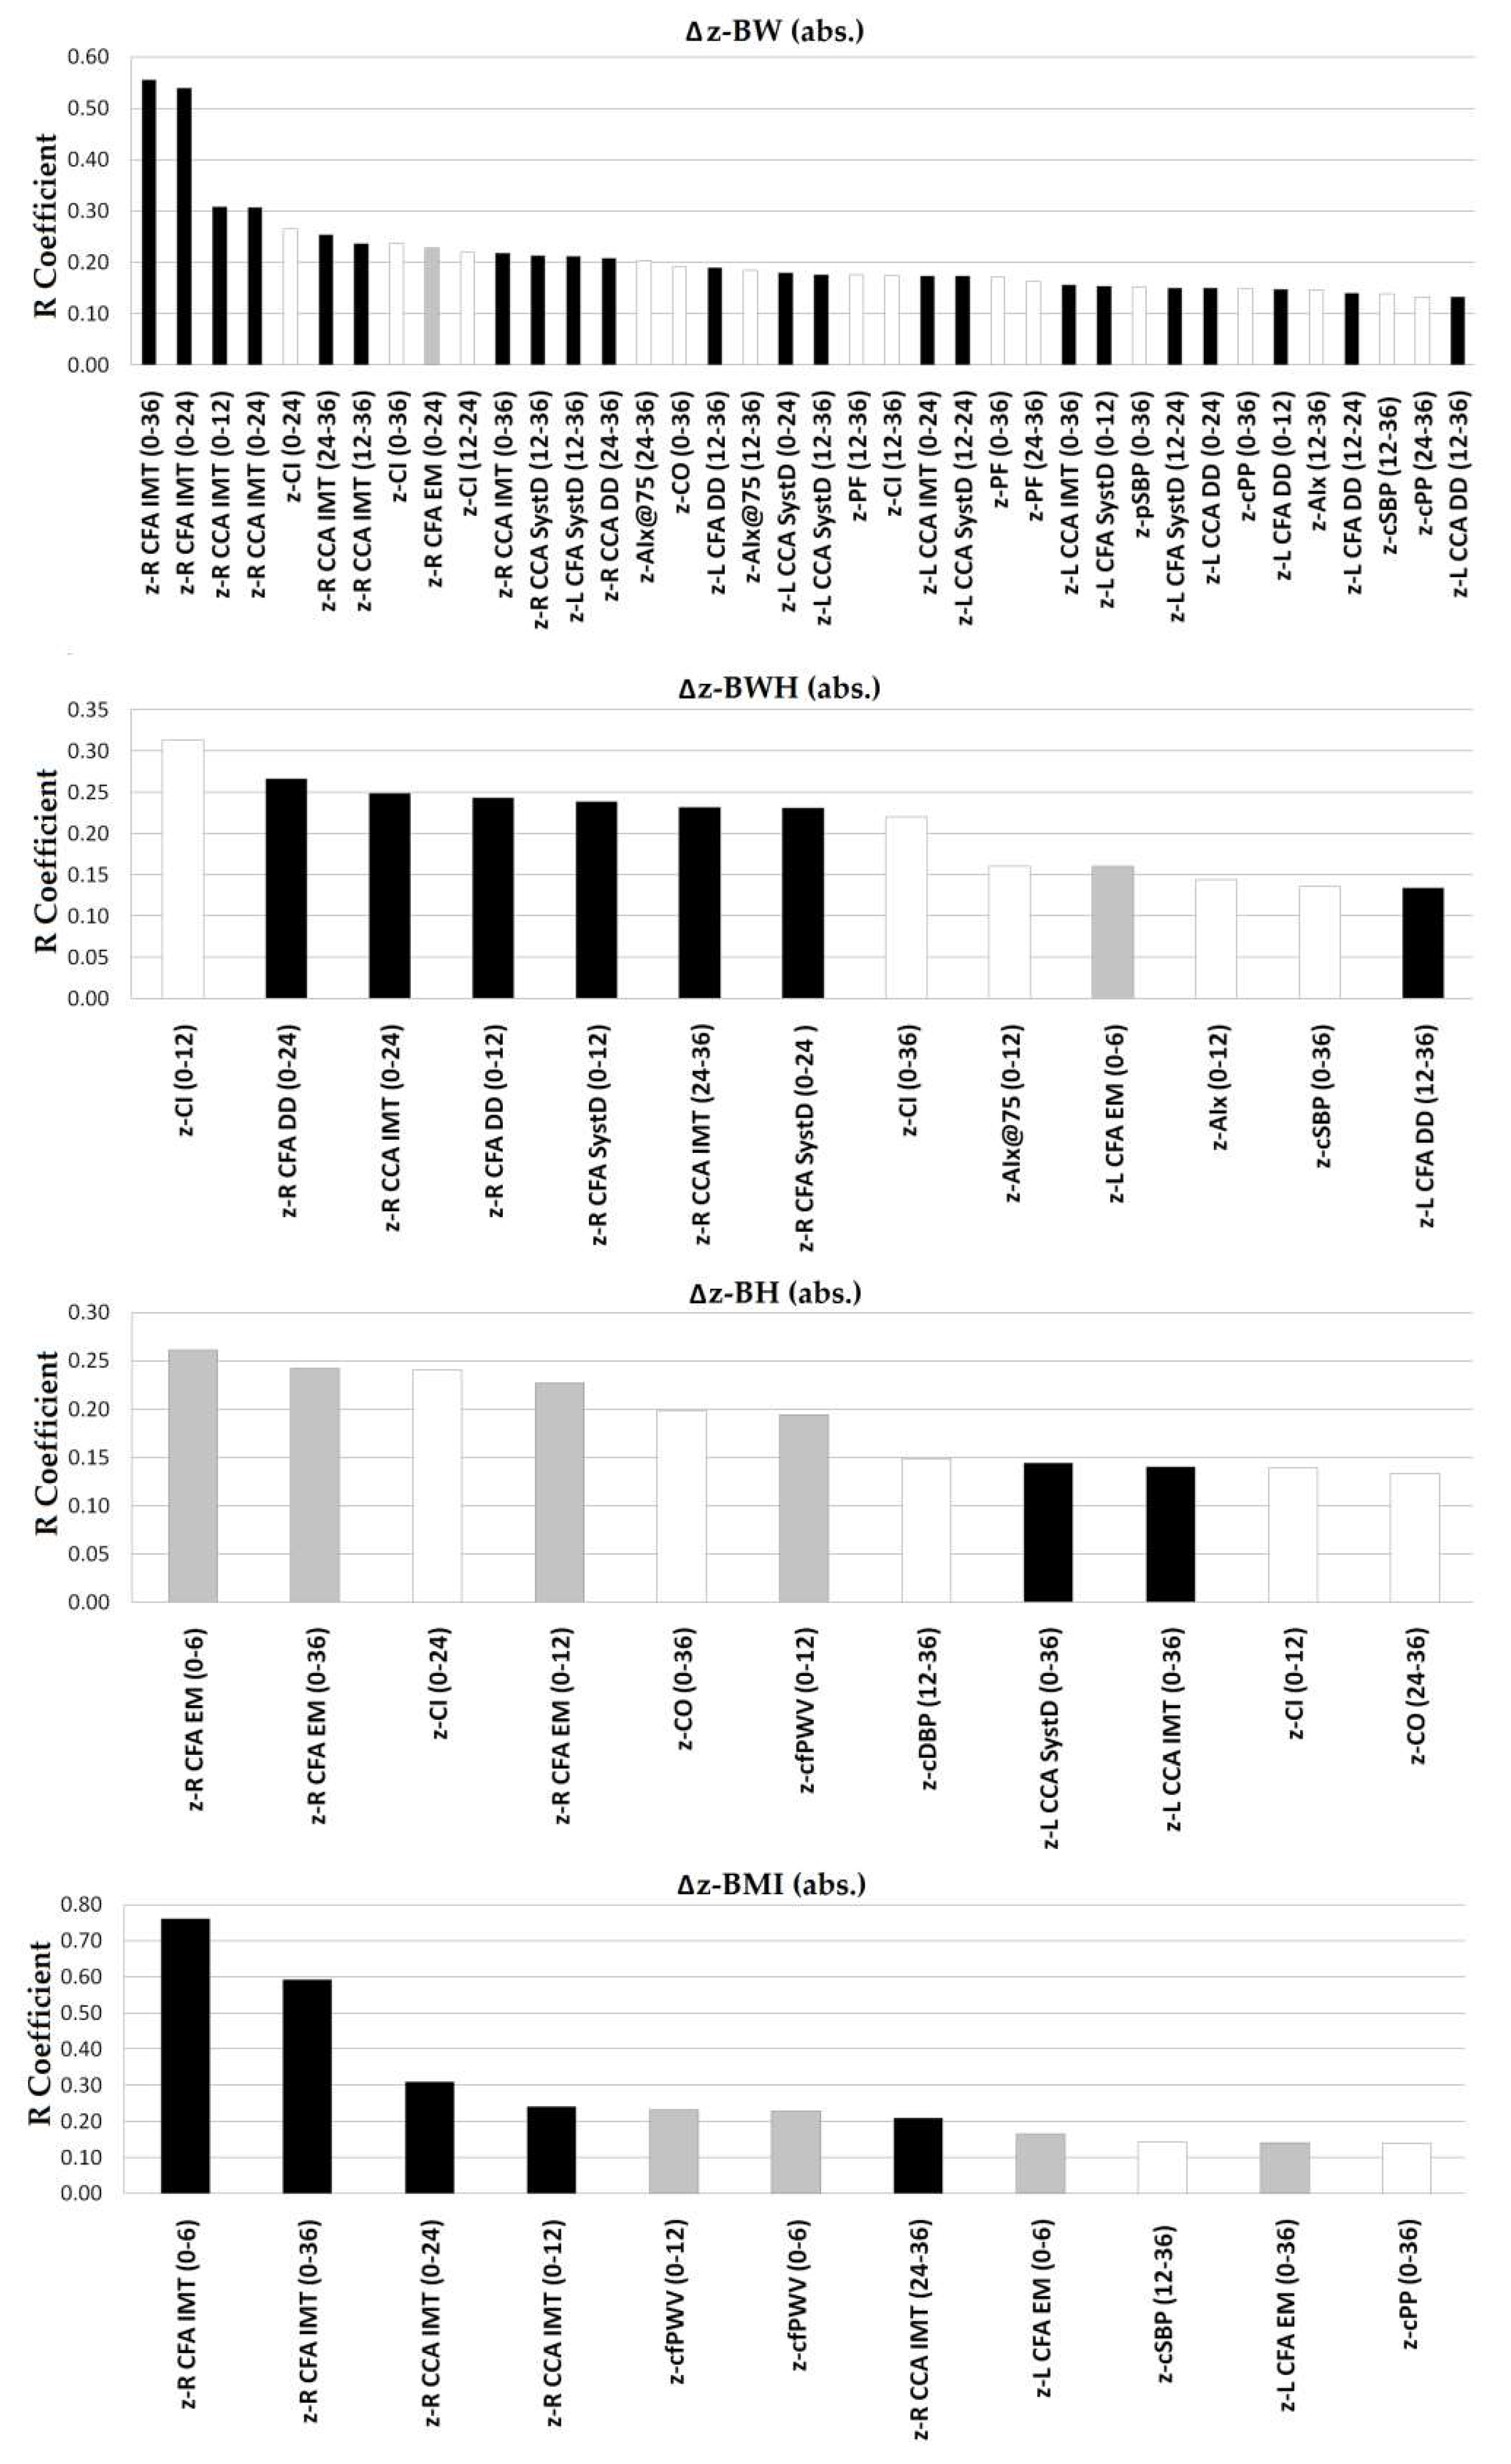
3.2. Associations between Arterial Parameters at Age 6 Yearsand Anthropometric Changes in the First Two Yearsof Life
3.3. Associations between Arterial Parameters at Age 6 Years and Body Size Changes during the First Three Years of Life
3.4. Main Determinants of Interindividual Variations in Arterial Parameters at Age 6 Years: Role of Body Size Changes in the First Two Years of Life Considering the Exposure to CRFs
3.5. Main Determinants of Interindividual Variations in Arterial Parameters at Age 6 Years: Role of Body Size Changes in the First Three YearsConsidering the Exposure to CRFs
4. Discussion
4.1. Main Findings
4.2. Clinical Implications
4.3. Strengths and Limitations
5. Conclusions
Supplementary Materials
Author Contributions
Funding
Institutional Review Board Statement
Informed Consent Statement
Data Availability Statement
Acknowledgments
Conflicts of Interest
Abbreviations
| AIx | central (aortic) augmentation index |
| AIx@75 | AIx adjusted to a 75 beats/min heart rate |
| AP | central (aortic) augmented pressure |
| BH | body height |
| BMI | body mass index |
| BW | body weight |
| BWH | body weight for body height |
| cBP | central (aortic) blood pressure |
| CCA | common carotid artery |
| CFA | common femoral artery |
| cfPWV | carotid–femoral pulse wave velocity |
| CRFs | cardiovascular risk factors |
| CV | cardiovascular |
| CVD | cardiovascular disease |
| DD | diastolic arterial diameter |
| EM | pressure-strain arterial elastic modulus |
| HBP | high blood pressure levels |
| HR | heart rate |
| IMT | intima–media thickness |
| MLR | multiple linear regression |
| m | months |
| MV | mean value |
| Pb | amplitude of the cBP backward component |
| pBP | peripheral (brachial) blood pressure |
| pDBP | peripheral (brachial) diastolic blood pressure |
| Pf | amplitude of the cBP forward component |
| pMBP | peripheral (brachial) mean blood pressure |
| pPP | peripheral (brachial) pulse pressure |
| pSBP | peripheral (brachial) systolic blood pressure |
| PWA | pulse wave analysis |
| SystD | systolic arterial diameter |
| SD | standard deviation |
| Y | years |
| Z | z-score |
References
- Bowers, K.; Liu, G.; Wang, P.; Ye, T.; Tian, Z.; Liu, E.; Yu, Z.; Yang, X.; Klebanoff, M.; Yeung, E.; et al. Birth weight, postnatal weight change, and risk for high blood pressure among chinese children. Pediatrics 2011, 127, e1272–e1279. [Google Scholar] [CrossRef]
- Adair, L.S.; Martorell, R.; Stein, A.D.; Hallal, P.C.; Sachdev, H.S.; Prabhakaran, D.; Wills, A.K.; Norris, S.A.; Dahly, D.L.; Lee, N.R.; et al. Size at birth, weight gain in infancy and childhood, and adult blood pressure in 5 low- and middle-income-country cohorts: When does weight gain matter? Am. J. Clin. Nutr. 2009, 89, 1383–1392. [Google Scholar] [CrossRef] [Green Version]
- Antonisamy, B.; Vasan, S.K.; Geethanjali, F.S.; Gowri, M.; Hepsy, Y.S.; Richard, J.; Raghupatty, P.; Karpe, F.; Osmond, C.; Fall, C.D.F. Weight gain and height growth during Infancy, childhood, and adolescence as predictors of adult cardiovascular risk. J. Pediatr. 2017, 180, 53–61. [Google Scholar] [CrossRef] [Green Version]
- Castro, J.M.; García-Espinosa, V.; Zinoveev, A.; Marin, M.; Severi, C.; Chiesa, P.; Bia, D.; Zócalo, Y. Arterial structural and functional characteristics at end of early Childhood and beginning of adulthood: Impact of body size gain during early, intermediate, late and global growth. J. Cardiovasc. Dev. Dis. 2019, 6, 33. [Google Scholar] [CrossRef] [Green Version]
- Evelein, A.M.; Visseren, F.L.; van der Ent, C.K.; Grobbee, D.E.; Uiterwaal, C.S. Excess early postnatal weight gain leads to thicker and stiffer arteries in young children. J. Clin. Endocrinol.Metab. 2013, 98, 794–801. [Google Scholar] [CrossRef] [Green Version]
- De Beer, M.; Vrijkotte, T.G.; Fall, C.H.; van Eijsden, M.; Osmond, C.; Gemke, R.J. Associations of infant feeding and timing of weight gain and linear growth during early life with childhood blood pressure: Findings from a prospective population-basedcohort study. PLoS ONE 2016, 11, e0168920. [Google Scholar] [CrossRef]
- Li, L.; Law, C.; Power, C. Body mass index throughout the life-course and blood pressure in mid-adult life: A birth cohort study. J. Hypertens. 2007, 25, 1215–1223. [Google Scholar] [CrossRef] [PubMed]
- Marinkovic, T.; Toemen, L.; Kruithof, C.J.; Reiss, I.; van Osch-Gevers, L.; Hofman, A.; Franco, O.H.; Jaddoe, V.W.V. Early infant growth velocity patterns and cardiovascular and metabolic outcomes in childhood. J. Pediatr. 2017, 186, 57–63.e4. [Google Scholar] [CrossRef]
- Ekelund, U.; Ong, K.K.; Linne, Y.; Neovius, M.; Brage, S.; Dunger, D.B.; Wareham, N.J.; Rossner, S. Association of weight gain in infancy and early childhood with metabolic risk in young adults. J. Clin. Endocrinol. Metab. 2007, 92, 98–103. [Google Scholar] [CrossRef] [PubMed] [Green Version]
- Evelein, A.M.; Visseren, F.L.; van der Ent, C.K.; Grobbee, D.E.; Uiterwaal, C.S. Excess early postnatal weight gain leads to increased abdominal fat in young children. Int. J. Pediatr. 2012, 2012, 141656. [Google Scholar] [CrossRef] [PubMed] [Green Version]
- Leunissen, R.W.; Kerkhof, G.F.; Stijnen, T.; Hokken-Koelega, A. Timing and tempo of first-year rapid growth in relation to cardiovascular and metabolic risk profile in early adulthood. JAMA 2009, 301, 2234–2242. [Google Scholar] [CrossRef] [PubMed] [Green Version]
- Ong, K.K.; Ahmed, M.L.; Emmett, P.M.; Preece, M.A.; Dunger, D.B. Association between postnatal catch-up growth and obesity in childhood: Prospective cohort study. BMJ 2000, 320, 967–971. [Google Scholar] [CrossRef] [Green Version]
- Singhal, A.; Cole, T.J.; Fewtrell, M.; Kennedy, K.; Stephenson, T.; EliasJones, A.; Lucas, A. Promotion of faster weight gain in infants born small for gestational age: Is there an adverse effect on later blood pressure? Circulation 2007, 115, 213–220. [Google Scholar] [CrossRef] [PubMed] [Green Version]
- Skilton, M.R.; Sullivan, T.R.; Ayer, J.G.; Garden, F.L.; Harmer, J.A.; Leeder, S.R.; Toelle, B.G.; Webb, K.; Marks, G.B.; Celermajer, D.S. Weight gain in infancy is associated with carotid extra-medial thickness in later childhood. Atherosclerosis 2014, 233, 370–374. [Google Scholar] [CrossRef]
- Garcia-Espinosa, V.; Bia, D.; Castro, J.; Zinoveev, A.; Marin, M.; Giachetto, G.; Chiesa, P.; Zócalo, Y. Peripheral and central aortic pressure, wave-derived reflection parameters, local and regional arterial stiffness and structural parameters in children and adolescents: Impact of body mass index variations. High Blood Press. Cardiovasc. Prev. 2018, 25, 267–280. [Google Scholar] [CrossRef] [PubMed]
- García-Espinosa, V.; Curcio, S.; Marotta, M.; Castro, J.M.; Arana, M.; Peluso, G.; Chiesa, P.; Giachetto, G.; Bia, D.; Zócalo, Y. Changes in central aortic pressure levels, wave components and determinants associated with high peripheral blood pressure states in childhood: Analysis of hypertensive phenotype. Pediatric Cardiol. 2016, 37, 1340–1350. [Google Scholar] [CrossRef] [PubMed]
- Díaz, A.; Bia, D.; Zócalo, Y. Impact of methodological and calibration approach on the association of central and peripheral systolic blood pressure with cardiac structure and function in children, adolescents and adults. High Blood Press. Cardiovasc. Prev. 2019, 26, 509–534. [Google Scholar] [CrossRef] [PubMed]
- Peluso, G.; García-Espinosa, V.; Curcio, S.; Marota, M.; Castro, J.; Chiesa, P.; Giachetto, G.; Bia, D.; Zócalo, Y. High central aortic rather than brachial blood pressure is associated with carotid wall remodeling and increased arterial stiffness in childhood. High Blood Press. Cardiovasc. Prev. 2017, 24, 49–60. [Google Scholar] [CrossRef] [PubMed]
- Santana, D.B.; Zócalo, Y.A.; Armentano, R.L. Integrated e-Health approach based on vascular ultrasound and pulse wave analysis for asymptomatic atherosclerosis detection and cardiovascular risk stratification in the community. IEEE Trans. Inf. Technol. Biomed. 2012, 16, 287–294. [Google Scholar] [CrossRef]
- Santana, D.B.; Zócalo, Y.A.; Ventura, I.F.; Arrosa, J.F.; Florio, L.; Lluberas, R.; Armentano, R.L. Health informatics design for assisted diagnosis of subclinical atherosclerosis, structural, and functional arterial age calculus and patient-specific cardiovascular risk evaluation. IEEE Trans. Inf. Technol. Biomed. 2012, 16, 943–951. [Google Scholar] [CrossRef]
- Lurbe, E.; Agabiti-Rosei, E.; Cruickshank, J.K.; Dominiczak, A.; Erdine, S.; Hirth, A.; Invitti, C.; Litwin, M.; Mancia, G.; Pall, D. European Society of Hypertension guidelines for the management of highblood pressure in children and adolescents. J. Hypertens. 2016, 34, 1887–1920. [Google Scholar] [CrossRef] [PubMed] [Green Version]
- Zinoveev, A.; Castro, J.M.; García-Espinosa, V.; Marin, M.; Chiesa, P.; Bia, D.; Zócalo, Y. Aortic pressure and forward and backward wave components in children, adolescents and young-adults: Agreement between brachial oscillometry, radial and carotid tonometry data and analysis of factors associated with their differences. PLoS ONE 2019, 14, e0226709. [Google Scholar] [CrossRef] [PubMed] [Green Version]
- Zócalo, Y.; García-Espinosa, V.; Castro, J.M.; Zinoveev, A.; Marin, M.; Chiesa, P.; Díaz, A.; Bia, D. Stroke volume and cardiac output non-invasive monitoring based on brachial oscillometry-derived pulse contour analysis: Explanatory variables and reference intervals throughout life (3–88 years). Cardiol. J. 2020. [Google Scholar] [CrossRef] [Green Version]
- Lumley, T.; Diehr, P.; Emerson, S.; Chen, L. The importance of the normality assumption in large public health data sets. Annu. Rev. Public Health 2002, 23, 151–169. [Google Scholar] [CrossRef] [PubMed]
- Cogill, B. Anthropometric indicators measurement guide. In Food and Nutrition Technical Assistance Project; Academy for Educational Development: Washington, DC, USA, 2003; Available online: www.fantaproject.org (accessed on 14 January 2020).
- de Onis, M.; Onyango, A.; Borghi, E.; Siyam, A.; Pinol, A. Child Growth Standards: Growth Velocity Based on Weight, Length and Head Circumference: Methods and Development; World Health Organization: Geneva, Switzerland, 2009. [Google Scholar]
- LinharesRda, S.; Gigante, D.P.; de Barros, F.C.; Horta, B.L. Carotid intima-media thickness at age 30, birth weight, accelerated growth during infancy and breastfeeding: A birth cohort study in Southern Brazil. PLoS ONE 2015, 10, e0115166. [Google Scholar] [CrossRef] [Green Version]
- Toemen, L.; de Jonge, L.L.; Gishti, O.; van Osch-Gevers, L.; Taal, H.R.; Steegers, E.A.P.; Hofman, A.; Helbing, W.A.; Jaddoe, V.W.V. Longitudinal growth during fetal life and infancy and cardiovascular outcomes at school-age. J. Hypertens. 2016, 34, 1396–1406. [Google Scholar] [CrossRef]
- World Health Organization and the United Nations Children’s Fund (UNICEF). Recommendations for Data Collection, Analysis and Reporting on Anthropometric Indicators in Children under 5 Years Old; World Health Organization and the United Nations Children’s Fund (UNICEF): Geneva, Switzerland, 2019; Licence: CC BY-NC-SA 3.0 IGO; Available online: https://www.who.int/nutrition/publications/anthropometry-data-quality-report/en/ (accessed on 14 January 2020).
- Castro, J.M.; García-Espinosa, V.; Curcio, S.; Arana, M.; Chiesa, P.; Giachetto, G.; Zócalo, Y.; Bia, D. Childhood obesity associates haemodynamic and vascular changes that result in increased central aortic pressure with augmented incident and reflected wave components, without changes in peripheral amplification. Int. J. Vasc. Med. 2016, 2016, 3129304. [Google Scholar] [CrossRef] [Green Version]
- Armentano, R.L.; Barra, J.G.; Santana, D.B.; Pessana, F.M.; Graf, S.; Craiem, D.; Brandani, L.M.; Baglivo, H.P.; Sanchez, R.A. Smart damping modulation of carotid wall energetics in human hypertension: Effects of angiotensin-converting enzyme inhibition. Hypertension 2006, 47, 384–390. [Google Scholar] [CrossRef] [PubMed] [Green Version]
- Armentano, R.L.; Barra, J.G.; Pessana, F.M.; Craiem, D.O.; Graf, S.; Santana, D.B.; Sanchez, R.A. Smart smooth muscle spring-dampers. Smooth muscle smart filtering helps to more efficiently protect the arterial wall. IEEE Eng. Med. Biol. Mag. 2007, 26, 62–70. [Google Scholar] [CrossRef]
- Bia, D.; Zócalo, Y.; Armentano, R.; Camus, J.; De Forteza, E.; Cabrera-Fischer, E. Increased reversal and oscillatory shear stress cause smooth muscle contraction-dependent changes in sheep aortic dynamics: Role in aortic balloon pump circulatory support. Acta Physiol. 2008, 192, 487–503. [Google Scholar] [CrossRef] [PubMed]
- Bia, D.; Armentano, R.L.; Grignola, J.C.; Craiem, D.; Zócalo, Y.A.; Ginés, F.F.; Levenson, J. The vascular smooth muscle of great arteries: Local control site of arterial buffering function? Rev. Esp. Cardiol. 2003, 56, 1202–1209. [Google Scholar] [CrossRef]
- Fischer, E.C.; Santana, D.B.; Zócalo, Y.; Camus, J.; De Forteza, E.; Armentano, R. Effects of removing the adventitia on the mechanical properties of ovine femoral arteries in vivo and in vitro. Circ. J. 2010, 74, 1014–1022. [Google Scholar] [CrossRef] [PubMed] [Green Version]


| MV | SD | Min. | p25th | p50th | p75th | Max. | |
|---|---|---|---|---|---|---|---|
| Age (years) | 6.02 | 0.3 | 5.07 | 5.80 | 6.04 | 6.26 | 6.66 |
| BW at birth (Kg) | 3.27 | 1.45 | 0.98 | 2.95 | 3.28 | 3.59 | 5.00 |
| BW (kg) | 22.31 | 4.67 | 14.00 | 19.20 | 21.25 | 24.35 | 46.50 |
| BH (m) | 1.14 | 0.05 | 0.99 | 1.10 | 1.14 | 1.17 | 1.33 |
| BMI (Kg/m2) | 17.03 | 2.48 | 12.10 | 15.37 | 16.43 | 18.06 | 27.15 |
| z-BMI (current or “~6 years”) (SD) | 0.96 | 1.47 | −2.60 | 0.06 | 0.66 | 1.62 | 7.37 |
| z-BW (current or “~6 years”) (SD) | 0.45 | 1.30 | −2.39 | −0.45 | 0.32 | 1.18 | 6.15 |
| z-BH (current or “~6 years”) (SD) | −0.33 | 1.04 | −3.43 | −1.05 | −0.34 | 0.29 | 3.55 |
| Obesity (n, %) | 108 (17.1) | ||||||
| Dyslipidemia (n, %) | 1 (0.2) | ||||||
| Diabetes (n, %) | 1 (0.2) | ||||||
| Hypertension (n, %) | 27 (4.3) | ||||||
| Mode of delivery (cesarean; n, %) | 202 (31.9) | ||||||
| Preterm birth (n, %) | 62 (9.8) | ||||||
| Mother, diabetes (n, %) | 12 (1.9) | ||||||
| MV | SD | Min. | p25th | p50th | p75th | Max. | |
|---|---|---|---|---|---|---|---|
| z-BWH at birth (SD) | 0.40 | 1.14 | −4.06 | −0.27 | 0.49 | 1.13 | 3.61 |
| z-BW at birth (SD) | 0.02 | 0.95 | −5.24 | −0.56 | 0.06 | 0.68 | 2.95 |
| z-BH at birth (SD) | −0.27 | 1.13 | −4.91 | −1.00 | −0.08 | 0.46 | 4.75 |
| z-BMI at birth (SD) | 0.27 | 1.06 | −3.59 | −0.38 | 0.36 | 0.93 | 3.65 |
| z-BWH 6 m.(SD) | 0.59 | 1.26 | −3.86 | −0.20 | 0.50 | 1.29 | 4.76 |
| z-BW 6 m.(SD) | 0.38 | 1.14 | −2.83 | −0.44 | 0.32 | 1.08 | 4.54 |
| z-BH 6 m.(SD) | −0.15 | 1.11 | −4.12 | −0.92 | −0.19 | 0.60 | 3.30 |
| z-BMI 6 m. (SD) | 0.66 | 1.29 | −4.07 | −0.15 | 0.58 | 1.40 | 5.42 |
| z-BWH 12 m. (SD) | 0.33 | 1.08 | −2.78 | −0.40 | 0.32 | 0.92 | 3.91 |
| z-BW 12 m. (SD) | 0.64 | 1.16 | −2.77 | −0.14 | 0.58 | 1.37 | 5.51 |
| z-BH 12 m. (SD) | −0.31 | 1.22 | −4.72 | −1.06 | −0.39 | 0.38 | 5.57 |
| z-BMI 12 m. (SD) | 0.69 | 1.19 | −2.79 | −0.09 | 0.63 | 1.44 | 5.84 |
| z-BWH 24 m. (SD) | 0.59 | 1.26 | −3.86 | −0.20 | 0.50 | 1.29 | 4.76 |
| z-BW 24 m. (SD) | 0.38 | 1.14 | −2.83 | −0.44 | 0.32 | 1.08 | 4.54 |
| z-BH 24 m. (SD) | −0.15 | 1.11 | −4.12 | −0.92 | −0.19 | 0.60 | 3.30 |
| z-BMI 24 m. (SD) | 0.66 | 1.29 | −4.07 | −0.15 | 0.58 | 1.40 | 5.42 |
| z-BWH 36 m. (SD) | 0.59 | 1.25 | −3.45 | −0.22 | 0.47 | 1.37 | 6.43 |
| z-BW 36 m. (SD) | 0.35 | 1.14 | −2.39 | −0.46 | 0.29 | 1.07 | 5.00 |
| z-BH 36 m. (SD) | −0.11 | 1.14 | −3.92 | −0.89 | −0.16 | 0.56 | 3.30 |
| z-BMI 36 m. (SD) | 0.60 | 1.28 | −3.87 | −0.21 | 0.48 | 1.39 | 6.48 |
| MV | SD | Min. | p25th | p50th | p75th | Max. | |
|---|---|---|---|---|---|---|---|
| Central and peripheral hemodynamic parameters | |||||||
| Heart rate (beats/minute) | 91 | 11 | 66 | 84 | 90 | 99 | 134 |
| pSBP (mmHg) | 100 | 8 | 80 | 94 | 100 | 105 | 126 |
| pDBP (mmHg) | 59 | 7 | 50 | 54 | 58 | 62 | 86 |
| pPP (mmHg) | 41 | 7 | 24 | 36 | 40 | 46 | 77 |
| pMBP (mmHg) | 72 | 7 | 31 | 68 | 73 | 77 | 96 |
| cSBP (mmHg) | 83 | 6 | 64 | 78 | 83 | 87 | 100 |
| cDBP (mmHg) | 60 | 6 | 46 | 56 | 60 | 64 | 77 |
| cPP (mmHg) | 22 | 4 | 7 | 19 | 22 | 25 | 43 |
| CO (liter/minute) | 4.4 | 0.3 | 3.2 | 4.1 | 4.4 | 4.8 | 5.7 |
| CI (liter/minute/m2) | 4.9 | 0.6 | 3.5 | 4.4 | 4.9 | 5.4 | 5.9 |
| SVR (s.mmHg/mL) | 1.10 | 0.10 | 0.86 | 1.04 | 1.11 | 1.19 | 1.41 |
| AIx (%) | 9.7 | 9.7 | −16 | 3 | 10 | 17 | 37 |
| AIx@75 (%) | 17.0 | 9.3 | −10 | 11 | 17 | 23 | 43 |
| AP (mmHg) | 2 | 2 | −5 | 1 | 2 | 4 | 9 |
| Pf (mmHg) | 20 | 5 | 7 | 17 | 19 | 23 | 43 |
| Pb (mmHg) | 10 | 4 | 3 | 9 | 10 | 11 | 78 |
| Structural arterial parameters | |||||||
| CCARight SystD (mm) | 6.04 | 0.50 | 4.83 | 5.70 | 5.98 | 6.39 | 7.41 |
| CCARight DD (mm) | 5.38 | 0.47 | 4.21 | 5.03 | 5.36 | 5.71 | 6.91 |
| CCARight IMT (mm) | 0.421 | 0.028 | 0.370 | 0.405 | 0.418 | 0.431 | 0.537 |
| CCALeft SystD (mm) | 5.92 | 0.46 | 4.84 | 5.59 | 5.91 | 6.22 | 7.48 |
| CCALeft DD (mm) | 5.25 | 0.43 | 4.25 | 4.96 | 5.24 | 5.53 | 6.99 |
| CCALeft IMT (mm) | 0.420 | 0.027 | 0.316 | 0.405 | 0.417 | 0.431 | 0.567 |
| CFARight SystD (mm) | 4.74 | 0.53 | 3.44 | 4.42 | 4.75 | 5.05 | 6.50 |
| CFARight DD (mm) | 4.42 | 0.51 | 3.13 | 4.11 | 4.43 | 4.72 | 6.11 |
| CFARight IMT (mm) | 0.331 | 0.032 | 0.282 | 0.313 | 0.323 | 0.346 | 0.411 |
| CFA Left SystD (mm) | 4.72 | 0.50 | 3.51 | 4.36 | 4.70 | 5.01 | 6.37 |
| CFALeft DD (mm) | 4.40 | 0.50 | 3.29 | 4.06 | 4.38 | 4.71 | 5.98 |
| CFALeft IMT (mm) | 0.335 | 0.026 | 0.271 | 0.319 | 0.331 | 0.355 | 0.398 |
| Local and regional arterial stiffness | |||||||
| CCARight EM (mmHg) | 187 | 45 | 71 | 156 | 188 | 216 | 304 |
| CCALeft EM (mmHg) | 179 | 46 | 54 | 146 | 175 | 205 | 314 |
| CFARight EM (mmHg) | 618 | 267 | 237 | 417 | 564 | 724 | 1555 |
| CFALeft EM (mmHg) | 592 | 219 | 219 | 427 | 546 | 711 | 1561 |
| cfPWV (m/s) | 4.81 | 0.76 | 2.88 | 4.28 | 4.75 | 5.25 | 7.72 |
| Zero-Order Correlations | William’s Test (Correlation Comparisons) | ||||||||||||||
|---|---|---|---|---|---|---|---|---|---|---|---|---|---|---|---|
| 0–6 m | ΔzBWH [1] | ΔzBW [2] | ΔzBH [3] | ΔzBMI [4] | 1 vs. 2 | 1 vs. 3 | 1 vs. 4 | 2 vs. 3 | 2 vs. 4 | 3 vs. 4 | |||||
| R | p | R | p | R | p | R | p | p | P | p | P | p | P | ||
| Structural arterial parameters | |||||||||||||||
| z-CFAR IMT | 0.56 | 0.17 | 0.18 | 0.113 | 0.10 | 0.715 | 0.76 | 0.0004 | 0.117 | 0.101 | <0.0001 | 0.717 | <0.0001 | 0.011 | |
| Local and regional arterial stiffness | |||||||||||||||
| z-CFAR EM | −0.12 | 0.27 | 0.14 | 0.213 | 0.26 | 0.019 | −0.05 | 0.666 | 0.001 | 0.012 | 0.012 | 0.208 | 0.005 | 0.040 | |
| z-CFAL EM | −0.16 | 0.024 | −0.11 | 0.139 | 0.04 | 0.556 | −0.16 | 0.022 | 0.310 | 0.041 | 0.990 | 0.017 | 0.251 | 0.041 | |
| z-cfPWV | −0.16 | 0.077 | −0.03 | 0.726 | 0.19 | 0.320 | −0.23 | 0.011 | 0.040 | 0.003 | 0.002 | 0.006 | 0.000 | 0.007 | |
| 0–12 m | ΔzBWH [1] | ΔzBW [2] | ΔzBH [3] | ΔzBMI [4] | 1 vs. 2 | 1 vs. 3 | 1 vs. 4 | 2 vs. 3 | 2 vs. 4 | 3 vs. 4 | |||||
| R | p | R | p | R | p | R | p | p | p | p | P | p | P | ||
| Central and peripheral hemodynamic parameters | |||||||||||||||
| z-AIx | −0.14 | 0.031 | −0.02 | 0.800 | −0.08 | 0.247 | 0.01 | 0.871 | 0.002 | 0.419 | <0.0001 | 0.397 | 0.286 | 0.230 | |
| z-AIx@75 | −0.16 | 0.019 | −0.01 | 0.841 | −0.09 | 0.204 | −0.01 | 0.921 | 0.002 | 0.359 | <0.0001 | 0.274 | 0.783 | 0.286 | |
| z-CI | −0.31 | 0.000 | −0.04 | 0.611 | −0.14 | 0.047 | −0.09 | 0.203 | <0.0001 | 0.021 | <0.0001 | 0.169 | 0.089 | 0.522 | |
| Structural arterial parameters | |||||||||||||||
| z- CCAR IMT | 0.14 | 0.180 | 0.31 | 0.002 | 0.18 | 0.090 | 0.24 | 0.021 | 0.033 | 0.730 | 0.094 | 0.221 | 0.099 | 0.600 | |
| z-CFAR SystD | 0.24 | 0.024 | 0.18 | 0.088 | 0.12 | 0.268 | 0.17 | 0.133 | 0.458 | 0.317 | 0.240 | 0.586 | 0.827 | 0.681 | |
| z- CFAR DD | 0.24 | 0.022 | 0.19 | 0.075 | 0.16 | 0.150 | 0.16 | 0.157 | 0.536 | 0.502 | 0.198 | 0.784 | 0.511 | 0.983 | |
| z-LCFALSystD | 0.09 | 0.207 | −0.15 | 0.030 | 0.04 | 0.600 | −0.11 | 0.138 | <0.0001 | 0.525 | <0.0001 | 0.010 | 0.172 | 0.057 | |
| z-CFAL DD | 0.08 | 0.232 | −0.15 | 0.038 | 0.03 | 0.688 | −0.10 | 0.161 | <0.0001 | 0.526 | <0.0001 | 0.009 | 0.088 | 0.099 | |
| Local and regional arterial stiffness | |||||||||||||||
| z-CFAR EM | 0.05 | 0.618 | 0.12 | 0.253 | 0.23 | 0.038 | 0.04 | 0.738 | 0.204 | 0.021 | 0.807 | 0.124 | 0.498 | 0.015 | |
| z-cfPWV | −0.02 | 0.840 | −0.11 | 0.236 | 0.19 | 0.030 | −0.23 | 0.009 | 0.208 | 0.037 | 0.000 | 0.002 | <0.0001 | <0.0001 | |
| 0–24 m | Δz-BWH [1] | Δ z-BW [2] | Δ z-BH [3] | Δ z-BMI [4] | 1 vs. 2 | 1 vs. 3 | 1 vs. 4 | 2 vs. 3 | 2 vs. 4 | 3 vs. 4 | |||||
| R | p | R | p | R | p | R | p | p | p | p | P | p | P | ||
| Central and peripheral hemodynamic parameters | |||||||||||||||
| z-CI | −0.08 | 0.263 | −0.26 | 0.0001 | −0.24 | 0.001 | −0.08 | 0.279 | <0.0001 | 0.071 | 0.990 | 0.696 | <0.0001 | 0.069 | |
| Structural arterial parameters | |||||||||||||||
| z-CCAR IMT | 0.25 | 0.016 | 0.31 | 0.004 | 0.20 | 0.069 | 0.31 | 0.004 | 0.696 | 0.870 | 0.344 | 0.542 | 0.997 | 0.718 | |
| z-CCAL SystD | 0.03 | 0.702 | 0.18 | 0.011 | 0.09 | 0.204 | 0.11 | 0.118 | 0.006 | 0.499 | <0.0001 | 0.078 | 0.076 | 0.821 | |
| z-CCAL DD | −0.01 | 0.940 | 0.15 | 0.034 | 0.06 | 0.432 | 0.12 | 0.108 | 0.000 | 0.432 | <0.0001 | 0.080 | 0.448 | 0.498 | |
| z-CCAL IMT | 0.06 | 0.421 | 0.17 | 0.014 | 0.13 | 0.061 | 0.10 | 0.174 | 0.012 | 0.430 | 0.029 | 0.434 | 0.078 | 0.734 | |
| z-CFAR SystD | 0.23 | 0.033 | 0.12 | 0.288 | 0.07 | 0.524 | 0.09 | 0.435 | 0.112 | 0.248 | <0.0001 | 0.544 | 0.637 | 0.888 | |
| z-CFAR DD | 0.27 | 0.013 | 0.16 | 0.156 | 0.11 | 0.362 | 0.12 | 0.304 | 0.109 | 0.240 | <0.0001 | 0.542 | 0.527 | 0.943 | |
| z-CFAR IMT | −0.12 | 0.635 | 0.54 | 0.038 | 0.40 | 0.152 | 0.17 | 0.558 | <0.0001 | 0.092 | <0.0001 | 0.381 | <0.0001 | 0.439 | |
| Local and regional arterial stiffness | |||||||||||||||
| z-CFAR EM | 0.15 | 0.160 | 0.23 | 0.044 | 0.19 | 0.096 | 0.14 | 0.228 | 0.072 | 0.651 | 0.591 | 0.440 | 0.025 | 0.577 | |
| 12–24 m | Δz-BWH [1] | Δ z-BW [2] | Δ z-BH [3] | Δ z-BMI [4] | 1 vs. 2 | 1 vs. 3 | 1 vs. 4 | 2 vs. 3 | 2 vs. 4 | 3 vs. 4 | |||||
| R | p | R | p | R | p | R | p | p | p | p | P | p | P | ||
| Central and peripheral hemodynamic parameters | |||||||||||||||
| z-Cardiac Index | 0.08 | 0.264 | −0.22 | 0.001 | −0.07 | 0.321 | −0.04 | 0.557 | <0.0001 | 0.069 | 0.081 | 0.162 | <0.0001 | 0.685 | |
| Structural arterial parameters | |||||||||||||||
| z-CCAL SystD | −0.04 | 0.576 | 0.17 | 0.010 | −0.01 | 0.879 | 0.09 | 0.212 | 0.032 | 0.717 | 0.208 | 0.204 | 0.183 | 0.360 | |
| z-CCAL DD | −0.04 | 0.553 | 0.12 | 0.083 | −0.01 | 0.857 | 0.05 | 0.425 | 0.104 | 0.717 | 0.385 | 0.362 | 0.247 | 0.589 | |
| z-CFAL SystD | −0.07 | 0.325 | 0.15 | 0.029 | −0.09 | 0.175 | 0.06 | 0.360 | 0.001 | 0.808 | 0.061 | 0.012 | 0.026 | 0.044 | |
| z-CFAL DD | −0.08 | 0.220 | 0.14 | 0.043 | −0.08 | 0.221 | 0.04 | 0.523 | 0.001 | 0.990 | 0.083 | 0.021 | 0.013 | 0.107 | |
| z-CFAL IMT | 0.16 | 0.286 | 0.11 | 0.481 | 0.08 | 0.608 | 0.12 | 0.430 | 0.445 | 0.330 | 0.559 | 0.021 | 0.805 | 0.589 | |
| Zero-Order Correlations | William’s Correlation Comparisons | |||||||||||||
|---|---|---|---|---|---|---|---|---|---|---|---|---|---|---|
| 0–36 m | Δz-BWH [1] | Δz-BW [2] | Δz-BH [3] | Δz-BMI [4] | 1 vs. 2 | 1 vs. 3 | 1 vs. 4 | 2 vs. 3 | 2 vs. 4 | 3 vs. 4 | ||||
| R | p | R | p | R | p | R | P | p | p | P | P | p | P | |
| Central and peripheral hemodynamic parameters | ||||||||||||||
| z-pSBP | 0.09 | 0.177 | 0.15 | 0.032 | 0.13 | 0.076 | 0.08 | 0.253 | 0.324 | 0.660 | 0.893 | 0.713 | 0.002 | 0.499 |
| z-cSBP | 0.14 | 0.041 | 0.13 | 0.051 | 0.08 | 0.268 | 0.10 | 0.154 | 0.838 | 0.486 | 0.567 | 0.334 | 0.463 | 0.776 |
| z-cPP | 0.10 | 0.127 | 0.15 | 0.028 | 0.05 | 0.433 | 0.14 | 0.040 | 0.277 | 0.564 | 0.567 | 0.067 | 0.816 | 0.222 |
| z-Pf | 0.07 | 0.296 | 0.17 | 0.012 | 0.13 | 0.054 | 0.07 | 0.336 | 0.029 | 0.487 | 0.990 | 0.441 | 0.015 | 0.396 |
| z-Cardiac Output | 0.07 | 0.319 | 0.19 | 0.005 | 0.20 | 0.004 | 0.06 | 0.372 | 0.009 | 0.127 | 0.892 | 0.901 | 0.002 | 0.054 |
| z-Cardiac Index | −0.22 | 0.001 | −0.24 | 0.0004 | −0.10 | 0.144 | −0.13 | 0.060 | 0.671 | 0.176 | 0.212 | 0.009 | 0.009 | 0.683 |
| Structural arterial parameters | ||||||||||||||
| z- CCARight IMT | 0.12 | 0.256 | 0.22 | 0.035 | 0.20 | 0.059 | 0.17 | 0.113 | <0.0001 | 0.368 | 0.648 | 0.802 | 0.431 | 0.782 |
| z-CCALeft SystD | 0.01 | 0.830 | 0.13 | 0.070 | 0.14 | 0.039 | −0.03 | 0.641 | 0.099 | 0.342 | 0.720 | 0.891 | 0.013 | 0.125 |
| z- CCALeft IMT | 0.11 | 0.125 | 0.16 | 0.024 | 0.14 | 0.045 | 0.05 | 0.447 | 0.490 | 0.825 | 0.588 | 0.811 | 0.087 | 0.415 |
| z-CFARight IMT | 0.21 | 0.382 | 0.55 | 0.017 | 0.16 | 0.536 | 0.59 | 0.009 | 0.023 | 0.705 | 0.041 | 0.021 | 0.744 | 0.054 |
| Local and regional arterial stiffness | ||||||||||||||
| z- CFARight EM | −0.02 | 0.850 | 0.18 | 0.092 | 0.24 | 0.026 | −0.01 | 0.897 | <0.0001 | 0.004 | 0.893 | 0.262 | <0.0001 | 0.029 |
| z- CFALeft EM | −0.08 | 0.263 | −0.06 | 0.436 | 0.07 | 0.302 | −0.14 | 0.047 | 0.793 | 0.296 | 0.730 | 0.128 | 0.064 | 0.069 |
| 12–36 m | Δz-BWH [1] | Δz-BW [2] | Δz-BH [3] | Δz-BMI [4] | 1 vs. 2 | 1 vs. 3 | 1 vs. 4 | 2 vs. 3 | 2 vs. 4 | 3 vs. 4 | ||||
| Central and peripheral hemodynamic parameters | ||||||||||||||
| z-cSBP | 0.05 | 0.485 | 0.14 | 0.033 | −0.09 | 0.159 | 0.14 | 0.029 | 0.154 | 0.120 | 0.133 | 0.002 | 0.940 | 0.199 |
| z-cDBP | −0.04 | 0.528 | 0.05 | 0.471 | −0.15 | 0.023 | 0.06 | 0.393 | 0.156 | 0.033 | 0.097 | 0.002 | 0.804 | <0.0001 |
| z-AIx | 0.03 | 0.698 | −0.15 | 0.025 | 0.06 | 0.361 | −0.09 | 0.193 | 0.044 | 0.725 | 0.035 | 0.008 | 0.114 | <0.0001 |
| z-AIx@75 | 0.01 | 0.893 | −0.18 | 0.006 | 0.02 | 0.800 | −0.10 | 0.125 | 0.014 | 0.907 | 0.053 | 0.008 | 0.034 | 0.419 |
| z-AP | 0.03 | 0.604 | −0.11 | 0.082 | 0.06 | 0.355 | −0.06 | 0.350 | 0.019 | 0.725 | 0.115 | 0.004 | 0.189 | 0.001 |
| z-PF | 0.04 | 0.596 | 0.18 | 0.007 | 0.05 | 0.418 | 0.10 | 0.122 | 0.024 | 0.903 | 0.297 | 0.031 | 0.034 | 0.181 |
| z-Cardiac Index | 0.08 | 0.251 | −0.17 | 0.008 | 0.02 | 0.743 | −0.06 | 0.381 | 0.001 | 0.502 | 0.019 | 0.001 | 0.006 | 0.040 |
| Structural arterial parameters | ||||||||||||||
| z- CCARight SystD | 0.14 | 0.180 | 0.21 | 0.034 | 0.02 | 0.834 | 0.19 | 0.060 | 0.020 | 0.369 | 0.572 | 0.002 | 0.735 | 0.003 |
| z- CCARight DD | 0.16 | 0.112 | 0.20 | 0.050 | 0.03 | 0.737 | 0.19 | 0.057 | 0.662 | 0.329 | 0.734 | 0.070 | 0.866 | 0.005 |
| z- CCARight IMT | −0.09 | 0.354 | −0.24 | 0.018 | −0.02 | 0.841 | −0.15 | 0.128 | 0.106 | 0.602 | 0.501 | 0.018 | 0.089 | 0.025 |
| z- CCALeft SystD | −0.03 | 0.700 | 0.18 | 0.008 | 0.02 | 0.817 | 0.08 | 0.226 | 0.001 | 0.569 | 0.061 | 0.009 | 0.010 | 0.116 |
| z- CCALeft DD | −0.01 | 0.829 | 0.13 | 0.047 | 0.01 | 0.826 | 0.06 | 0.342 | 0.023 | 0.820 | 0.233 | 0.009 | 0.074 | 0.190 |
| z- CFALeft SystD | −0.12 | 0.075 | 0.21 | 0.002 | 0.01 | 0.866 | 0.03 | 0.679 | <0.0001 | 0.137 | 0.013 | 0.001 | <0.0001 | 0.601 |
| z- CFALeft DD | −0.13 | 0.049 | 0.19 | 0.005 | 0.01 | 0.848 | 0.01 | 0.898 | <0.0001 | 0.109 | 0.020 | 0.003 | <0.0001 | 0.915 |
| z- CFALeft IMT | 0.17 | 0.241 | 0.16 | 0.272 | 0.14 | 0.357 | 0.13 | 0.376 | 0.873 | 0.726 | 0.501 | 0.749 | 0.453 | 0.797 |
| 24–36 m | Δz-BWH [1] | Δz-BW [2] | Δz-BH [3] | Δz-BMI [4] | 1 vs. 2 | 1 vs. 3 | 1 vs. 4 | 2 vs. 3 | 2 vs. 4 | 3 vs. 4 | ||||
| R | P | R | p | R | p | R | P | p | p | P | P | p | p | |
| Central and peripheral hemodynamic parameters | ||||||||||||||
| z-cPP | 0.09 | 0.191 | 0.13 | 0.043 | 0.07 | 0.294 | 0.07 | 0.304 | 0.319 | 0.836 | 0.739 | 0.402 | 0.178 | 0.992 |
| z-AIx@75 | −0.09 | 0.186 | −0.20 | 0.002 | −0.11 | 0.107 | −0.09 | 0.194 | 0.004 | 0.835 | 0.990 | 0.192 | 0.011 | 0.836 |
| z-PF | 0.09 | 0.177 | 0.16 | 0.014 | 0.08 | 0.260 | 0.08 | 0.224 | 0.067 | 0.918 | 0.954 | 0.241 | 0.060 | 0.950 |
| z-Cardiac Output | 0.02 | 0.821 | 0.06 | 0.349 | 0.13 | 0.049 | 0.00 | 0.979 | 0.525 | 0.264 | 0.765 | 0.324 | 0.193 | 0.236 |
| Structural arterial parameters | ||||||||||||||
| z- CCARight DD | 0.13 | 0.192 | 0.21 | 0.044 | 0.06 | 0.594 | 0.13 | 0.229 | 0.196 | 0.651 | 0.990 | 0.175 | 0.244 | 0.651 |
| z- CCARight IMT | −0.23 | 0.024 | −0.25 | 0.014 | 0.01 | 0.946 | −0.21 | 0.045 | 0.743 | 0.116 | 0.826 | 0.018 | 0.555 | 0.153 |
| Dependent Variable | Independent Variables | βu | SE | βs | P | Adj R2 |
|---|---|---|---|---|---|---|
| Δz-BMI (0–6 m) included as an independent variable | ||||||
| z-CFALeft EM | Constant | 0.088 | 0.081 | 0.278 | 0.031 | |
| Δz-BMI 0–6 m* z-BMI | −0.072 | 0.031 | −0.194 | 0.023 | ||
| z-cfPWV | Constant | −0.076 | 0.100 | 0.448 | 0.041 | |
| Hypertension | 1.333 | 0.542 | 0.223 | 0.015 | ||
| Δz-BW (0–12 m) included as an independent variable | ||||||
| z-CCARight IMT | Constant | −0.830 | Lo | 0.496 | 0.131 | |
| Δz-BW 0–12 m | 0.317 | 0.085 | 0.376 | <0.001 | ||
| z-CFARight SystD | Constant | −0.126 | 0.149 | 0.401 | 0.142 | |
| z-BMI | 0.395 | 0.110 | 0.384 | 0.010 | ||
| z-BWH at birth | −0.241 | 0.111 | −0.233 | 0.033 | ||
| z-CFARight DD | Constant | −0.114 | 0.148 | 0.443 | 0.135 | |
| z-BMI | 0.376 | 0.110 | 0.369 | 0.001 | ||
| z-BWH at birth | −0.248 | 0.111 | −0.241 | 0.028 | ||
| z-CFALeft SystD | Constant | −0.174 | 0.112 | 0.121 | 0.055 | |
| z-BMI | 0.236 | 0.079 | 0.267 | 0.030 | ||
| Δz-BW 0–12 m * z-BMI | −0.077 | 0.360 | −0.187 | 0.038 | ||
| z-CFALeft DD | Constant | −0.145 | 0.110 | 0.190 | 0.051 | |
| z-BMI | 0.220 | 0.078 | 0.254 | 0.005 | ||
| Δz-BW 0–12 m* z-BMI | −0.078 | 0.036 | −0.193 | 0.032 | ||
| Δz-BWH (0–12 m) included as an independent variable | ||||||
| z-AIx | Constant | −0.990 | 0.068 | 0.149 | 0.140 | |
| z-pSBP | −0.289 | 0.059 | −0.320 | <0.001 | ||
| Δz-BWH 0–12 m | −0.133 | 0.045 | −0.193 | 0.004 | ||
| z-AIx@75 | Constant | −0.062 | 0.069 | 0.366 | 0.109 | |
| z-pSBP | −0.257 | 0.061 | −0.289 | <0.001 | ||
| Δz-BWH 0–12 m | −0.113 | 0.047 | −0.166 | 0.017 | ||
| z-CFALeft SystD | Constant | −0.142 | 0.108 | 0.192 | 0.067 | |
| z-BMI | 0.193 | 0.070 | 0.219 | 0.007 | ||
| Δz-BWH 0–12 m* z-pSBP | −0.118 | 0.048 | −0.195 | 0.016 | ||
| z-CFALeft DD | Constant | −0.107 | 0.107 | 0.317 | 0.067 | |
| z-BMI | 0.170 | 0.069 | 0.196 | 0.007 | ||
| Δz-BWH 0–12 m* z-pSBP | −0.130 | 0.048 | −0.218 | 0.015 | ||
| Δz-BW (0–24 m) included as an independent variable | ||||||
| z-CCARight IMT | Constant | −0.230 | 0.128 | 0.855 | 0.143 | |
| Δz-BW 0–24 m | 0.366 | 0.098 | 0.393 | <0.001 | ||
| z-CCALeftSystD | Constant | −0.173 | 0.096 | 0.070 | 0.144 | |
| z-BMI | 0.228 | 0.062 | 0.305 | <0.001 | ||
| Δz-BW 0–24 m | 0.136 | 0.064 | 0.177 | 0.035 | ||
| z-CCALeft DD | Constant | −0.152 | 0.098 | 0.121 | 0.118 | |
| z-BMI | 0.267 | 0.061 | 0.353 | <0.001 | ||
| z-CCA Left IMT | Constant | 0.000 | 0.100 | 0.998 | 0.051 | |
| Δz-BW 0–24 m | 0.230 | 0.080 | 0.241 | 0.005 | ||
| Δz-BWH (0–24 m) included as an independent variable | ||||||
| z-CCARight IMT | Constant | −0.030 | 0.129 | 0.815 | 0.145 | |
| Δz-BWH 0–24 m | 0.368 | 0.098 | 0.395 | 0.001 | ||
| z-CFARightSystD | Constant | −0.104 | 0.150 | 0.493 | 0.167 | |
| z-BMI | 0.400 | 0.108 | 0.409 | 0.001 | ||
| z-BWH at birth | −0.258 | 0.111 | −0.258 | 0.023 | ||
| z-CFARight DD | Constant | −0.181 | 0.144 | 0.213 | 0.213 | |
| Δz-BWH 0–24 m | 0.219 | 0.100 | 0.240 | 0.031 | ||
| z-BMI | 0.320 | 0.106 | 0.329 | 0.004 | ||
| Δz-BWH 0–24 m* z-pSBP | −0.202 | 0.087 | −0.251 | 0.024 | ||
| Δz-BW (12–24 m) included as an independent variable | ||||||
| z-CCALeftSystD | Constant | 0.168 | 0.095 | 0.081 | 0.120 | |
| z-BMI | 0.268 | 0.059 | 0.355 | 0.001 | ||
| z-CCALeft DD | Constant | −0.151 | 0.097 | 0.122 | 0.118 | |
| z-BMI | 0.270 | 0.060 | 0.352 | 0.001 | ||
| z-CFALeftSystD | Constant | −0.118 | 0.114 | 0.299 | 0.036 | |
| z-BMI | 0.178 | 0.072 | 0.208 | 0.014 | ||
| z-CFALeft DD | Constant | −0.082 | 0.113 | 0.469 | 0.025 | |
| z-BMI | 0.151 | 0.071 | 0.179 | 0.036 | ||
| Dependent Variable | Independent Variables | βu | SE | βs | P | Adj R2 |
|---|---|---|---|---|---|---|
| Δz-BW (0–36 m): included as an independent variable | ||||||
| z-pSBP | Constant | −0.125 | 0.094 | 0.189 | 0.127 | |
| z-BMI | 0.201 | 0.065 | 0.227 | 0.020 | ||
| Hypertension | 0.944 | 0.359 | 0.177 | 0.009 | ||
| Δz-BW 0–36 m | 0.169 | 0.068 | 0.183 | 0.013 | ||
| z-cSBP | Constant | −0.130 | 0.090 | 0.150 | 0.078 | |
| z-BMI | 0.216 | 0.056 | 0.272 | <0.001 | ||
| Hypertension | 0.712 | 0.333 | 0.151 | 0.034 | ||
| z-cPP | Constant | 0.041 | 0.075 | 0.586 | 0.021 | |
| Δz-BW 0–36 m* z-pSBP | 0.101 | 0.045 | 0.161 | 0.027 | ||
| z-Pf | Constant | 0.052 | 0.077 | 0.500 | 0.048 | |
| Δz-BW 0–36 m | 0.198 | 0.062 | 0.230 | 0.020 | ||
| z-CI | Constant | 0.082 | 0.181 | 0.666 | 0.680 | |
| Δz-BW 0–36 m* z-pSBP | −0.444 | 0.111 | −0.852 | 0.070 | ||
| z-CCARight IMT | Constant | −0.026 | 0.122 | 0.834 | 0.089 | |
| Δz-BW 0–36 m | 0.312 | 0.103 | 0.315 | 0.030 | ||
| z-CCALeft SystD | Constant | −0.125 | 0.093 | 0.178 | 0.112 | |
| z-BMI | 0.261 | 0.060 | 0.344 | <0.001 | ||
| z-CCALeft IMT | Constant | −0.003 | 0.096 | 0.976 | 0.047 | |
| Δz-BW 0–36 m | 0.227 | 0.080 | 0.231 | 0.050 | ||
| Δz-BW (12–36 m): included as an independent variable | ||||||
| z-cSBP | Constant | −0.070 | 0.052 | 0.887 | 0.512 | |
| z-pSBP | 0.641 | 0.045 | 0.717 | <0.001 | ||
| z-AIx | Constant | −0.124 | 0.070 | 0.078 | 0.124 | |
| z-pSBP | −0.299 | 0.060 | 0.336 | <0.001 | ||
| Δz-BW 12–36 m* z-BWH at birth | −0.109 | 0.051 | −0.145 | 0.033 | ||
| z-AIx@75 | Constant | −0.119 | −0.074 | 0.108 | 0.109 | |
| z-pSBP | −0.242 | −0.063 | −0.271 | <0.001 | ||
| Δz-BW 12–36 m | −0.169 | −0.068 | −0.176 | 0.013 | ||
| z-AP | Constant | −0.130 | 0.073 | 0.076 | 0.087 | |
| z-pSBP | −0.224 | 0.062 | −0.247 | <0.001 | ||
| Δz-BW 12–36 m* z-BWH at birth | −0.146 | 0.053 | −0.191 | 0.060 | ||
| z-Pf | Constant | 0.135 | 0.072 | 0.062 | 0.188 | |
| z-pSBP | 0.353 | 0.060 | 0.391 | <0.001 | ||
| Δz-BW 12–36 m | 0.155 | 0.065 | 0.158 | 0.018 | ||
| z-CI | Constant | −0.702 | 0.224 | 0.017 | 0.451 | |
| Δz-BW 12–36 m | −0.579 | 0.210 | −0.721 | 0.028 | ||
| z-CCA Right SystD | Constant | −0.111 | 0.113 | 0.328 | 0.195 | |
| z-BMI | 0.314 | 0.079 | 0.399 | <0.001 | ||
| Δz-BW 12–36 m | 0.260 | 0.091 | 0.277 | 0.005 | ||
| z-pSBP | −0.175 | 0.081 | −0.215 | 0.035 | ||
| z-CCARightDD | Constant | −0.099 | 0.115 | 0.393 | 0.174 | |
| z-BMI | 0.305 | 0.080 | 0.387 | <0.001 | ||
| Δz-BW 12–36 m | 0.236 | 0.092 | 0.250 | 0.012 | ||
| z-pSBP | −0.175 | 0.082 | −0.215 | 0.037 | ||
| z-CCARight IMT | Constant | 0.022 | 0.110 | 0.842 | 0.197 | |
| Δz-BW 12–36 m* z-pSBP | −0.409 | 0.085 | −0.565 | <0.001 | ||
| z-pSBP | −0.276 | 0.118 | −0.274 | 0.022 | ||
| z-CCALeft SystD | Constant | −0.13 | 0.09 | 0.160 | 0.113 | |
| z-BMI | 0.26 | 0.06 | 0.35 | <0.001 | ||
| z-CCALeft DD | Constant | −0.114 | 0.094 | 0.227 | 0.110 | |
| z-BMI | 0.262 | 0.060 | 0.341 | <0.001 | ||
| z-CFALeft SystD | Constant | 0.111 | 0.089 | 0.213 | 0.067 | |
| Δz-BW 12–36 m | 0.285 | 0.085 | 0.271 | 0.010 | ||
| z-CFALeft DD | Constant | 0.107 | 0.088 | 0.225 | 0.048 | |
| Δz-BW 12–36 m | 0.242 | 0.085 | 0.234 | 0.005 | ||
| Δz-BW (24–36 m): included as an independent variable | ||||||
| z-cPP | Constant | 0.052 | 0.067 | 0.441 | 0.121 | |
| z-pSBP | 0.296 | 0.057 | 0.354 | 0.001 | ||
| z-AIx@75 | Constant | −0.098 | 0.070 | 0.165 | 0.126 | |
| z-pSBP | −0.306 | 0.060 | −0.346 | 0.001 | ||
| Δz-BW 24–36 m* z-BWH at birth | −0.202 | 0.097 | −0.141 | 0.040 | ||
| z-Pf | Constant | 0.089 | 0.068 | 0.192 | 0.186 | |
| z-pSBP | 0.362 | 0.059 | 0.408 | 0.001 | ||
| Δz-BW 24–36 m | 0.233 | 0.106 | 0.145 | 0.030 | ||
| z-CCARight DD | Constant | −0.087 | 0.122 | 0.481 | 0.129 | |
| z-BMI | 0.223 | 0.083 | 0.283 | 0.009 | ||
| Δz-BW 24–36 m | 0.337 | 0.158 | 0.224 | 0.036 | ||
| z-CCARight IMT | Constant | −0.028 | 0.125 | 0.821 | 0.083 | |
| Δz-BW 24–36 m* z-pSBP | −0.394 | 0.136 | −0.308 | 0.005 | ||
Publisher’s Note: MDPI stays neutral with regard to jurisdictional claims in published maps and institutional affiliations. |
© 2021 by the authors. Licensee MDPI, Basel, Switzerland. This article is an open access article distributed under the terms and conditions of the Creative Commons Attribution (CC BY) license (http://creativecommons.org/licenses/by/4.0/).
Share and Cite
Castro, J.M.; Marin, M.; Zinoveev, A.; García-Espinosa, V.; Chiesa, P.; Bia, D.; Zócalo, Y. Changes in Body Size during Early Growth Are Independently Associated with Arterial Properties in Early Childhood. J. Cardiovasc. Dev. Dis. 2021, 8, 20. https://0-doi-org.brum.beds.ac.uk/10.3390/jcdd8020020
Castro JM, Marin M, Zinoveev A, García-Espinosa V, Chiesa P, Bia D, Zócalo Y. Changes in Body Size during Early Growth Are Independently Associated with Arterial Properties in Early Childhood. Journal of Cardiovascular Development and Disease. 2021; 8(2):20. https://0-doi-org.brum.beds.ac.uk/10.3390/jcdd8020020
Chicago/Turabian StyleCastro, Juan M., Mariana Marin, Agustina Zinoveev, Victoria García-Espinosa, Pedro Chiesa, Daniel Bia, and Yanina Zócalo. 2021. "Changes in Body Size during Early Growth Are Independently Associated with Arterial Properties in Early Childhood" Journal of Cardiovascular Development and Disease 8, no. 2: 20. https://0-doi-org.brum.beds.ac.uk/10.3390/jcdd8020020